Wyoming State Water Plan
Wyoming State Water Plan
Wyoming Water Development Office
6920 Yellowtail Rd
Cheyenne, WY 82002
Phone: 307-777-7626

Wyoming Water Development Office
6920 Yellowtail Rd
Cheyenne, WY 82002
Phone: 307-777-7626


For assessing the need for water into the future, this plan has developed estimates of water demand for each major use category out to year 2030. These estimates are discussed in detail in technical memoranda for each topic.
As with all chapters in this final plan report, explicit lists of references are not provided. Instead, all references to report, documents, maps, and personal communications are maintained in the Technical Memoranda that were prepared during the current planning process. Should the reader desire to review a complete list of references for the information presented in this chapter, the following memoranda should be consulted:
Background
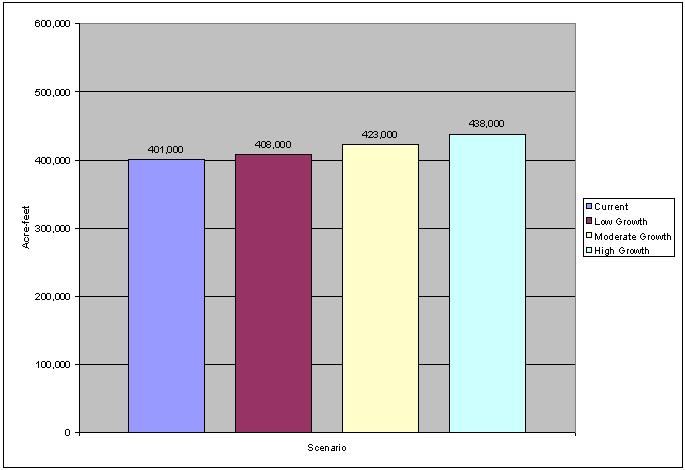
Irrigated agricultural production is the largest user of water in the Green River Basin. Currently, Basin irrigators consumptively use an estimated 401,000 acre-feet of water in an average year. This figure will rise to 408,000 acre-feet when High Savery Reservoir in the Little Snake Basin is completed. Irrigation water consumption varies considerably from year to year, however, depending upon water availability, rainfall, and other climatic conditions. In a typical dry year, Basin-wide irrigation water consumption drops to about 375,000 acre-feet. In a typical wet year, consumption rises to about 432,000 acre-feet annually.
The Wyoming Water Planning Program (WWPP) estimated that there were about 330,000 acres of land under irrigation in the Basin in 1970. The estimate of irrigated acreage developed for this study (330,408 acres) is very nearly identical.
The vast majority of irrigated land is devoted to the production of forage crops (alfalfa, grass hay, and irrigated pasture) in support of livestock operations. Small amounts of grain are grown on irrigated acreage along the Blacks Fork and Smiths Fork Rivers, the lower Little Snake Basin, and in the Eden Valley area, but the percentages of irrigated land devoted to grain production in these areas are less than three percent.
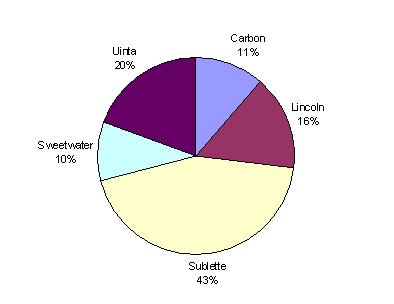
Not all of the acres of irrigated land in the Basin is mechanically harvested each year. Some land is devoted to irrigated pasture while other land is only irrigated on an intermittent basis. Figure IV-1 shows estimates of harvested forage acreage in the Basin for the period from 1979 through 1999 as developed by the Wyoming Agricultural Statistics Service. That figure shows that the number of acres of forage crops harvested each year varies from a low of slightly under 250,000 acres to a high of over 300,000. The distribution of harvested forage acreage by county is depicted in Figure IV-2. That figure shows that Sublette County is the largest forage producer in the Basin, producing over 40 percent of all forage harvested during the period from 1979 through 1999. Uinta County is the second largest producer with 20 percent of the total, followed by Lincoln, Carbon, and Sweetwater counties in that order.
Almost all irrigated lands in the Basin are served by surface water sources. Although there are a number of reservoirs in the Basin that store irrigation water, the availability of storage varies widely across the Basin, and agricultural production in some parts of the Basin is limited by inadequate or non-existent storage facilities. The Eden-Farson area and the New Fork River valley have the largest ratio of storage to irrigated acreage in the Basin (see Chapter II). The lack of storage is most notable on tributaries entering the Green River from the west above Fontenelle Reservoir (hereafter referred as the northwest tributaries). Only three small private reservoirs currently providing irrigation water are located in this part of the Basin, and over 80,000 acres of irrigated lands suffer from late season and dry year irrigation water shortages.
Figure IV-1 Total Green River Basin Forage Harvest (1979-1999)
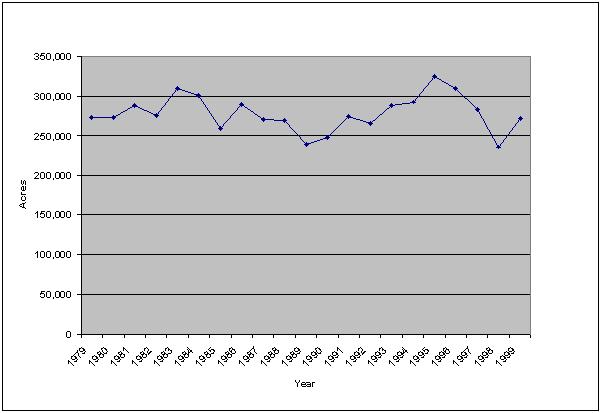
Figure IV-2 Distribution of Basin Forage Harvest by County (1979-1999 Average)
Trends in Livestock Production
Over the past two decades livestock production (cattle and sheep) in the Basin has remained relatively constant. There appear to be several interrelated reasons why this has occurred. One limiting factor with respect to herd size is the availability of summer range on federal lands, which constitute a large proportion of rangeland in the Basin. Both the U.S. Forest Service (USFS) and the Bureau of Land Management (BLM) have become more conservative in recent years with respect to the management of federal grazing allotments in an attempt to improve the quality of the range and provide adequate forage for wildlife. There has been little opportunity for producers with federal grazing allotments to increase their production on federal lands in recent years, and in some cases federal grazing rights have been restricted.
The only alternative available for increased livestock production in the Basin in recent years has been more intensive use and management of private lands, which necessitates either increasing forage production on existing irrigated acreage or bringing new acreage into production. Bringing new irrigated acreage into production is a capital-intensive process that has not been financially feasible for most producers. There has been some increase in forage production on existing irrigated lands through more use of fertilizer and better water management practices.
Future Water Needs and Demands
In discussing the future of irrigation in the Green River Basin, it is necessary to distinguish between needs and demands for irrigation water. A need for additional irrigation water is an identifiable current or future use that would enhance the economic well being of the irrigator and/or the economy of the Basin as a whole. Demands are distinguished from needs by the fact that they are measured in relationship to price. To give a simple example, an irrigator may need additional irrigation water in a dry year to grow enough hay to provide winter feed for his cattle. If additional water costs $500 per acre-foot, however, the irrigators demand for additional water would probably be zero because it would be more cost-effective either to buy additional forage from other producers or reduce the size of his herd.
In analyzing municipal and industrial water uses, needs and demands are often viewed interchangeably. The cost of water is usually a relatively minor part of the costs involved in water intensive manufacturing processes such as electric power production and soda ash production. As a result, it can be assumed that manufacturers and municipalities will demand the water needed to expand production over a reasonable range of prices. That convention was used for projecting municipal and industrial demands in this planning study.
Irrigated agriculture, however, is an industry in which producers are very sensitive to the price of water, and their demands for water can change dramatically as a function of price. Meetings with irrigators in the Basin and discussions with agricultural industry professionals indicate that there are several reasons why more water is needed now or may be needed in the future for irrigated crop production. One pressing current need is for storage water to meet late season and dry year crop requirements in those parts of the Basin where storage is not available or is inadequate to fully meet irrigation requirements. Additional storage would also allow more producers to adjust more readily to potential future changes in the management of federal grazing allotments.
The biggest practical problem associated with fulfilling the need for additional irrigation water in the Basin is that the returns from forage production in recent decades have not been sufficient to offset the costs of new water storage projects. Studies of irrigation water returns in the Little Snake Drainage and in other parts of Wyoming indicate that one acre-foot of irrigation water used for forage production in relatively high altitude areas of the State can be expected to generate a $15 to $25 increase in net farm income. The cost of developing new storage can be significantly higher than that figure even under very favorable circumstances.
Future demands for additional irrigation water in the Green River Basin are thus largely dependent upon factors that might either increase the returns that Basin irrigators receive from irrigation or reduce the cost to them of developing new storage. Possibilities for increasing economic returns to irrigated agriculture in the Basin include diversifying cropping patterns into higher valued crops, hay prices increasing to the point that it would be profitable to export hay from the Basin to other domestic markets, and/or cattle/sheep prices rising significantly over the next 30 years.
Although there are some opportunities for diversifying cropping patterns in the Basin, it is doubtful that diversification out of forage production will occur on a wide enough scale over the next thirty years to warrant significant new water development projects. Most of the Basin above Fontenelle Reservoir is characterized by high elevations, cool nights, and a short growing season, making forage crops the only practical alternative. Grains can be grown in some parts of the Basin. Malting barley is the only grain crop with significantly higher returns than alfalfa, however, and is typically grown in rotation with alfalfa in relatively small quantities.
Specialty crops, such as alfalfa seed or seed potatoes, could possibly be grown in some of the lower elevation areas of the Basin. Seed alfalfa production is moving into Wyoming.s Big Horn Basin, where acreage has grown from 2,000 to 15,000 acres in recent years. Nevertheless, the Green River Basin will always have a competitive disadvantage with respect to specialty crops compared to lower elevation areas such as Wyoming.s Big Horn Basin or lower North Platte River Basin.
Some trends in the agricultural industry in the western U.S. suggest that certain types of forage production will become more valuable in the future as cash crops. As more agricultural land is taken from production in the future, there will be less hay production because it is among the lower valued crops that can be grown in lower elevation areas.
Wyoming is currently a net exporter of alfalfa and Timothy grass hay. No official statistics are available on the magnitude of hay exports from Wyoming, but some experts put the figure at about 25 percent, and expect that percentage to increase in the future. The largest market for Wyoming hay is now Colorado, but some producers in the Big Horn Basin are shipping hay by rail to dairies as far away as Florida and other east coast states. The Green River Basin is in an ideal location for hay production as a cash crop for several reasons. First, producers have ready access to rail and truck shipping facilities along I-80 and the Union Pacific rail line through the southern part of the Basin. Second, the Basin is capable of producing high quality, low fiber content hay.
The types of hay expected to be in high demand in the future are alfalfa for dairies and Timothy hay for horses. Although alfalfa prices have been somewhat depressed in recent years, that trend is expected to reverse in the future as more land is taken out of production in fast-growing western states. Timothy hay is already bringing prices as high as $180 per ton in some parts of Wyoming. Alfalfa hay can be grown in lower elevation areas of the Basin, and Timothy hay can be grown in higher elevation areas. If future market prices for these crops stabilize at levels of well over $100 per ton, it may become practical for Green River Basin producers to develop additional storage and expand production of these crops for export markets.
Two other events could translate into more demand for irrigation water in the Basin over the next 30 years: A significant and long-term increase in cattle prices and/or an increase in the amount of financial assistance available to producers for reservoir construction from State and federal agencies.
Cattle prices have increased somewhat in recent years as per capita beef consumption in the U.S. has stabilized at around 67 pounds after many years of decline. But according to the Cattleman.s Beef Production and Research Board, per-capita consumption is not expected to increase in the future and will most likely decrease from today.s levels. The USDA, however, is forecasting a significant increase in exports of U.S. beef over the next 10 years. The basis of this projection is the fact that demand for high quality beef in Pacific Rim nations is expected to increase significantly in the future as the economies of these countries recover from the 1998 financial crisis that affected the region.
The prospects for increased federal assistance for reservoir construction seem more remote than the projected increase in cattle prices. Federal assistance for agriculture and new reservoir construction has been declining in recent years, and there are no indications that this situation will change over the planning horizon. The WWDC also has tightened its funding criteria for new water project construction in recent years. This tightening has been primarily motivated by budget constraints, however, and the possibility exists that more state funds may be allocated to water development over the next 30 years than are available under current economic conditions.
For the reasons discussed above, the low, moderate, and high growth scenarios for future irrigation water demand in the Basin are based upon varying assumptions concerning the financial returns from beef and forage production and the availability of WWDC assistance for new project construction.
Low Growth Scenario
The low growth scenario is based upon the assumptions that irrigation in the Basin will continue to be dominated by forage production for winter livestock feed and that cattle and forage prices will not make sustained increases over the next 30 years relative to reservoir construction costs. This scenario also projects no increase in state funding available for new project construction and no change in WWDC criteria for financial assistance to project sponsors. As a result, irrigators will probably be unwilling to make long-term financial commitments to develop new storage following WWDC funding guidelines. Numerically, total consumptive water use for irrigation in the Basin is expected to remain relatively constant at 408,000 acre-feet in an average year for this scenario.
Moderate Growth Scenario
The moderate growth scenario is based upon the reasonably foreseeable possibility that cattle prices will increase significantly over the next 10 years as forecast by the USDA in response to increased demand for high quality beef in Pacific Rim markets. Cattle prices are projected to stabilize at these higher prices over the planning horizon. This scenario also assumes that the WWDC will increase its financial commitment to new storage projects.
The combination of higher cattle prices and increased WWDC assistance will allow irrigators to develop and fund some new storage projects in those parts of the Basin that are in the greatest need. A logical place for such developments to take place is along northwest tributaries of the Upper Green River, including Cottonwood Creek, Fontenelle Creek, Horse Creek, LaBarge Creek, and Piney Creek. This area has less storage per irrigated acre than any other part of the Basin, and irrigators market almost all of their hay through cattle. Reservoirs with 25,000 acre-feet of storage in this area would increase irrigation depletions in the Basin by 8,000 to 12,000 acre-feet annually.
In addition to new developments along the northwest tributaries, the Little Snake River Conservation District and private landowners in the Little Snake Drainage hope to bring some additional acreage into agricultural production in the future. If fully developed, these projects would result in a total irrigation depletion increase of about 10,000 acre-feet annually. For purposes of projecting future water use under the moderate growth scenario, it was assumed that 50 percent of the Little Snake projects would be developed over the 30-year planning horizon, with annual depletions of 5,000 acre-feet. Adding these depletion increases to those along the northwest tributaries yields a Basin-wide average annual irrigation depletion estimate of 421,000 to 425,000 acre-feet by the year 2030 under the moderate growth scenario.
High Growth Scenario
The high growth scenario is based not only upon the reasonably foreseeable possibility that cattle prices will increase over the planning horizon, but that reductions in forage production in high growth areas of the west will drive forage prices high enough to encourage Basin irrigators to produce alfalfa and Timothy hay as cash crops.
If forage prices stabilize at higher levels and WWDC funding is increased in the future, additional storage could be developed in the Basin to support increased forage production as a cash crop. The amount of additional storage that would be developed and the amount of additional water that would be consumptively used under this scenario are difficult to estimate because the outcome depends not only upon future financial returns to forage and beef production, but also upon the cost of developing additional storage in those areas where unappropriated water is available.
The preliminary water use projections for this scenario are that an additional 26,000 to 34,000 acre-feet of irrigation water will be consumptively used annually relative to the low growth scenario, bringing average annual consumptive use by Basin irrigators to 434,000 to 442,000 acre-feet annually. An increase of 8,000 to 12,000 acre-feet annually is associated with new storage projects along the northwest tributaries as described under the moderate growth scenario. Another 10,000 acre-feet of increased consumptive use are associated with future projects identified by the Little Snake River Water Conservation District. The remaining 8,000 to 12,000 acre-feet of new consumptive use is projected to occur in other parts of the Basin as cost-effective sites are identified during site-specific studies associated with an ongoing water planning process in the Basin.
For purposes of comparing the moderate and high scenarios above, midpoints in the projected ranges were used. These midpoints are 423,000 and 438,000 acre-feet per year respectively. All future agricultural use scenarios are shown on Figure IV-3.
Figure IV-3 Summary of Consumptive Irrigation Water Use Projections
Municipal and domestic use projections are created by combining current per capita use rates with population projections for the Green River Basin. Current municipal and domestic consumption was described in Chapter II.
Population Projections
This section presents population projections for the Green River Basin and its communities and rural areas for the time period from 2000 through 2030 for low, moderate and high growth planning scenarios. The projections also provide a basis for assessing water-based recreational resource needs.
Current Population Estimates
The first step in developing population projections for the Basin was to estimate its current population. Estimates are necessary because the results of the 2000 census are not available as of the date of this report. Furthermore, it would be useful to have a consistent data source for the current population of all river basins in the State, and the results of the 2000 census may not be current when other basin plans are developed.
The Division of Economic Analysis of the Wyoming Department of Administration and Information (WDAI) produces estimates of the population of Wyoming.s counties, cities, and towns on an annual basis, and projects those estimates 10 years into the future. The WDAI forecasts for the year 2000 were used as current population estimates for this report and could be used to develop comparable current population baselines in other basins.
Because the geographical boundaries of the Green River Basin do not adhere to county lines, it was necessary to adjust the WDAI county population estimates to reflect only the proportion of each county that lies within the Basin.s boundaries. The only exceptions to this adjustment involve Fremont and Teton Counties, each of which have a very small portion of rural land in the Basin. In both cases, these lands are in remote, lightly populated areas. As a result, a decision was made to exclude Fremont and Teton Counties from the Basin population projections.
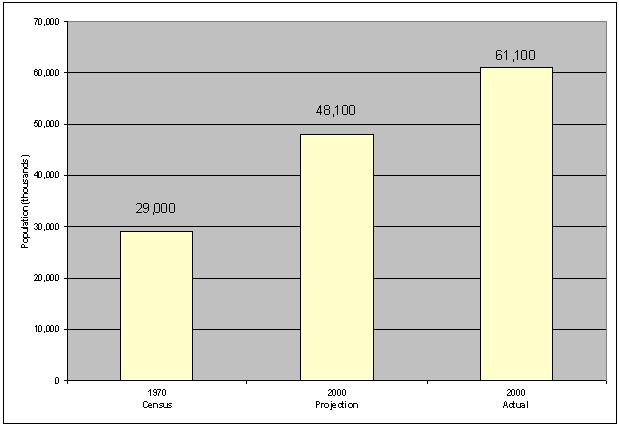
Based upon this work, the total current population of Wyoming.s Green River Basin is estimated to be 61,100 persons. This estimate represents an increase of 111 percent over the 1970 total of approximately 29,000 persons. Figure IV-4 shows these population totals along with a population forecast for the year 2000 taken from Water Planning Report No. 3, the 1970 water planning document for the Basin. That forecast is 48,100 persons, or 21 percent lower than the current estimate for the Basin. The forecast from Water Planning Report No. 3 apparently did not anticipate the extent of population growth that resulted from energy and mineral development in the Basin during the 1970s and early 1980s.
Figure IV-4 Actual and Projected Population
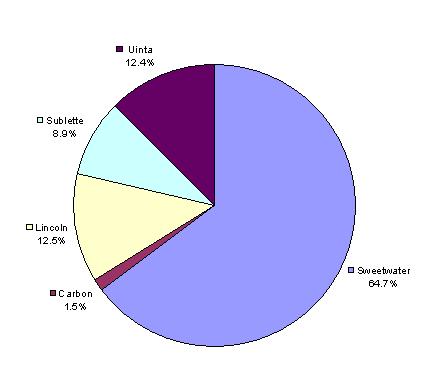
The geographical distribution of the Basin.s current population by county is depicted in Figure IV-5. That figure shows that almost two-thirds of the Basin.s current population (64.7 percent) resides in Sweetwater County. Lincoln, Sublette, and Uinta Counties each have between 8 and 13 percent of the Basin.s population, while Carbon County has only 1.5 percent. The relatively large population concentration in Sweetwater County is attributable to the fact that it contains the two largest communities in the Basin, Rock Springs and Green River. These two cities, with a combined population of about 32,500, account for 53 percent of the Basin.s current population.
Figure IV-5 Distribution of Current Population by County
Extended WDAI Population Projections
The Division of Economic Analysis of the WDAI produces population forecasts for Wyoming counties, cities, and towns. The county population forecasts are based upon time series data from which growth rates are derived from variables such as population, sales tax collections, and school enrollments. These growth rates are used to forecast individual county population totals, and these county totals are adjusted to make them consistent with state-level population forecasts that incorporate elements of the cohort survival and employment-driven approaches.
The Division of Economic Analysis forecasts population only 10 or fewer years into the future because of the uncertainties associated with such projections. Its most recent projections are through the year 2008 and are relatively conservative, a reflection of the relatively slow economic growth that the Basin and many other parts of the State have witnessed in recent years. A reasonable set of low growth rate population projections for the Green River Basin can be derived by computing the WDAI.s average annual population growth rates for Green River Basin communities and rural areas for the period from 1990 through 2008 and extending those growth rates through the year 2030.
Allocation of U.S. Census Bureau (USCB) Projections
The USCB periodically produces population forecasts for each of the 50 states using the cohort survival approach. The most recent forecasts for the State of Wyoming are two sets of population projections through the year 2025, the Series A and Series B forecasts.
Both series of projections indicate moderate future population growth for Wyoming based upon migration patterns in the early 1990s. During that period, there was a moderate influx of new residents into some parts of Wyoming from elsewhere in the country. The effects of this migration pattern are apparent in parts of the Green River Basin, including the Pinedale area. The USCB projections are based upon the assumption that this moderate rate of net in-migration will continue into the future.
Historical Growth Projections
A third set of Green River Basin population projections was created by assuming that the area would experience a total population increase during the period from 2000 to 2030 that is of the same magnitude that occurred during the 30-year period from 1960 to 1990. Although the possibility of the Basin experiencing a return to the boom conditions of the 1970s seems remote under present circumstances, the assumption that it might happen is a reasonable basis for a high growth scenario for population forecasting.
Low, Moderate, and High Growth Projections
The three methods described above were used to generate population forecasts through the year 2030 for each community and rural area in the Basin. Generally, the WDAI extended forecasts resulted in the smallest forecast for each community and rural area. The allocated USCB forecasts were generally middle of the road, and the historical growth projections generally produced the largest forecasts. There were some exceptions to these generalities, however. For example, Sublette County.s population did not grow much during the period from 1960 to 1990 relative to other parts of the Basin. As a result, the historical growth scenario did not correspond to a reasonable high growth scenario for communities in Sublette County. On the other hand, the extended WDAI forecasts showed significantly faster population growth in Sublette County through the year 2030 than in other parts of the Basin.
To adjust for these anomalies, the high growth scenario for each community and rural area in the Basin was defined as the largest population forecast for 2030 produced by any of the three methods. Similarly, the low growth scenario was defined as the lowest 2030 population forecast, and the moderate growth scenario was defined as the middle 2030 population forecast.
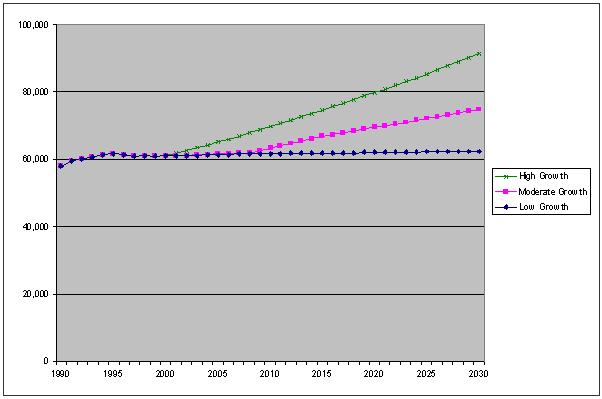
The results of the low, moderate, and high growth projections for the entire Basin are depicted graphically in Figure IV-6.
Figure IV-6 Low, Moderate, and High Growth Population Projections
Municipal Use Projections
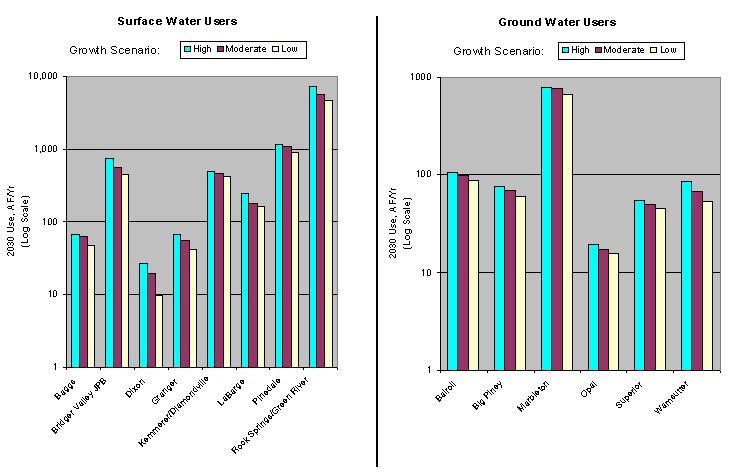
Per capita use rates for current municipal water consumption were presented in Chapter II. These rates were applied to population projections to estimate future municipal use. Table IV-1 presents the results of this calculation for the low, moderate and high growth rate scenarios. Figure IV-7 shows the municipal use projections in bar chart form. It should be noted that in some cases there is a small difference between current populations shown for municipalities in the Population Projections technical memorandum as compared to the Municipal Use technical memorandum. This difference is due to pure population estimates (given in the former) versus .service area. populations for municipal water service (from the latter). For projected municipal use calculations, the service area population was used with projections made using the projected percent increases for that municipality for each scenario from the Population Projections memo.
Not shown in these projections are future diversions from the upper Little Snake River Basin by the City of Cheyenne. These diversions are expected to peak at 22,700 acre-feet per year based on the system capacity and water rights currently held for this water system.
Table IV-1 Municipal Use Projections
| City/Town | Current Population | Current Use, gpcpd | 2030 Population Projections, by Scenario | 2030 Use, by Scenario, gpd | 2030 Use, by Scenario, AF/Yr | Low | Moderate | High | Low | Moderate | High | Low | Moderate | High |
| Surface Water Users | |||||||||||
| Baggs | 300 | 157 | 270 | 353 | 388 | 42,437 | 55,484 | 60,900 | 47.54 | 62.15 | 68.22 |
| Bridger Valley JPB | 4,500 | 86 | 4,698 | 5,684 | 7,641 | 404,028 | 488,781 | 657,126 | 452.60 | 547.54 | 736.13 |
| Dixon | 75 | 274 | 32 | 64 | 87 | 8,713 | 17,447 | 23,961 | 9.76 | 19.54 | 26.84 |
| Granger | 170 | 294 | 125 | 166 | 205 | 36,735 | 48,731 | 60,176 | 41.15 | 54.59 | 67.41 |
| Kemmerer/Diamondville | 3,950 | 80 | 4,689 | 5,080 | 5,449 | 375,092 | 406,376 | 435,922 | 420.19 | 455.23 | 488.33 |
| LaBarge | 490 | 251 | 576 | 630 | 872 | 144,513 | 158,042 | 218,922 | 161.89 | 177.04 | 245.24 |
| Pinedale | 1,480 | 474 | 1,714 | 2,019 | 2,152 | 812,360 | 956,873 | 1,020,010 | 910.02 | 1,071.91 | 1,142.64 |
| Rock Springs/Green River | 36,500 | 115 | 35,588 | 44,019 | 56,612 | 4,092,563 | 5,062,185 | 6,510,323 | 4,584.57 | 5,670.76 | 7,292.99 |
| TOTAL | 47,465 | 47,691 | 58,013 | 73,406 | 5,916,442 | 7,193,919 | 8,987,340 | 6,628 | 8,059 | 10,068 | |
| Ground Water Users | |||||||||||
| Bairoil | 250 | 314 | 250 | 280 | 302 | 78,500 | 87,920 | 94,828 | 87.94 | 98.49 | 106.23 |
| Big Piney | 496 | 90 | 590 | 679 | 745 | 53,100 | 61,110 | 67,050 | 59.48 | 68.46 | 75.11 |
| Marbleton | 635 | 787 | 755 | 866 | 907 | 594,185 | 681,542 | 713,809 | 665.62 | 763.48 | 799.62 |
| Opal | 100 | 120 | 117 | 128 | 142 | 14,040 | 15,360 | 17,040 | 15.73 | 17.21 | 19.09 |
| Superior | 300 | 133 | 303 | 336 | 363 | 40,299 | 44,688 | 48,279 | 45.14 | 50.06 | 54.08 |
| Wamsutter | 310 | 161 | 294 | 372 | 476 | 47,334 | 59,892 | 76,636 | 53.02 | 67.09 | 85.85 |
| TOTAL | 2,091 | 2,309 | 2,661 | 2,935 | 827,458 | 950,512 | 1,017,642 | 927 | 1,065 | 1,140 | |
| GRAND TOTAL | 49,556 | 50,000 | 60,674 | 76,341 | 6,743,900 | 8,144,431 | 10,004,982 | 7,555 | 9,124 | 11,208 | |
Figure IV-7 Municipal Use Projections
Click to enlarge
Domestic Use Projections
Chapter II presented current domestic uses, primarily served from ground water, estimated at 1,940 to 3,880 acre-feet per year (depending on per capita use assumption). Domestic users (the Basin.s rural population), can be estimated as the difference between the total projected basin populations for the various growth scenarios and that part of the populace residing in established cities and towns. The cumulative projected domestic use totals can be estimated using the same per capita use rates as presented in Chapter II. The table below summarizes domestic use projections calculated in this manner.
| Domestic Use Projections | Current | Low Growth Scenario | Moderate Growth Scenario | High Growth Scenario |
| Basin Population | 61,100 | 62,500 | 75,000 | 91,400 |
| Municipal Population | 49,600 | 50,000 | 60,700 | 76,300 |
| Rural Population | 11,500 | 12,500 | 14,300 | 15,100 |
| Domestic Use @ 150 GPCPD (in AF/Year) | 1,940 | 2,100 | 2,400 | 2,540 |
| Domestic Use @ 300 GPCPD (in AF/Year) | 3,880 | 4,200 | 4,800 | 5,080 |
This section presents projections of industrial water needs in the Green River Basin for the period from 2000 through 2030. These projections provide a basis for gauging the adequacy of current surface water and groundwater supplies in the Basin to meet potential future needs. Projections were developed for low, moderate and high growth planning scenarios.
Currently, the largest industrial water uses in the Basin are those associated with electric power generation and soda ash production. Future water needs for electric power production in the Basin will be largely determined by how electric utilities in the Basin and elsewhere in the west respond to growing demands and various actions and proposals to deregulate the industry. Scenarios for possible industry responses to deregulation are not easily developed. Similarly, future growth prospects for the soda ash industry are largely dictated by the ability of Wyoming producers to capture an increasing share of the international market in the face of volatile international economic conditions and the protective tariffs imposed by some foreign countries. The factors that influence the competitiveness of the Basin.s soda ash producers in international markets are difficult to foresee.
The following sections discuss future growth prospects of the significant water using industries in the Basin and present low, medium, and high growth projections for future water use. The last section summarizes future industrial water needs.
Future Electric Power Production
Two coal-fired electric power plants are located in the Green River Basin; the Jim Bridger Power Plant near Point of Rocks in Sweetwater County and the Naughton Power Plant south of Kemmerer in Lincoln County. Both are owned and operated by Pacificorp, which is a subsidiary of Scottish Power. The Naughton Plant has a production capacity of 710 megawatts and consumptively uses approximately 13,500 acre-feet of water annually from the Hams Fork River. The Jim Bridger Plant has a production capacity of 2,000 megawatts and consumptively uses approximately 34,300 acre-feet of water annually from the Green River. Much of the power from the Naughton Plant is exported via transmission lines to Utah, while much of the power from the Jim Bridger Plant is exported to Pacificorp customers in the Pacific Northwest.
Restructuring of the electric utility industry offers both potential for future development and roadblocks to the development of additional generating capacity in the Green River Basin. Currently, electric generating capacity in the western U.S. is being fully utilized during peak periods of summer demand. The Department of Energy forecasted the possibility of brown outs in some parts of the West during the summer of 2000. This fact, coupled with various proposals to reduce hydropower production in the Pacific Northwest to lessen environmental impacts on endangered species, means that additional generating capacity will be needed in the near future to meet growing needs in the region. The availability of water and low sulfur coal resources in the Green River Basin makes it a logical location for new generating capacity to meet additional future power needs of the Rocky Mountain and West Coast regions.
One roadblock to developing additional generating capacity in the Basin is the possibility that industry restructuring will encourage large industrial power users in other states to develop co-generation facilities to meet their own needs and sell excess power to retail consumers. Another roadblock is the fact that the transmission lines that carry power out of the Basin to western markets are now at capacity, and Wyoming markets, where transmission capacity is adequate, are growing slowly. Thus, any substantial increase in generating capacity in the Basin would have to be accompanied by new transmission facilities to carry the power out of state.
The issue of how electrical utility industry restructuring evolves in the western U.S. will play an important role in determining the magnitude of future water requirements for electrical power generation in the Green River Basin. Three scenarios for future growth are described below.
Low Growth Scenario
The low growth scenario for future power generation projects current levels of water consumption for power generation to remain constant over the next thirty years. The low growth scenario is based upon the assumption that additional power needs in the western U.S. over the next 30 years will be met by the construction of new generating facilities outside of the Basin, possibly co-generation facilities developed in conjunction with industrial plants in other states. As a result, water requirements for power generation in the Basin will remain at current levels over the planning horizon. That level is approximately 47,800 acre-feet annually.
Moderate Growth Scenario
The moderate growth scenario is based upon the reasonably foreseeable possibility that co-generation facilities will not be developed at a rate sufficient to meet regional power needs over the next 30 years. It is also based on the assumption that the State of Wyoming and/or the Federal Energy Commission will take steps to solve the transmission bottleneck out of Wyoming and thus encourage the construction of additional electrical generating capacity in the Basin.
The logical location for a moderate expansion of generating capacity is the Jim Bridger Power Plant near Point of Rocks, east of Rock Springs. The facility was originally designed for up to six 500 MW coal-fired generating units, although only four such units have been installed. The existing units are among the most cost-efficient in the Pacific Power generating system, and an expansion to six coal-fired units at Jim Bridger would be a logical step to increase regional power production in a cost effective manner. The moderate growth scenario for electric power production in the Basin projects a 50 percent increase in water requirements for the Jim Bridger Power Plant over the next 30 years, with water requirements at the Naughton facility remaining constant at current levels. Total water use for the moderate growth scenario is projected to grow from a current rate of 47,800 acre-feet annually to approximately 65,000 acre-feet by the year 2030.
High Growth Scenario
The rapid economic growth that occurred in the Green River Basin during the 1970s and early 1980s was partially a result of political events that occurred beyond the Basin.s boundaries. The threat of curtailed oil imports led the U.S. to mount a campaign for energy independence that emphasized developing and utilizing the nation.s own energy resources, including oil and gas, uranium, and coal. The Green River Basin has abundant reserves of all of these natural resources, and high-energy prices and government programs to stimulate development of those resources led to a period of rapid growth in the Basin.
There are no immediate prospects for a disruption in international energy markets, and there is no evidence that the federal government is currently poised to reinstate programs to encourage domestic energy production. However, there is a possibility that over the next three decades international events will transpire in a manner that would place increasing emphasis on domestic energy production because of shortages of imported oil and/or surging energy prices. Such developments could lead the U.S. to institute incentives for developing new coal-fired electrical generating facilities to reduce the nation.s dependence on foreign oil. The Green River Basin.s water and coal reserves make it a natural place for such developments.
The high growth scenario for electrical energy production is based upon the reasonable possibility that high international energy prices and/or a disruption of oil imports into the U.S. will stimulate the construction of a significant addition to current electric generating capacity in the Basin. This scenario assumes that in addition to a 1,000-megawatt expansion of the Jim Bridger Power Plant, a new 3,000-megawatt coal-fired generating facility will be built in the vicinity of coal deposits near Creston Junction, utilizing water piped from the Green River.
The two existing coal-fired generating facilities in the Basin use approximately 47,800 acre-feet of water annually. At the same water utilization rate, the addition of 4,000 megawatts of generating capacity over the next 30 years would raise total water use for power production to 116,500 acre-feet annually. This figure represents a 144 percent increase over current levels.
Future Soda Ash Production
The trona patch in the vicinity of Green River, Wyoming is the site of five industrial facilities that convert trona to soda ash, an industrial product that is used in manufacturing glass, detergents, baking soda, and several other industrial and consumer products. As a group, these five facilities produced approximately 11.7 million tons of soda ash in 1999, and consumptively used about 17,900 acre-feet of water from the Green River. Not all of this water is used in soda ash production or related work; however, some soda ash facilities use cooling water for on-site electric power generation and sell their excess power. Total industry water usage for all purposes was estimated at about 18,100 acre-feet annually.
Future growth in soda ash production in the Basin will be largely dependent upon export markets. Domestic consumption has been relatively flat in recent years and is expected to grow by only 1.0 to 1.5 percent annually for the foreseeable future. This relatively low growth rate is attributable to the fact the U.S. market is relatively mature in terms of per capita consumption of soda ash products.
Foreign demand for soda ash, especially in developing countries, is expected to increase at a more rapid rate than in the U.S. over the next 30 years. As disposable income rises in developing countries, consumption of beverages in glass containers is expected to become commonplace. The increased use of glass containers in foreign markets is expected to translate into increased demand for U.S. soda ash because the U.S. has the world.s largest deposits of trona and is the lowest cost producer of soda ash.
Other factors that affect future U.S. soda ash production include trade barriers that many countries have established to protect their domestic soda ash industries that, in some cases, utilize synthetic processes that are not cost competitive with natural soda ash imports. Over the next 30 years, efforts by the World Trade Organization and the U.S. government have the potential to lower these tariff barriers and open up new markets for U.S. soda ash. Soda ash exports from the Basin may also receive a boost from future cost savings in the production (using solution mining) and transportation of soda ash.
How all of these influences come together over time will largely determine the future growth rate of soda ash production in the Basin and the corresponding need for additional process water. Three scenarios for future water needs for the Basin.s soda ash industry are described below.
Low Growth Scenario
The low growth scenario for future soda ash production projects no significant changes in the structure of domestic or international markets for soda ash over the 30 year planning horizon, and no significant changes in production and transportation costs for Wyoming producers. Under these conditions, Green River Basin producers would be expected to maintain their current shares of both domestic and international markets, and their production would be expected to grow roughly proportional to growth in consumption. The overall future growth rate for soda ash production in the Basin is projected to be 1.75 percent annually for the low growth scenario.
The amount of water used for soda ash production varies widely among producers. Based upon industry interviews, the overall average consumptive use rate for current production in the Green River patch is on the order of 450 gallons per ton of soda ash production. This figure was used to project future water requirements for the industry for the low growth scenario.
At a 1.75-percent annual growth rate, soda ash production in the Basin will grow from 11.7 million tons in 1999 to 20.0 million tons by the year 2030. The production increase of 8.3 million tons annually will require an estimated 3.735 billion gallons of additional water annually, the equivalent of approximately 11,500 acre-feet. That increase would bring total consumptive use up to 29,600 acre-feet by the year 2030, an increase of 64 percent over current levels.
Moderate Growth Scenario
The moderate growth scenario, like the low growth scenario, projects no significant changes in the structure of domestic or international markets for soda ash over the next 30 years. Unlike the low growth scenario, however, this scenario projects the reasonably foreseeable possibility that producers will be able to achieve an additional competitive advantage in the export marketplace through reductions in rail transportation costs and the implementation of solution mining for a portion of their future production.
Foreign soda ash consumption is estimated to be roughly 25.0 million tons annually of which approximately 20 percent is supplied by Wyoming producers. If foreign consumption increases at the projected rate of 2.5 percent annually, it will reach 53.8 million tons by the year 2030. Wyoming producers could reasonably expect to increase their share of foreign market penetration from 20 to 25 percent as a result of efficiencies described above, meaning that total foreign sales would approach 13.5 million tons annually by the year 2030. Assuming that domestic sales continue to grow at the project rate of 1.25 percent, total soda ash production would be 23.8 million tons by the year 2030, an increase of 12.1 million tons over current levels.
The water requirements associated with this scenario are more difficult to estimate than for the low growth scenario because of the assumption that solution mining would be employed for a portion of future production. For purposes of estimating water requirements for this scenario, it was assumed that 50 percent of future production increases would come from solution mining, and that solution mining techniques would require 750 gallons of water per ton of soda ash production. Based upon these assumptions, the consumptive use of water by soda ash industry in the Basin would grow by 22,300 acre-feet annually by the year 2030 to a total of 40,400 acre-feet. This figure represents a 123 percent increase over current water consumption levels.
High Growth Scenario
The high growth scenario for soda ash production in the Basin, like the moderate growth scenario, projects increasing efficiencies in production and transportation through solution mining and competition in rail transportation of the finished product. In addition, this scenario projects the possibility of structural changes in some overseas markets that will result from falling tariffs and the elimination of certain other trade barriers. If trade barriers to U.S. exports of soda ash are gradually lowered or eliminated over the next 30 years, Wyoming producers could be expected to benefit enormously because they have a competitive advantage with respect to production costs that few other suppliers can equal. The high growth scenario for Wyoming producers is based upon the assumption that they could reasonably capture one-third of the total world market of 53.8 million tons by the year 2030.
Assuming that domestic production in the patch will grow at 1.25 percent annually, and that exports will grow to one-third of foreign consumption by the year 2030, total estimated soda ash production in the Basin would be 28.1 million tons in 30 years. Assuming that 50 percent of the increased production comes from solution mining (750 gallons per ton) and 50 percent from conventional processes (450 gallons per ton), the increase in annual water requirements for the industry by the year 2030 will be 30,200 acre-feet. Total water requirements for the industry would be 48,300 acre-feet annually, an increase of 167 percent over current levels.
Other Surface Water Uses
Electrical power generation and soda ash production constitute the current major uses of surface water for industrial purposes in the Green River Basin. The only other surface water user of significance is FS Industries, which manufactures phosphate fertilizer in a plant near Rock Springs. This plant current consumptively uses about 560 acre-feet of water annually, which is purchased from the Rock Springs-Green River Water Supply System. Future expansion of this facility is possible, although the timing and magnitude of expansion are uncertain. For purposes of projecting future water needs, the low growth scenario for this facility assumes no future growth in water needs over the 30 year planning horizon. For the moderate growth scenario, consumptive use is projected to increase to 1,000 acre-feet annually by the year 2030. For the high growth scenario, consumptive use is projected to increase to 1,500 acre-feet annually by the year 2030.
Groundwater Uses
The oil and gas industry is an important user of ground water in the Basin, although water requirements are generally small and spread over a large geographic area. Water is used to create mud during drilling and can be used for flooding during production. The Bureau of Land Management (BLM) has projected that the number of producing oil and gas wells in the Green River Resource Area (GRRA) through the year 2010. That projection shows that the total number of producing wells is expected to decline slightly from a total of 1,725 in the year 2000 to about 1,570 in the year 2010. Although the number of new wells drilled each year is expected to increase during this period, the number of wells abandoned each year is projected to more than offset the increase in drilling. Thus, there are no indications of a significant change in future water requirements for oil and gas drilling in the Basin.
There is a potential for coal-bed methane development to impact groundwater resources in a limited area of the Basin over the next 30 years. The extent of future development is uncertain at this time because the commercial viability of developing available reserves has not been established. According to the BLM, however, almost all potential reserves are located in an area north of Rock Springs and extending east and west from Eden. This area, encompassing less than 10 percent of the land area of Sweetwater County, is believed to contain up to 98 percent of the developable reserves in the GRRA. The BLM projects that up to 300 commercial wells could be developed in this area in the coming decade.
Coal-bed methane development is not a consumptive user of groundwater resources, but does produce ground water as a by-product of gas production. Several options for groundwater disposal may be available to methane producers, including reinjection, disposal ponds, discharge, and various combinations of these alternatives. The potential for coal-bed methane development to affect other industrial groundwater users in the Basin is unknown at this time.
The Kennecott Uranium Company also has a number of groundwater permits for its inactive mine and processing facility in the Great Basin northeast of Rawlins. When it was operational, the mine used well water in a process solution for extracting uranium from ore. Given current conditions in the world market for uranium and prospects for future growth, however, the prospects for the mine and processing facility reopening during the planning horizon of this study are remote.
Potential New Industrial Uses
The industrial water use projections for the Green River Basin described above focus on existing industries and their future water needs. The potential for new industries to locate in the Basin to take advantage of available water resources also merits discussion. According to the U.S. Census Bureau, four industry groups account for over 95 percent of all of the industrial water used in this country each year. These industries are (1) electric power producers, (2) chemical and allied products manufacturers, (3) primary metals producers, and (4) paper and allied products manufacturers. Electric power producers alone consume over 80 percent of all industrial water used in this country each year. The other three industry groups account for roughly 14 percent of all industrial water use.
The Green River Basin is already well represented with respect to electric power production and chemical manufacturers (the soda ash and phosphate industries fall into this group). The other two intensive water use industries, primary metals and paper producers, tend to locate near the source of their largest process inputs -- metals and wood respectively. It thus appears likely that any new water intensive industrial developments in the Basin over the next 30 years will fall into the electric power generation and/or chemical products categories.
Expansion of electric power production in the Basin is discussed earlier, as is the potential for expansion by the soda ash and phosphate fertilizer industries. The possibility remains that new industrial water uses not discussed in this report will develop over the next 30 years, but the nature and extent of such developments is not foreseeable at this time and water requirements for such developments are not included in the projections described in this memorandum.
Summary of Findings
Projected industrial water requirements for the Green River Basin are presented graphically in Figure IV-8, and the numerical results are summarized in Table IV-2. These projections are for surface water requirements for large industrial water users. The results show that for the low growth scenario, water requirements are expected to increase from a current level of 66,500 acre-feet to 78,000 acre-feet by 2030, an increase of 17 percent. The moderate growth scenario projects a reasonably foreseeable requirement of 106,400 acre-feet by 2030, an increase of 68 percent. For the high growth scenario, requirements are projected to grow to 166,300 acre-feet, an increase of 150 percent.
Figure IV-8 Total Industrial Water Use Projections
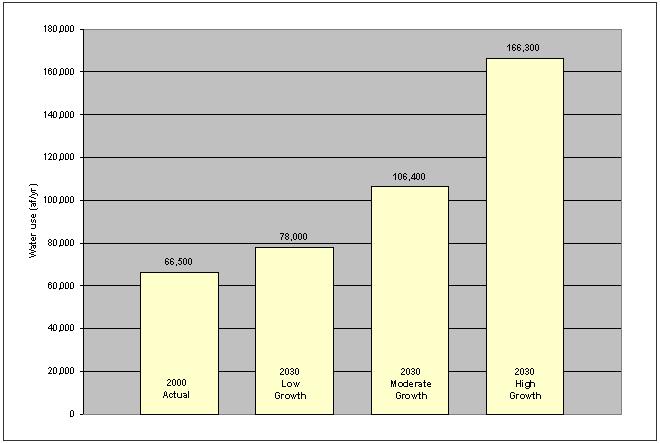
Table IV-2 Industrial Water Use Projections
| Scenario/Industry | Consumptive Use (af/yr) | Percentage Change | |
| 2000 | 2030 | ||
| Low Growth Electric power Soda ash1 Other2 |
47,800 18,100 600 |
47,800 29,600 600 |
0% 64% 0% |
| Total | 66,500 | 78,000 | 17% |
| Moderate Growth Electric power Soda ash1 Other2 |
47,800 18,100 600 |
65,000 40,400 1,000 |
36% 123% 67% |
| Total | 66,500 | 106,400 | 60% |
| High Growth Electric power Soda ash1 Other2 |
47,800 18,100 600 |
116,500 48,300 1,500 |
144% 167% 150% |
| Total | 66,500 | 166,300 | 150% |
Current Recreation Activity
Detailed descriptions of water-based recreational pursuits in the Basin are given in Chapter II. The most popular water-based recreational activity in the Green River Basin is fishing. About 60 percent of Basin residents participated in fishing activities in 1989, the most recent year for which detailed survey information is available. Other current water-based recreation participation rates are shown in comparison in Figure IV-9.
Figure IV-9 Resident Participation in Water-based
Recreational Activities
The Wyoming Game and Fish Department (WGF) provided estimates of the current number of annual activity days of angling and waterfowl hunting in the Green River Basin (Chapter II). The results show that still water fishing on lakes and reservoirs in the Basin accounts for almost one-half million activity days annually. About 80 percent of this activity occurs on lowland reservoirs, the largest of which are Flaming Gorge and Fontenelle. Another 15 percent of still water fishing activity occurs on alpine lakes and reservoirs, which are concentrated on national forest lands in the Pinedale area. The remaining five percent of activity days involve fishing on farm ponds and natural lowland lakes scattered throughout the Basin.
Stream fishing in the Basin accounts for about 300,000 activity days annually. The main stem of the Green River above Flaming Gorge Reservoir and several of its tributaries in the northern part of the Basin provide very good trout fishing opportunities. The most popular areas for stream fishing in the Basin are the Green and New Fork Rivers in the Pinedale area and the Green River below Fontenelle Reservoir.
Waterfowl hunters spend about 10,600 days annually in the pursuit of ducks and geese that inhabit or pass through the Basin. The two most heavily hunted areas are the Seedskadee National Wildlife Refuge and the Eden-Farson-Big Sandy area.
Activity day estimates are not available for other water-based recreational pursuits, including boating, water skiing, rafting, canoeing, sailing, and wind surfing. Total visitation estimates are available for certain large bodies of water such as Flaming Gorge and Fontenelle Reservoirs, but these estimates are for all uses, including sightseeing, picnicking, and camping, regardless of whether water based recreation is involved.
Recreation Demand Projections
Future demands for recreational water resources in the Basin depend upon numerous factors, including population growth, tourism growth, and participation rates in various water-based recreational activities. Future participation rates depend upon changes in preferences over time as well as the availability of water resources and the amount of congestion encountered at recreational sites. Changes in future recreational preferences are hard to predict, so the projections described in this section are based upon the assumption that participation rates remain constant over the planning horizon. This assumption means that projected recreational demands are proportional to growth in population and tourism in the Basin.
Projections of population growth in the Basin are described earlier in this chapter. Those projections are summarized in Table IV-3 in terms of average annual growth rates for the low, moderate, and high growth planning scenarios. Table IV-3 also gives projections of tourism growth over the planning horizon for low, moderate, and high growth scenarios.
Table IV-3 Projected Annual Growth Rates: Population & Tourism (2000-2030)
| Scenario | Average Annual Growth Rate (percent) | |
| Basin Population | Tourism | |
| Low growth | 0.08 | 1.00 |
| Moderate growth | 0.68 | 2.00 |
| High growth | 1.35 | 3.00 |
The other information needed to project future recreation demand is a breakdown of recreational activity data between residents and nonresidents. According to the WGF, residents of the Basin account for about 68 percent of the fishing activity days on lakes and about 58 percent of the fishing activity days on streams. Residents also account for about 82 percent of the waterfowl hunting activity in the Basin and about 63 percent of the boating activity.
This information was used to project future recreational activity days over the 30-year planning horizon from 2000 to 2030. Those projections are given in Table IV-4. The demand for still water fishing, the most popular recreational activity in the Basin, is projected to expand significantly over the next three decades. Similar increases are projected for stream fishing demands in the Basin.
Table IV-4 Current and Projected Water-based Recreational Activity Days (2000-2030)
| Activity | Activity Days | |||
| Current | Low growth | Moderate growth | High growth | |
| Stillwater fishing | 485,000 | 547,000 | 685,300 | 868,800 |
| Stream fishing | 281,700 | 326,900 | 414,500 | 531,400 |
| Waterfowl hunting | 10,600 | 11,500 | 14,100 | 17,600 |
| Boating, rafting, etc. | n/a | +14% | +44% | +85% |
The demand for waterfowl hunting is also expected to increase over the planning horizon, but at a lesser growth rate than for fishing. The last recreational activity described in Table IV-4 encompasses all forms of boating, rafting, canoeing, and sailing. No information is available concerning current Basin-wide boating activity days. The projections for this activity category in Table IV-4 show the percentage increases in demand that are expected for this activity, given projected increases in population and tourism in the Basin over the planning horizon.
A summary of current and projected recreational activity day demands is presented in Figure IV-10 for those activities for which data are available (fishing and waterfowl hunting). The results show that, currently, those activities account for about 796,000 user days annually. For the low growth scenario, that figure is expected to rise to 905,600 activity days by the year 2030, an increase of 14 percent. For the moderate and high growth scenarios, the projections are for 1,140,800 and 1,452,400 activity days, respectively, by the year 2030. These projections constitute increases of 43 and 83 percent over current recreational activity estimates.
Figure IV-10 Current and Projected Recreational Activity Days (2000-2030)
Adequacy of Existing Resources to Meet Projected Demands
The WGF in the past has estimated the supply of water resources available to meet the demands of fishermen in various regions of the State. These supply estimates were expressed in terms of fishermen days, and reflect the amount of pressure that the Department believed at that time (1988) that publicly accessible fisheries could withstand without significant deterioration. Although these estimates have not been updated in the past decade, they serve as one benchmark for judging the capacity of fisheries in the Green River Basin to meet projected future demands. It should be emphasized, however, that these supply estimates reflect not only resource availability in 1988, but also the management goals and objectives of the WGF in terms of fishing success rates and other factors.
According to the WGF, the Green River Basin and the Bear River Basin combined provide an annual supply of 1,122,800 activity days of lake and reservoir fishing opportunities. Almost all of this supply is located in the Green River Basin. When contrasted with current utilization rates of about 485,000 activity days of use annually, it is apparent that there is no current shortage of still water angling opportunities in the Basin. This observation is consistent with the observed fact that the region is endowed with numerous lake and reservoir fisheries ranging from small alpine lakes in the higher elevations of the Bridger-Teton National Forest to Flaming Gorge and Fontenelle Reservoirs in the lower part of the Basin.
Projections of future demands for still water fishing opportunities described above range from 547,000 to 870,000 activity days annually by the year 2030, depending upon the growth scenario used. None of these projections approach the estimated supply of over 1.1 million angling days, meaning that the supply of lake and reservoir fishery resources in the Basin should be adequate to meet projected needs for the foreseeable future, as shown in Figure IV-11.
Figure IV-11 Supply and Demand of Green River Basin Fishing
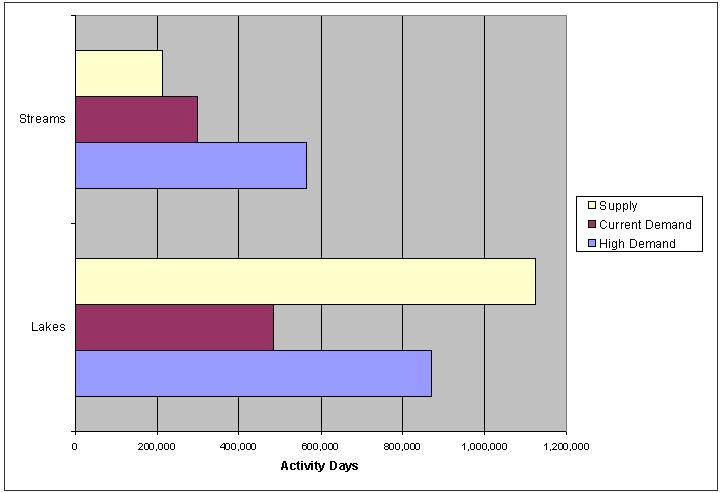
Figure IV-11 shows that a somewhat different conclusion applies to the Basin.s stream fisheries. According to the WGF, in 1988 the Basin had a total supply of about 411,000 angler days of stream fishing opportunities available, but only about 213,000 angler days of this supply were in areas where public access was guaranteed. That figure contrasts with a current estimated annual use of about 300,000 angler days of activity, and projected demands in the range of 327,000 to 566,000 angler days of activity by the year 2030. These estimates indicate that the Basin.s stream fisheries are at capacity now, on the average, and will come under increasing pressure in the future as its population increases and tourism related fishing pressure grows. Inside these numbers, there are likely some public streams that are underutilized because of remote location or where access is made difficult by private holdings. Likewise, easily accessible public reaches may be over utilized.
The implications of this latter conclusion are limited by the fact that there is a relatively fixed supply of streams in the Basin that are suitable for maintaining recreational fisheries. One inference that can be drawn is that any future water development activities in the Basin that would denigrate existing recreational stream fisheries could have significant negative recreational effects. On the other hand, new reservoir projects in the Basin could generate significant recreational benefits if they include provisions for establishing tailwater fisheries in areas where quality fisheries do not currently exist.
The other water-based recreational pursuit for which demand projections were developed is waterfowl hunting. Those projections indicate that demand is expected to rise from a current level of 10,600 activity days to between 11,500 and 17,600 activity days by the year 2030 (Table IV-4). The WGF has not estimated the supply of waterfowl hunting opportunities in the Basin, partially because populations are migratory and hunting seasons and bag limits are established in accordance with guidelines established by the U.S. Fish and Wildlife Service.
Current environmental uses of water in the Green River Basin are described in Chapter II. Those uses include:
Unlike recreational water requirements, environmental water requirements are not necessarily related to changes in population or tourism in the Basin. Instead, environmental water requirements are at least partially a function of human desires concerning the type of environment in which people want to live. These desires are expressed in many ways, including environmental programs and regulations promulgated by elected representatives at the state and federal levels. Thus, future environmental water requirements in the Green River Basin will be determined, at least partially, by existing and new legislation dealing with environmental issues at the state and federal levels, and how that legislation is implemented by federal and state agencies.
Examples of such legislation include Wyoming Statutes S41-3-1001 to 1014, which stipulate that instream flows are a beneficial use of Wyoming.s water and specify procedures for establishing such flows using unappropriated water. This legislation authorizes the WGF to specify stream segments and flow requirements for an instream flow filing. The WWDC is authorized to file an instream flow application with the State Engineer and perform hydrologic analyses on filings recommended by the WGF. The State Engineer can then issue a permit for an instream flow water right following a public hearing.
Future water requirements for instream flows in the Green River Basin (and other river basins throughout the State) depend largely upon how Wyoming.s instream flow legislation is implemented over the 30-year planning horizon. Projecting the outcome of this process quantitatively would be difficult, and is perhaps unnecessary because instream flows and other environmental water uses are largely non-consumptive. Instream flow designations can conflict with potential new out-of-stream uses at specific locations, however, a topic that is discussed below.
Instream Flows and Reservoir Bypasses
Wyoming.s instream flow statutes recognize the obvious economic fact that Green River Basin water resources have value in non-consumptive uses such as instream flows. Such flows not only contribute to aesthetic character and biological diversity of the Basin, they also support recreational fisheries that are important to Basin residents and to the Basin.s economy.
The WGF has a goal of maintaining and enhancing existing fisheries in the Green River Basin through the statutory designation of instream flow segments and other management strategies. An important subsidiary objective of the Department is to protect existing populations of Colorado River cutthroat trout and increase the distribution of the species in their ancestral waters. The Department has implemented a management plan in cooperation with the U.S. Forest Service for managing Colorado River cutthroat populations in the Basin that includes seven elements, ranging from population and habitat surveys to non-native trout removal and instream flow reservations.
Although the WGF has not completed its assessment of instream flow needs in the Green River Basin, it does not anticipate developing additional flow recommendations during the next five years. If and when additional instream flow requests are forthcoming, they would likely be in conjunction with Department efforts to maintain and reestablish Colorado cutthroat trout populations in the northwest tributaries of the mainstem Green River in the Big Piney area, certain tributaries in the Pinedale area, and small streams in the Blacks Fork and Little Snake Drainages. The extent to which current and future instream flow requests may conflict with potential storage developments for supplemental irrigation water in the Basin is unknown, but the potential for conflicts does exist. These conflicts would have to be resolved on a case-by-case basis, weighing the potential benefits of water to the State in instream versus out-of stream uses.
Other groups in the Basin are pursuing alternative strategies to enhance stream flows while preserving traditional water uses. For example, Wyoming Trout Unlimited and private water rights holders in the Pinedale area have agreed to enhance the stream fishery below Fremont Lake through voluntary water releases during low flow periods. Such strategies will likely become more common in the future as the demand for stream fishing opportunities increases.
Another tool for maintaining fisheries habitat in the Basin is the provision of minimum flow bypasses at reservoir sites. Currently, only three reservoirs in the Basin have minimum flow bypasses included as requirements in their permitting documents; Fontenelle, Meeks Cabin, and Stateline Reservoirs. The development of additional reservoir storage in the future would likely bring about requests by the WGF and others for such minimum flow bypass requirements.
Minimum Reservoir Pools and Channel Maintenance Flows
Another environmental water use is the provision of minimum reservoir pools for fish and wildlife purposes. Five reservoirs in the Basin have .fish. or .fish and wildlife. uses listed in their permitting documents; Big Sandy, Boulder, Flaming Gorge, Fontenelle, and High Savery. Of these, only two have a specific amount of storage committed to a minimum pool: Boulder with 1,621 acre-feet, and High Savery with 4,955 acre-feet. Given the current federal regulatory environment and the desires of the public to maintain and enhance recreational fisheries in the Basin, it is likely that any additional storage developed in the future will have a portion of its storage devoted to fish and wildlife purposes.
Only three reservoirs have flow bypasses required by permit. These are Fontenelle Reservoir (50 cfs at the City of Green River), Meeks Cabin Reservoir (10 cfs) and Stateline Reservoir (7 cfs).
The technical memorandum devoted to describing environmental uses further details the WGF estimates of recommended water levels in reservoirs and maintenance flows for live streams.
Wildlife Habitat
Another important environmental use of water in the Basin is the provision of habitat for wildlife. Wildlife habitat exists in wetland and riparian areas on public and private lands throughout the Basin, some of it occurring naturally and some of it as a result of human activity.
One federally managed area dedicated to the preservation and restoration of wildlife habitat is the Seedskadee National Wildlife Refuge, which contains approximately 26,000 acres of land along the Green River below Fontenelle Reservoir. One goal of the refuge is to reestablish a number of wetlands that existed prior to the construction of Fontenelle Reservoir. These wetlands were maintained by high early season flows that have been reduced since the reservoir became operational. No precise estimates are available for the number of wetland acres that might be reestablished in the future, but the refuge does have the right to divert up to 28,000 acre-feet of direct flow and storage water annually below Fontenelle Reservoir. Under high growth assumptions, depletions for wetlands reestablishment or forage may approach one-half of that amount on an annual basis.
Three federal programs, the Conservation Reserve Program (CRP), the Wetlands Reserve Program (WRP), and the Wildlife Habitat Incentives Program (WHIP) encourage the development of wildlife habitat on private lands. The CRP program is administered by the Farm Service Agency of the U.S. Department of Agriculture (USDA), and provides incentive payments for various conservation practices that will enhance wildlife habitat, as well as improve water quality and reduce erosion. Only a small amount of acreage in the Basin is currently enrolled in the CRP.
More lands in the Basin are expected to be enrolled in the CRP in the future, although no acreage estimates were made for purposes of this water plan. Most CRP lands do not involve consumptive use of surface water and thus will not affect future surface water availability for other uses.
The WRP is administered by the Natural Resources Conservation Service (NRCS) of the USDA. It is a voluntary program that provides financial and technical assistance to private landowners to reestablish wetlands on their property. Currently, there are 44 acres of land in the Basin enrolled in the WRP with an estimated annual consumptive water use of 110 acre-feet. These lands consumptively use water through evapotranspiration. Since the acreages in the WRP are relatively small, no projections of future depletions for this use were made.
The WHIP is also administered by the NRCS, and provides technical and financial assistance to private landowners interested in improving wildlife habitat on their property. Approximately 240 acres of land in the Basin is currently enrolled in the WHIP, but involve no consumptive use of surface or ground water. As a result, no projections of future water needs for such lands were developed as a part of this water plan.
The Little Snake River Conservation District has been active in establishing wetland areas in the Little Snake Drainage. These lands are not currently registered under the WRP, although they may be in the future. During the 1990s, 113.5 acres of wetlands were created, with an estimated consumptive use of 284 acre-feet. The District hopes to triple this acreage over the next 30 years, resulting in an annual depletion of almost 1,000 acre-feet.
Direct Wildlife Consumption
The only estimates of current consumptive water use by wildlife in the Basin are approximate. They indicate that big game and wild horses consumptively use about 500 acre-feet of water annually, 100 acre-feet from groundwater sources and 400 acre-feet from surface water sources. This level of consumptive use is relatively small and is not expected to change significantly over the planning horizon. These uses are not caused or imposed by man and therefore are not included in uses that count toward the Compact allocation.
Summary
For future man-made environmental uses in the Basin, the following scenarios were developed. Under low-growth assumptions, existing uses of 2,000 acre-feet per year are estimated to grow to about 10,000 acre-feet per year. The 8,000 acre-foot increment is presumed to include developments in the Little Snake River Basin (1,000 acre-feet), undifferentiated increases in enrollments in federal assistance programs, and additional environmental uses such as riparian improvements and evaporation from otherwise constructed environmental features. The moderate growth scenario assumes the base 10,000 acre-foot depletion in the low growth scenario plus an additional 7,000 acre-foot depletion at Seedskadee National Wildlife Refuge (14,000 acre-foot additional diversion at a 50 percent consumption rate). The high growth scenario is the low growth value plus 14,000 acre-foot depletion at Seedskadee (maximum 28,000 acre-foot diversion at a 50 percent consumption rate).
Table IV-5 presents water use projections for all sectors described in this chapter. Figure IV-12 shows this information graphically.
Table IV-5 Summary of Projected Uses
| Surface Water | Projected Growth Scenario (AF/Year) | ||
| Low | Moderate | High | |
| Municipal Use | 6,600 | 8,100 | 10,100 |
| City of Cheyenne | 22,700 | 22,700 | 22,700 |
| Industrial Use | 78,000 | 106,400 | 166,300 |
| Agricultural Use | 408,000 | 423,000 | 438,000 |
| Evaporation (in-State) | 32,800 | 32,800 | 32,800 |
| Recreation Use | non-consumptive | ||
| Environmental Use | 10,000 | 17,000 | 24,000 |
| Total (rounded) | 558,100 | 610,000 | 693,900 |
| % Compact Allocation | 67% | 73% | 83% |
| Main-Stem Evaporation Charge (Full Development) | 72,800 | 72,800 | 72,800 |
| Grand Total | 630,900 | 682,800 | 766,700 |
| % Compact Allocation | 76% | 82% | 92% |
Figure IV-12 Summary of Projected Uses
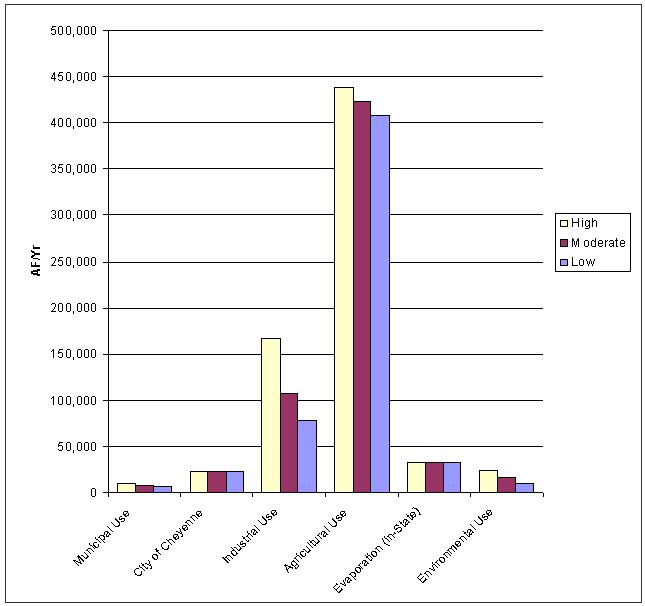
Table IV-6 shows how these projected uses compare to the amount of consumption currently used as Wyoming.s allotment under the Colorado River Compact and the Upper Colorado River Basin Compact as described in Chapter I.
Table IV-6 Projected Use of Compact Allocation
| Surface Water | Projected Growth Scenario (AF/Year) | ||
| Low | Moderate | High | |
| Wyoming's Share of the Upper Colorado River Water: | 833,000 | 833,000 | 833,000 |
| Estimated Depletions: | 630,900 | 682,800 | 766,700 |
| Remaining Compact Allotment: | 202,100 | 150,200 | 66,300 |