Wyoming State Water Plan
Wyoming State Water Plan
Wyoming Water Development Office
6920 Yellowtail Rd
Cheyenne, WY 82002
Phone: 307-777-7626

Wyoming Water Development Office
6920 Yellowtail Rd
Cheyenne, WY 82002
Phone: 307-777-7626


| SUBJECT: |
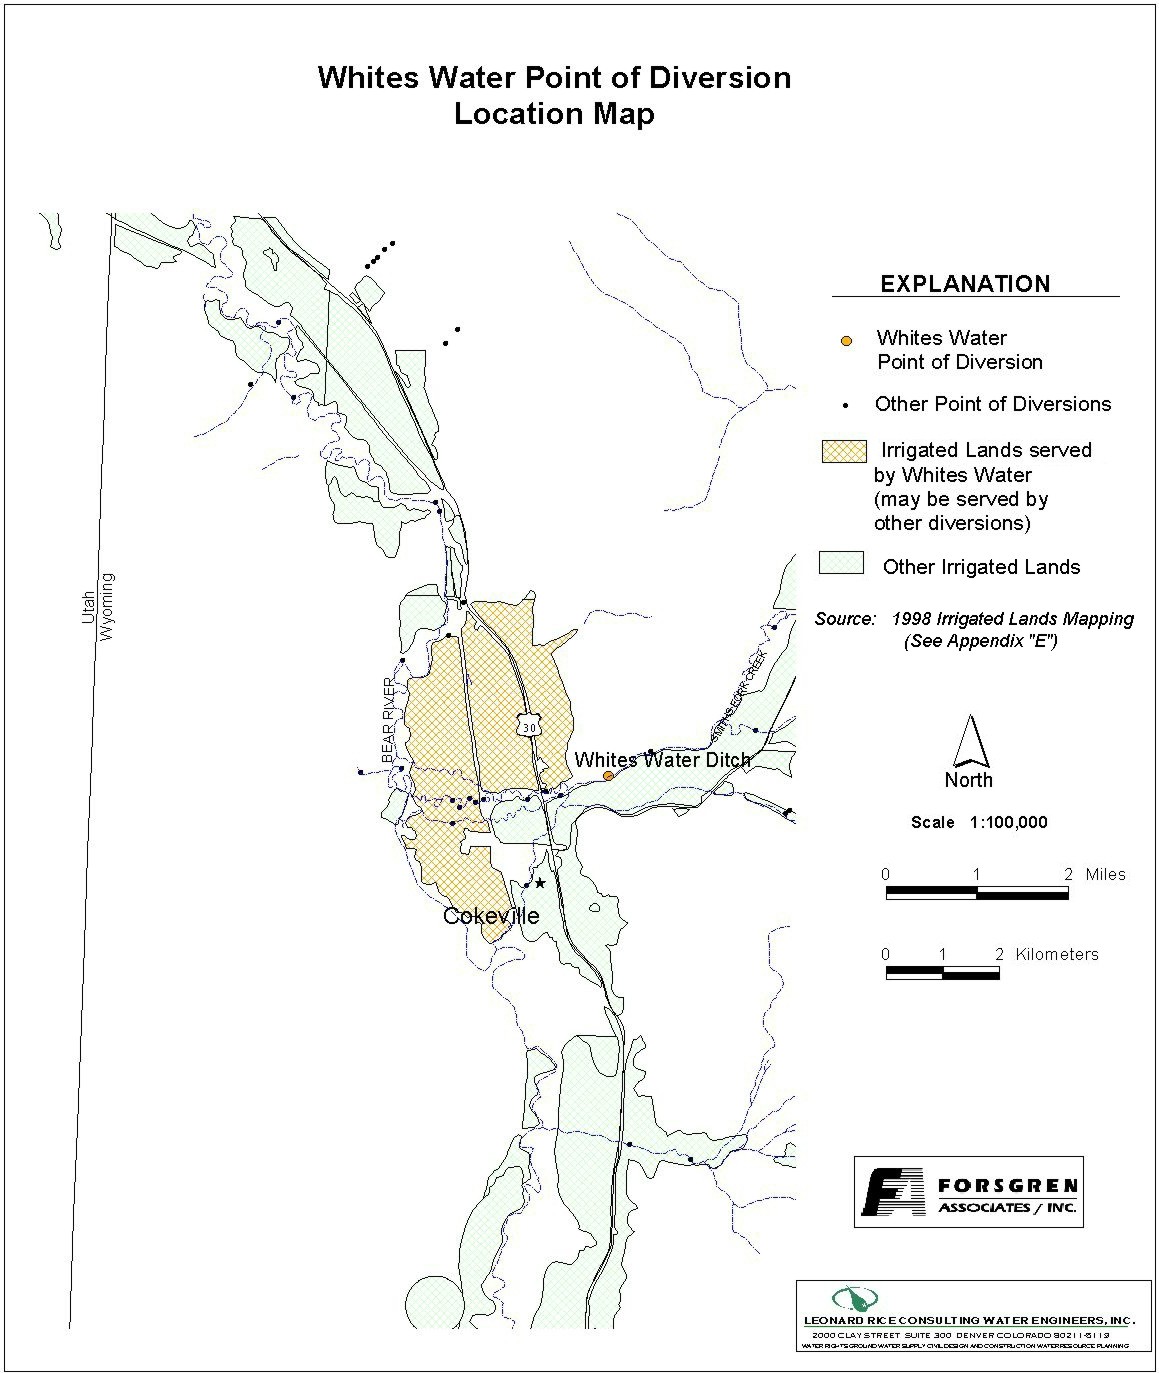
Appendix D Key Structures and Diversions WHITES WATER DIVERSION |
| PREPARED BY: | Bear River Basin Planning Team |
| DATE: | August 7, 2000 |
| Diversion Description: The Whites Water headgate consists of a concrete headwall with a single 9-foot wide rectangular wooden gate. | 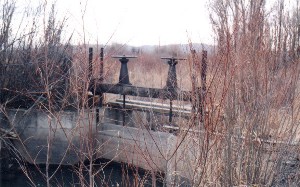 Whites Water headgate structure |
|
Conveyance Description: Open channel canal, approximately 29,040 feet in length.1
Direct Flow Water Rights:2
| Priority Date | Permit Number |
Permitted Use | Permitted Acres |
Flow (CFS) |
Cumulative (CFS) |
Comments |
|---|---|---|---|---|---|---|
| 06-10-1885 | Terr | Irrigation | 105 | 1.50 | 1.50 | |
| 06-10-1885 | Terr | Irrigation, Domestic, Storage | 870 | 12.42 | 13.92 | |
| 10-01-1889 | Terr | Irrigation | 11 | 0.15 | 14.07 | |
| 10-01-1889 | Terr | Irrigation, Domestic, Storage | 110 | 1.57 | 15.64 | |
| 10-01-1889 | Terr | Irrigation, Storage | 90 | 1.28 | 16.92 | |
| 10-01-1889 | Terr | Irrigation, Domestic, Storage | 35 | 0.50 | 17.42 | |
| 10-01-1889 | Terr | Irrigation, Storage | 17 | 0.24 | 17.66 | |
| 04-02-1906 | 1516E | Irrigation | 55 | 0.78 | 18.44 |
Associated Storage Rights: None
Irrigation Practices: Lands west of Highway 89 are flood irrigated (approx. 60%). Lands on the east side of Highway 89 are sprinkler irrigated using hand lines and side wheel rolls (approx. 40%).3
Estimated Diversion Efficiency:
Calculated Diversion Efficiency = Conveyance Efficiency X Application Efficiency:
Conveyance Efficiency: 60% Application Efficiency: 65% Overall Diversion Efficiency: 40% Conveyance efficiency is estimated by total length of main canal. Application efficiency for flood irrigation and sprinkler irrigation is estimated at 55% and 85% respectively.
Crop Types / Consumptive Use: Irrigated lands are mostly alfalfa (approx. 70%) with some grains. The remainder of the acreage is meadow grasses.3
Return Flows: Return flow reportedly surfaces at Garrett springs, tributary to the Bear River.
The following return flow pattern was adopted for modeling in this study are as follows:
		Month
      (after initial Diversion)	 Percent of Return
		0			50%
		1			25%
		2			15%
                3                       10%
                                       100%
References:
Monthly Diversion Records
Whites Water (on Smith's Fork)
| YEAR | MAY | JUNE | JULY | AUGUST | SEPTEMBER | ||||||||||
|---|---|---|---|---|---|---|---|---|---|---|---|---|---|---|---|
| Total of Daily Ave for Month | Average CFS |
Monthly Total Ac-Ft |
Total of Daily Ave for Month | Average CFS |
Monthly Total Ac-Ft |
Total of Daily Ave for Month | Average CFS |
Monthly Total Ac-Ft |
Total of Daily Ave for Month | Average CFS |
Monthly Total Ac-Ft |
Total of Daily Ave for Month | Average CFS |
Monthly Total Ac-Ft | |
| 1970 | 217 | 7.0 | 430.4 | 839 | 28.0 | 1664.1 | 832 | 26.8 | 1650.2 | 480 | 15.5 | 952.1 | 699 | 23.3 | 1386.4 |
| 1971 | 112 | 3.6 | 222.1 | 473 | 15.8 | 938.2 | 134 | 4.3 | 265.8 | 696 | 22.5 | 1380.5 | 119 | 4.0 | 236.0 |
| 1972 | 258 | 8.3 | 511.7 | 631 | 21.0 | 1251.6 | 472 | 15.2 | 936.2 | 674 | 21.7 | 1336.9 | 459 | 15.3 | 910.4 |
| 1973 | 202 | 6.5 | 400.7 | 1359 | 45.3 | 2695.5 | 696 | 22.5 | 1380.5 | 451 | 14.5 | 894.5 | 446 | 14.9 | 884.6 |
| 1974 | 202 | 6.5 | 400.7 | 1075 | 35.8 | 2132.2 | 800 | 25.8 | 1586.8 | 797 | 25.7 | 1580.8 | 432 | 14.4 | 856.9 |
| 1975 | 144 | 4.6 | 285.6 | 910 | 30.3 | 1805.0 | 786 | 25.4 | 1559.0 | 759 | 24.5 | 1505.5 | 417 | 13.9 | 827.1 |
| 1976 | 156 | 5.0 | 309.4 | 1070 | 35.7 | 2122.3 | 909 | 29.3 | 1803.0 | 747 | 24.1 | 1481.7 | 18 | 0.6 | 35.7 |
| 1977 | 53 | 1.7 | 105.1 | 414 | 13.8 | 821.2 | 331 | 10.7 | 656.5 | 0 | 0.0 | 0.0 | 179 | 6.0 | 355.0 |
| 1978 | 78 | 2.5 | 154.7 | 924 | 30.8 | 1832.7 | 789 | 25.5 | 1565.0 | 447 | 14.4 | 886.6 | 0 | 0.0 | 0.0 |
| 1979 | 293 | 9.2 | 581.2 | 833 | 27.8 | 1652.2 | 478 | 15.4 | 948.1 | 578 | 18.6 | 1146.4 | 372 | 12.4 | 737.9 |
| 1980 | 112 | 3.6 | 222.1 | 960 | 32.0 | 1904.1 | 807 | 26.0 | 1600.7 | 731 | 23.6 | 1449.9 | 164 | 5.5 | 325.3 |
| 1981 | 552 | 17.8 | 1094.9 | 879 | 29.3 | 1743.5 | 930 | 30.0 | 1844.6 | 536 | 17.3 | 1063.1 | 233 | 7.8 | 462.1 |
| 1982 | 157 | 5.1 | 311.4 | 991 | 33.0 | 1965.6 | 803 | 25.9 | 1592.7 | 767 | 24.7 | 1521.3 | 407 | 13.6 | 807.3 |
| 1983 | 190 | 6.1 | 376.9 | 935 | 31.2 | 1854.5 | 794 | 25.6 | 1574.9 | 576 | 18.6 | 1142.5 | 282 | 9.4 | 559.3 |
| 1984 | 1059 | 34.2 | 2100.5 | 1055 | 35.2 | 2092.6 | 1158 | 37.4 | 2296.9 | 644 | 20.8 | 1277.4 | 400 | 13.3 | 793.4 |
| 1985 | 812 | 26.2 | 1610.6 | 1178 | 39.3 | 2336.5 | 844 | 27.2 | 1674.0 | 730 | 23.5 | 1447.9 | 395 | 13.2 | 783.5 |
| 1986 | 442 | 14.3 | 876.7 | 1153 | 38.4 | 2286.9 | 984 | 31.7 | 1951.7 | 672 | 21.7 | 1332.9 | 126 | 4.2 | 249.9 |
| 1987 | 1439 | 46.4 | 2854.2 | 778 | 25.9 | 1543.1 | 495 | 16.0 | 981.8 | 456 | 14.7 | 904.5 | 445 | 14.8 | 882.6 |
| 1988 | 526 | 17.0 | 1043.3 | 920 | 30.7 | 1824.8 | 696 | 22.5 | 1380.5 | 419 | 13.5 | 831.1 | 150 | 5.0 | 297.5 |
| 1989 | 531 | 17.1 | 1053.2 | 605 | 20.2 | 1200.0 | 546 | 17.6 | 1083.0 | 321 | 10.4 | 636.7 | 360 | 12.0 | 714.0 |
| 1990 | 93 | 3.0 | 184.5 | 155 | 5.2 | 307.4 | 136 | 4.4 | 269.8 | 96 | 3.1 | 190.4 | 0 | 0.0 | 0.0 |
| 1991 | 536 | 17.3 | 1063.1 | 696 | 23.2 | 1380.5 | 631 | 20.4 | 1251.6 | 464 | 15.0 | 920.3 | 315 | 10.5 | 624.8 |
| 1992 | 396 | 12.8 | 785.5 | 420 | 14.0 | 833.1 | 434 | 14.0 | 860.8 | 238 | 7.7 | 472.1 | 0 | 0.0 | 0.0 |
| 1993 | 534 | 17.2 | 1059.2 | 906 | 30.2 | 1797.0 | 711 | 22.9 | 1410.2 | 590 | 19.0 | 1170.2 | 54 | 1.8 | 107.1 |
| 1994 | 843 | 27.2 | 1672.1 | 571 | 19.0 | 1132.6 | 454 | 14.6 | 900.5 | 41 | 1.3 | 81.3 | 34 | 1.1 | 67.4 |
| 1995 | 593 | 19.1 | 1176.2 | 747 | 24.9 | 1481.7 | 659 | 21.3 | 1307.1 | 774 | 25.0 | 1535.2 | 161 | 5.4 | 319.3 |
| 1996 | 435 | 14.0 | 862.8 | 1213 | 40.4 | 2406.0 | 728 | 23.5 | 1444.0 | 506 | 16.3 | 1003.6 | 174 | 5.8 | 345.1 |
| 1997 | 348 | 11.2 | 690.2 | 1209.5 | 40.3 | 2399.0 | 1027.5 | 33.1 | 2038.0 | 590.1 | 19.0 | 1170.4 | 150.4 | 5.0 | 298.3 |
| 1998 | 747.4 | 24.1 | 1482.4 | 1261.8 | 42.1 | 2502.7 | 902.9 | 29.1 | 1790.9 | 603 | 19.5 | 1196.0 | 231.7 | 7.7 | 459.6 |
| AVERAGES | 13.4 | 824.9 | 28.9 | 1720.9 | 22.2 | 1365.7 | 17.1 | 1052.1 | 8.3 | 494.0 | |||||