Wyoming State Water Plan
Wyoming State Water Plan
Wyoming Water Development Office
6920 Yellowtail Rd
Cheyenne, WY 82002
Phone: 307-777-7626

Wyoming Water Development Office
6920 Yellowtail Rd
Cheyenne, WY 82002
Phone: 307-777-7626


| SUBJECT: |
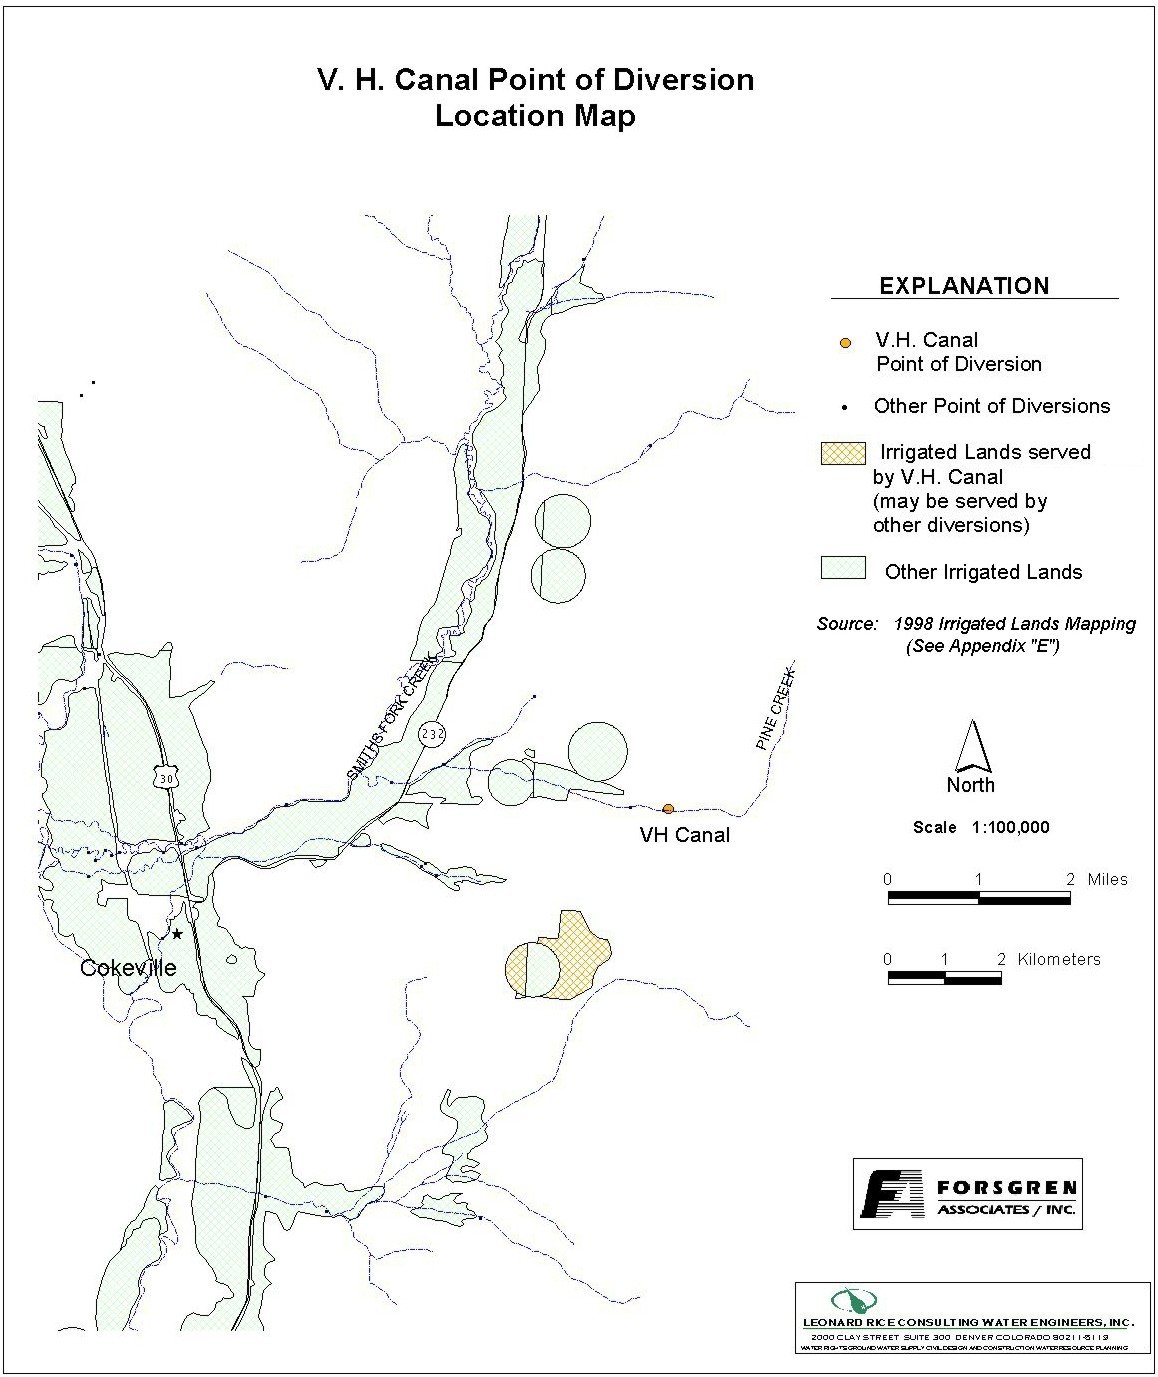
Appendix D Key Structures and Diversions V.H. CANAL DIVERSION |
| PREPARED BY: | Bear River Basin Planning Team |
| DATE: | August 7, 2000 |
| Diversion Description:The V.H. Canal headgate is an all steel structure with a 42-inch rectangular gate. Water is permanently ponded upstream of the structure. | 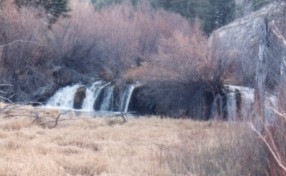 Pine Creek upstream of V.H. Canal diversion |
|
Conveyance Description: Open channel canal, approximately 10,560 feet in length.1
Direct Flow Water Rights:2
| Priority Date | Permit Number |
Permitted Use | Permitted Acres |
Flow (CFS) |
Cumulative (CFS) |
Comments |
|---|---|---|---|---|---|---|
| 07-10-1905 | 6811 | Irrigation, Domestic, Storage | 640 | 9.14 | 9.14 | Decreed Futile Call |
| 04-06-1910 | 2211E | Irrigation | 143.24 | 2.19 | Decreed Futile Call | |
| 06-11-1915 | 3226E | Irrigation, Domestic, Storage | 133.45 | 1.90 | 1.90 |
Associated Storage Rights: None
Irrigation Practices: Land is irrigated using circular pivots sprinklers. Less than 10% is flood irrigated.3
Estimated Diversion Efficiency:
Calculated Diversion Efficiency = Conveyance Efficiency X Application Efficiency:
Conveyance Efficiency: 55% Application Efficiency: 85% Overall Diversion Efficiency: 47% Conveyance efficiency is estimated by total length of main canal. Application efficiency for flood irrigation and sprinkler irrigation is estimated at 55% and 85% respectively.
Crop Types / Consumptive Use: The primary crop irrigated from this canal is alfalfa.3
Return Flows: Return flow is primarily captured by Sublette Creek and/or downstream diversions.
The following return flow pattern was adopted for modeling in this study are as follows:
		Month
      (after initial Diversion)	 Percent of Return
		0			50%
		1			25%
		2			15%
                3                       10%
                                       100%
Other Operational Information: Surface flows in Pine Creek tend to disappear into the ground by mid-July when diverting. Pine Creek was decreed a “futile call” by the courts, and as a result it is not regulated for the benefit of more senior water rights on Smiths Fork. There are only two irrigators taking water directly from Pine Creek.
References:
Monthly Diversion Records
V.H. Canal (on Pine Creek)
| YEAR | MAY | JUNE | JULY | AUGUST | SEPTEMBER | ||||||||||
|---|---|---|---|---|---|---|---|---|---|---|---|---|---|---|---|
| Total of Daily Ave for Month | Average CFS |
Monthly Total Ac-Ft |
Total of Daily Ave for Month | Average CFS |
Monthly Total Ac-Ft |
Total of Daily Ave for Month | Average CFS |
Monthly Total Ac-Ft |
Total of Daily Ave for Month | Average CFS |
Monthly Total Ac-Ft |
Total of Daily Ave for Month | Average CFS |
Monthly Total Ac-Ft | |
| 1970 | 196 | 6.3 | 388.8 | 240 | 8.0 | 476.0 | 258 | 8.3 | 511.7 | 243 | 7.8 | 482.0 | 160 | 5.3 | 317.4 |
| 1971 | 330 | 10.6 | 654.5 | 349 | 11.6 | 692.2 | 349 | 11.3 | 692.2 | 341 | 11.0 | 676.4 | 306 | 10.2 | 606.9 |
| 1972 | 12 | 0.4 | 23.8 | 375 | 12.5 | 743.8 | 370 | 11.9 | 733.9 | 297 | 9.6 | 589.1 | 289 | 9.6 | 573.2 |
| 1973 | 0 | 0.0 | 0.0 | 296 | 9.9 | 587.1 | 325 | 10.5 | 644.6 | 290 | 9.4 | 575.2 | 91 | 3.0 | 180.5 |
| 1974 | 220 | 7.1 | 436.4 | 366 | 12.2 | 726.0 | 328 | 10.6 | 650.6 | 279 | 9.0 | 553.4 | 270 | 9.0 | 535.5 |
| 1975 | 103 | 3.3 | 204.3 | 318 | 10.6 | 630.7 | 374 | 12.1 | 741.8 | 280 | 9.0 | 555.4 | 240 | 8.0 | 476.0 |
| 1976 | 185 | 6.0 | 366.9 | 337 | 11.2 | 668.4 | 331 | 10.7 | 656.5 | 343 | 11.1 | 680.3 | 86 | 2.9 | 170.6 |
| 1977 | 279 | 9.0 | 553.4 | 240 | 8.0 | 476.0 | 235 | 7.6 | 466.1 | 217 | 7.0 | 430.4 | 120 | 4.0 | 238.0 |
| 1978 | 311 | 10.0 | 616.9 | 278 | 9.3 | 551.4 | 317 | 10.2 | 628.8 | 350 | 11.3 | 694.2 | 154 | 5.1 | 305.5 |
| 1979 | 0 | 0.0 | 0.0 | 304 | 10.1 | 603.0 | 300 | 9.7 | 595.0 | 307 | 9.9 | 608.9 | 0 | 0.0 | 0.0 |
| 1980 | 208 | 6.7 | 412.6 | 475 | 15.8 | 942.1 | 447 | 14.4 | 886.6 | 326 | 10.5 | 646.6 | 341 | 11.4 | 676.4 |
| 1981 | 215 | 6.9 | 426.4 | 276 | 9.2 | 547.4 | 294 | 9.5 | 583.1 | 295 | 9.5 | 585.1 | 198 | 6.6 | 392.7 |
| 1982 | 326 | 10.5 | 646.6 | 409 | 13.6 | 811.2 | 343 | 11.1 | 680.3 | 332 | 10.7 | 658.5 | 363 | 12.1 | 720.0 |
| 1983 | 279 | 9.0 | 553.4 | 515 | 17.2 | 1021.5 | 328 | 10.6 | 650.6 | 443 | 14.3 | 878.7 | 238 | 7.9 | 472.1 |
| 1984 | 139 | 4.5 | 275.7 | 392 | 13.1 | 777.5 | 414 | 13.4 | 821.2 | 421 | 13.6 | 835.0 | 251 | 8.4 | 497.9 |
| 1985 | 130 | 4.2 | 257.9 | 414 | 13.8 | 821.2 | 391 | 12.6 | 775.5 | 456 | 14.7 | 904.5 | 434 | 14.5 | 860.8 |
| 1986 | 165 | 5.3 | 327.3 | 402 | 13.4 | 797.4 | 352 | 11.4 | 698.2 | 506 | 16.3 | 1003.6 | 157 | 5.2 | 311.4 |
| 1987 | 282 | 9.1 | 559.3 | 276 | 9.2 | 547.4 | 348 | 11.2 | 690.2 | 339 | 10.9 | 672.4 | 85 | 2.8 | 168.6 |
| 1988 | 53 | 1.7 | 105.1 | 330 | 11.0 | 654.5 | 325 | 10.5 | 644.6 | 313 | 10.1 | 620.8 | 165 | 5.5 | 327.3 |
| 1989 | 268 | 8.6 | 531.6 | 250 | 8.3 | 495.9 | 248 | 8.0 | 491.9 | 248 | 8.0 | 491.9 | 240 | 8.0 | 476.0 |
| 1990 | 255 | 8.2 | 505.8 | 284 | 9.5 | 563.3 | 240 | 7.7 | 476.0 | 164 | 5.3 | 325.3 | 0 | 0.0 | 0.0 |
| 1991 | 178 | 5.7 | 353.1 | 359 | 12.0 | 712.1 | 330 | 10.6 | 654.5 | 259 | 8.4 | 513.7 | 168 | 5.6 | 333.2 |
| 1992 | 243 | 7.8 | 482.0 | 270 | 9.0 | 535.5 | 81 | 2.6 | 160.7 | 0 | 0.0 | 0.0 | 0 | 0.0 | 0.0 |
| 1993 | 103 | 3.3 | 204.3 | 299 | 10.0 | 593.1 | 289 | 9.3 | 573.2 | 276 | 8.9 | 547.4 | 132 | 4.4 | 261.8 |
| 1994 | 119 | 3.8 | 236.0 | 293 | 9.8 | 581.2 | 282 | 9.1 | 559.3 | 314 | 10.1 | 622.8 | 234 | 7.8 | 464.1 |
| 1995 | 498 | 16.1 | 987.8 | 366 | 12.2 | 726.0 | 225 | 7.3 | 446.3 | 320 | 10.3 | 634.7 | 318 | 10.6 | 630.7 |
| 1996 | 138 | 4.5 | 273.7 | 406 | 13.5 | 805.3 | 395 | 12.7 | 783.5 | 465 | 15.0 | 922.3 | 376 | 12.5 | 745.8 |
| 1997 | 251.9 | 8.1 | 499.6 | 343.6 | 11.5 | 681.5 | 287.6 | 9.3 | 570.4 | 409.4 | 13.2 | 812.0 | 377.7 | 12.6 | 749.2 |
| 1998 | 313.3 | 10.1 | 621.4 | 410.4 | 13.7 | 814.0 | 329.1 | 10.6 | 652.8 | 359.3 | 11.6 | 712.7 | 235.4 | 7.8 | 466.9 |
| AVERAGES | 6.5 | 396.7 | 11.3 | 675.3 | 10.2 | 624.8 | 10.2 | 628.7 | 6.9 | 412.4 | |||||