Wyoming State Water Plan
Wyoming State Water Plan
Wyoming Water Development Office
6920 Yellowtail Rd
Cheyenne, WY 82002
Phone: 307-777-7626

Wyoming Water Development Office
6920 Yellowtail Rd
Cheyenne, WY 82002
Phone: 307-777-7626


| SUBJECT: |
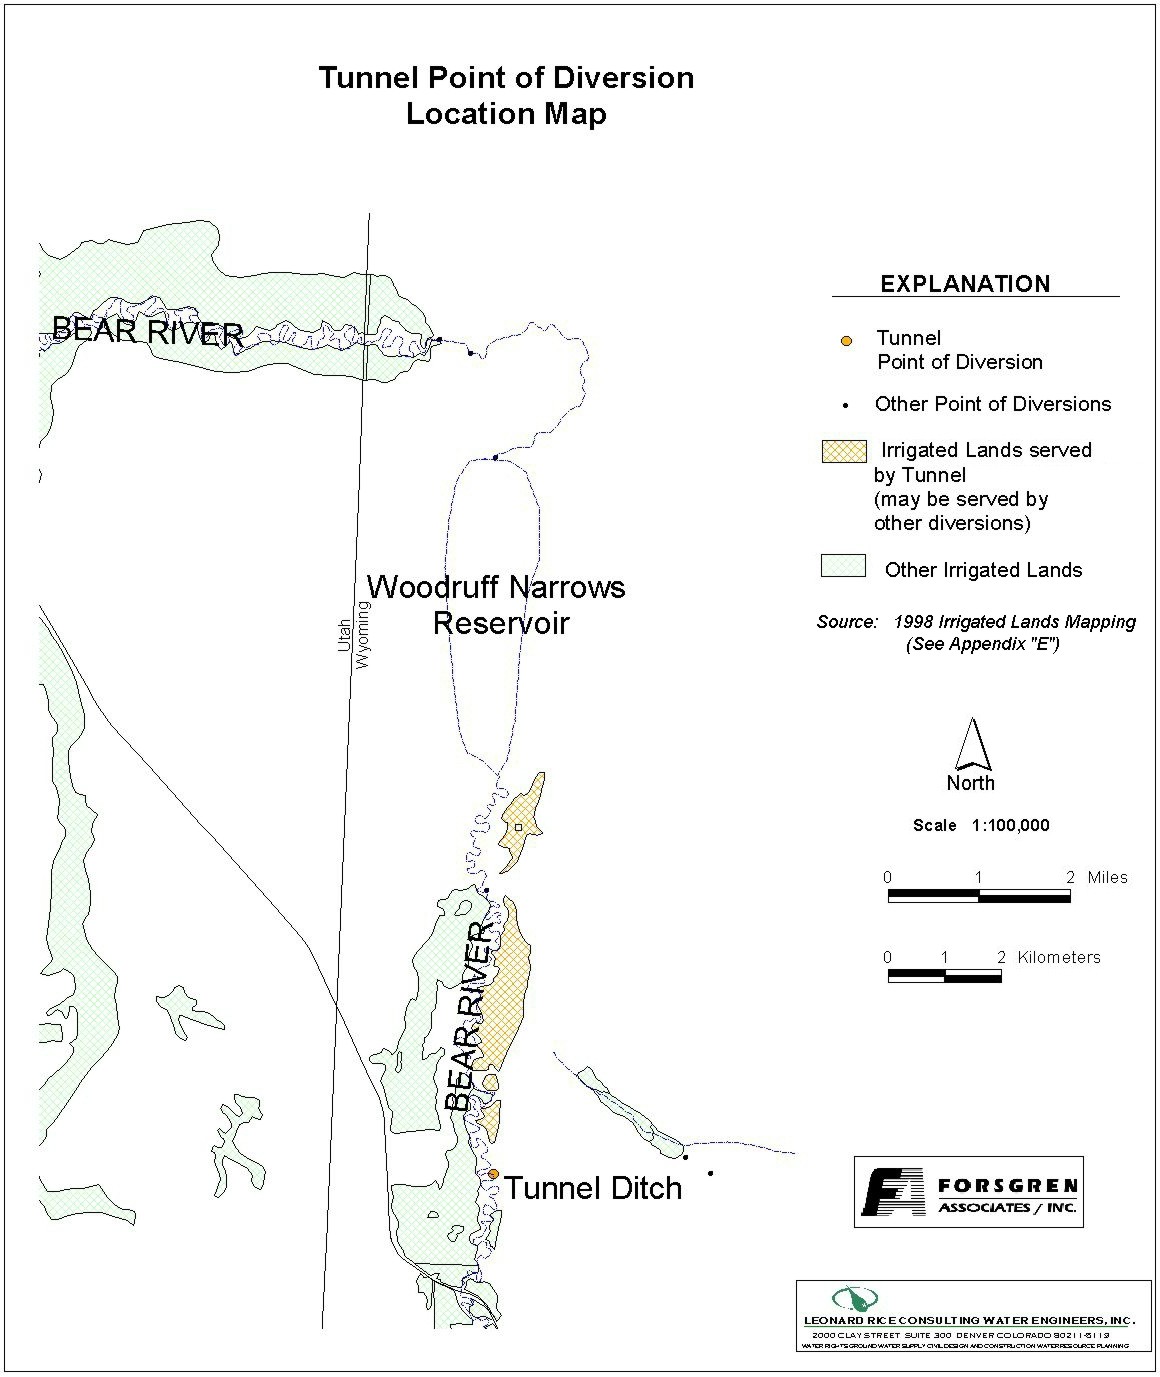
Appendix D Key Structures and Diversions TUNNEL DITCH DIVERSION |
| PREPARED BY: | Bear River Basin Planning Team |
| DATE: | August 7, 2000 |
| Diversion Description:The headgate structure consists of a concrete headwall with a 72-inch CMP culvert and steel slide gate. The culvert was partially filled with sedimentation at the time of inspection. | 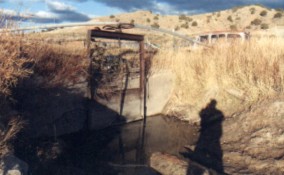 Tunnel Ditch headgate |
|
Conveyance Description: Open channel canal, approximately 21,120 feet in length.1
Direct Flow Water Rights:2
| Priority Date | Permit Number |
Permitted Use | Permitted Acres |
Flow (CFS) |
Cumulative (CFS) |
Comments |
|---|---|---|---|---|---|---|
| -1886 | Terr | Irrigation | 80 | 1.14 | 1.14 | |
| -1886 | Terr | Irrigation | 479 | 6.84 | 7.98 | 641 acres less 162 inundated |
| -1886 | Terr | Irrigation | 23 | 0.32 | 8.30 | 29 acres less 6 inundated |
| 07-15-1912 | 2643E | Irrigation | 38 | 0.54 | 8.84 |
Associated Storage Rights: None
Irrigation Practices: Lands are flood irrigated.3
Estimated Diversion Efficiency:
Calculated Diversion Efficiency = Conveyance Efficiency X Application Efficiency:
Conveyance Efficiency: 65% Application Efficiency: 55% Overall Diversion Efficiency: 36% Conveyance efficiency is estimated by total length of main canal. Application efficiency for flood irrigation and sprinkler irrigation is estimated at 55% and 85% respectively.
Crop Types / Consumptive Use: Water is used entirely to irrigate mixed meadow grasses, primarily Meadow Foxtail, etc.3
Return Flows: Return flow is primarily captured by Woodruff Narrows.
The following return flow pattern was adopted for modeling in this study are as follows:
		Month
      (after initial Diversion)	 Percent of Return
		0			70%
		1			20%
		2			10%
                                       100%
Other Operational Information: Part of the lands originally permitted and irrigated by this ditch (approximately 168 acres) were inundated with the enlargement of the Woodruff Narrows reservoir. No filings were ever made for abandonment or transfer of those rights.3
References:
Monthly Diversion Records
Tunnel
| YEAR | MAY | JUNE | JULY | AUGUST | SEPTEMBER | ||||||||||
|---|---|---|---|---|---|---|---|---|---|---|---|---|---|---|---|
| Total of Daily Ave for Month | Average CFS |
Monthly Total Ac-Ft |
Total of Daily Ave for Month | Average CFS |
Monthly Total Ac-Ft |
Total of Daily Ave for Month | Average CFS |
Monthly Total Ac-Ft |
Total of Daily Ave for Month | Average CFS |
Monthly Total Ac-Ft |
Total of Daily Ave for Month | Average CFS |
Monthly Total Ac-Ft | |
| *1970 | |||||||||||||||
| 1971 | 179 | 5.8 | 355.0 | 885 | 29.5 | 1755.4 | 371 | 12.0 | 735.9 | 291 | 9.4 | 577.2 | 291 | 9.7 | 577.2 |
| 1972 | 265 | 8.5 | 525.6 | 1238 | 41.3 | 2455.5 | 422 | 13.6 | 837.0 | 338 | 10.9 | 670.4 | 224 | 7.5 | 444.3 |
| 1973 | 89 | 2.9 | 176.5 | 1031 | 34.4 | 2045.0 | 547 | 17.6 | 1085.0 | 247 | 8.0 | 489.9 | 150 | 5.0 | 297.5 |
| 1974 | 254 | 8.2 | 503.8 | 1145 | 38.2 | 2271.1 | 290 | 9.4 | 575.2 | 383 | 12.4 | 759.7 | 88 | 2.9 | 174.5 |
| 1975 | 19 | 0.6 | 37.7 | 970 | 32.3 | 1924.0 | 739 | 23.8 | 1465.8 | 290 | 9.4 | 575.2 | 274 | 9.1 | 543.5 |
| 1976 | 81 | 2.6 | 160.7 | 544 | 18.1 | 1079.0 | 282 | 9.1 | 559.3 | 43 | 1.4 | 85.3 | 61 | 2.0 | 121.0 |
| 1977 | 186 | 6.0 | 368.9 | 439 | 14.6 | 870.7 | 46 | 1.5 | 91.2 | 0 | 0.0 | 0.0 | 18 | 0.6 | 35.7 |
| 1978 | 0 | 0.0 | 0.0 | 920 | 30.7 | 1824.8 | 416 | 13.4 | 825.1 | 18 | 0.6 | 35.7 | 0 | 0.0 | 0.0 |
| 1979 | 281 | 9.1 | 557.4 | 681 | 22.7 | 1350.7 | 491 | 15.8 | 973.9 | 204 | 6.6 | 404.6 | 11 | 0.4 | 21.8 |
| 1980 | 108 | 3.5 | 214.2 | 893 | 29.8 | 1771.2 | 174 | 5.6 | 345.1 | 0 | 0.0 | 0.0 | 0 | 0.0 | 0.0 |
| 1981 | 304 | 9.8 | 603.0 | 751 | 25.0 | 1489.6 | 256 | 8.3 | 507.8 | 42 | 1.4 | 83.3 | 162 | 5.4 | 321.3 |
| 1982 | 159 | 5.1 | 315.4 | 901 | 30.0 | 1787.1 | 311 | 10.0 | 616.9 | 0 | 0.0 | 0.0 | 0 | 0.0 | 0.0 |
| 1983 | 8 | 0.3 | 15.9 | 804 | 26.8 | 1594.7 | 518 | 16.7 | 1027.4 | 44 | 1.4 | 87.3 | 0 | 0.0 | 0.0 |
| 1984 | 120 | 3.9 | 238.0 | 737 | 24.6 | 1461.8 | 179 | 5.8 | 355.0 | 25 | 0.8 | 49.6 | 169 | 5.6 | 335.2 |
| 1985 | 241 | 7.8 | 478.0 | 516 | 17.2 | 1023.5 | 204 | 6.6 | 404.6 | 171 | 5.5 | 339.2 | 72 | 2.4 | 142.8 |
| 1986 | 242 | 7.8 | 480.0 | 851 | 28.4 | 1687.9 | 149 | 4.8 | 295.5 | 248 | 8.0 | 491.9 | 223 | 7.4 | 442.3 |
| 1987 | 572 | 18.5 | 1134.5 | 1191 | 39.7 | 2362.3 | 146 | 4.7 | 289.6 | 12 | 0.4 | 23.8 | 191 | 6.4 | 378.8 |
| 1988 | 486 | 15.7 | 964.0 | 777 | 25.9 | 1541.2 | 123 | 4.0 | 244.0 | 4 | 0.1 | 7.9 | 84 | 2.8 | 166.6 |
| 1989 | 864 | 27.9 | 1713.7 | 845 | 28.2 | 1676.0 | 293 | 9.5 | 581.2 | 89 | 2.9 | 176.5 | 125 | 4.2 | 247.9 |
| 1990 | 269 | 8.7 | 533.6 | 994 | 33.1 | 1971.6 | 262 | 8.5 | 519.7 | 153 | 4.9 | 303.5 | 67 | 2.2 | 132.9 |
| 1991 | 720 | 23.2 | 1428.1 | 806 | 26.9 | 1598.7 | 80 | 2.6 | 158.7 | 67 | 2.2 | 132.9 | 145 | 4.8 | 287.6 |
| 1992 | 220 | 7.1 | 436.4 | 342 | 11.4 | 678.3 | 38 | 1.2 | 75.4 | 0 | 0.0 | 0.0 | 26 | 0.9 | 51.6 |
| 1993 | 410 | 13.2 | 813.2 | 656 | 21.9 | 1301.2 | 70 | 2.3 | 138.8 | 3 | 0.1 | 6.0 | 10 | 0.3 | 19.8 |
| 1994 | 296 | 9.5 | 587.1 | 315 | 10.5 | 624.8 | 177 | 5.7 | 351.1 | 2 | 0.1 | 4.0 | 38 | 1.3 | 75.4 |
| 1995 | 13 | 0.4 | 25.8 | 901 | 30.0 | 1787.1 | 402 | 13.0 | 797.4 | 1 | 0.0 | 2.0 | 0 | 0.0 | 0.0 |
| 1996 | 539 | 17.4 | 1069.1 | 839 | 28.0 | 1664.1 | 10 | 0.3 | 19.8 | 0 | 0.0 | 0.0 | 1 | 0.0 | 2.0 |
| 1997 | 334.1 | 10.8 | 662.7 | 145.9 | 4.9 | 289.4 | 7.6 | 0.2 | 15.1 | 59.6 | 1.9 | 118.2 | 64.4 | 2.1 | 127.7 |
| 1998 | 181.4 | 5.9 | 359.8 | 169.9 | 5.7 | 337.0 | 262.7 | 8.5 | 521.1 | 16.5 | 0.5 | 32.7 | 0 | 0.0 | 0.0 |
| 1999 | 236 | 7.6 | 468.1 | 511 | 17.0 | 1013.6 | 42 | 1.4 | 83.3 | 3 | 0.1 | 6.0 | 3 | 0.1 | 6.0 |
| AVERAGES | 8.5 | 525.0 | 25.1 | 1490.9 | 8.1 | 499.9 | 3.1 | 188.4 | 2.9 | 170.8 | |||||