Wyoming State Water Plan
Wyoming State Water Plan
Wyoming Water Development Office
6920 Yellowtail Rd
Cheyenne, WY 82002
Phone: 307-777-7626

Wyoming Water Development Office
6920 Yellowtail Rd
Cheyenne, WY 82002
Phone: 307-777-7626


| SUBJECT: |
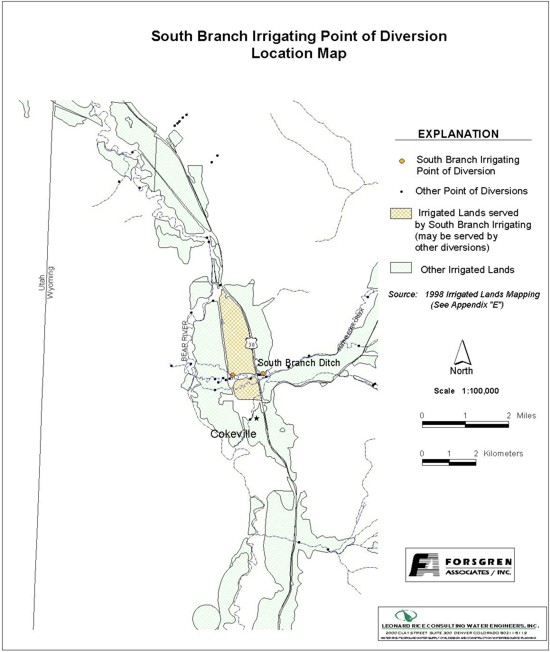
Appendix D Key Structures and Diversions SOUTH BRANCH IRRIGATING DIVERSION |
| PREPARED BY: | Bear River Basin Planning Team |
| DATE: | August 7, 2000 |
| Diversion Description: The South Branch Irrigating headgate consists of a 48-inch culvert with a canal gate. There is no headwall. The bank at the diversion is experiencing significant erosion. | 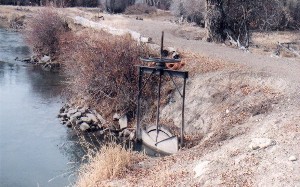 South Branch Irrigating headgate structure |
|
Conveyance Description: Open channel canal, approximately 10,560 feet in length.1
Direct Flow Water Rights:2
| Priority Date | Permit Number |
Permitted Use | Permitted Acres |
Flow (CFS) |
Cumulative (CFS) |
Comments |
|---|---|---|---|---|---|---|
| 06-16-1887 | Terr | Irrigation, Domestic, Storage | 435 | 6.21 | 6.21 | |
| 05-30-1903 | 1065E | Irrigation, Domestic, Storage | 115 | 1.64 | 7.85 | |
| 08-26-1937 | 5081E | Irrigation | 82 | 1.17 | 9.02 |
Irrigation Practices: Approximately 60% of the land is irrigated using hand line or wheel roll sprinklers. The remaining 40% is flood irrigated.3
Estimated Diversion Efficiency:
Calculated Diversion Efficiency = Conveyance Efficiency X Application Efficiency:
Conveyance Efficiency: 60% Application Efficiency: 70% Overall Diversion Efficiency: 42% Conveyance efficiency is estimated by total length of main canal. Application efficiency for flood irrigation and sprinkler irrigation is estimated at 55% and 85% respectively.
Crop Types / Consumptive Use: Irrigated acreage is primarily alfalfa and grain (mostly oats). Crops are rotated.3
Return Flows: Return flow is received directly into the Bear River.
The following return flow pattern was adopted for modeling in this study are as follows:
		Month
      (after initial Diversion)	 Percent of Return
		0			50%
		1			25%
		2			15%
                3                       10%
                                       100%
References:
Monthly Diversion Records
South Branch Irrigating (on the North Channel of Smiths Fork)
| YEAR | MAY | JUNE | JULY | AUGUST | SEPTEMBER | ||||||||||
|---|---|---|---|---|---|---|---|---|---|---|---|---|---|---|---|
| Total of Daily Ave for Month | Average CFS |
Monthly Total Ac-Ft |
Total of Daily Ave for Month | Average CFS |
Monthly Total Ac-Ft |
Total of Daily Ave for Month | Average CFS |
Monthly Total Ac-Ft |
Total of Daily Ave for Month | Average CFS |
Monthly Total Ac-Ft |
Total of Daily Ave for Month | Average CFS |
Monthly Total Ac-Ft | |
| 1970 | 0 | 0.0 | 0.0 | 988 | 32.9 | 1959.7 | 221 | 7.1 | 438.3 | 191 | 6.2 | 378.8 | 4 | 0.1 | 7.9 |
| 1971 | 0 | 0.0 | 0.0 | 260 | 8.7 | 515.7 | 405 | 13.1 | 803.3 | 471 | 15.2 | 934.2 | 0 | 0.0 | 0.0 |
| 1972 | 0 | 0.0 | 0.0 | 60 | 2.0 | 119.0 | 36 | 1.2 | 71.4 | 0 | 0.0 | 0.0 | 0 | 0.0 | 0.0 |
| 1973 | 0 | 0.0 | 0.0 | 313 | 10.4 | 620.8 | 475 | 15.3 | 942.1 | 357 | 11.5 | 708.1 | 335 | 11.2 | 664.5 |
| 1974 | 316 | 10.2 | 626.8 | 624 | 20.8 | 1237.7 | 440 | 14.2 | 872.7 | 338 | 10.9 | 670.4 | 0 | 0.0 | 0.0 |
| 1975 | 749 | 24.2 | 1485.6 | 923 | 30.8 | 1830.7 | 56 | 1.8 | 111.1 | 804 | 25.9 | 1594.7 | 0 | 0.0 | 0.0 |
| 1976 | 227 | 7.3 | 450.2 | 554 | 18.5 | 1098.8 | 42 | 1.4 | 83.3 | 662 | 21.4 | 1313.1 | 30 | 1.0 | 59.5 |
| 1977 | 156 | 5.0 | 309.4 | 170 | 5.7 | 337.2 | 0 | 0.0 | 0.0 | 0 | 0.0 | 0.0 | 0 | 0.0 | 0.0 |
| 1978 | 1498 | 48.3 | 2971.2 | 1289 | 43.0 | 2556.7 | 0 | 0.0 | 0.0 | 0 | 0.0 | 0.0 | 181 | 6.0 | 359.0 |
| 1979 | 641 | 20.7 | 1271.4 | 781 | 26.0 | 1549.1 | 491 | 15.8 | 973.9 | 18 | 0.6 | 35.7 | 0 | 0.0 | 0.0 |
| 1980 | 89 | 2.9 | 176.5 | 406 | 13.5 | 805.3 | 435 | 14.0 | 862.8 | 409 | 13.2 | 811.2 | 0 | 0.0 | 0.0 |
| 1981 | 507 | 16.4 | 1005.6 | 639 | 21.3 | 1267.4 | 295 | 9.5 | 585.1 | 126 | 4.1 | 249.9 | 12 | 0.4 | 23.8 |
| 1982 | 821 | 26.5 | 1628.4 | 913 | 30.4 | 1810.9 | 611 | 19.7 | 1211.9 | 319 | 10.3 | 632.7 | 97 | 3.2 | 192.4 |
| 1983 | 911 | 29.4 | 1806.9 | 1930 | 64.3 | 3828.1 | 841 | 27.1 | 1668.1 | 292 | 9.4 | 579.2 | 0 | 0.0 | 0.0 |
| 1984 | 508 | 16.4 | 1007.6 | 1663 | 55.4 | 3298.5 | 694 | 22.4 | 1376.5 | 196 | 6.3 | 388.8 | 30 | 1.0 | 59.5 |
| 1985 | 194 | 6.3 | 384.8 | 744 | 24.8 | 1475.7 | 422 | 13.6 | 837.0 | 0 | 0.0 | 0.0 | 5 | 0.2 | 9.9 |
| 1986 | 1320 | 42.6 | 2618.2 | 2139 | 71.3 | 4242.6 | 1396 | 45.0 | 2768.9 | 371 | 12.0 | 735.9 | 132 | 4.4 | 261.8 |
| 1987 | 365 | 11.8 | 724.0 | 426 | 14.2 | 845.0 | 202 | 6.5 | 400.7 | 76 | 2.5 | 150.7 | 346 | 11.5 | 686.3 |
| 1988 | 502 | 16.2 | 995.7 | 563 | 18.8 | 1116.7 | 260 | 8.4 | 515.7 | 62 | 2.0 | 123.0 | 60 | 2.0 | 119.0 |
| 1989 | 429 | 13.8 | 850.9 | 672 | 22.4 | 1332.9 | 367 | 11.8 | 727.9 | 230 | 7.4 | 456.2 | 180 | 6.0 | 357.0 |
| 1990 | 1314 | 42.4 | 2606.3 | 894 | 29.8 | 1773.2 | 308 | 9.9 | 610.9 | 146 | 4.7 | 289.6 | 0 | 0.0 | 0.0 |
| 1991 | 501 | 16.2 | 993.7 | 403 | 13.4 | 799.3 | 364 | 11.7 | 722.0 | 218 | 7.0 | 432.4 | 153 | 5.1 | 303.5 |
| 1992 | 202 | 6.5 | 400.7 | 180 | 6.0 | 357.0 | 186 | 6.0 | 368.9 | 54 | 1.7 | 107.1 | 0 | 0.0 | 0.0 |
| 1993 | 294 | 9.5 | 583.1 | 775 | 25.8 | 1537.2 | 593 | 19.1 | 1176.2 | 236 | 7.6 | 468.1 | 95 | 3.2 | 188.4 |
| 1994 | 261 | 8.4 | 517.7 | 257 | 8.6 | 509.8 | 136 | 4.4 | 269.8 | 7 | 0.2 | 13.9 | 54 | 1.8 | 107.1 |
| 1995 | 629 | 20.3 | 1247.6 | 636 | 21.2 | 1261.5 | 512 | 16.5 | 1015.5 | 286 | 9.2 | 567.3 | 216 | 7.2 | 428.4 |
| 1996 | 435 | 14.0 | 862.8 | 855 | 28.5 | 1695.9 | 295 | 9.5 | 585.1 | 303 | 9.8 | 601.0 | 155 | 5.2 | 307.4 |
| 1997 | 473.7 | 15.3 | 939.6 | 514.5 | 17.2 | 1020.5 | 286.8 | 9.3 | 568.9 | 381.8 | 12.3 | 757.3 | 246.4 | 8.2 | 488.7 |
| 1998 | 656.2 | 21.2 | 1301.6 | 608.6 | 20.3 | 1207.1 | 338.9 | 10.9 | 672.2 | 454.6 | 14.7 | 901.7 | 262.1 | 8.7 | 519.9 |
| AVERAGES | 15.6 | 957.5 | 24.3 | 1448.6 | 11.9 | 732.4 | 7.8 | 479.3 | 3.0 | 177.4 | |||||