Wyoming State Water Plan
Wyoming State Water Plan
Wyoming Water Development Office
6920 Yellowtail Rd
Cheyenne, WY 82002
Phone: 307-777-7626

Wyoming Water Development Office
6920 Yellowtail Rd
Cheyenne, WY 82002
Phone: 307-777-7626


| SUBJECT: |
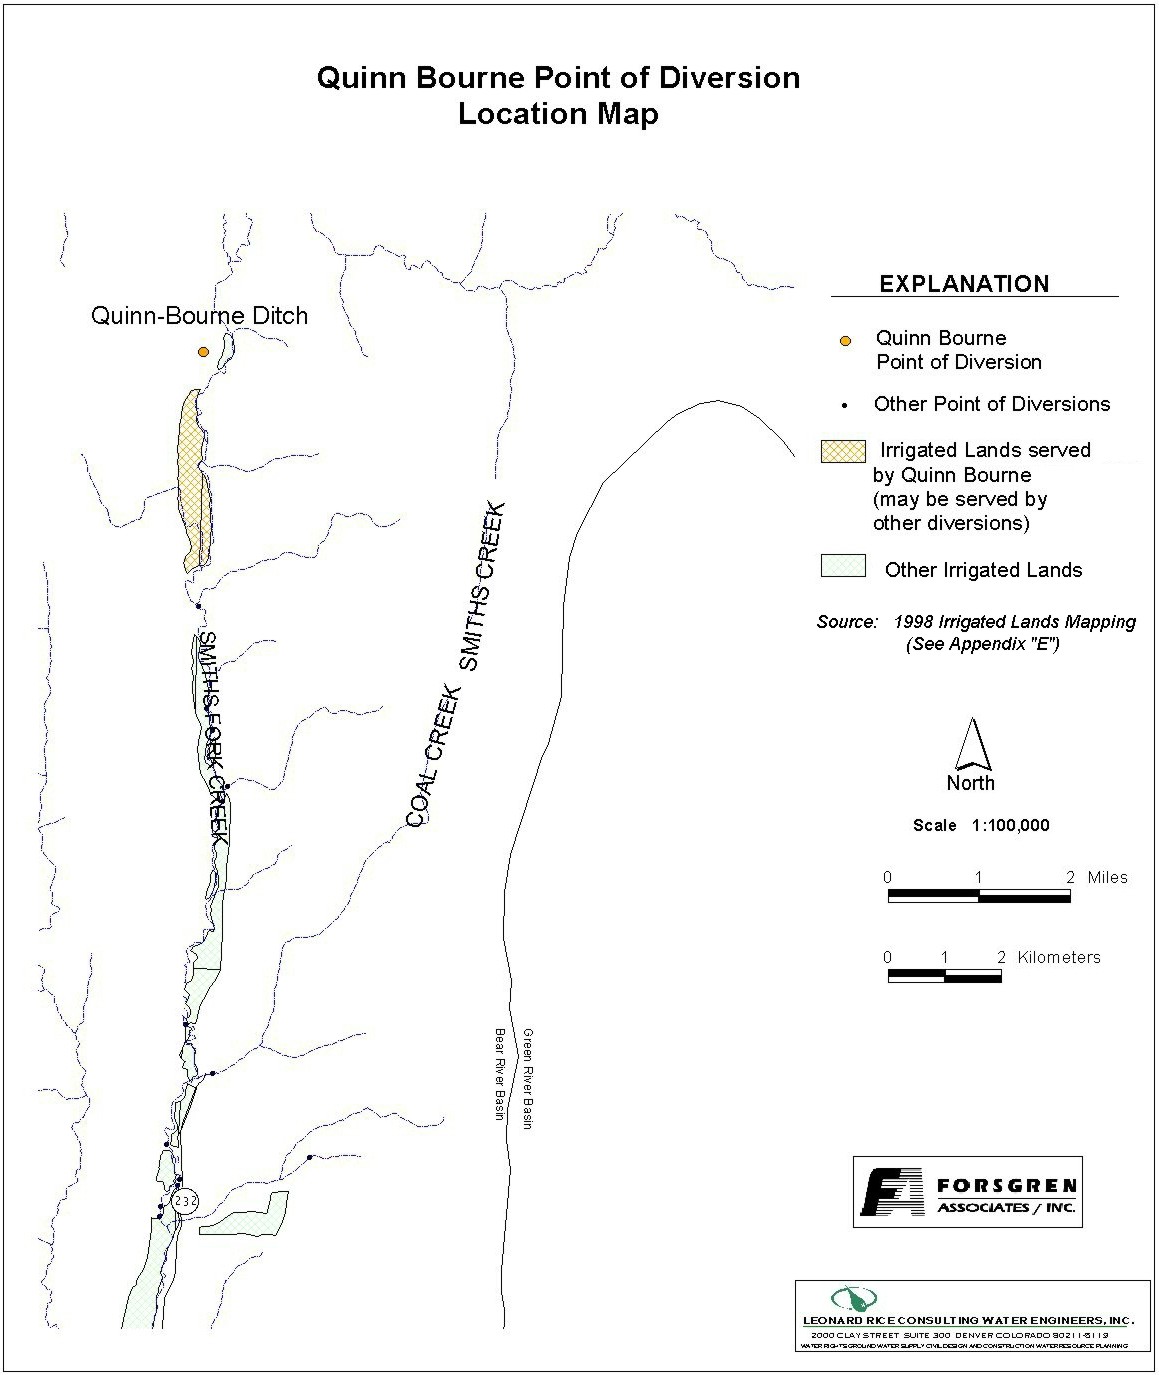
Appendix D Key Structures and Diversions QUINN BOURNE DIVERSION |
| PREPARED BY: | Bear River Basin Planning Team |
| DATE: | August 7, 2000 |
| Diversion Description: The Quinn Bourne headgate consists of a wooden headwall with a 30- inch culvert and a steel slide gate. | 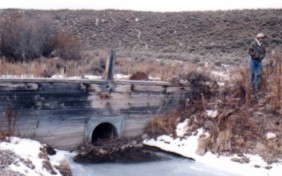 Quinn Bourne headgate structure |
|
Conveyance Description: Open channel canal.1
Direct Flow Water Rights:2
| Priority Date | Permit Number |
Permitted Use | Permitted Acres |
Flow (CFS) |
Cumulative (CFS) |
Comments |
|---|---|---|---|---|---|---|
| 11-26-1904 | 6350 | Irrigation, Storage | 135 | 1.92 | 1.92 | |
| 11-26-1904 | 6350 | Irrigation, Storage | 130 | 1.85 | 3.77 | |
| 10-27-1908 | 2002E | Irrigation, Storage | 203 | 2.90 | 6.67 | |
| 11-18-1915 | 3517E | Irrigation | 76 | 1.09 | 7.76 |
Associated Storage Rights: None
Irrigation Practices: Land is flood irrigated.3
Estimated Diversion Efficiency:
Calculated Diversion Efficiency = Conveyance Efficiency X Application Efficiency:
Conveyance Efficiency: 65% Application Efficiency: 55% Overall Diversion Efficiency: 36% Conveyance efficiency is estimated by total length of main canal. Application efficiency for flood irrigation and sprinkler irrigation is estimated at 55% and 85% respectively.
Crop Types / Consumptive Use: Water is used entirely to irrigate meadow grasses, primarily Timothy, Meadow Foxtail, etc.3
Return Flows: Return flow is primarily captured by Francis Larson ditch.
The following return flow pattern was adopted for modeling in this study are as follows:
		Month
      (after initial Diversion)	 Percent of Return
		0			70%
		1			20%
		2			10%
                3                        0%
                                       100%
References:
Monthly Diversion Records
Quinn Bourne (on Smith's Fork)
| YEAR | MAY | JUNE | JULY | AUGUST | SEPTEMBER | ||||||||||
|---|---|---|---|---|---|---|---|---|---|---|---|---|---|---|---|
| Total of Daily Ave for Month | Average CFS |
Monthly Total Ac-Ft |
Total of Daily Ave for Month | Average CFS |
Monthly Total Ac-Ft |
Total of Daily Ave for Month | Average CFS |
Monthly Total Ac-Ft |
Total of Daily Ave for Month | Average CFS |
Monthly Total Ac-Ft |
Total of Daily Ave for Month | Average CFS |
Monthly Total Ac-Ft | |
| 1970 | 0 | 0.0 | 0.0 | 151 | 5.0 | 299.5 | 490 | 15.8 | 971.9 | 256 | 8.3 | 507.8 | 48 | 1.6 | 95.2 |
| 1971 | 256 | 8.3 | 507.8 | 260 | 8.7 | 515.7 | 351 | 11.3 | 696.2 | 184 | 5.9 | 365.0 | 21 | 0.7 | 41.7 |
| 1972 | 186 | 6.0 | 368.9 | 190 | 6.3 | 376.9 | 111 | 3.6 | 220.2 | 190 | 6.1 | 376.9 | 90 | 3.0 | 178.5 |
| 1973 | 0 | 0.0 | 0.0 | 210 | 7.0 | 416.5 | 237 | 7.6 | 470.1 | 105 | 3.4 | 208.3 | 79 | 2.6 | 156.7 |
| 1974 | 103 | 3.3 | 204.3 | 370 | 12.3 | 733.9 | 324 | 10.5 | 642.6 | 156 | 5.0 | 309.4 | 68 | 2.3 | 134.9 |
| 1975 | 0 | 0.0 | 0.0 | 0 | 0.0 | 0.0 | 385 | 12.4 | 763.6 | 153 | 4.9 | 303.5 | 79 | 2.6 | 156.7 |
| 1976 | 0 | 0.0 | 0.0 | 267 | 8.9 | 529.6 | 245 | 7.9 | 486.0 | 87 | 2.8 | 172.6 | 17 | 0.6 | 33.7 |
| 1977 | 0 | 0.0 | 0.0 | 0 | 0.0 | 0.0 | 0 | 0.0 | 0.0 | 0 | 0.0 | 0.0 | 0 | 0.0 | 0.0 |
| 1978 | 73 | 2.4 | 144.8 | 295 | 9.8 | 585.1 | 242 | 7.8 | 480.0 | 127 | 4.1 | 251.9 | 2 | 0.1 | 4.0 |
| 1979 | 111 | 3.6 | 220.2 | 287 | 9.6 | 569.3 | 110 | 3.5 | 218.2 | 161 | 5.2 | 319.3 | 41 | 1.4 | 81.3 |
| 1980 | 80 | 2.6 | 158.7 | 385 | 12.8 | 763.6 | 212 | 6.8 | 420.5 | 57 | 1.8 | 113.1 | 9 | 0.3 | 17.9 |
| 1981 | 205 | 6.6 | 406.6 | 209 | 7.0 | 414.5 | 89 | 2.9 | 176.5 | 117 | 3.8 | 232.1 | 7 | 0.2 | 13.9 |
| 1982 | 79 | 2.5 | 156.7 | 386 | 12.9 | 765.6 | 317 | 10.2 | 628.8 | 193 | 6.2 | 382.8 | 75 | 2.5 | 148.8 |
| 1983 | 153 | 4.9 | 303.5 | 371 | 12.4 | 735.9 | 416 | 13.4 | 825.1 | 207 | 6.7 | 410.6 | 65 | 2.2 | 128.9 |
| 1984 | 39 | 1.3 | 77.4 | 162 | 5.4 | 321.3 | 382 | 12.3 | 757.7 | 353 | 11.4 | 700.2 | 0 | 0.0 | 0.0 |
| 1985 | 128 | 4.1 | 253.9 | 324 | 10.8 | 642.6 | 305 | 9.8 | 605.0 | 135 | 4.4 | 267.8 | 58 | 1.9 | 115.0 |
| 1986 | 77 | 2.5 | 152.7 | 344 | 11.5 | 682.3 | 294 | 9.5 | 583.1 | 146 | 4.7 | 289.6 | 10 | 0.3 | 19.8 |
| 1987 | 0 | 0.0 | 0.0 | 169 | 5.6 | 335.2 | 25 | 0.8 | 49.6 | 0 | 0.0 | 0.0 | 0 | 0.0 | 0.0 |
| 1988 | 521 | 16.8 | 1033.4 | 288 | 9.6 | 571.2 | 134 | 4.3 | 265.8 | 11 | 0.4 | 21.8 | 0 | 0.0 | 0.0 |
| 1989 | 417 | 13.5 | 827.1 | 373 | 12.4 | 739.8 | 171 | 5.5 | 339.2 | 106 | 3.4 | 210.2 | 14 | 0.5 | 27.8 |
| 1990 | 147 | 4.7 | 291.6 | 204 | 6.8 | 404.6 | 104 | 3.4 | 206.3 | 0 | 0.0 | 0.0 | 0 | 0.0 | 0.0 |
| 1991 | 54 | 1.7 | 107.1 | 225 | 7.5 | 446.3 | 247 | 8.0 | 489.9 | 29 | 0.9 | 57.5 | 0 | 0.0 | 0.0 |
| 1992 | 108 | 3.5 | 214.2 | 107 | 3.6 | 212.2 | 124 | 4.0 | 246.0 | 0 | 0.0 | 0.0 | 0 | 0.0 | 0.0 |
| 1993 | 12 | 0.4 | 23.8 | 0 | 0.0 | 0.0 | 36 | 1.2 | 71.4 | 57 | 1.8 | 113.1 | 116 | 3.9 | 230.1 |
| 1994 | 55 | 1.8 | 109.1 | 141 | 4.7 | 279.7 | 36 | 1.2 | 71.4 | 0 | 0.0 | 0.0 | 0 | 0.0 | 0.0 |
| 1995 | 428 | 13.8 | 848.9 | 219 | 7.3 | 434.4 | 71 | 2.3 | 140.8 | 71 | 2.3 | 140.8 | 8 | 0.3 | 15.9 |
| 1996 | 17 | 0.5 | 33.7 | 168 | 5.6 | 333.2 | 196 | 6.3 | 388.8 | 172 | 5.5 | 341.2 | 35 | 1.2 | 69.4 |
| 1997 | 72.6 | 2.3 | 144.0 | 3.6 | 0.1 | 7.1 | 123.3 | 4.0 | 244.6 | 60 | 1.9 | 119.0 | 17.7 | 0.6 | 35.1 |
| 1998 | 156.2 | 5.0 | 309.8 | 218.8 | 7.3 | 434.0 | 121.5 | 3.9 | 241.0 | 68 | 2.2 | 134.9 | 26.8 | 0.9 | 53.2 |
| AVERAGES | 3.9 | 237.9 | 7.3 | 432.8 | 6.6 | 403.5 | 3.6 | 218.9 | 1.0 | 60.6 | |||||