Wyoming State Water Plan
Wyoming State Water Plan
Wyoming Water Development Office
6920 Yellowtail Rd
Cheyenne, WY 82002
Phone: 307-777-7626

Wyoming Water Development Office
6920 Yellowtail Rd
Cheyenne, WY 82002
Phone: 307-777-7626


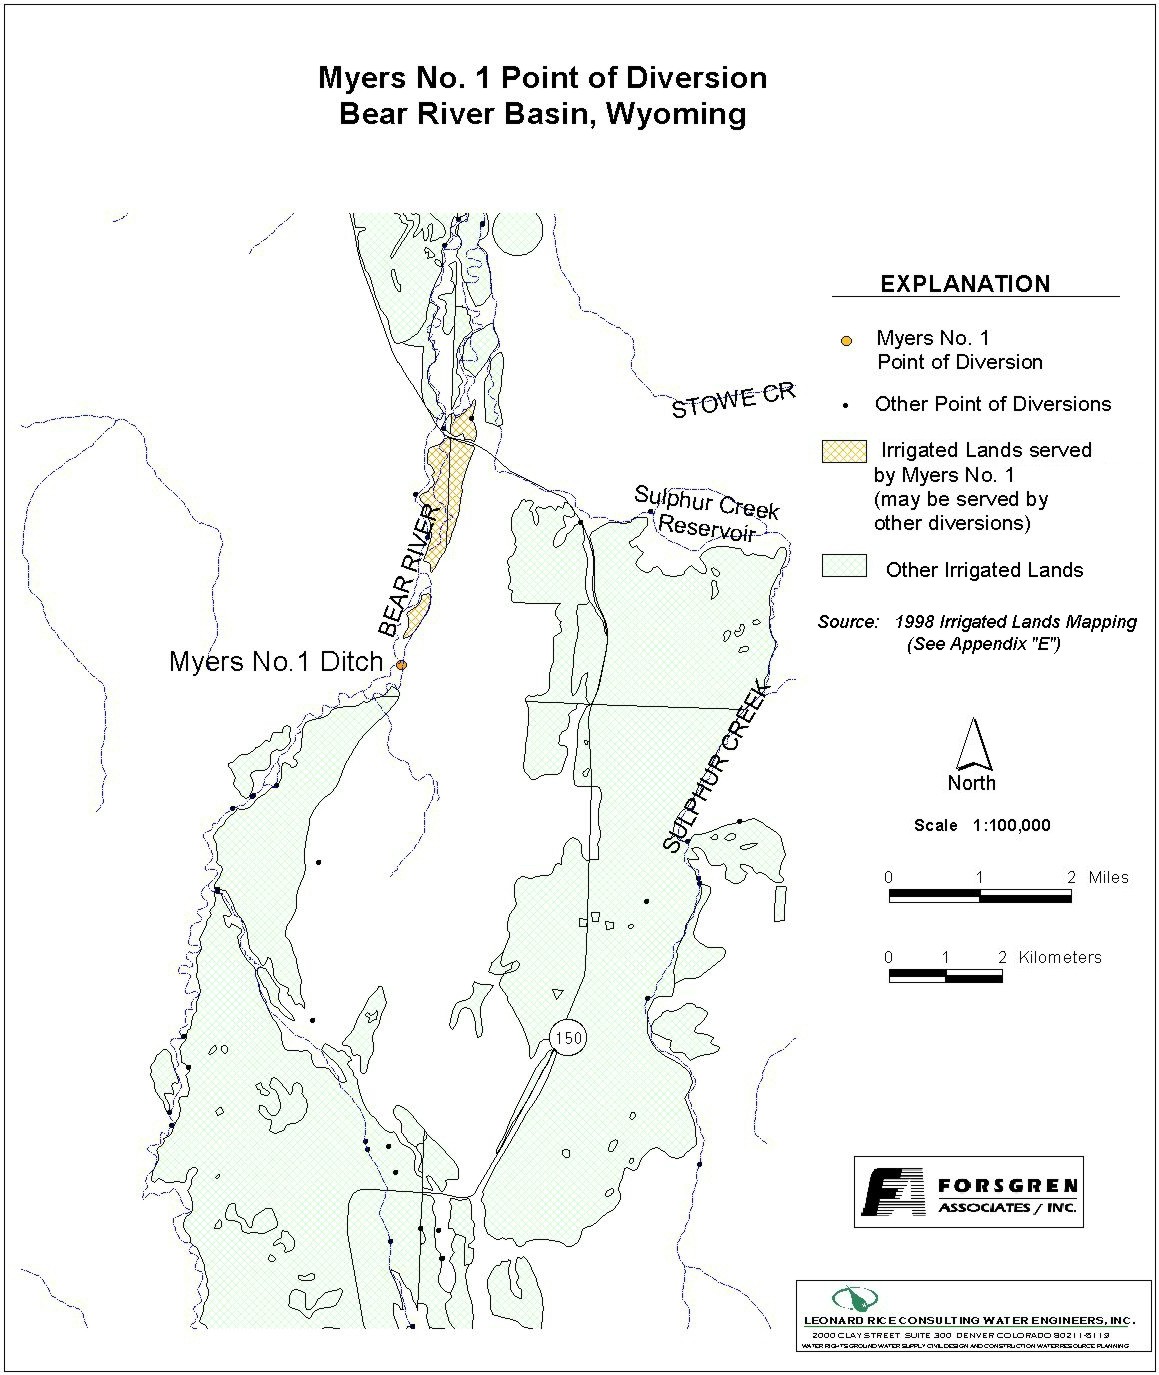
| Diversion Description: The diversion gate structure consists of a deteriorated wooden headwall, a single 30-inch CMP squash pipe, and a 30-inch steel slide gate. The headgate is located approximately 100 yards east of the main river channel. River is dammed during low flows to divert into the ditch. | 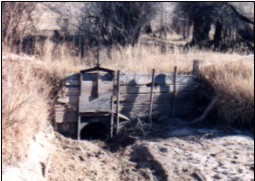 Myers No. 1 Headgate |
|
Conveyance Description: Open Channel Ditch. Ditch follows old stream channel.1
Direct Flow Water Rights:2
| Priority Date | Permit Number |
Permitted Use | Permitted Acres |
Flow (CFS) |
Cumulative (CFS) |
Comments |
|---|---|---|---|---|---|---|
| 08-07-1901 | 3550 | Irrigation | 305 | 4.35 | 4.35 |
Associated Storage Rights:
| Reservoir | Shareholder | Volume (Acre-ft) |
Est. % of Shares Used this Diversion3 | Comments |
|---|---|---|---|---|
| Sulphur Creek | Broken Circle Cattle Co. | 142 | 100% | By Exchange |
Irrigation Practices: Land is all flood irrigated.3
Estimated Diversion Efficiency: Canal losses are relatively high due to porous nature of soils in the higher reaches of the Upper Bear.
Calculated Diversion Efficiency = Conveyance Efficiency X Application Efficiency:
Conveyance Efficiency: 50% Application Efficiency: 55% Overall Diversion Efficiency: 27%
Conveyance efficiency is estimated by total length of main canal. Application efficiency for flood irrigation and sprinkler irrigation is estimated at 55% and 85% respectively.
Crop Types / Consumptive Use: Water is used entirely to irrigate mixed meadow grasses.3
Return Flows: Return flow is intercepted by the Booth Canal (approx. 50%) with the remainder entering Sulphur Creek below the reservoir (approx. 50%).
The following return flow pattern was adopted for modeling in this study are as follows:
		Month
      (after initial Diversion)	 Percent of Return
		0			70%
		1			20%
		2		        10%
				       100%
Other Operational Information: The Myers No. 1 ditch gains significant flow from return flows associated with upstream canals, primarily Lewis and Myers No. 2.3
References:
Monthly Diversion Records
Myers No. 1
| YEAR | MAY | JUNE | JULY | AUGUST | SEPTEMBER | ||||||||||
|---|---|---|---|---|---|---|---|---|---|---|---|---|---|---|---|
| Total of Daily Ave for Month | Average CFS |
Monthly Total Ac-Ft |
Total of Daily Ave for Month | Average CFS |
Monthly Total Ac-Ft |
Total of Daily Ave for Month | Average CFS |
Monthly Total Ac-Ft |
Total of Daily Ave for Month | Average CFS |
Monthly Total Ac-Ft |
Total of Daily Ave for Month | Average CFS |
Monthly Total Ac-Ft | |
| *1970 | |||||||||||||||
| 1971 | 0 | 0.0 | 0.0 | 192 | 6.4 | 380.8 | 249 | 8.0 | 493.9 | 125 | 4.0 | 247.9 | 47 | 1.6 | 93.2 |
| 1972 | 19 | 0.6 | 37.7 | 200 | 6.7 | 396.7 | 164 | 5.3 | 325.3 | 160 | 5.2 | 317.4 | 48 | 1.6 | 95.2 |
| 1973 | 0 | 0.0 | 0.0 | 154 | 5.1 | 305.5 | 128 | 4.1 | 253.9 | 25 | 0.8 | 49.6 | 0 | 0.0 | 0.0 |
| 1974 | 54 | 1.7 | 107.1 | 140 | 4.7 | 277.7 | 120 | 3.9 | 238.0 | 50 | 1.6 | 99.2 | 0 | 0.0 | 0.0 |
| 1975 | 0 | 0.0 | 0.0 | 43 | 1.4 | 85.3 | 209 | 6.7 | 414.5 | 1 | 0.0 | 2.0 | 56 | 1.9 | 111.1 |
| 1976 | 1 | 0.0 | 2.0 | 192 | 6.4 | 380.8 | 142 | 4.6 | 281.7 | 123 | 4.0 | 244.0 | 21 | 0.7 | 41.7 |
| 1977 | 25 | 0.8 | 49.6 | 64 | 2.1 | 126.9 | 74 | 2.4 | 146.8 | 27 | 0.9 | 53.6 | 0 | 0.0 | 0.0 |
| 1978 | 0 | 0.0 | 0.0 | 30 | 1.0 | 59.5 | 170 | 5.5 | 337.2 | 87 | 2.8 | 172.6 | 27 | 0.9 | 53.6 |
| 1979 | 26 | 0.8 | 51.6 | 117 | 3.9 | 232.1 | 192 | 6.2 | 380.8 | 122 | 3.9 | 242.0 | 0 | 0.0 | 0.0 |
| 1980 | 189 | 6.1 | 374.9 | 141 | 4.7 | 279.7 | 236 | 7.6 | 468.1 | 81 | 2.6 | 160.7 | 0 | 0.0 | 0.0 |
| 1981 | 77 | 2.5 | 152.7 | 72 | 2.4 | 142.8 | 183 | 5.9 | 363.0 | 91 | 2.9 | 180.5 | 0 | 0.0 | 0.0 |
| 1982 | 28 | 0.9 | 55.5 | 187 | 6.2 | 370.9 | 60 | 1.9 | 119.0 | 149 | 4.8 | 295.5 | 26 | 0.9 | 51.6 |
| 1983 | 0 | 0.0 | 0.0 | 15 | 0.5 | 29.8 | 91 | 2.9 | 180.5 | 65 | 2.1 | 128.9 | 0 | 0.0 | 0.0 |
| 1984 | 1 | 0.0 | 2.0 | 11 | 0.4 | 21.8 | 212 | 6.8 | 420.5 | 204 | 6.6 | 404.6 | 8 | 0.3 | 15.9 |
| 1985 | 0 | 0.0 | 0.0 | 155 | 5.2 | 307.4 | 300 | 9.7 | 595.0 | 236 | 7.6 | 468.1 | 119 | 4.0 | 236.0 |
| 1986 | 28 | 0.9 | 55.5 | 19 | 0.6 | 37.7 | 159 | 5.1 | 315.4 | 151 | 4.9 | 299.5 | 103 | 3.4 | 204.3 |
| 1987 | 0 | 0.0 | 0.0 | 58 | 1.9 | 115.0 | 122 | 3.9 | 242.0 | 168 | 5.4 | 333.2 | 43 | 1.4 | 85.3 |
| 1988 | 4 | 0.1 | 7.9 | 114 | 3.8 | 226.1 | 72 | 2.3 | 142.8 | 67 | 2.2 | 132.9 | 75 | 2.5 | 148.8 |
| 1989 | 0 | 0.0 | 0.0 | 6 | 0.2 | 11.9 | 167 | 5.4 | 331.2 | 133 | 4.3 | 263.8 | 31 | 1.0 | 61.5 |
| 1990 | 132 | 4.3 | 261.8 | 89 | 3.0 | 176.5 | 67 | 2.2 | 132.9 | 79 | 2.5 | 156.7 | 8 | 0.3 | 15.9 |
| 1991 | 0 | 0.0 | 0.0 | 165 | 5.5 | 327.3 | 136 | 4.4 | 269.8 | 62 | 2.0 | 123.0 | 0 | 0.0 | 0.0 |
| 1992 | 59 | 1.9 | 117.0 | 146 | 4.9 | 289.6 | 141 | 4.5 | 279.7 | 71 | 2.3 | 140.8 | 24 | 0.8 | 47.6 |
| 1993 | 24 | 0.8 | 47.6 | 91 | 3.0 | 180.5 | 129 | 4.2 | 255.9 | 33 | 1.1 | 65.5 | 1 | 0.0 | 2.0 |
| 1994 | 269 | 8.7 | 533.6 | 175 | 5.8 | 347.1 | 137 | 4.4 | 271.7 | 143 | 4.6 | 283.6 | 71 | 2.4 | 140.8 |
| 1995 | 42 | 1.4 | 83.3 | 63 | 2.1 | 125.0 | 73 | 2.4 | 144.8 | 106 | 3.4 | 210.2 | 161 | 5.4 | 319.3 |
| 1996 | 143 | 4.6 | 283.6 | 212 | 7.1 | 420.5 | 88 | 2.8 | 174.5 | 117 | 3.8 | 232.1 | 51 | 1.7 | 101.2 |
| 1997 | 66.3 | 2.1 | 131.5 | 99.7 | 3.3 | 197.8 | 147.9 | 4.8 | 293.4 | 68.1 | 2.2 | 135.1 | 43.1 | 1.4 | 85.5 |
| 1998 | 44.9 | 1.4 | 89.1 | 56.8 | 1.9 | 112.7 | 149.9 | 4.8 | 297.3 | 304.6 | 9.8 | 604.2 | 32 | 1.1 | 63.5 |
| 1999 | 53 | 1.7 | 105.1 | 204 | 6.8 | 404.6 | 31 | 1.0 | 61.5 | 1 | 0.0 | 2.0 | 1 | 0.0 | 2.0 |
| AVERAGES | 1.4 | 87.9 | 3.7 | 219.7 | 4.6 | 283.8 | 3.4 | 208.6 | 1.1 | 68.1 | |||||