Wyoming State Water Plan
Wyoming State Water Plan
Wyoming Water Development Office
6920 Yellowtail Rd
Cheyenne, WY 82002
Phone: 307-777-7626

Wyoming Water Development Office
6920 Yellowtail Rd
Cheyenne, WY 82002
Phone: 307-777-7626


| SUBJECT: |
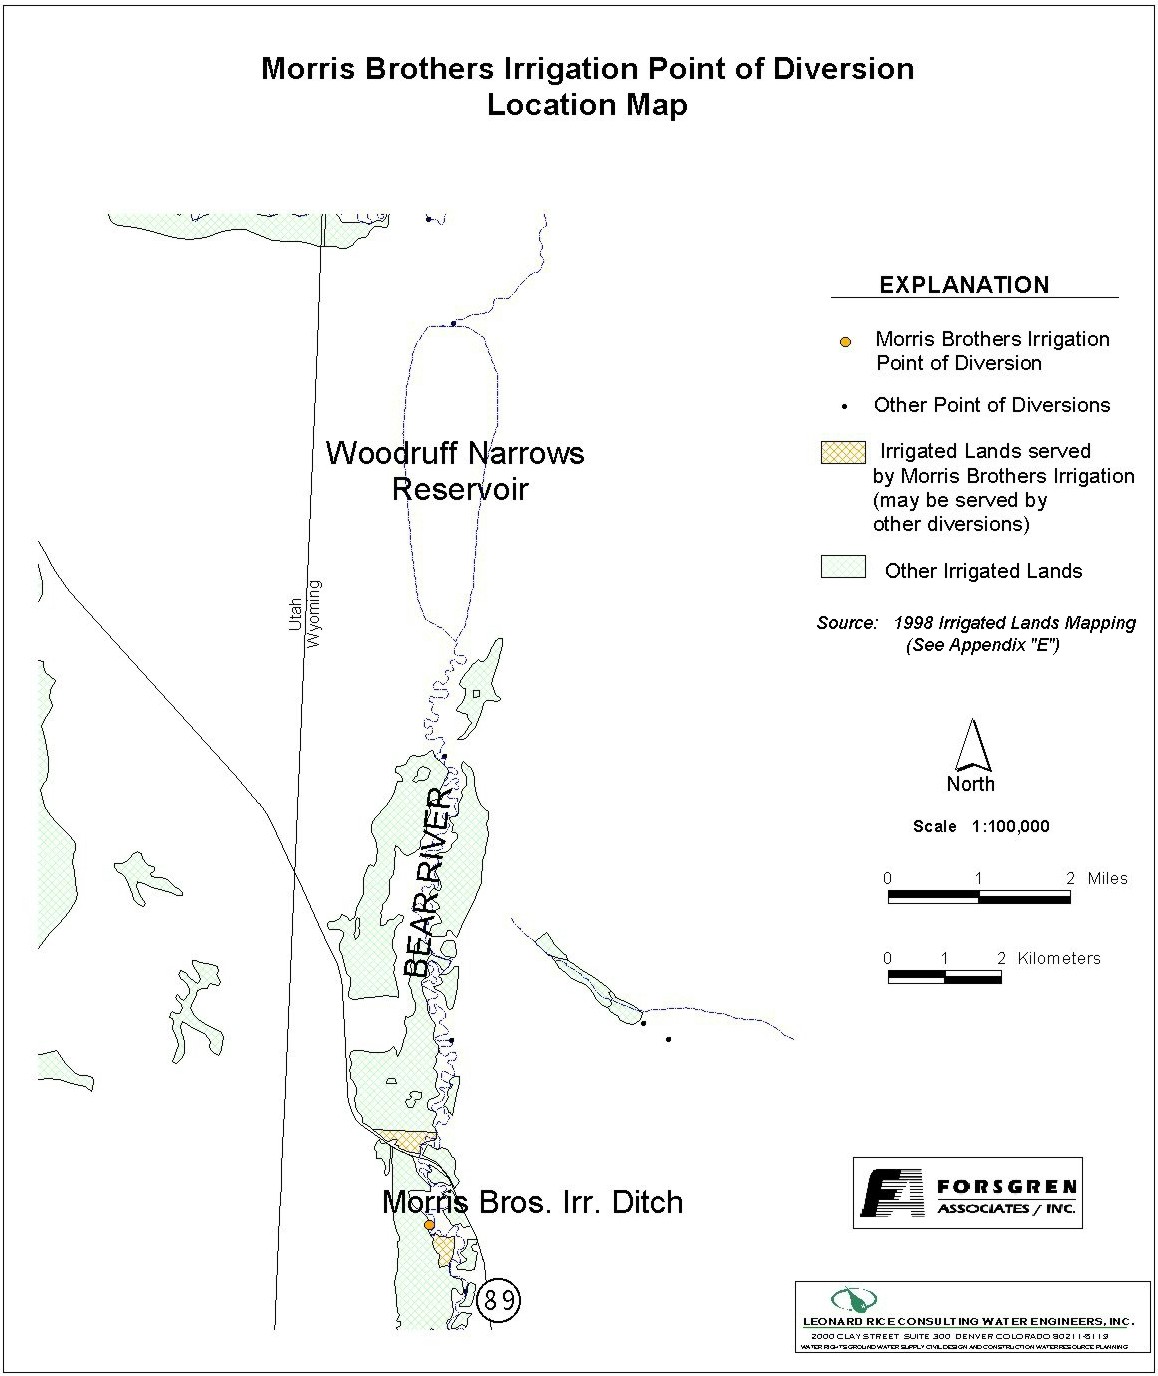
Appendix D Key Structures and Diversions MORRIS BROTHERS IRRIGATION (Lower) DIVERSION |
| PREPARED BY: | Bear River Basin Planning Team |
| DATE: | August 7, 2000 |
| Diversion Description: The headgate structure consists of wood form headwall filled with concrete, a 36-inch culvert, and a canal gate. | 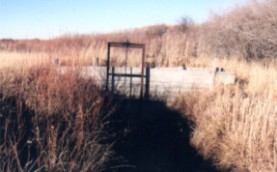 |
|
Conveyance Description: Open channel canal, approximately 15,840 feet in length.1
Direct Flow Water Rights:2
| Priority Date | Permit Number |
Permitted Use | Permitted Acres |
Flow (CFS) |
Cumulative (CFS) |
Comments |
|---|---|---|---|---|---|---|
| 10-01-1880 | Terr | Irrigation | 903 | 12.9 | 12.9 | |
| 10-01-1880 | Terr | RS | 136.5 AF | (Wyoming Downs Res) | ||
| 10-01-1880 | Terr | Irrigation | 80 | 1.14 | 14.04 |
Associated Storage Rights:
| Reservoir | Shareholder | Volume (Acre-ft) |
Est. % of Shares Used this Diversion3 | Comments |
|---|---|---|---|---|
| Sulphur Creek | Lee Pierce | 55 | 100% |
Irrigation Practices: All land is flood irrigated.3
Estimated Diversion Efficiency:
Calculated Diversion Efficiency = Conveyance Efficiency X Application Efficiency:
Conveyance Efficiency: 65% Application Efficiency: 55% Overall Diversion Efficiency: 36% Conveyance efficiency is estimated by total length of main canal. Application efficiency for flood irrigation and sprinkler irrigation is estimated at 55% and 85% respectively.
Crop Types / Consumptive Use: Irrigated acreage is primarily meadow foxtail, etc.3
Return Flows: Return flow is returned to the Bear River (approx. 30%) and Woodruff Narrows (approx. 70%).
The following return flow pattern was adopted for modeling in this study are as follows:
		Month
      (after initial Diversion)	 Percent of Return
		0			70%
		1			20%
		2		        10%
				       100%
Other Operational Information: The Morris Brothers canal is located downstream of the Chapman Canal diversion. Very little water enters the headgate except during high flow periods. During low flow periods, the primary source of water is from Chapman’s excess return flows. It is reported that this return flow increase can be as high as 20 CFS.3
References:
Monthly Diversion Records
Morris Brothers Irrigation (Lower)
| YEAR | MAY | JUNE | JULY | AUGUST | SEPTEMBER | ||||||||||
|---|---|---|---|---|---|---|---|---|---|---|---|---|---|---|---|
| Total of Daily Ave for Month | Average CFS |
Monthly Total Ac-Ft |
Total of Daily Ave for Month | Average CFS |
Monthly Total Ac-Ft |
Total of Daily Ave for Month | Average CFS |
Monthly Total Ac-Ft |
Total of Daily Ave for Month | Average CFS |
Monthly Total Ac-Ft |
Total of Daily Ave for Month | Average CFS |
Monthly Total Ac-Ft | |
| *1970 | |||||||||||||||
| 1971 | 54 | 1.7 | 107.1 | 82 | 2.7 | 162.6 | 24 | 0.8 | 47.6 | 9 | 0.3 | 17.9 | 0 | 0.0 | 0.0 |
| 1972 | 37 | 1.2 | 73.4 | 192 | 6.4 | 380.8 | 8 | 0.3 | 15.9 | 267 | 8.6 | 529.6 | 86 | 2.9 | 170.6 |
| 1973 | 34 | 1.1 | 67.4 | 106 | 3.5 | 210.2 | 33 | 1.1 | 65.5 | 0 | 0.0 | 0.0 | 4 | 0.1 | 7.9 |
| 1974 | 122 | 3.9 | 242.0 | 132 | 4.4 | 261.8 | 9 | 0.3 | 17.9 | 0 | 0.0 | 0.0 | 2 | 0.1 | 4.0 |
| 1975 | 35 | 1.1 | 69.4 | 83 | 2.8 | 164.6 | 125 | 4.0 | 247.9 | 0 | 0.0 | 0.0 | 0 | 0.0 | 0.0 |
| 1976 | 13 | 0.4 | 25.8 | 28 | 0.9 | 55.5 | 80 | 2.6 | 158.7 | 4 | 0.1 | 7.9 | 0 | 0.0 | 0.0 |
| 1977 | 8 | 0.3 | 15.9 | 10 | 0.3 | 19.8 | 25 | 0.8 | 49.6 | 27 | 0.9 | 53.6 | 0 | 0.0 | 0.0 |
| 1978 | 47 | 1.5 | 93.2 | 81 | 2.7 | 160.7 | 32 | 1.0 | 63.5 | 0 | 0.0 | 0.0 | 44 | 1.5 | 87.3 |
| 1979 | 143 | 4.6 | 283.6 | 141 | 4.7 | 279.7 | 6 | 0.2 | 11.9 | 37 | 1.2 | 73.4 | 24 | 0.8 | 47.6 |
| 1980 | 0 | 0.0 | 0.0 | 163 | 5.4 | 323.3 | 44 | 1.4 | 87.3 | 16 | 0.5 | 31.7 | 49 | 1.6 | 97.2 |
| 1981 | 22 | 0.7 | 43.6 | 55 | 1.8 | 109.1 | 1 | 0.0 | 2.0 | 68 | 2.2 | 134.9 | 0 | 0.0 | 0.0 |
| 1982 | 0 | 0.0 | 0.0 | 130 | 4.3 | 257.9 | 46 | 1.5 | 91.2 | 1 | 0.0 | 2.0 | 0 | 0.0 | 0.0 |
| 1983 | 120 | 3.9 | 238.0 | 815 | 27.2 | 1616.5 | 177 | 5.7 | 351.1 | 95 | 3.1 | 188.4 | 98 | 3.3 | 194.4 |
| 1984 | 558 | 18.0 | 1106.8 | 350 | 11.7 | 694.2 | 21 | 0.7 | 41.7 | 4 | 0.1 | 7.9 | 0 | 0.0 | 0.0 |
| 1985 | 395 | 12.7 | 783.5 | 82 | 2.7 | 162.6 | 24 | 0.8 | 47.6 | 0 | 0.0 | 0.0 | 0 | 0.0 | 0.0 |
| 1986 | 446 | 14.4 | 884.6 | 34 | 1.1 | 67.4 | 927 | 29.9 | 1838.7 | 0 | 0.0 | 0.0 | 11 | 0.4 | 21.8 |
| 1987 | 10 | 0.3 | 19.8 | 45 | 1.5 | 89.3 | 34 | 1.1 | 67.4 | 90 | 2.9 | 178.5 | 35 | 1.2 | 69.4 |
| 1988 | 26 | 0.8 | 51.6 | 81 | 2.7 | 160.7 | 57 | 1.8 | 113.1 | 27 | 0.9 | 53.6 | 5 | 0.2 | 9.9 |
| 1989 | 180 | 5.8 | 357.0 | 102 | 3.4 | 202.3 | 47 | 1.5 | 93.2 | 5 | 0.2 | 9.9 | 38 | 1.3 | 75.4 |
| 1990 | 63 | 2.0 | 125.0 | 184 | 6.1 | 365.0 | 76 | 2.5 | 150.7 | 32 | 1.0 | 63.5 | 113 | 3.8 | 224.1 |
| 1991 | 210 | 6.8 | 416.5 | 529 | 17.6 | 1049.3 | 44 | 1.4 | 87.3 | 7 | 0.2 | 13.9 | 20 | 0.7 | 39.7 |
| 1992 | 135 | 4.4 | 267.8 | 71 | 2.4 | 140.8 | 109 | 3.5 | 216.2 | 17 | 0.5 | 33.7 | 47 | 1.6 | 93.2 |
| 1993 | 224 | 7.2 | 444.3 | 124 | 4.1 | 246.0 | 54 | 1.7 | 107.1 | 0 | 0.0 | 0.0 | 0 | 0.0 | 0.0 |
| 1994 | 59 | 1.9 | 117.0 | 54 | 1.8 | 107.1 | 79 | 2.5 | 156.7 | 16 | 0.5 | 31.7 | 53 | 1.8 | 105.1 |
| 1995 | 0 | 0.0 | 0.0 | 126 | 4.2 | 249.9 | 52 | 1.7 | 103.1 | 10 | 0.3 | 19.8 | 166 | 5.5 | 329.3 |
| 1996 | 38 | 1.2 | 75.4 | 123 | 4.1 | 244.0 | 80 | 2.6 | 158.7 | 62 | 2.0 | 123.0 | 98 | 3.3 | 194.4 |
| 1997 | 18.5 | 0.6 | 36.7 | 141.2 | 4.7 | 280.1 | 11 | 0.4 | 21.8 | 0 | 0.0 | 0.0 | 21.1 | 0.7 | 41.9 |
| 1998 | 13.9 | 0.4 | 27.6 | 98.7 | 3.3 | 195.8 | 87.3 | 2.8 | 173.2 | 2.6 | 0.1 | 5.2 | 0 | 0.0 | 0.0 |
| 1999 | 27 | 0.9 | 53.6 | 99 | 3.3 | 196.4 | 66 | 2.1 | 130.9 | 0 | 0.0 | 0.0 | 0 | 0.0 | 0.0 |
| AVERAGES | 3.4 | 207.8 | 4.9 | 291.5 | 2.6 | 162.7 | 0.9 | 54.5 | 1.1 | 62.5 | |||||