Wyoming State Water Plan
Wyoming State Water Plan
Wyoming Water Development Office
6920 Yellowtail Rd
Cheyenne, WY 82002
Phone: 307-777-7626

Wyoming Water Development Office
6920 Yellowtail Rd
Cheyenne, WY 82002
Phone: 307-777-7626


| SUBJECT: |
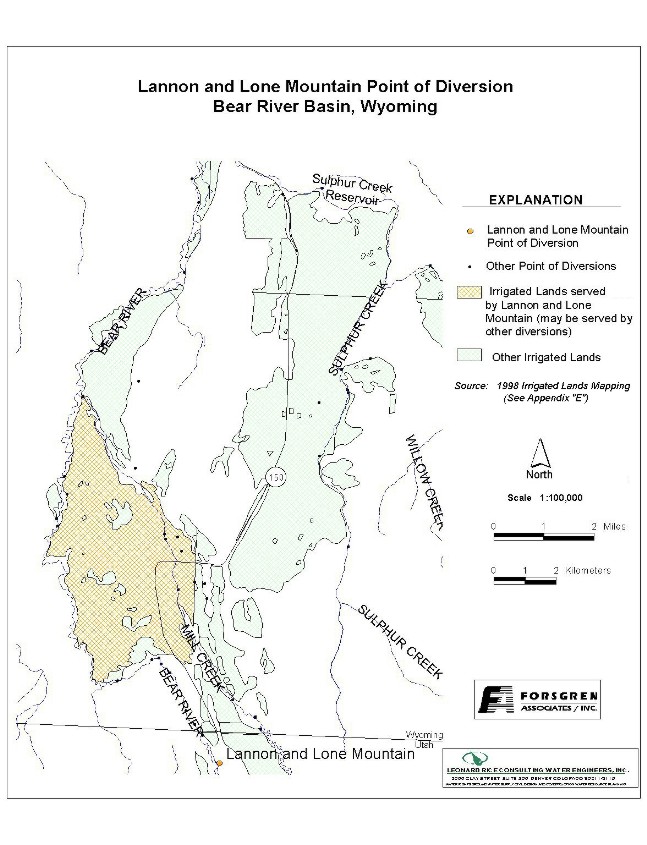
Appendix D Key Structures and Diversions Lannon & Lone Mountain Diversion |
| PREPARED BY: | Bear River Basin Planning Team |
| Diversion Description: The diversion control structure consists of a single 48-inch CPM culvert with a steel slide gate. The river is diverted approximately 200 feet upstream of the diversion gate. The river channel is diverted using a hand placed rock dam. | 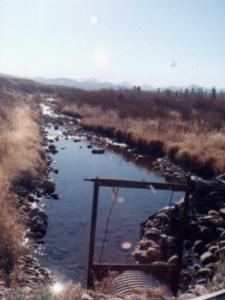 Lannon & Lone Mountain diversion gate |
| |
| Conveyance Description: Open Channel Canal, approximately 10,560 feet in length.1 |
Direct Flow Water Rights:2
| Priority Date | Permit Number |
Permitted Use | Permitted Acres |
Flow (CFS) |
Cumulative (CFS) |
Comments |
|---|---|---|---|---|---|---|
| -1898 | U21-26&37 | Irrigation & Storage | 864.69 | 13.42 | 13.42 | Lannon (Utah) - overlaps WY proof 9127 |
| 06-23-1910 | U21-312 | Irrigation & Storage | 305.16 | 4.50 | 17.92 | Lone Mountain - Undefined in WY or compact |
Bear River Compact: Although the Lannon & Lone Mountain Diversion is located in Utah, the Bear River Compact acknowledges Wyoming's right to administer these water rights. Article X, Paragraph "B" of the Compact specifically states:
"B. All interstate rights shall be administered by the state in which the point of diversion is located and during times of water emergency, such rights shall be filled from the allocations specified in article IV hereof for the section in which the point of diversion is located, with the exception that the diversion of water into the Hilliard East Fork Canal, Lannon Canal, Lone Mountain Ditch, and Hilliard West Side Canal shall be under the administration of Wyoming. During times of water emergency these canals and the Lone Mountain Ditch shall be supplied from the allocation specified in article IV for the Upper Wyoming section diversions."
Associated Storage Rights: Associated Storage Rights:
| Reservoir | Shareholder | Volume (Acre-ft) |
Est. % of Shares Used this Diversion3 | Comments |
|---|---|---|---|---|
| Whitney | Sharon Ruffi | 90 | 100% | |
| Whitney | Kyle Lowman | 131.62 | 100% | |
| Whitney | Sam Lowman | 179 | 100% | |
| Whitney | John Burton | 111.38 | 100% |
Irrigation Practices: Land is all flood irrigated. 3
Estimated Diversion Efficiency: Canal losses are relatively high due to porous nature of soils in the higher reaches of the Upper Bear.
Calculated Diversion Efficiency = Conveyance Efficiency X Application Efficiency:
Conveyance Efficiency: 45% Application Efficiency: 55% Overall Diversion Efficiency: 25% Conveyance efficiency is estimated by total length of main canal. Application efficiency for flood irrigation and sprinkler irrigation is estimated at 55% and 85% respectively.
Crop Types / Consumptive Use: Water is used entirely to irrigate meadow grasses, primarily Timothy, Meadow Foxtail, etc.3
Return Flows: Return flow is split between the Lewis Ditch (approx. 30%) and Mill Creek (approx. 70%). The following return flow pattern was adopted for modeling in this study are as follows:
			Month
		(after initial Diversion)	Percent of Return
			0				70%
			1				20%
			2				10%
			3				0%
							100%
References:
Monthly Diversion Records
| YEAR | MAY | JUNE | JULY | AUGUST | SEPTEMBER | ||||||||||
|---|---|---|---|---|---|---|---|---|---|---|---|---|---|---|---|
| Total of Daily Ave for Month | Average CFS |
Monthly Total Ac-Ft |
Total of Daily Ave for Month | Average CFS |
Monthly Total Ac-Ft |
Total of Daily Ave for Month | Average CFS |
Monthly Total Ac-Ft |
Total of Daily Ave for Month | Average CFS |
Monthly Total Ac-Ft |
Total of Daily Ave for Month | Average CFS |
Monthly Total Ac-Ft | |
| *1970 | |||||||||||||||
| 1971 | 106 | 3.4 | 210.2 | 846 | 28.2 | 1678.0 | 550 | 17.7 | 1090.9 | 273 | 8.8 | 541.5 | 403 | 13.4 | 799.3 |
| 1972 | 298 | 9.6 | 591.1 | 913 | 30.4 | 1810.9 | 429 | 13.8 | 850.9 | 90 | 2.9 | 178.5 | 175 | 5.8 | 347.1 |
| 1973 | 135 | 4.4 | 267.8 | 717 | 23.9 | 1422.1 | 460 | 14.8 | 912.4 | 307 | 9.9 | 608.9 | 217 | 7.2 | 430.4 |
| 1974 | 244 | 7.9 | 484.0 | 621 | 20.7 | 1231.7 | 504 | 16.3 | 999.7 | 177 | 5.7 | 351.1 | 40 | 1.3 | 79.3 |
| 1975 | 56 | 1.8 | 111.1 | 768 | 25.6 | 1523.3 | 742 | 23.9 | 1471.7 | 224 | 7.2 | 444.3 | 291 | 9.7 | 577.2 |
| 1976 | 241 | 7.8 | 478.0 | 565 | 18.8 | 1120.7 | 244 | 7.9 | 484.0 | 51 | 1.6 | 101.2 | 513 | 17.1 | 1017.5 |
| 1977 | 174 | 5.6 | 345.1 | 239 | 8.0 | 474.0 | 46 | 1.5 | 91.2 | 0 | 0.0 | 0.0 | 64 | 2.1 | 126.9 |
| 1978 | 510 | 16.5 | 1011.6 | 666 | 22.2 | 1321.0 | 515 | 16.6 | 1021.5 | 176 | 5.7 | 349.1 | 130 | 4.3 | 257.9 |
| 1979 | 341 | 11.0 | 676.4 | 558 | 18.6 | 1106.8 | 291 | 9.4 | 577.2 | 103 | 3.3 | 204.3 | 136 | 4.5 | 269.8 |
| 1980 | 393 | 12.7 | 779.5 | 592 | 19.7 | 1174.2 | 474 | 15.3 | 940.2 | 164 | 5.3 | 325.3 | 69 | 2.3 | 136.9 |
| 1981 | 382 | 12.3 | 757.7 | 323 | 10.8 | 640.7 | 271 | 8.7 | 537.5 | 168 | 5.4 | 333.2 | 175 | 5.8 | 347.1 |
| 1982 | 319 | 10.3 | 632.7 | 503 | 16.8 | 997.7 | 548 | 17.7 | 1086.9 | 317 | 10.2 | 628.8 | 644 | 21.5 | 1277.4 |
| 1983 | 141 | 4.5 | 279.7 | 326 | 10.9 | 646.6 | 348 | 11.2 | 690.2 | 212 | 6.8 | 420.5 | 106 | 3.5 | 210.2 |
| 1984 | 346 | 11.2 | 686.3 | 542 | 18.1 | 1075.0 | 517 | 16.7 | 1025.5 | 131 | 4.2 | 259.8 | 21 | 0.7 | 41.7 |
| 1985 | 446 | 14.4 | 884.6 | 448 | 14.9 | 888.6 | 465 | 15.0 | 922.3 | 281 | 9.1 | 557.4 | 133 | 4.4 | 263.8 |
| 1986 | 146 | 4.7 | 289.6 | 520 | 17.3 | 1031.4 | 486 | 15.7 | 964.0 | 377 | 12.2 | 747.8 | 399 | 13.3 | 791.4 |
| 1987 | 388 | 12.5 | 769.6 | 443 | 14.8 | 878.7 | 319 | 10.3 | 632.7 | 175 | 5.6 | 347.1 | 171 | 5.7 | 339.2 |
| 1988 | 552 | 17.8 | 1094.9 | 944 | 31.5 | 1872.4 | 308 | 9.9 | 610.9 | 5 | 0.2 | 9.9 | 0 | 0.0 | 0.0 |
| 1989 | 606 | 19.5 | 1202.0 | 455 | 15.2 | 902.5 | 283 | 9.1 | 561.3 | 139 | 4.5 | 275.7 | 15 | 0.5 | 29.8 |
| 1990 | 409 | 13.2 | 811.2 | 564 | 18.8 | 1118.7 | 404 | 13.0 | 801.3 | 50 | 1.6 | 99.2 | 50 | 1.7 | 99.2 |
| 1991 | 273 | 8.8 | 541.5 | 479 | 16.0 | 950.1 | 380 | 12.3 | 753.7 | 106 | 3.4 | 210.2 | 87 | 2.9 | 172.6 |
| 1992 | 606 | 19.5 | 1202.0 | 305 | 10.2 | 605.0 | 185 | 6.0 | 366.9 | 186 | 6.0 | 368.9 | 3 | 0.1 | 6.0 |
| 1993 | 274 | 8.8 | 543.5 | 421 | 14.0 | 835.0 | 645 | 20.8 | 1279.3 | 444 | 14.3 | 880.7 | 609 | 20.3 | 1207.9 |
| 1994 | 599 | 19.3 | 1188.1 | 444 | 14.8 | 880.7 | 443 | 14.3 | 878.7 | 3 | 0.1 | 6.0 | 3 | 0.1 | 6.0 |
| 1995 | 345 | 11.1 | 684.3 | 441 | 14.7 | 874.7 | 501 | 16.2 | 993.7 | 293 | 9.5 | 581.2 | 404 | 13.5 | 801.3 |
| 1996 | 250 | 8.1 | 495.9 | 480 | 16.0 | 952.1 | 544 | 17.5 | 1079.0 | 359 | 11.6 | 712.1 | 180 | 6.0 | 357.0 |
| 1997 | 387.7 | 12.5 | 769.0 | 321.2 | 10.7 | 637.1 | 551 | 17.8 | 1092.9 | 302.4 | 9.8 | 599.8 | 271.7 | 9.1 | 538.9 |
| 1998 | 411.5 | 13.3 | 816.2 | 407.5 | 13.6 | 808.3 | 406 | 13.1 | 805.3 | 264.4 | 8.5 | 524.4 | 279 | 9.3 | 553.4 |
| 1999 | 146 | 4.7 | 289.6 | 383 | 12.8 | 759.7 | 432 | 13.9 | 856.9 | 257 | 8.3 | 509.8 | 195 | 6.5 | 386.8 |
| AVERAGES | 10.6 | 651.5 | 17.5 | 1042.0 | 13.7 | 840.6 | 6.3 | 385.4 | 6.6 | 395.6 | |||||