Wyoming State Water Plan
Wyoming State Water Plan
Wyoming Water Development Office
6920 Yellowtail Rd
Cheyenne, WY 82002
Phone: 307-777-7626

Wyoming Water Development Office
6920 Yellowtail Rd
Cheyenne, WY 82002
Phone: 307-777-7626


| SUBJECT: |
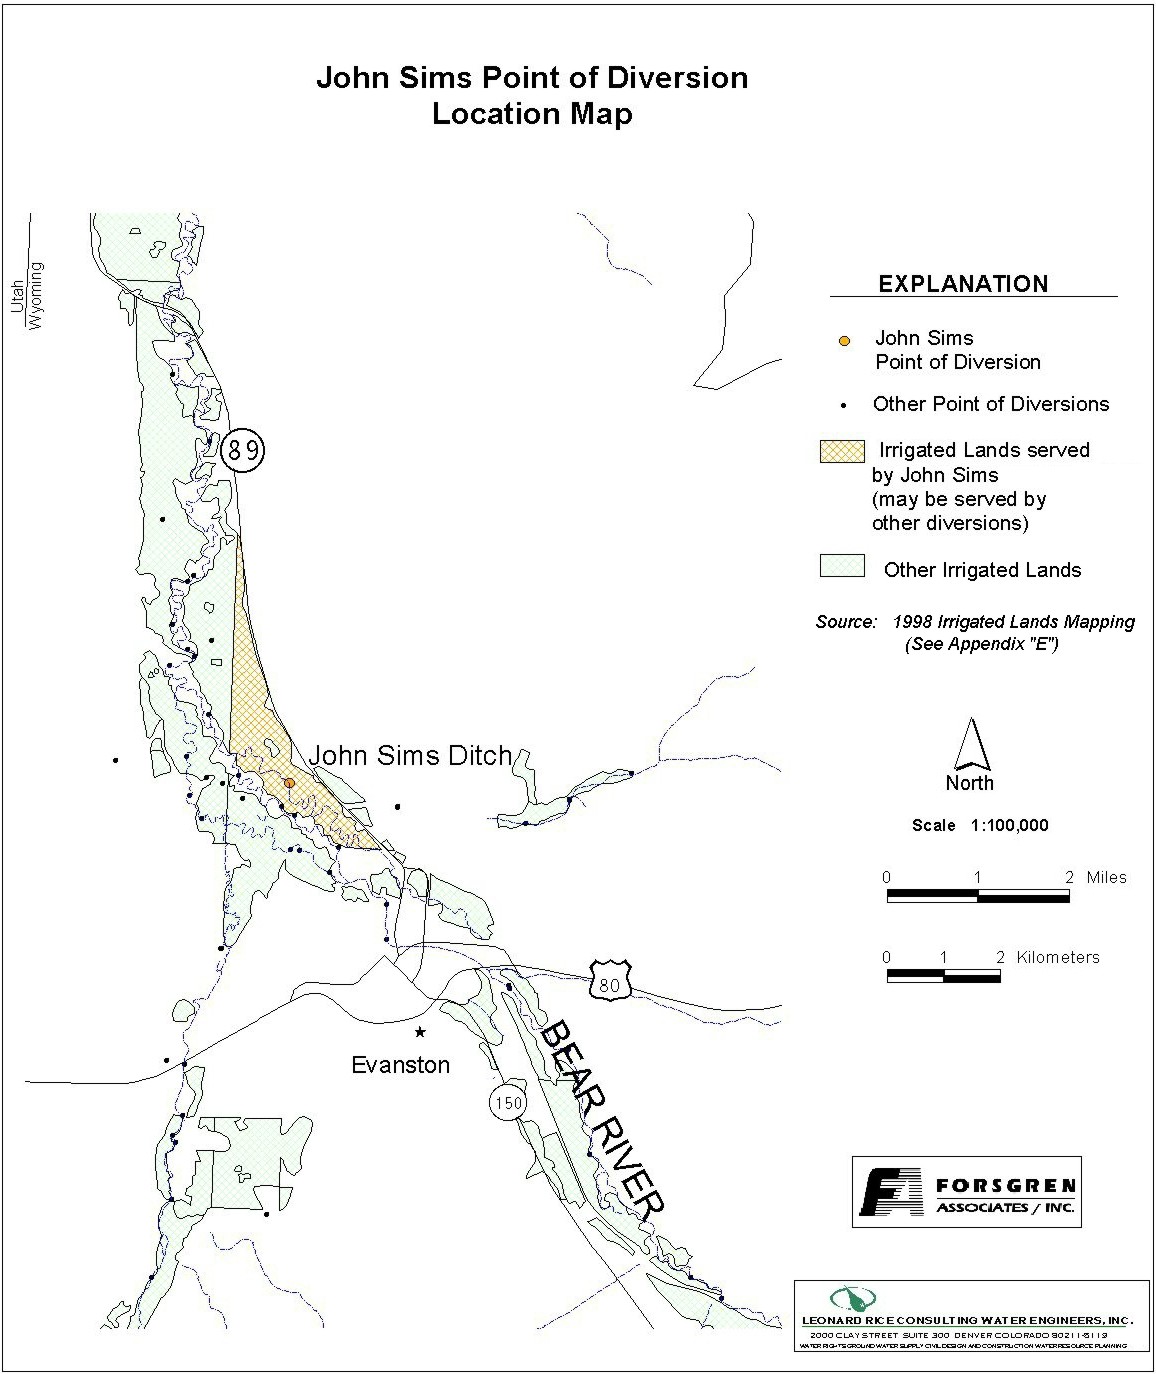
Appendix D Key Structures and Diversions JOHN SIMS DIVERSION |
| PREPARED BY: | Bear River Basin Planning Team |
| DATE: | August 7, 2000 |
| Diversion Description: The headgate structure consists of an older rough-hewn wood headwall with a 5-foot wide slide gate. There is a second 5-foor opening that is typically boarded up. The river is typically diverted each year with broken concrete, rocks, etc. Erosion and flooding on the opposite side of the diversion appears to be a common occurrence. | 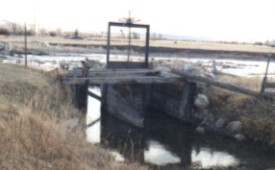 John Sims Ditch Headgate |
|
Conveyance Description: Open channel ditch, approximately 10,560 feet in length.1
Direct Flow Water Rights:2
| Priority Date | Permit Number |
Permitted Use | Permitted Acres |
Flow (CFS) |
Cumulative (CFS) |
Comments |
|---|---|---|---|---|---|---|
| 12-07-1871 | Terr | Irrigation | 160 | 2.28 | 2.28 | |
| -1887 | Terr | Irrigation | 75 | 1.07 | 3.35 | (Rocky Mtn & BR Co) |
| -1887 | Terr | Irrigation | 78 | 1.11 | 4.46 | (Rocky Mtn & BR Co) |
| 10-05-1900 | 2846 | Irrigation | 35 | 0.50 | 4.96 | |
| 10-05-1900 | 2846 | Irrigation | 30 | 0.42 | 5.38 | |
| 08-05-1909 | 2808E | Irrigation | 69 | 0.99 | 6.37 | (Rocky Mtn & Blythe) |
| 09-25-1956 | 5869E | Irrigation, Storage | 3.50 | 0.16 | 6.42 | |
| 09-25-1956 | 5869E | Irrigation, Storage | 29 | 0.41 | 6.83 | |
| 09-25-1956 | 5869E | Irrigation, Storage | 51.60 | 0.74 | 7.57 | |
| 09-25-1956 | 5869E | Irrigation, Storage | 18.50 | 0.26 | 7.83 |
Associated Storage Rights:
| Reservoir | Shareholder | Volume (Acre-ft) |
Est. % of Shares Used this Diversion3 | Comments |
|---|---|---|---|---|
| Sulphur Creek | Evanston LDS Church | 143 | 100% | |
| Sulphur Creek | Kemmereer LDS Church | 143 | 100% | |
| Sulphur Creek | Charles Nixon | 137 | 33% | |
| Sulphur Creek | Isabelle Sims | 131 | 100% | |
| Sulphur Creek | Gilda Sims | 219 | 100% | |
| Sulphur Creek | Michael Sims | 40 | 50% |
Irrigation Practices: Land is all flood irrigated.3
Estimated Diversion Efficiency:
Calculated Diversion Efficiency = Conveyance Efficiency X Application Efficiency:
Conveyance Efficiency: 65% Application Efficiency: 55% Overall Diversion Efficiency: 36% Conveyance efficiency is estimated by total length of main canal. Application efficiency for flood irrigation and sprinkler irrigation is estimated at 55% and 85% respectively.
Crop Types / Consumptive Use: Irrigated acreage was approximately 25% +/- alfalfa ten years ago w/ two cuttings. Presently, there is approximately 10% alfalfa with a single crop. Oats and grains make up about 10-12%. Remainder is meadow grasses.3
Return Flows: Excess return flow is primarily split between the SP Ramsey Canal (approx. 50%) and the Bear River (approx. 50%).
The following return flow pattern was adopted for modeling in this study are as follows:
		Month
      (after initial Diversion)	 Percent of Return
		0			70%
		1			20%
		2		        10%
                3                        0%
				       100%
Other Operational Information: The John Sims ditch intercepts substantial return flows in the late summer from the Evanston Water Supply Canal and the Rocky Mountain & Blythe Canals.3
References:
Monthly Diversion Records
John Sims
| YEAR | MAY | JUNE | JULY | AUGUST | SEPTEMBER | ||||||||||
|---|---|---|---|---|---|---|---|---|---|---|---|---|---|---|---|
| Total of Daily Ave for Month | Average CFS |
Monthly Total Ac-Ft |
Total of Daily Ave for Month | Average CFS |
Monthly Total Ac-Ft |
Total of Daily Ave for Month | Average CFS |
Monthly Total Ac-Ft |
Total of Daily Ave for Month | Average CFS |
Monthly Total Ac-Ft |
Total of Daily Ave for Month | Average CFS |
Monthly Total Ac-Ft | |
| *1970 | |||||||||||||||
| 1971 | 288 | 9.3 | 571.2 | 589 | 19.6 | 1168.3 | 548 | 17.7 | 1086.9 | 392 | 12.6 | 777.5 | 208 | 6.9 | 412.6 |
| 1972 | 318 | 10.3 | 630.7 | 693 | 23.1 | 1374.5 | 282 | 9.1 | 559.3 | 340 | 11.0 | 674.4 | 198 | 6.6 | 392.7 |
| 1973 | 200 | 6.5 | 396.7 | 253 | 8.4 | 501.8 | 336 | 10.8 | 666.4 | 308 | 9.9 | 610.9 | 331 | 11.0 | 656.5 |
| 1974 | 233 | 7.5 | 462.1 | 888 | 29.6 | 1761.3 | 150 | 4.8 | 297.5 | 304 | 9.8 | 603.0 | 294 | 9.8 | 583.1 |
| 1975 | 64 | 2.1 | 126.9 | 575 | 19.2 | 1140.5 | 600 | 19.4 | 1190.1 | 298 | 9.6 | 591.1 | 374 | 12.5 | 741.8 |
| 1976 | 108 | 3.5 | 214.2 | 391 | 13.0 | 775.5 | 388 | 12.5 | 769.6 | 185 | 6.0 | 366.9 | 183 | 6.1 | 363.0 |
| 1977 | 118 | 3.8 | 234.0 | 281 | 9.4 | 557.4 | 216 | 7.0 | 428.4 | 88 | 2.8 | 174.5 | 76 | 2.5 | 150.7 |
| 1978 | 165 | 5.3 | 327.3 | 559 | 18.6 | 1108.8 | 278 | 9.0 | 551.4 | 347 | 11.2 | 688.3 | 169 | 5.6 | 335.2 |
| 1979 | 346 | 11.2 | 686.3 | 327 | 10.9 | 648.6 | 212 | 6.8 | 420.5 | 226 | 7.3 | 448.3 | 95 | 3.2 | 188.4 |
| 1980 | 116 | 3.7 | 230.1 | 744 | 24.8 | 1475.7 | 265 | 8.5 | 525.6 | 252 | 8.1 | 499.8 | 178 | 5.9 | 353.1 |
| 1981 | 472 | 15.2 | 936.2 | 471 | 15.7 | 934.2 | 217 | 7.0 | 430.4 | 221 | 7.1 | 438.3 | 247 | 8.2 | 489.9 |
| 1982 | 460 | 14.8 | 912.4 | 452 | 15.1 | 896.5 | 177 | 5.7 | 351.1 | 206 | 6.6 | 408.6 | 242 | 8.1 | 480.0 |
| 1983 | 213 | 6.9 | 422.5 | 451 | 15.0 | 894.5 | 203 | 6.5 | 402.6 | 261 | 8.4 | 517.7 | 77 | 2.6 | 152.7 |
| 1984 | 128 | 4.1 | 253.9 | 290 | 9.7 | 575.2 | 315 | 10.2 | 624.8 | 217 | 7.0 | 430.4 | 218 | 7.3 | 432.4 |
| 1985 | 671 | 21.6 | 1330.9 | 590 | 19.7 | 1170.2 | 213 | 6.9 | 422.5 | 348 | 11.2 | 690.2 | 200 | 6.7 | 396.7 |
| 1986 | 193 | 6.2 | 382.8 | 310 | 10.3 | 614.9 | 213 | 6.9 | 422.5 | 289 | 9.3 | 573.2 | 237 | 7.9 | 470.1 |
| 1987 | 358 | 11.5 | 710.1 | 220 | 7.3 | 436.4 | 297 | 9.6 | 589.1 | 254 | 8.2 | 503.8 | 210 | 7.0 | 416.5 |
| 1988 | 434 | 14.0 | 860.8 | 317 | 10.6 | 628.8 | 263 | 8.5 | 521.7 | 139 | 4.5 | 275.7 | 95 | 3.2 | 188.4 |
| 1989 | 732 | 23.6 | 1451.9 | 609 | 20.3 | 1207.9 | 267 | 8.6 | 529.6 | 195 | 6.3 | 386.8 | 81 | 2.7 | 160.7 |
| 1990 | 223 | 7.2 | 442.3 | 438 | 14.6 | 868.8 | 276 | 8.9 | 547.4 | 211 | 6.8 | 418.5 | 69 | 2.3 | 136.9 |
| 1991 | 402 | 13.0 | 797.4 | 405 | 13.5 | 803.3 | 155 | 5.0 | 307.4 | 290 | 9.4 | 575.2 | 143 | 4.8 | 283.6 |
| 1992 | 305 | 9.8 | 605.0 | 178 | 5.9 | 353.1 | 150 | 4.8 | 297.5 | 70 | 2.3 | 138.8 | 179 | 6.0 | 355.0 |
| 1993 | 178 | 5.7 | 353.1 | 204 | 6.8 | 404.6 | 178 | 5.7 | 353.1 | 11 | 0.4 | 21.8 | 201 | 6.7 | 398.7 |
| 1994 | 471 | 15.2 | 934.2 | 323 | 10.8 | 640.7 | 178 | 5.7 | 353.1 | 168 | 5.4 | 333.2 | 70 | 2.3 | 138.8 |
| 1995 | 220 | 7.1 | 436.4 | 429 | 14.3 | 850.9 | 349 | 11.3 | 692.2 | 260 | 8.4 | 515.7 | 283 | 9.4 | 561.3 |
| 1996 | 424 | 13.7 | 841.0 | 749 | 25.0 | 1485.6 | 217 | 7.0 | 430.4 | 143 | 4.6 | 283.6 | 174 | 5.8 | 345.1 |
| 1997 | 177 | 5.7 | 351.1 | 296.5 | 9.9 | 588.1 | 114.6 | 3.7 | 227.3 | 190.5 | 6.1 | 377.9 | 231.6 | 7.7 | 459.4 |
| 1998 | 147.9 | 4.8 | 293.4 | 363.8 | 12.1 | 721.6 | 199.4 | 6.4 | 395.5 | 29.6 | 1.0 | 58.7 | 371 | 12.4 | 735.9 |
| 1999 | 198 | 6.4 | 392.7 | 466 | 15.5 | 924.3 | 245 | 7.9 | 486.0 | 115 | 3.7 | 228.1 | 77 | 2.6 | 152.7 |
| AVERAGES | 9.3 | 572.0 | 14.8 | 879.7 | 8.3 | 513.1 | 7.1 | 434.9 | 6.3 | 377.0 | |||||