Wyoming State Water Plan
Wyoming State Water Plan
Wyoming Water Development Office
6920 Yellowtail Rd
Cheyenne, WY 82002
Phone: 307-777-7626

Wyoming Water Development Office
6920 Yellowtail Rd
Cheyenne, WY 82002
Phone: 307-777-7626


| SUBJECT: |
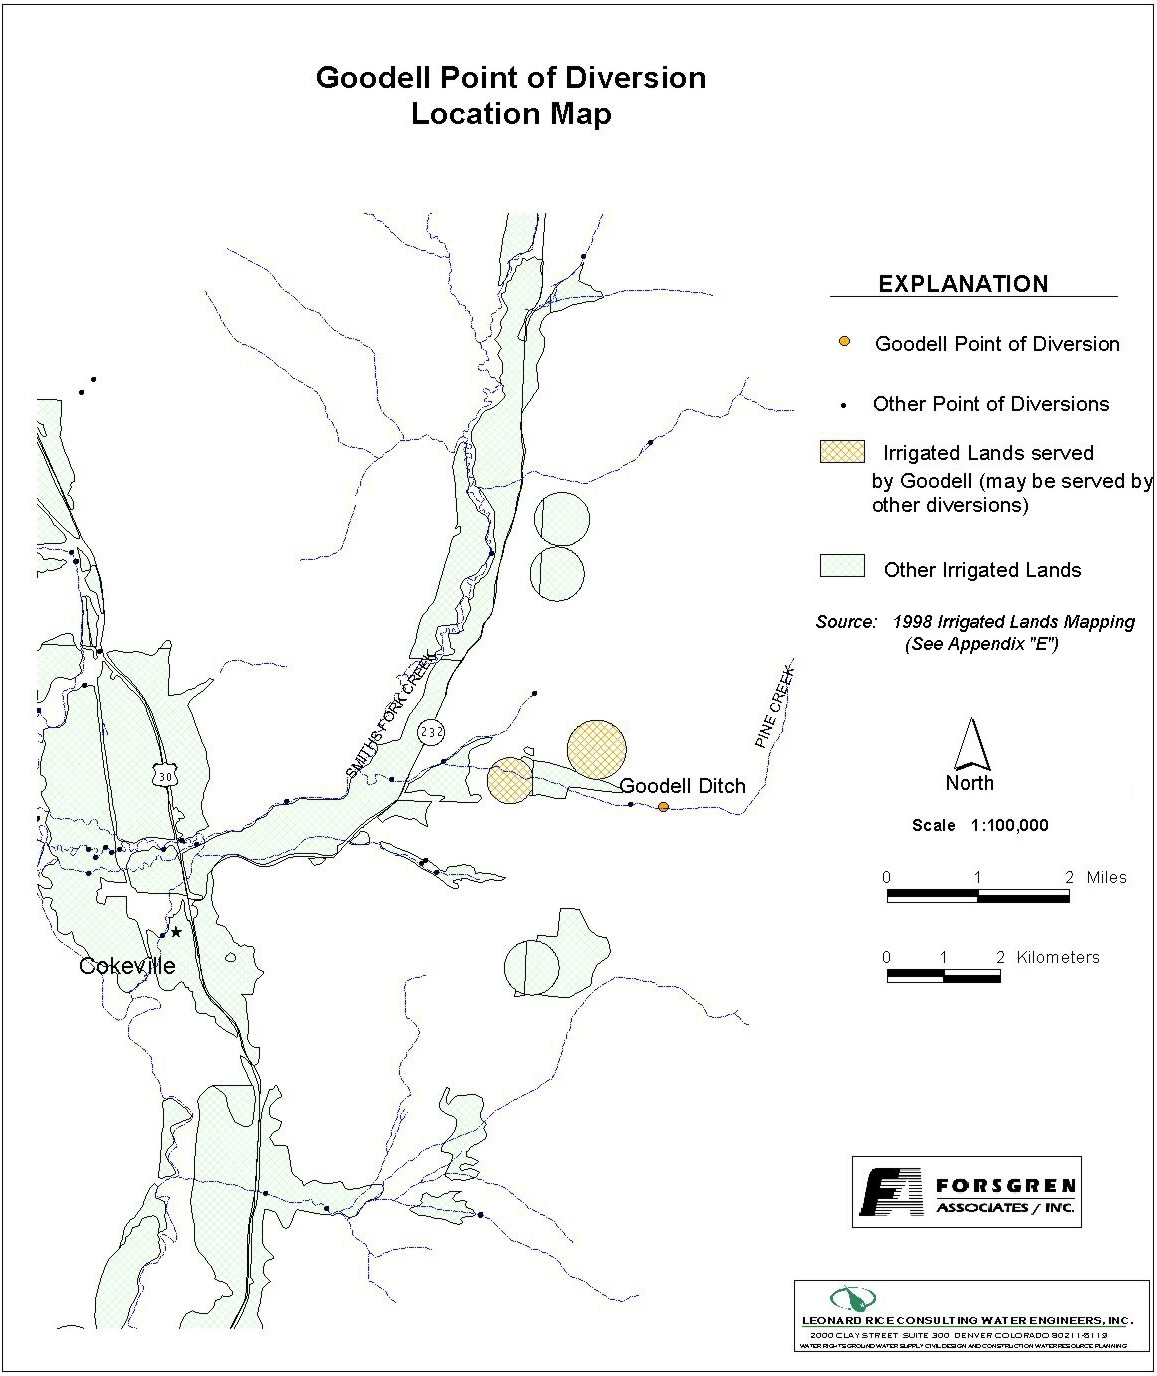
Appendix D Key Structures and Diversions GOODELL DIVERSION |
| PREPARED BY: | Bear River Basin Planning Team |
| DATE: | August 7, 2000 |
| Diversion Description: The headgate structure consists of a 36-inch CMP with a rectangular slide gate set into a concrete headwall. | 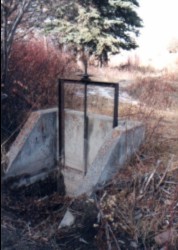 Goodell headgate |
|
Conveyance Description: Open channel canal1
Direct Flow Water Rights:2
| Priority Date | Permit Number |
Permitted Use | Permitted Acres |
Flow (CFS) |
Cumulative (CFS) |
Comments |
|---|---|---|---|---|---|---|
| -1887 | Terr | Irrigation, Domestic, Storage | 287 | 4.10 | 4.10 | |
| -1887 | Terr | Irrigation, Domestic, Storage | 296 | 4.23 | 8.33 | No Irr. right from June 15 to Sept. 15 each year |
| 09-09-1915 | 3512E | Irrigation | 215 | 3.07 | 11.40 | Irr. right limited from June 15 to Sept. 15 each year |
| 09-09-1915 | 3513E | Irrigation, Storage | 111.17 | 1.58 | 12.98 |
Associated Storage Rights: None
Irrigation Practices: Land is irrigated using circular pivots sprinklers.3
Estimated Diversion Efficiency:
Calculated Diversion Efficiency = Conveyance Efficiency X Application Efficiency:
Conveyance Efficiency: 55% Application Efficiency: 85% Overall Diversion Efficiency: 47% Conveyance efficiency is estimated by total length of main canal. Application efficiency for flood irrigation and sprinkler irrigation is estimated at 55% and 85% respectively.
Crop Types / Consumptive Use: The primary crop irrigated from this canal is alfalfa.3
Return Flows: Return flow is primarily captured by Brunner Creek and/or the DC&P Ditch.
The following return flow pattern was adopted for modeling in this study are as follows:
		Month
      (after initial Diversion)	 Percent of Return
		0			50%
		1			25%
		2		        15%
                3                       10%
				       100%
Other Operational Information: Surface flows in Pine Creek tend to disappear into the ground by mid-July when diverting. Pine Creek was decreed a “futile call” by the courts, and as a result it is not regulated for the benefit of more senior water rights on Smiths Fork. There are only two irrigators taking water directly from Pine Creek. Only one irrigator (Thornock) utilizes the Goodell Ditch.
References:
Monthly Diversion Records
Goodell (on Pine Creek)
| YEAR | MAY | JUNE | JULY | AUGUST | SEPTEMBER | ||||||||||
|---|---|---|---|---|---|---|---|---|---|---|---|---|---|---|---|
| Total of Daily Ave for Month | Average CFS |
Monthly Total Ac-Ft |
Total of Daily Ave for Month | Average CFS |
Monthly Total Ac-Ft |
Total of Daily Ave for Month | Average CFS |
Monthly Total Ac-Ft |
Total of Daily Ave for Month | Average CFS |
Monthly Total Ac-Ft |
Total of Daily Ave for Month | Average CFS |
Monthly Total Ac-Ft | |
| 1970 | 178 | 5.7 | 353.1 | 131 | 4.4 | 259.8 | 123 | 4.0 | 244.0 | 110 | 3.5 | 218.2 | 120 | 4.0 | 238.0 |
| 1971 | 379 | 12.2 | 751.7 | 392 | 13.1 | 777.5 | 320 | 10.3 | 634.7 | 337 | 10.9 | 668.4 | 307 | 10.2 | 608.9 |
| 1972 | 26 | 0.8 | 51.6 | 338 | 11.3 | 670.4 | 325 | 10.5 | 644.6 | 287 | 9.3 | 569.3 | 276 | 9.2 | 547.4 |
| 1973 | 0 | 0.0 | 0.0 | 267 | 8.9 | 529.6 | 248 | 8.0 | 491.9 | 248 | 8.0 | 491.9 | 240 | 8.0 | 476.0 |
| 1974 | 277 | 8.9 | 549.4 | 254 | 8.5 | 503.8 | 292 | 9.4 | 579.2 | 301 | 9.7 | 597.0 | 270 | 9.0 | 535.5 |
| 1975 | 126 | 4.1 | 249.9 | 311 | 10.4 | 616.9 | 302 | 9.7 | 599.0 | 287 | 9.3 | 569.3 | 300 | 10.0 | 595.0 |
| 1976 | 250 | 8.1 | 495.9 | 278 | 9.3 | 551.4 | 310 | 10.0 | 614.9 | 40 | 1.3 | 79.3 | 0 | 0.0 | 0.0 |
| 1977 | 186 | 6.0 | 368.9 | 184 | 6.1 | 365.0 | 199 | 6.4 | 394.7 | 217 | 7.0 | 430.4 | 252 | 8.4 | 499.8 |
| 1978 | 0 | 0.0 | 0.0 | 167 | 5.6 | 331.2 | 255 | 8.2 | 505.8 | 273 | 8.8 | 541.5 | 270 | 9.0 | 535.5 |
| 1979 | 0 | 0.0 | 0.0 | 172 | 5.7 | 341.2 | 218 | 7.0 | 432.4 | 124 | 4.0 | 246.0 | 0 | 0.0 | 0.0 |
| 1980 | 104 | 3.4 | 206.3 | 157 | 5.2 | 311.4 | 234 | 7.5 | 464.1 | 241 | 7.8 | 478.0 | 159 | 5.3 | 315.4 |
| 1981 | 58 | 1.9 | 115.0 | 141 | 4.7 | 279.7 | 217 | 7.0 | 430.4 | 217 | 7.0 | 430.4 | 140 | 4.7 | 277.7 |
| 1982 | 0 | 0.0 | 0.0 | 172 | 5.7 | 341.2 | 219 | 7.1 | 434.4 | 137 | 4.4 | 271.7 | 62 | 2.1 | 123.0 |
| 1983 | 0 | 0.0 | 0.0 | 66 | 2.2 | 130.9 | 205 | 6.6 | 406.6 | 101 | 3.3 | 200.3 | 18 | 0.6 | 35.7 |
| 1984 | 0 | 0.0 | 0.0 | 103 | 3.4 | 204.3 | 123 | 4.0 | 244.0 | 165 | 5.3 | 327.3 | 64 | 2.1 | 126.9 |
| 1985 | 98 | 3.2 | 194.4 | 180 | 6.0 | 357.0 | 175 | 5.6 | 347.1 | 101 | 3.3 | 200.3 | 43 | 1.4 | 85.3 |
| 1986 | 40 | 1.3 | 79.3 | 126 | 4.2 | 249.9 | 140 | 4.5 | 277.7 | 136 | 4.4 | 269.8 | 21 | 0.7 | 41.7 |
| 1987 | 232 | 7.5 | 460.2 | 237 | 7.9 | 470.1 | 211 | 6.8 | 418.5 | 217 | 7.0 | 430.4 | 210 | 7.0 | 416.5 |
| 1988 | 70 | 2.3 | 138.8 | 192 | 6.4 | 380.8 | 186 | 6.0 | 368.9 | 164 | 5.3 | 325.3 | 60 | 2.0 | 119.0 |
| 1989 | 248 | 8.0 | 491.9 | 219 | 7.3 | 434.4 | 217 | 7.0 | 430.4 | 217 | 7.0 | 430.4 | 210 | 7.0 | 416.5 |
| 1990 | 97 | 3.1 | 192.4 | 206 | 6.9 | 408.6 | 216 | 7.0 | 428.4 | 143 | 4.6 | 283.6 | 0 | 0.0 | 0.0 |
| 1991 | 133 | 4.3 | 263.8 | 203 | 6.8 | 402.6 | 208 | 6.7 | 412.6 | 183 | 5.9 | 363.0 | 168 | 5.6 | 333.2 |
| 1992 | 165 | 5.3 | 327.3 | 125 | 4.2 | 247.9 | 124 | 4.0 | 246.0 | 40 | 1.3 | 79.3 | 0 | 0.0 | 0.0 |
| 1993 | 93 | 3.0 | 184.5 | 151 | 5.0 | 299.5 | 192 | 6.2 | 380.8 | 192 | 6.2 | 380.8 | 70 | 2.3 | 138.8 |
| 1994 | 74 | 2.4 | 146.8 | 210 | 7.0 | 416.5 | 219 | 7.1 | 434.4 | 153 | 4.9 | 303.5 | 206 | 6.9 | 408.6 |
| 1995 | 36 | 1.2 | 71.4 | 231 | 7.7 | 458.2 | 264 | 8.5 | 523.6 | 240 | 7.7 | 476.0 | 147 | 4.9 | 291.6 |
| 1996 | 86 | 2.8 | 170.6 | 138 | 4.6 | 273.7 | 112 | 3.6 | 222.1 | 112 | 3.6 | 222.1 | 46 | 1.5 | 91.2 |
| 1997 | 43.5 | 1.4 | 86.3 | 6.8 | 0.2 | 13.5 | 249.1 | 8.0 | 494.1 | 120 | 3.9 | 238.0 | 63.5 | 2.1 | 126.0 |
| 1998 | 88.6 | 2.9 | 175.7 | 162.7 | 5.4 | 322.7 | 224.2 | 7.2 | 444.7 | 233 | 7.5 | 462.1 | 173.2 | 5.8 | 343.5 |
| AVERAGES | 3.4 | 211.2 | 6.3 | 377.6 | 7.0 | 432.8 | 5.9 | 365.0 | 4.5 | 266.4 | |||||