Wyoming State Water Plan
Wyoming State Water Plan
Wyoming Water Development Office
6920 Yellowtail Rd
Cheyenne, WY 82002
Phone: 307-777-7626

Wyoming Water Development Office
6920 Yellowtail Rd
Cheyenne, WY 82002
Phone: 307-777-7626


| SUBJECT: |
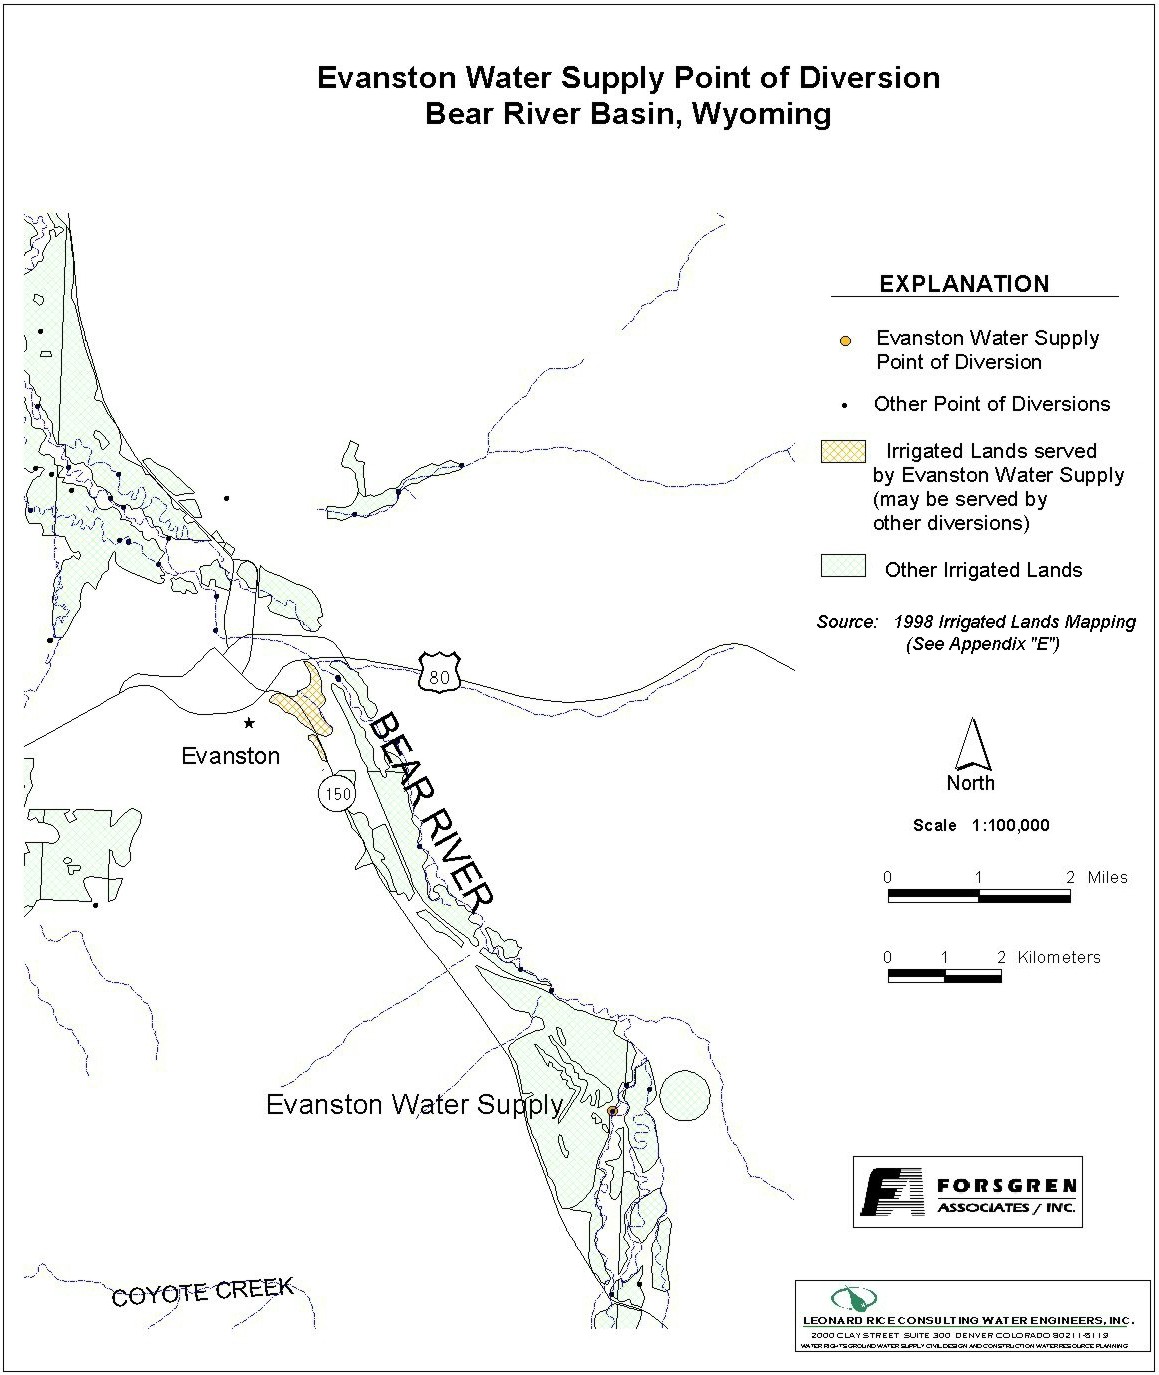
Appendix D Key Structures and Diversions EVANSTON WATER SUPPLY (and Anderson) |
| PREPARED BY: | Bear River Basin Planning Team |
| DATE: | August 7, 2000 |
Diversion Description: Simple headgate structure with slide gate.
Diversion Location: Diversion and irrigated lands are in the Upper Bear River Basin in Wyoming as shown on the location map hereafter.
Conveyance Description: Open channel canal, approximately 26,400 feet in length.1
Direct Flow Water Rights:2
| Priority Date | Permit Number |
Permitted Use | Permitted Acres |
Flow (CFS) |
Cumulative (CFS) |
Comments |
|---|---|---|---|---|---|---|
| 05-15-1882 | Terr | Irrigation | 100 | 1.43 | 1.43 | |
| 03-29-1901 | 693E | Irrigation, Domestic, Storage | 279.93 | 4.00 | 5.43 | Enl Anderson |
| 09-10-1921 | 4263E | Irrigation, Domestic, Storage | 9 | 0.13 | 5.56 | |
| 09-10-1921 | Irrigation Supplemental Supply, Domestic, Storage | 6 | 1.57 | Buchanan (Knight Hollow Spring 1) |
Irrigation Practices: Land is all flood irrigated.3
Estimated Diversion Efficiency:
Calculated Diversion Efficiency = Conveyance Efficiency X Application Efficiency:
Conveyance Efficiency: 50% Application Efficiency: 55% Overall Diversion Efficiency: 27% Conveyance efficiency is estimated by total length of main canal. Application efficiency for flood irrigation and sprinkler irrigation is estimated at 55% and 85% respectively.
CropTypes / Consumptive Use: Water is used primarily to irrigate mixed meadow grasses, primarily Meadow Foxtail, Redtop, etc.
Return Flows: Return flow is primarily intercepted by the Rocky Mountain & Blythe Canal (approx. 50%) and the John Sims Ditch (approx. 50%).
The following return flow pattern was adopted for modeling in this study are as follows:
		Month
      (after initial Diversion)	 Percent of Return
		0			70%
		1			20%
		2		        10%
				       100%
Other Operational Information: The Evanston Water Supply Ditch diversions included municipal demands from the City of Evanston prior to 1989. The City’s 7.25 CFS water right was transferred to the Evanston Pipeline diversion at that time.
References:
Monthly Diversion Records
Evanston Water Supply
| YEAR | MAY | JUNE | JULY | AUGUST | SEPTEMBER | ||||||||||
|---|---|---|---|---|---|---|---|---|---|---|---|---|---|---|---|
| Total of Daily Ave for Month | Average CFS |
Monthly Total Ac-Ft |
Total of Daily Ave for Month | Average CFS |
Monthly Total Ac-Ft |
Total of Daily Ave for Month | Average CFS |
Monthly Total Ac-Ft |
Total of Daily Ave for Month | Average CFS |
Monthly Total Ac-Ft |
Total of Daily Ave for Month | Average CFS |
Monthly Total Ac-Ft | |
| *1970 | |||||||||||||||
| 1971 | 38 | 1.2 | 75.4 | 575 | 19.2 | 1140.5 | 451 | 14.5 | 894.5 | 496 | 16.0 | 983.8 | 308 | 10.3 | 610.9 |
| 1972 | 0 | 0.0 | 0.0 | 183 | 6.1 | 363.0 | 385 | 12.4 | 763.6 | 312 | 10.1 | 618.8 | 0 | 0.0 | 0.0 |
| 1973 | 0 | 0.0 | 0.0 | 375 | 12.5 | 743.8 | 324 | 10.5 | 642.6 | 274 | 8.8 | 543.5 | 80 | 2.7 | 158.7 |
| 1974 | 22 | 0.7 | 43.6 | 328 | 10.9 | 650.6 | 354 | 11.4 | 702.1 | 235 | 7.6 | 466.1 | 47 | 1.6 | 93.2 |
| 1975 | 50 | 1.6 | 99.2 | 240 | 8.0 | 476.0 | 654 | 21.1 | 1297.2 | 255 | 8.2 | 505.8 | 217 | 7.2 | 430.4 |
| 1976 | 246 | 7.9 | 487.9 | 392 | 13.1 | 777.5 | 339 | 10.9 | 672.4 | 271 | 8.7 | 537.5 | 227 | 7.6 | 450.2 |
| 1977 | 216 | 7.0 | 428.4 | 278 | 9.3 | 551.4 | 249 | 8.0 | 493.9 | 184 | 5.9 | 365.0 | 125 | 4.2 | 247.9 |
| 1978 | 0 | 0.0 | 0.0 | 261 | 8.7 | 517.7 | 313 | 10.1 | 620.8 | 312 | 10.1 | 618.8 | 107 | 3.6 | 212.2 |
| 1979 | 159 | 5.1 | 315.4 | 402 | 13.4 | 797.4 | 304 | 9.8 | 603.0 | 199 | 6.4 | 394.7 | 18 | 0.6 | 35.7 |
| 1980 | 81 | 2.6 | 160.7 | 382 | 12.7 | 757.7 | 301 | 9.7 | 597.0 | 115 | 3.7 | 228.1 | 35 | 1.2 | 69.4 |
| 1981 | 81 | 2.6 | 160.7 | 175 | 5.8 | 347.1 | 114 | 3.7 | 226.1 | 84 | 2.7 | 166.6 | 7 | 0.2 | 13.9 |
| 1982 | 0 | 0.0 | 0.0 | 25 | 0.8 | 49.6 | 57 | 1.8 | 113.1 | 54 | 1.7 | 107.1 | 69 | 2.3 | 136.9 |
| 1983 | 31 | 1.0 | 61.5 | 40 | 1.3 | 79.3 | 81 | 2.6 | 160.7 | 67 | 2.2 | 132.9 | 30 | 1.0 | 59.5 |
| 1984 | 14 | 0.5 | 27.8 | 43 | 1.4 | 85.3 | 15 | 0.5 | 29.8 | 0 | 0.0 | 0.0 | 0 | 0.0 | 0.0 |
| 1985 | 17 | 0.5 | 33.7 | 242 | 8.1 | 480.0 | 130 | 4.2 | 257.9 | 81 | 2.6 | 160.7 | 235 | 7.8 | 466.1 |
| 1986 | 52 | 1.7 | 103.1 | 48 | 1.6 | 95.2 | 100 | 3.2 | 198.3 | 182 | 5.9 | 361.0 | 130 | 4.3 | 257.9 |
| 1987 | 116 | 3.7 | 230.1 | 197 | 6.6 | 390.7 | 208 | 6.7 | 412.6 | 282 | 9.1 | 559.3 | 68 | 2.3 | 134.9 |
| 1988 | 31 | 1.0 | 61.5 | 105 | 3.5 | 208.3 | 220 | 7.1 | 436.4 | 165 | 5.3 | 327.3 | 30 | 1.0 | 59.5 |
| 1989 | 53 | 1.7 | 105.1 | 58 | 1.9 | 115.0 | 61 | 2.0 | 121.0 | 103 | 3.3 | 204.3 | 50 | 1.7 | 99.2 |
| 1990 | 18 | 0.6 | 35.7 | 45 | 1.5 | 89.3 | 5 | 0.2 | 9.9 | 0 | 0.0 | 0.0 | 0 | 0.0 | 0.0 |
| 1991 | 7 | 0.2 | 13.9 | 34 | 1.1 | 67.4 | 2 | 0.1 | 4.0 | 3 | 0.1 | 6.0 | 3 | 0.1 | 6.0 |
| 1992 | 2 | 0.1 | 4.0 | 21 | 0.7 | 41.7 | 0 | 0.0 | 0.0 | 0 | 0.0 | 0.0 | 0 | 0.0 | 0.0 |
| 1993 | 2 | 0.1 | 4.0 | 21 | 0.7 | 41.7 | 13 | 0.4 | 25.8 | 0 | 0.0 | 0.0 | 0 | 0.0 | 0.0 |
| 1994 | 0 | 0.0 | 0.0 | 2 | 0.1 | 4.0 | 0 | 0.0 | 0.0 | 0 | 0.0 | 0.0 | 0 | 0.0 | 0.0 |
| 1995 | 0 | 0.0 | 0.0 | 24 | 0.8 | 47.6 | 55 | 1.8 | 109.1 | 27 | 0.9 | 53.6 | 8 | 0.3 | 15.9 |
| 1996 | 14 | 0.5 | 27.8 | 15 | 0.5 | 29.8 | 56 | 1.8 | 111.1 | 46 | 1.5 | 91.2 | 65 | 2.2 | 128.9 |
| 1997 | 13 | 0.4 | 25.8 | 19.2 | 0.6 | 38.1 | 3.1 | 0.1 | 6.1 | 3.1 | 0.1 | 6.1 | 4.2 | 0.1 | 8.3 |
| 1998 | 0 | 0.0 | 0.0 | 14.3 | 0.5 | 28.4 | 97.9 | 3.2 | 194.2 | 81.2 | 2.6 | 161.1 | 64.3 | 2.1 | 127.5 |
| 1999 | 4 | 0.1 | 7.9 | 76 | 2.5 | 150.7 | 107 | 3.5 | 212.2 | 50 | 1.6 | 99.2 | 29 | 1.0 | 57.5 |
| AVERAGES | 1.4 | 86.7 | 5.3 | 316.0 | 5.6 | 341.9 | 4.3 | 265.5 | 2.2 | 133.8 | |||||