Wyoming State Water Plan
Wyoming State Water Plan
Wyoming Water Development Office
6920 Yellowtail Rd
Cheyenne, WY 82002
Phone: 307-777-7626

Wyoming Water Development Office
6920 Yellowtail Rd
Cheyenne, WY 82002
Phone: 307-777-7626


Bear River Basin Water Plan
Technical Memoranda
| SUBJECT: |
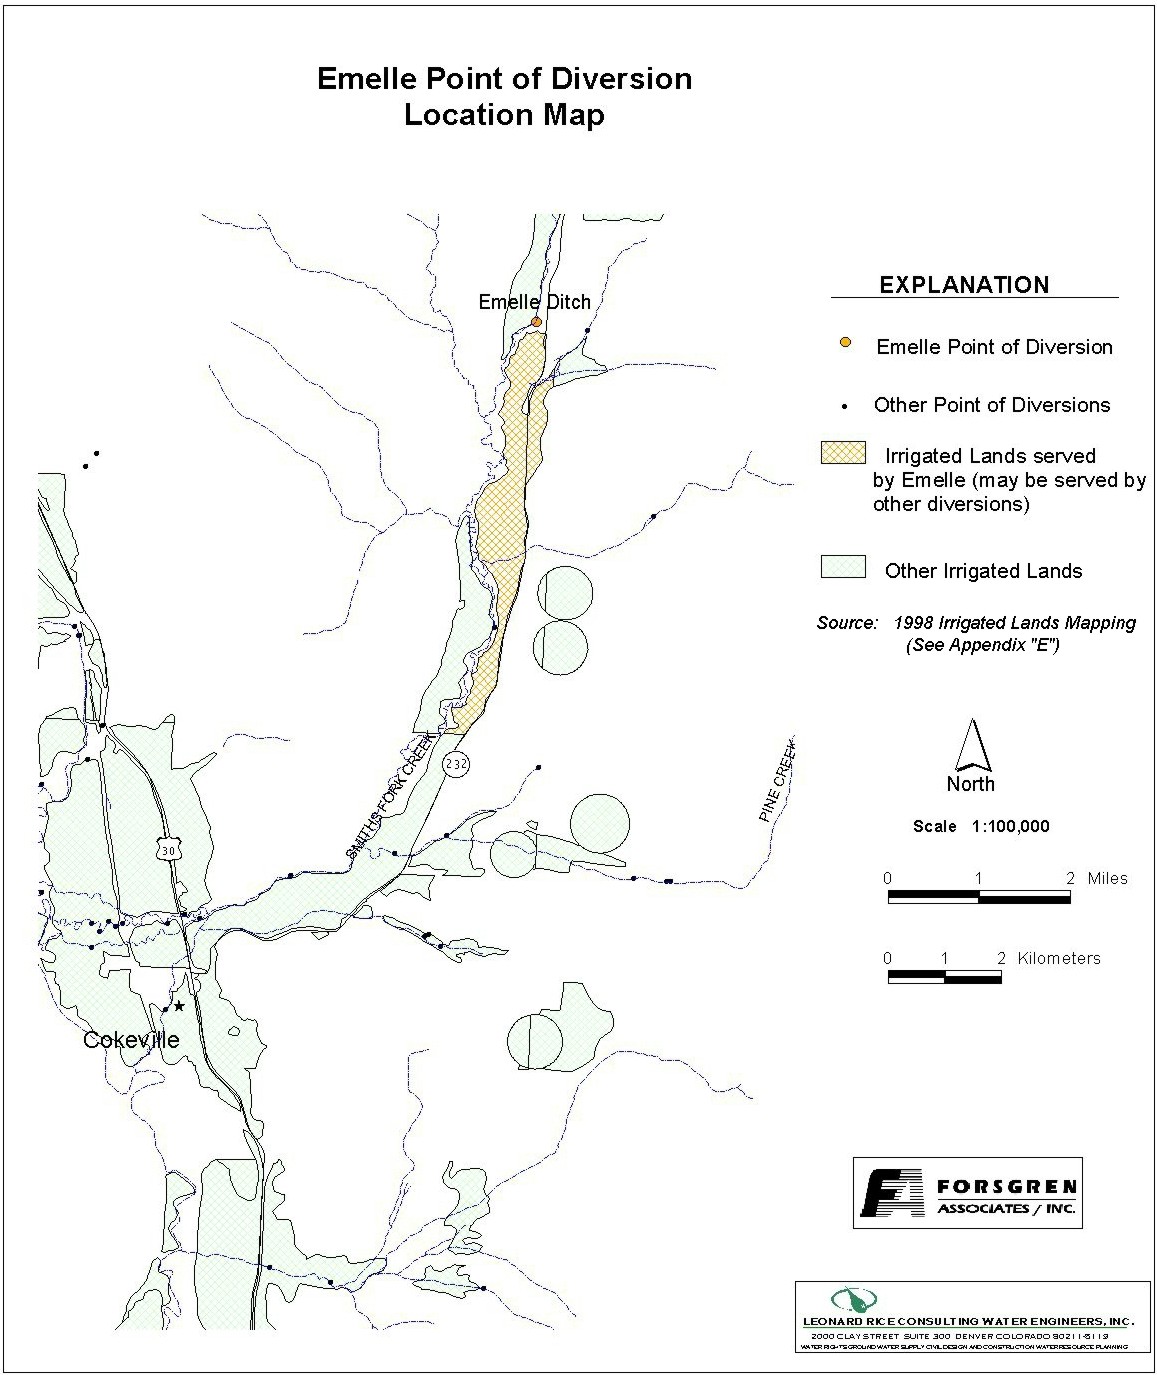
Appendix D Key Structures and Diversions EMELLE CANAL DIVERSION |
| PREPARED BY: | Bear River Basin Planning Team |
| DATE: | August 7, 2000 |
| Diversion Description: The Emelle headgate consists of a concrete headwall with a 74-inch rectangular steel gate. The river is diverted using a rock wall dam. | 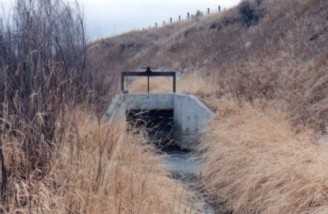 |
|
Conveyance Description: Open channel canal, approximately 21,120 feet in length.1
Direct Flow Water Rights:2
| Priority Date | Permit Number |
Permitted Use | Permitted Acres |
Flow (CFS) |
Cumulative (CFS) |
Comments |
|---|---|---|---|---|---|---|
| 10-02-1901 | 3486 | Irrigation, Storage | 120 | 1.71 | 1.71 | |
| 02-28-1903 | 998E | Irrigation, Storage | 50.50 | 0.72 | 2.43 | |
| 02-28-1903 | 998E | Irrigation, Storage | 258 | 3.68 | 6.11 | |
| 02-28-1903 | 998E | Irrigation, Storage | 52 | 0.74 | 6.85 | |
| 07-07-1905 | 6810 | Irrigation | 160 | 2.28 | 9.13 | |
| 01-24-1907 | 1745E | Irrigation | 112 | 1.60 | 10.73 | |
| 01-24-1907 | 1745E | Irrigation | 80 | 1.14 | 11.87 | |
| 12-17-1910 | 2376E | Irrigation, Storage | 53 | 0.76 | 12.63 | |
| 12-17-1910 | 2377E | Irrigation, Domestic | 155 | 2.21 | 14.84 | |
| 10-17-1916 | 3720E | Irrigation | 34 | 0.49 | 15.33 |
Associated Storage Rights: None
Irrigation Practices: Land is all irrigated using hand lines and wheel side-roll sprinklers.3
Estimated Diversion Efficiency:
Calculated Diversion Efficiency = Conveyance Efficiency X Application Efficiency:
Conveyance Efficiency: 65% Application Efficiency: 85% Overall Diversion Efficiency: 55% Conveyance efficiency is estimated by total length of main canal. Application efficiency for flood irrigation and sprinkler irrigation is estimated at 55% and 85% respectively.
Crop Types / Consumptive Use: Approximately 85% of the irrigated acreage is alfalfa and grains (mostly oats) rotated. The remaining 15% is meadow grasses There are usually 2 crops with a 3rd crop left for pasture.3
Return Flows: Return flow is captured by the Cooper Ditch (approx. 50%) and the Covey Canal (approx. 50%).
The following return flow pattern was adopted for modeling in this study are as follows:
		Month
      (after initial Diversion)	 Percent of Return
		0			70%
		1			20%
		2			10%
                3                        0%
                                       100%
References:
Monthly Diversion Records
Emelle (on Smith's Fork)
| YEAR | MAY | JUNE | JULY | AUGUST | SEPTEMBER | ||||||||||
|---|---|---|---|---|---|---|---|---|---|---|---|---|---|---|---|
| Total of Daily Ave for Month | Average CFS |
Monthly Total Ac-Ft |
Total of Daily Ave for Month | Average CFS |
Monthly Total Ac-Ft |
Total of Daily Ave for Month | Average CFS |
Monthly Total Ac-Ft |
Total of Daily Ave for Month | Average CFS |
Monthly Total Ac-Ft |
Total of Daily Ave for Month | Average CFS |
Monthly Total Ac-Ft | |
| 1970 | 43 | 1.4 | 85.3 | 474 | 15.8 | 940.2 | 314 | 10.1 | 622.8 | 345 | 11.1 | 684.3 | 92 | 3.1 | 182.5 |
| 1971 | 0 | 0.0 | 0.0 | 406 | 13.5 | 805.3 | 312 | 10.1 | 618.8 | 19 | 0.6 | 37.7 | 0 | 0.0 | 0.0 |
| 1972 | 221 | 7.1 | 438.3 | 558 | 18.6 | 1106.8 | 97 | 3.1 | 192.4 | 0 | 0.0 | 0.0 | 0 | 0.0 | 0.0 |
| 1973 | 218 | 7.0 | 432.4 | 557 | 18.6 | 1104.8 | 97 | 3.1 | 192.4 | 0 | 0.0 | 0.0 | 0 | 0.0 | 0.0 |
| 1974 | 0 | 0.0 | 0.0 | 943 | 31.4 | 1870.4 | 544 | 17.5 | 1079.0 | 455 | 14.7 | 902.5 | 60 | 2.0 | 119.0 |
| 1975 | 0 | 0.0 | 0.0 | 128 | 4.3 | 253.9 | 353 | 11.4 | 700.2 | 555 | 17.9 | 1100.8 | 26 | 0.9 | 51.6 |
| 1976 | 0 | 0.0 | 0.0 | 540 | 18.0 | 1071.1 | 529 | 17.1 | 1049.3 | 434 | 14.0 | 860.8 | 14 | 0.5 | 27.8 |
| 1977 | 0 | 0.0 | 0.0 | 0 | 0.0 | 0.0 | 0 | 0.0 | 0.0 | 0 | 0.0 | 0.0 | 0 | 0.0 | 0.0 |
| 1978 | 0 | 0.0 | 0.0 | 605 | 20.2 | 1200.0 | 704 | 22.7 | 1396.4 | 583 | 18.8 | 1156.4 | 0 | 0.0 | 0.0 |
| 1979 | 0 | 0.0 | 0.0 | 651 | 21.7 | 1291.2 | 504 | 16.3 | 999.7 | 470 | 15.2 | 932.2 | 84 | 2.8 | 166.6 |
| 1980 | 0 | 0.0 | 0.0 | 296 | 9.9 | 587.1 | 421 | 13.6 | 835.0 | 320 | 10.3 | 634.7 | 26 | 0.9 | 51.6 |
| 1981 | 0 | 0.0 | 0.0 | 418 | 13.9 | 829.1 | 432 | 13.9 | 856.9 | 462 | 14.9 | 916.4 | 103 | 3.4 | 204.3 |
| 1982 | 0 | 0.0 | 0.0 | 367 | 12.2 | 727.9 | 273 | 8.8 | 541.5 | 432 | 13.9 | 856.9 | 158 | 5.3 | 313.4 |
| 1983 | 0 | 0.0 | 0.0 | 158 | 5.3 | 313.4 | 340 | 11.0 | 674.4 | 235 | 7.6 | 466.1 | 0 | 0.0 | 0.0 |
| 1984 | 0 | 0.0 | 0.0 | 169 | 5.6 | 335.2 | 356 | 11.5 | 706.1 | 196 | 6.3 | 388.8 | 0 | 0.0 | 0.0 |
| 1985 | 36 | 1.2 | 71.4 | 484 | 16.1 | 960.0 | 617 | 19.9 | 1223.8 | 397 | 12.8 | 787.4 | 0 | 0.0 | 0.0 |
| 1986 | 0 | 0.0 | 0.0 | 284 | 9.5 | 563.3 | 455 | 14.7 | 902.5 | 311 | 10.0 | 616.9 | 64 | 2.1 | 126.9 |
| 1987 | 435 | 14.0 | 862.8 | 398 | 13.3 | 789.4 | 395 | 12.7 | 783.5 | 190 | 6.1 | 376.9 | 24 | 0.8 | 47.6 |
| 1988 | 4 | 0.1 | 7.9 | 624 | 20.8 | 1237.7 | 471 | 15.2 | 934.2 | 128 | 4.1 | 253.9 | 0 | 0.0 | 0.0 |
| 1989 | 160 | 5.2 | 317.4 | 538 | 17.9 | 1067.1 | 498 | 16.1 | 987.8 | 313 | 10.1 | 620.8 | 0 | 0.0 | 0.0 |
| 1990 | 4 | 0.1 | 7.9 | 257 | 8.6 | 509.8 | 260 | 8.4 | 515.7 | 102 | 3.3 | 202.3 | 0 | 0.0 | 0.0 |
| 1991 | 0 | 0.0 | 0.0 | 483 | 16.1 | 958.0 | 321 | 10.4 | 636.7 | 162 | 5.2 | 321.3 | 0 | 0.0 | 0.0 |
| 1992 | 378 | 12.2 | 749.8 | 434 | 14.5 | 860.8 | 521 | 16.8 | 1033.4 | 31 | 1.0 | 61.5 | 0 | 0.0 | 0.0 |
| 1993 | 1 | 0.0 | 2.0 | 333 | 11.1 | 660.5 | 511 | 16.5 | 1013.6 | 283 | 9.1 | 561.3 | 80 | 2.7 | 158.7 |
| 1994 | 176 | 5.7 | 349.1 | 503 | 16.8 | 997.7 | 287 | 9.3 | 569.3 | 0 | 0.0 | 0.0 | 0 | 0.0 | 0.0 |
| 1995 | 0 | 0.0 | 0.0 | 273 | 9.1 | 541.5 | 522 | 16.8 | 1035.4 | 494 | 15.9 | 979.8 | 14 | 0.5 | 27.8 |
| 1996 | 0 | 0.0 | 0.0 | 356 | 11.9 | 706.1 | 454 | 14.6 | 900.5 | 342 | 11.0 | 678.3 | 8 | 0.3 | 15.9 |
| 1997 | 0 | 0.0 | 0.0 | 159.3 | 5.3 | 316.0 | 409.4 | 13.2 | 812.0 | 335.3 | 10.8 | 665.1 | 2.1 | 0.1 | 4.2 |
| 1998 | 39.6 | 1.3 | 78.5 | 227.8 | 7.6 | 451.8 | 337.2 | 10.9 | 668.8 | 31.1 | 1.0 | 61.7 | 0 | 0.0 | 0.0 |
| AVERAGES | 1.9 | 117.3 | 13.4 | 795.0 | 12.6 | 775.2 | 8.5 | 521.5 | 0.9 | 51.6 | |||||
To the Bear River Basin Water Plan
Wyoming Water Development Office
6920 Yellowtail Rd
Cheyenne, WY 82002
Phone: 307-777-7626