Wyoming State Water Plan
Wyoming State Water Plan
Wyoming Water Development Office
6920 Yellowtail Rd
Cheyenne, WY 82002
Phone: 307-777-7626

Wyoming Water Development Office
6920 Yellowtail Rd
Cheyenne, WY 82002
Phone: 307-777-7626


| SUBJECT: |
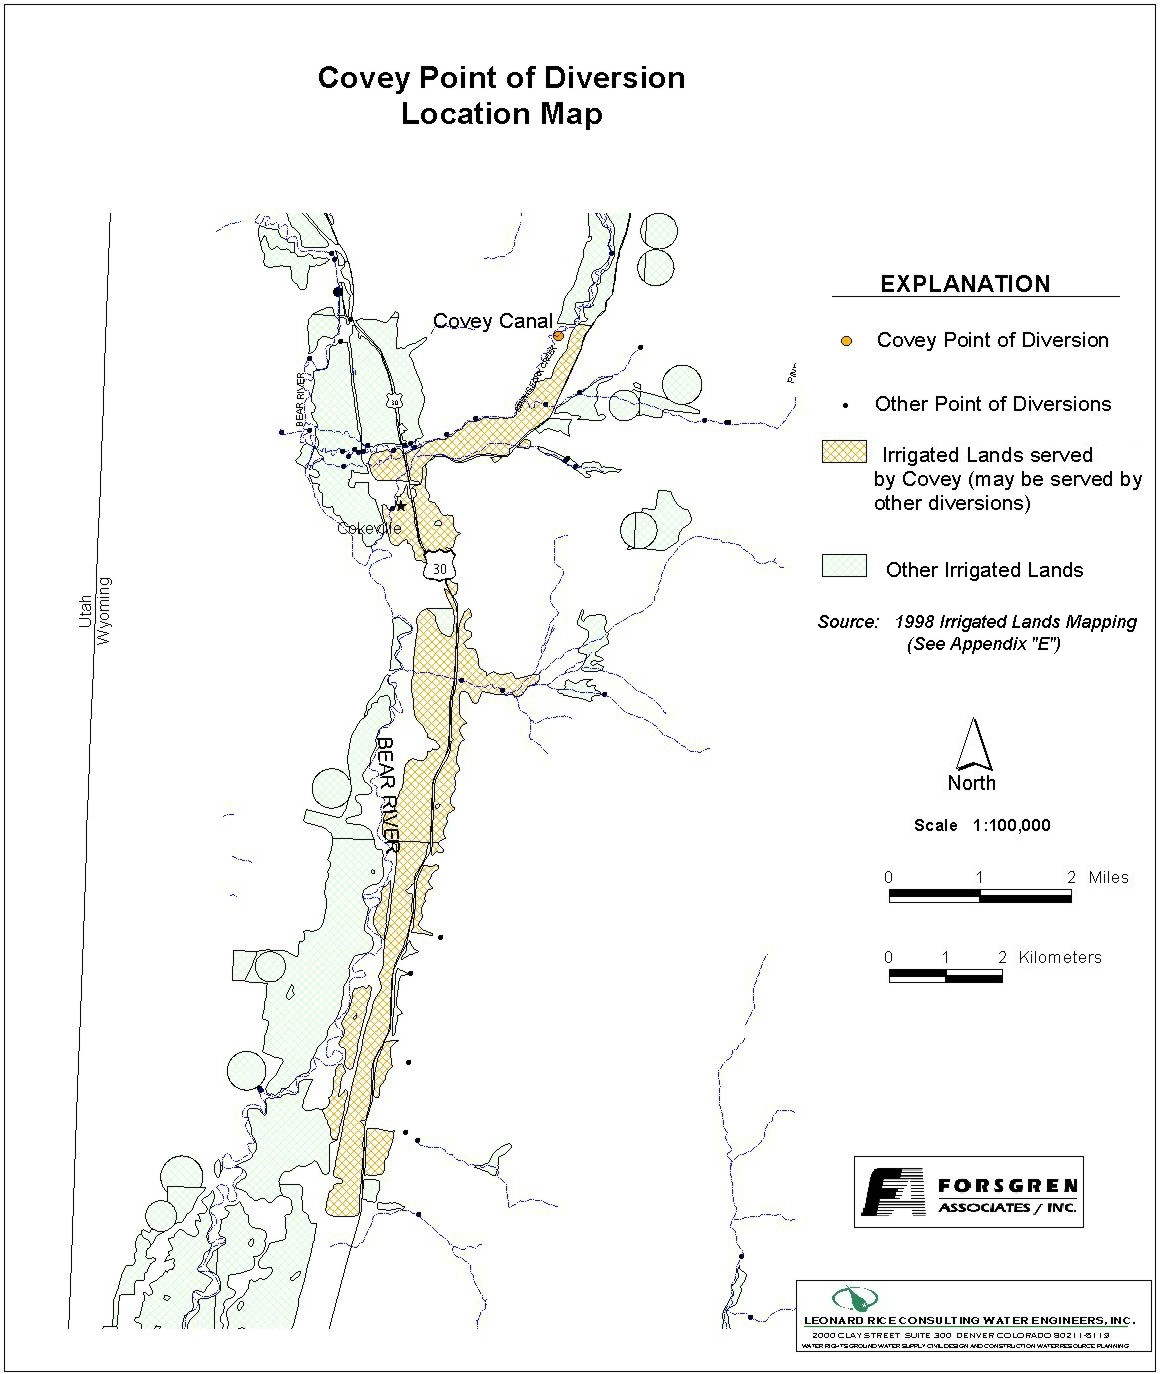
Appendix D Key Structures and Diversions COVEY CANAL DIVERSION |
| PREPARED BY: | Bear River Basin Planning Team |
| DATE: | August 7, 2000 |
| Diversion Description:The Covey Canal headgate consists of two 62-inch rectangular steel gates set into a concrete headwall. The structure was built in the early 1990’s. There is a concrete cut-off wall across the river to divert flows. There is a side outlet gate to pass low flows downstream. | 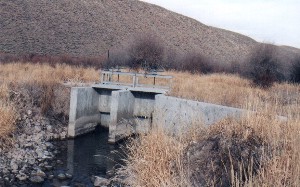 Covey Canal headgate structure |
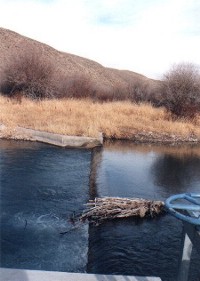 Covey Canal cut-off wall across the Smiths Fork |
|
| Conveyance Description: Open channel canal, approximately 121,000 feet in length1 |
Direct Flow Water Rights:2
| Priority Date | Permit Number |
Permitted Use | Permitted Acres |
Flow (CFS) |
Cumulative (CFS) |
Comments |
|---|---|---|---|---|---|---|
| 05-22-1886 | Terr | Irrigation, Storage | 70 | 1.00 | 1.00 | |
| 10-28-1886 | Terr | Irrigation, Storage | 165 | 2.36 | 3.36 | |
| 10-28-1886 | Terr | Irrigation, Storage | 70 | 1.00 | 4.36 | |
| 05-10-1890 | Terr | Irrigation, Storage | 65 | 0.93 | 5.29 | |
| 05-18-1893 | 491 | Irrigation | 275 | 2.92 | 9.21 | |
| 06-20-1894 | 750 | Irrigation, Domestic, Storage | 319.96 | 4.57 | 13.78 | |
| 05-31-1897 | 514 | Irrigation, Domestic, Storage | 514 | 7.34 | 21.12 | |
| 04-21-1902 | 823E | Irrigation, Domestic, Storage | 34 | 0.18 | 21.60 | |
| 09-26-1903 | 1094E | Irrigation, Domestic, Storage | 40 | 0.57 | 22.17 | |
| 03-09-1909 | 2065E | Irrigation | 45 | 0.64 | 22.81 | |
| 03-09-1909 | 2065E | Irrigation | 119 | 1.70 | 24.51 | |
| 06-09-1909 | 9120 | Irrigation, Domestic | 403.18 | 5.75 | 30.26 | |
| 06-09-1909 | 9120 | Irrigation, Domestic | 201.46 | 2.88 | 33.14 | |
| 06-09-1909 | 9120 | Irrigation, Domestic | 47.20 | 0.67 | 33.81 | |
| 06-09-1909 | 9120 | Irrigation, Domestic | 47.58 | 0.68 | 34.49 | |
| 06-09-1909 | 9120 | Irrigation, Domestic | 73.45 | 1.05 | 35.54 | |
| 06-09-1909 | 9120 | Irrigation, Domestic | 26.76 | 0.37 | 35.91 | |
| 06-09-1909 | 9120 | Irrigation, Domestic | 100 | 1.42 | 37.33 | |
| 06-09-1909 | 9120 | Irrigation, Domestic | 336.88 | 4.81 | 42.14 | |
| 06-09-1909 | 9120 | Irrigation, Domestic | 154.66 | 2.20 | 44.34 | |
| 06-09-1909 | 9120 | Irrigation, Domestic | 44 | 0.63 | 44.97 | |
| 06-09-1909 | 9120 | Irrigation, Domestic | 26.16 | 0.37 | 45.34 | |
| 06-09-1909 | 9120 | Irrigation, Domestic | 31.55 | 0.44 | 45.78 | |
| 06-09-1909 | 9120 | Irrigation, Domestic | 139.25 | 1.99 | 47.77 | |
| 06-09-1909 | Supplemental Supply | 121.47 | Pixley, Bear River | |||
| 06-09-1909 | Supplemental Supply | 351.28 | Leeds Creek | |||
| 06-09-1909 | 9120 | Irrigation, Storage | 101.20 | 1.44 | 49.21 | |
| 06-09-1909 | 9120 | Irrigation, Domestic | 200 | 1.86 | 52.07 | |
| 06-09-1909 | 9120 | Irrigation, Domestic | 61.65 | 0.88 | 52.95 | |
| 06-09-1909 | Supplemental Supply | 25.48 | Pixley, Bear River | |||
| 06-09-1909 | Supplemental Supply | 17.17 | Leeds Creek | |||
| 09-05-1911 | 2585E | Irrigation, Domestic, Storage | 185.62 | 2.65 | 55.60 | |
| 11-20-1912 | 2700E | Irrigation, Domestic | 55.72 | 0.79 | 56.39 | |
| 11-20-1912 | 2700E | Irrigation, Domestic | 28.23 | 0.40 | 56.79 | |
| 11-20-1912 | 2700E | Irrigation, Domestic | 110.33 | 1.58 | 58.37 | |
| 11-20-1912 | 2700E | Irrigation, Domestic | 28.45 | 0.40 | 58.77 | |
| 11-20-1912 | 2700E | Irrigation, Domestic | 13.84 | 0.19 | 58.96 | |
| 08-30-1913 | 2913E | Irrigation | 14 | 0.20 | 59.16 | |
| 08-30-1913 | 2914E | Irrigation | 55 | 0.79 | 59.95 | |
| 08-30-1913 | 2915E | Irrigation | 15.50 | 0.22 | 60.17 | |
| 08-30-1913 | 2916E | Irrigation | 32 | 0.46 | 60.63 | |
| 09-27-1927 | 4561E | Irrigation | 99.60 | 1.42 | 62.05 | |
| 01-08-1953 | 5657E | Irrigation, Storage | 75 | 1.07 | 63.12 | |
| 01-08-1953 | 5657E | Supplemental Supply | 27 | Haggery No. 3, Brunner Creek |
Associated Storage Rights: None
Irrigation Practices: Irrigation practices are mixed (Approx. 70% flood irrigation, 30% center pivot sprinkler irrigation).3
Estimated Diversion Efficiency:
Calculated Diversion Efficiency = Conveyance Efficiency X Application Efficiency:
Conveyance Efficiency: 45% Application Efficiency: 65% Overall Diversion Efficiency: 30% Conveyance efficiency is estimated by total length of main canal. Application efficiency for flood irrigation and sprinkler irrigation is estimated at 55% and 85% respectively.
Crop Types / Consumptive Use: Irrigated acreage is mixed between meadow grasses, alfalfa, and grains (primarily oats). In general, the sprinkled acreage is alfalfa and grains.3
Return Flows: Return flow is primarily captured the Whites Water Ditch (approx. 10%) with the remaining 90% returning to the Bear River.
The following return flow pattern was adopted for modeling in this study are as follows:
		Month
      (after initial Diversion)	 Percent of Return
		0			50%
		1			25%
		2			15%
                3                       10%
                                       100%
Other Operational Information: The Covey Canal is operated by the Smiths Fork Irrigation District. The canal is very long with the most senior water rights appropriated to irrigated lands near the end of the canal.
References:
Monthly Diversion Records
Covey Canal
(Cumulative Totals of Diversions at Smith's Fork, Bruner Creek, and Spring Creek)
| YEAR | MAY | JUNE | JULY | AUGUST | SEPTEMBER | ||||||||||
|---|---|---|---|---|---|---|---|---|---|---|---|---|---|---|---|
| Total of Daily Ave for Month | Average CFS |
Monthly Total Ac-Ft |
Total of Daily Ave for Month | Average CFS |
Monthly Total Ac-Ft |
Total of Daily Ave for Month | Average CFS |
Monthly Total Ac-Ft |
Total of Daily Ave for Month | Average CFS |
Monthly Total Ac-Ft |
Total of Daily Ave for Month | Average CFS |
Monthly Total Ac-Ft | |
| 1970 | 1672 | 53.9 | 3316.4 | 3077 | 102.6 | 6103.1 | 2896 | 93.4 | 5744.1 | 3452 | 111.4 | 6846.9 | 26 | 0.9 | 51.6 |
| 1971 | 1025 | 33.1 | 2033.1 | 3682 | 122.7 | 7303.1 | 3028 | 97.7 | 6006.0 | 2650 | 85.5 | 5256.2 | 135 | 4.5 | 267.8 |
| 1972 | 1205 | 38.9 | 2390.1 | 4137 | 137.9 | 8205.6 | 3828 | 123.5 | 7592.7 | 2777 | 89.6 | 5508.1 | 543 | 18.1 | 1077.0 |
| 1973 | 710 | 22.9 | 1408.3 | 3916 | 130.5 | 7767.3 | 2914 | 94.0 | 5779.8 | 2160 | 69.7 | 4284.3 | 457 | 15.2 | 906.4 |
| 1974 | 1370 | 44.2 | 2717.4 | 6175 | 205.8 | 12247.9 | 2644 | 85.3 | 5244.3 | 2137 | 68.9 | 4238.7 | 816 | 27.2 | 1618.5 |
| 1975 | 981 | 31.6 | 1945.8 | 3117 | 103.9 | 6182.5 | 3206 | 103.4 | 6359.0 | 1761 | 56.8 | 3492.9 | 487 | 16.2 | 966.0 |
| 1976 | 1228 | 39.6 | 2435.7 | 3270 | 109.0 | 6486.0 | 5029 | 162.2 | 9974.9 | 2236 | 72.1 | 4435.0 | 420 | 14.0 | 833.1 |
| 1977 | 563 | 18.2 | 1116.7 | 520 | 17.3 | 1031.4 | 354 | 11.4 | 702.1 | 372 | 12.0 | 737.9 | 275 | 9.2 | 545.5 |
| 1978 | 1380 | 44.5 | 2737.2 | 2553 | 85.1 | 5063.8 | 2797 | 90.2 | 5547.8 | 1760 | 56.8 | 3490.9 | 640 | 21.3 | 1269.4 |
| 1979 | 1146 | 37.0 | 2273.1 | 2906 | 96.9 | 5764.0 | 2008 | 64.8 | 3982.8 | 1138 | 36.7 | 2257.2 | 382 | 12.7 | 757.7 |
| 1980 | 703 | 22.7 | 1394.4 | 2311 | 77.0 | 4583.8 | 3222 | 103.9 | 6390.7 | 1092 | 35.2 | 2166.0 | 428 | 14.3 | 848.9 |
| 1981 | 1718 | 55.4 | 3407.6 | 1795 | 59.8 | 3560.3 | 1858 | 59.9 | 3685.3 | 1190 | 38.4 | 2360.3 | 595 | 19.8 | 1180.2 |
| 1982 | 1079 | 34.8 | 2140.2 | 2520 | 84.0 | 4998.3 | 1859 | 60.0 | 3687.3 | 1711 | 55.2 | 3393.7 | 783 | 26.1 | 1553.1 |
| 1983 | 901 | 29.1 | 1787.1 | 1687 | 56.2 | 3346.1 | 2181 | 70.4 | 4326.0 | 1018 | 32.8 | 2019.2 | 931 | 31.0 | 1846.6 |
| 1984 | 1207 | 38.9 | 2394.0 | 2322 | 77.4 | 4605.6 | 2220 | 71.6 | 4403.3 | 1901 | 61.3 | 3770.6 | 472 | 15.7 | 936.2 |
| 1985 | 1361 | 43.9 | 2699.5 | 2598 | 86.6 | 5153.1 | 2263 | 73.0 | 4488.6 | 1198 | 38.6 | 2376.2 | 645 | 21.5 | 1279.3 |
| 1986 | 1358 | 43.8 | 2693.6 | 2940 | 98.0 | 5831.4 | 1900 | 61.3 | 3768.6 | 1904 | 61.4 | 3776.5 | 779 | 26.0 | 1545.1 |
| 1987 | 511 | 16.5 | 1013.6 | 1894 | 63.1 | 3756.7 | 1981 | 63.9 | 3929.3 | 974 | 31.4 | 1931.9 | 551 | 18.4 | 1092.9 |
| 1988 | 2533 | 81.7 | 5024.1 | 2291 | 76.4 | 4544.1 | 1572 | 50.7 | 3118.0 | 716 | 23.1 | 1420.2 | 394 | 13.1 | 781.5 |
| 1989 | 1977 | 63.8 | 3921.3 | 2386 | 79.5 | 4732.6 | 1620 | 52.3 | 3213.2 | 1357 | 43.8 | 2691.6 | 604 | 20.1 | 1198.0 |
| 1990 | 2129 | 68.7 | 4222.8 | 1938 | 64.6 | 3844.0 | 1094 | 35.3 | 2169.9 | 334 | 10.8 | 662.5 | 0 | 0.0 | 0.0 |
| 1991 | 2425 | 78.2 | 4809.9 | 3028 | 100.9 | 6006.0 | 2328 | 75.1 | 4617.5 | 1419 | 45.8 | 2814.5 | 270 | 9.0 | 535.5 |
| 1992 | 987 | 31.8 | 1957.7 | 1696 | 56.5 | 3364.0 | 1000 | 32.3 | 1983.5 | 95 | 3.1 | 188.4 | 0 | 0.0 | 0.0 |
| 1993 | 1218 | 39.3 | 2415.9 | 3241 | 108.0 | 6428.4 | 2045 | 66.0 | 4056.2 | 1167 | 37.6 | 2314.7 | 911 | 30.4 | 1806.9 |
| 1994 | 1347 | 43.5 | 2671.7 | 1978 | 65.9 | 3923.3 | 1011 | 32.6 | 2005.3 | 287 | 9.3 | 569.3 | 230 | 7.7 | 456.2 |
| 1995 | 2104 | 67.9 | 4173.2 | 2320 | 77.3 | 4601.7 | 1947 | 62.8 | 3861.8 | 1515 | 48.9 | 3005.0 | 1492 | 49.7 | 2959.3 |
| 1996 | 985 | 31.8 | 1953.7 | 3043 | 101.4 | 6035.7 | 2519 | 81.3 | 4996.4 | 1111 | 35.8 | 2203.6 | 840 | 28.0 | 1666.1 |
| 1997 | 1140.2 | 36.8 | 2261.6 | 4067.7 | 135.6 | 8068.2 | 2425.1 | 78.2 | 4810.1 | 744.3 | 24.0 | 1476.3 | 612.7 | 20.4 | 1215.3 |
| 1998 | 1000.2 | 32.3 | 1983.9 | 601.1 | 20.0 | 1192.3 | 3314.2 | 106.9 | 6573.6 | 949.3 | 30.6 | 1882.9 | 613.2 | 20.4 | 1216.3 |
| AVERAGES | 42.2 | 2596.5 | 89.7 | 5335.5 | 74.6 | 4586.8 | 45.7 | 2812.8 | 17.6 | 1048.6 | |||||
Monthly Diversion Records
Covey Canal at Bruner Creek
| YEAR | MAY | JUNE | JULY | AUGUST | SEPTEMBER | ||||||||||
|---|---|---|---|---|---|---|---|---|---|---|---|---|---|---|---|
| Total of Daily Ave for Month | Average CFS |
Monthly Total Ac-Ft |
Total of Daily Ave for Month | Average CFS |
Monthly Total Ac-Ft |
Total of Daily Ave for Month | Average CFS |
Monthly Total Ac-Ft |
Total of Daily Ave for Month | Average CFS |
Monthly Total Ac-Ft |
Total of Daily Ave for Month | Average CFS |
Monthly Total Ac-Ft | |
| 1970 | 259 | 8.4 | 513.7 | 92 | 3.1 | 182.5 | 66 | 2.1 | 130.9 | 1664 | 53.7 | 3300.5 | 0 | 0.0 | 0.0 |
| 1971 | 0 | 0.0 | 0.0 | 96 | 3.2 | 190.4 | 0 | 0.0 | 0.0 | 397 | 12.8 | 787.4 | 0 | 0.0 | 0.0 |
| 1972 | 0 | 0.0 | 0.0 | 96 | 3.2 | 190.4 | 377 | 12.2 | 747.8 | 397 | 12.8 | 787.4 | 495 | 16.5 | 981.8 |
| 1973 | 0 | 0.0 | 0.0 | 91 | 3.0 | 180.5 | 215 | 6.9 | 426.4 | 232 | 7.5 | 460.2 | 0 | 0.0 | 0.0 |
| 1974 | 230 | 7.4 | 456.2 | 3026 | 100.9 | 6002.0 | 89 | 2.9 | 176.5 | 195 | 6.3 | 386.8 | 0 | 0.0 | 0.0 |
| 1975 | 0 | 0.0 | 0.0 | 174 | 5.8 | 345.1 | 234 | 7.5 | 464.1 | 302 | 9.7 | 599.0 | 270 | 9.0 | 535.5 |
| 1976 | 200 | 6.5 | 396.7 | 187 | 6.2 | 370.9 | 1789 | 57.7 | 3548.4 | 270 | 8.7 | 535.5 | 240 | 8.0 | 476.0 |
| 1977 | 240 | 7.7 | 476.0 | 224 | 7.5 | 444.3 | 213 | 6.9 | 422.5 | 217 | 7.0 | 430.4 | 0 | 0.0 | 0.0 |
| 1978 | 402 | 13.0 | 797.4 | 232 | 7.7 | 460.2 | 285 | 9.2 | 565.3 | 273 | 8.8 | 541.5 | 270 | 9.0 | 535.5 |
| 1979 | 283 | 9.1 | 561.3 | 265 | 8.8 | 525.6 | 166 | 5.4 | 329.3 | 151 | 4.9 | 299.5 | 0 | 0.0 | 0.0 |
| 1980 | 425 | 13.7 | 843.0 | 232 | 7.7 | 460.2 | 212 | 6.8 | 420.5 | 219 | 7.1 | 434.4 | 244 | 8.1 | 484.0 |
| 1981 | 280 | 9.0 | 555.4 | 249 | 8.3 | 493.9 | 227 | 7.3 | 450.2 | 214 | 6.9 | 424.5 | 205 | 6.8 | 406.6 |
| 1982 | 517 | 16.7 | 1025.5 | 166 | 5.5 | 329.3 | 5 | 0.2 | 9.9 | 311 | 10.0 | 616.9 | 377 | 12.6 | 747.8 |
| 1983 | 679 | 21.9 | 1346.8 | 13 | 0.4 | 25.8 | 584 | 18.8 | 1158.3 | 18 | 0.6 | 35.7 | 704 | 23.5 | 1396.4 |
| 1984 | 894 | 28.8 | 1773.2 | 651 | 21.7 | 1291.2 | 532 | 17.2 | 1055.2 | 444 | 14.3 | 880.7 | 0 | 0.0 | 0.0 |
| 1985 | 506 | 16.3 | 1003.6 | 93 | 3.1 | 184.5 | 248 | 8.0 | 491.9 | 259 | 8.4 | 513.7 | 272 | 9.1 | 539.5 |
| 1986 | 899 | 29.0 | 1783.1 | 797 | 26.6 | 1580.8 | 684 | 22.1 | 1356.7 | 558 | 18.0 | 1106.8 | 566 | 18.9 | 1122.6 |
| 1987 | 321 | 10.4 | 636.7 | 181 | 6.0 | 359.0 | 197 | 6.4 | 390.7 | 223 | 7.2 | 442.3 | 223 | 7.4 | 442.3 |
| 1988 | 453 | 14.6 | 898.5 | 176 | 5.9 | 349.1 | 124 | 4.0 | 246.0 | 152 | 4.9 | 301.5 | 154 | 5.1 | 305.5 |
| 1989 | 86 | 2.8 | 170.6 | 90 | 3.0 | 178.5 | 93 | 3.0 | 184.5 | 93 | 3.0 | 184.5 | 114 | 3.8 | 226.1 |
| 1990 | 44 | 1.4 | 87.3 | 30 | 1.0 | 59.5 | 31 | 1.0 | 61.5 | 21 | 0.7 | 41.7 | 0 | 0.0 | 0.0 |
| 1991 | 126 | 4.1 | 249.9 | 160 | 5.3 | 317.4 | 153 | 4.9 | 303.5 | 101 | 3.3 | 200.3 | 0 | 0.0 | 0.0 |
| 1992 | 183 | 5.9 | 363.0 | 156 | 5.2 | 309.4 | 182 | 5.9 | 361.0 | 14 | 0.5 | 27.8 | 0 | 0.0 | 0.0 |
| 1993 | 345 | 11.1 | 684.3 | 160 | 5.3 | 317.4 | 190 | 6.1 | 376.9 | 214 | 6.9 | 424.5 | 247 | 8.2 | 489.9 |
| 1994 | 204 | 6.6 | 404.6 | 127 | 4.2 | 251.9 | 128 | 4.1 | 253.9 | 116 | 3.7 | 230.1 | 111 | 3.7 | 220.2 |
| 1995 | 323 | 10.4 | 640.7 | 266 | 8.9 | 527.6 | 222 | 7.2 | 440.3 | 256 | 8.3 | 507.8 | 236 | 7.9 | 468.1 |
| 1996 | 345 | 11.1 | 684.3 | 365 | 12.2 | 724.0 | 240 | 7.7 | 476.0 | 196 | 6.3 | 388.8 | 240 | 8.0 | 476.0 |
| 1997 | 496.1 | 16.0 | 984.0 | 361.3 | 12.0 | 716.6 | 322.4 | 10.4 | 639.5 | 247 | 8.0 | 489.9 | 384.3 | 12.8 | 762.2 |
| 1998 | 400.3 | 12.9 | 794.0 | 363.2 | 12.1 | 720.4 | 316.1 | 10.2 | 627.0 | 286.7 | 9.2 | 568.7 | 283.2 | 9.4 | 561.7 |
| AVERAGES | 10.2 | 625.2 | 10.5 | 623.7 | 9.0 | 555.7 | 8.9 | 549.9 | 6.5 | 385.4 | |||||
Monthly Diversion Records
Covey Canal at Head (on Smith's Fork)
| YEAR | MAY | JUNE | JULY | AUGUST | SEPTEMBER | ||||||||||
|---|---|---|---|---|---|---|---|---|---|---|---|---|---|---|---|
| Total of Daily Ave for Month | Average CFS |
Monthly Total Ac-Ft |
Total of Daily Ave for Month | Average CFS |
Monthly Total Ac-Ft |
Total of Daily Ave for Month | Average CFS |
Monthly Total Ac-Ft |
Total of Daily Ave for Month | Average CFS |
Monthly Total Ac-Ft |
Total of Daily Ave for Month | Average CFS |
Monthly Total Ac-Ft | |
| 1970 | 1226 | 39.5 | 2431.7 | 2843 | 94.8 | 5639.0 | 2723 | 87.8 | 5401.0 | 1664 | 53.7 | 3300.5 | 0 | 0.0 | 0.0 |
| 1971 | 1025 | 33.1 | 2033.1 | 3586 | 119.5 | 7112.7 | 2874 | 92.7 | 5700.5 | 2128 | 68.6 | 4220.8 | 75 | 2.5 | 148.8 |
| 1972 | 1205 | 38.9 | 2390.1 | 3917 | 130.6 | 7769.3 | 3296 | 106.3 | 6537.5 | 2240 | 72.3 | 4443.0 | 48 | 1.6 | 95.2 |
| 1973 | 710 | 22.9 | 1408.3 | 3751 | 125.0 | 7440.0 | 2606 | 84.1 | 5168.9 | 1835 | 59.2 | 3639.7 | 457 | 15.2 | 906.4 |
| 1974 | 1016 | 32.8 | 2015.2 | 3026 | 100.9 | 6002.0 | 2415 | 77.9 | 4790.1 | 1796 | 57.9 | 3562.3 | 595 | 19.8 | 1180.2 |
| 1975 | 981 | 31.6 | 1945.8 | 2766 | 92.2 | 5486.3 | 2785 | 89.8 | 5524.0 | 1270 | 41.0 | 2519.0 | 124 | 4.1 | 246.0 |
| 1976 | 916 | 29.5 | 1816.9 | 2933 | 97.8 | 5817.5 | 3060 | 98.7 | 6069.4 | 1789 | 57.7 | 3548.4 | 30 | 1.0 | 59.5 |
| 1977 | 146 | 4.7 | 289.6 | 136 | 4.5 | 269.8 | 0 | 0.0 | 0.0 | 0 | 0.0 | 0.0 | 170 | 5.7 | 337.2 |
| 1978 | 849 | 27.4 | 1684.0 | 2186 | 72.9 | 4335.9 | 2412 | 77.8 | 4784.1 | 1332 | 43.0 | 2642.0 | 220 | 7.3 | 436.4 |
| 1979 | 722 | 23.3 | 1432.1 | 2492 | 83.1 | 4942.8 | 1752 | 56.5 | 3475.0 | 911 | 29.4 | 1806.9 | 382 | 12.7 | 757.7 |
| 1980 | 78 | 2.5 | 154.7 | 1913 | 63.8 | 3794.4 | 2849 | 91.9 | 5650.9 | 703 | 22.7 | 1394.4 | 30 | 1.0 | 59.5 |
| 1981 | 1252 | 40.4 | 2483.3 | 1414 | 47.1 | 2804.6 | 1500 | 48.4 | 2975.2 | 828 | 26.7 | 1642.3 | 258 | 8.6 | 511.7 |
| 1982 | 388 | 12.5 | 769.6 | 2189 | 73.0 | 4341.8 | 1701 | 54.9 | 3373.9 | 1257 | 40.5 | 2493.2 | 237 | 7.9 | 470.1 |
| 1983 | 42 | 1.4 | 83.3 | 1515 | 50.5 | 3005.0 | 1439 | 46.4 | 2854.2 | 798 | 25.7 | 1582.8 | 30 | 1.0 | 59.5 |
| 1984 | 135 | 4.4 | 267.8 | 1499 | 50.0 | 2973.2 | 1526 | 49.2 | 3026.8 | 1287 | 41.5 | 2552.7 | 301 | 10.0 | 597.0 |
| 1985 | 743 | 24.0 | 1473.7 | 2364 | 78.8 | 4688.9 | 1874 | 60.5 | 3717.0 | 885 | 28.5 | 1755.4 | 360 | 12.0 | 714.0 |
| 1986 | 351 | 11.3 | 696.2 | 1970 | 65.7 | 3907.4 | 1052 | 33.9 | 2086.6 | 1189 | 38.4 | 2358.3 | 64 | 2.1 | 126.9 |
| 1987 | 0 | 0.0 | 0.0 | 1591 | 53.0 | 3155.7 | 1676 | 54.1 | 3324.3 | 617 | 19.9 | 1223.8 | 208 | 6.9 | 412.6 |
| 1988 | 1953 | 63.0 | 3873.7 | 1980 | 66.0 | 3927.3 | 1327 | 42.8 | 2632.1 | 471 | 15.2 | 934.2 | 150 | 5.0 | 297.5 |
| 1989 | 1773 | 57.2 | 3516.7 | 2176 | 72.5 | 4316.0 | 1413 | 45.6 | 2802.6 | 1171 | 37.8 | 2322.6 | 400 | 13.3 | 793.4 |
| 1990 | 1904 | 61.4 | 3776.5 | 1747 | 58.2 | 3465.1 | 920 | 29.7 | 1824.8 | 229 | 7.4 | 454.2 | 0 | 0.0 | 0.0 |
| 1991 | 2154 | 69.5 | 4272.4 | 2701 | 90.0 | 5357.4 | 2002 | 64.6 | 3970.9 | 1190 | 38.4 | 2360.3 | 270 | 9.0 | 535.5 |
| 1992 | 611 | 19.7 | 1211.9 | 1374 | 45.8 | 2725.3 | 665 | 21.5 | 1319.0 | 62 | 2.0 | 123.0 | 0 | 0.0 | 0.0 |
| 1993 | 615 | 19.8 | 1219.8 | 2944 | 98.1 | 5839.3 | 1745 | 56.3 | 3461.2 | 795 | 25.6 | 1576.9 | 467 | 15.6 | 926.3 |
| 1994 | 986 | 31.8 | 1955.7 | 1726 | 57.5 | 3423.5 | 772 | 24.9 | 1531.2 | 89 | 2.9 | 176.5 | 8 | 0.3 | 15.9 |
| 1995 | 1541 | 49.7 | 3056.5 | 1929 | 64.3 | 3826.1 | 1606 | 51.8 | 3185.5 | 1135 | 36.6 | 2251.2 | 1145 | 38.2 | 2271.1 |
| 1996 | 401 | 12.9 | 795.4 | 2539 | 84.6 | 5036.0 | 2166 | 69.9 | 4296.2 | 818 | 26.4 | 1622.5 | 488 | 16.3 | 967.9 |
| 1997 | 470.6 | 15.2 | 933.4 | 3547.7 | 118.3 | 7036.8 | 1959.2 | 63.2 | 3886.0 | 343.3 | 11.1 | 680.9 | 74.9 | 2.5 | 148.6 |
| 1998 | 384 | 12.4 | 761.7 | 62.1 | 2.1 | 123.2 | 2857.6 | 92.2 | 5668.0 | 549.7 | 17.7 | 1090.3 | 204.6 | 6.8 | 405.8 |
| AVERAGES | 27.3 | 1681.0 | 74.5 | 4433.2 | 61.1 | 3759.9 | 32.7 | 2009.6 | 7.8 | 464.9 | |||||
Monthly Diversion Records
Covey Canal at Spring Creek
| YEAR | MAY | JUNE | JULY | AUGUST | SEPTEMBER | ||||||||||
|---|---|---|---|---|---|---|---|---|---|---|---|---|---|---|---|
| Total of Daily Ave for Month | Average CFS |
Monthly Total Ac-Ft |
Total of Daily Ave for Month | Average CFS |
Monthly Total Ac-Ft |
Total of Daily Ave for Month | Average CFS |
Monthly Total Ac-Ft |
Total of Daily Ave for Month | Average CFS |
Monthly Total Ac-Ft |
Total of Daily Ave for Month | Average CFS |
Monthly Total Ac-Ft | |
| 1970 | 187 | 6.0 | 370.9 | 142 | 4.7 | 281.7 | 107 | 3.5 | 212.2 | 124 | 4.0 | 246.0 | 26 | 0.9 | 51.6 |
| 1971 | 0 | 0.0 | 0.0 | 0 | 0.0 | 0.0 | 154 | 5.0 | 305.5 | 125 | 4.0 | 247.9 | 60 | 2.0 | 119.0 |
| 1972 | 0 | 0.0 | 0.0 | 124 | 4.1 | 246.0 | 155 | 5.0 | 307.4 | 140 | 4.5 | 277.7 | 0 | 0.0 | 0.0 |
| 1973 | 0 | 0.0 | 0.0 | 74 | 2.5 | 146.8 | 93 | 3.0 | 184.5 | 93 | 3.0 | 184.5 | 0 | 0.0 | 0.0 |
| 1974 | 124 | 4.0 | 246.0 | 123 | 4.1 | 244.0 | 140 | 4.5 | 277.7 | 146 | 4.7 | 289.6 | 221 | 7.4 | 438.3 |
| 1975 | 0 | 0.0 | 0.0 | 177 | 5.9 | 351.1 | 187 | 6.0 | 370.9 | 189 | 6.1 | 374.9 | 93 | 3.1 | 184.5 |
| 1976 | 112 | 3.6 | 222.1 | 150 | 5.0 | 297.5 | 180 | 5.8 | 357.0 | 177 | 5.7 | 351.1 | 150 | 5.0 | 297.5 |
| 1977 | 177 | 5.7 | 351.1 | 160 | 5.3 | 317.4 | 141 | 4.5 | 279.7 | 155 | 5.0 | 307.4 | 105 | 3.5 | 208.3 |
| 1978 | 129 | 4.2 | 255.9 | 135 | 4.5 | 267.8 | 100 | 3.2 | 198.3 | 155 | 5.0 | 307.4 | 150 | 5.0 | 297.5 |
| 1979 | 141 | 4.5 | 279.7 | 149 | 5.0 | 295.5 | 90 | 2.9 | 178.5 | 76 | 2.5 | 150.7 | 0 | 0.0 | 0.0 |
| 1980 | 200 | 6.5 | 396.7 | 166 | 5.5 | 329.3 | 161 | 5.2 | 319.3 | 170 | 5.5 | 337.2 | 154 | 5.1 | 305.5 |
| 1981 | 186 | 6.0 | 368.9 | 132 | 4.4 | 261.8 | 131 | 4.2 | 259.8 | 148 | 4.8 | 293.6 | 132 | 4.4 | 261.8 |
| 1982 | 174 | 5.6 | 345.1 | 165 | 5.5 | 327.3 | 153 | 4.9 | 303.5 | 143 | 4.6 | 283.6 | 169 | 5.6 | 335.2 |
| 1983 | 180 | 5.8 | 357.0 | 159 | 5.3 | 315.4 | 158 | 5.1 | 313.4 | 202 | 6.5 | 400.7 | 197 | 6.6 | 390.7 |
| 1984 | 178 | 5.7 | 353.1 | 172 | 5.7 | 341.2 | 162 | 5.2 | 321.3 | 170 | 5.5 | 337.2 | 171 | 5.7 | 339.2 |
| 1985 | 112 | 3.6 | 222.1 | 141 | 4.7 | 279.7 | 141 | 4.5 | 279.7 | 54 | 1.7 | 107.1 | 13 | 0.4 | 25.8 |
| 1986 | 108 | 3.5 | 214.2 | 173 | 5.8 | 343.1 | 164 | 5.3 | 325.3 | 157 | 5.1 | 311.4 | 149 | 5.0 | 295.5 |
| 1987 | 190 | 6.1 | 376.9 | 122 | 4.1 | 242.0 | 108 | 3.5 | 214.2 | 134 | 4.3 | 265.8 | 120 | 4.0 | 238.0 |
| 1988 | 127 | 4.1 | 251.9 | 135 | 4.5 | 267.8 | 121 | 3.9 | 240.0 | 93 | 3.0 | 184.5 | 90 | 3.0 | 178.5 |
| 1989 | 118 | 3.8 | 234.0 | 120 | 4.0 | 238.0 | 114 | 3.7 | 226.1 | 93 | 3.0 | 184.5 | 90 | 3.0 | 178.5 |
| 1990 | 181 | 5.8 | 359.0 | 161 | 5.4 | 319.3 | 143 | 4.6 | 283.6 | 84 | 2.7 | 166.6 | 0 | 0.0 | 0.0 |
| 1991 | 145 | 4.7 | 287.6 | 167 | 5.6 | 331.2 | 173 | 5.6 | 343.1 | 128 | 4.1 | 253.9 | 0 | 0.0 | 0.0 |
| 1992 | 193 | 6.2 | 382.8 | 166 | 5.5 | 329.3 | 153 | 4.9 | 303.5 | 19 | 0.6 | 37.7 | 0 | 0.0 | 0.0 |
| 1993 | 258 | 8.3 | 511.7 | 137 | 4.6 | 271.7 | 110 | 3.5 | 218.2 | 158 | 5.1 | 313.4 | 197 | 6.6 | 390.7 |
| 1994 | 157 | 5.1 | 311.4 | 125 | 4.2 | 247.9 | 111 | 3.6 | 220.2 | 82 | 2.6 | 162.6 | 111 | 3.7 | 220.2 |
| 1995 | 240 | 7.7 | 476.0 | 125 | 4.2 | 247.9 | 119 | 3.8 | 236.0 | 124 | 4.0 | 246.0 | 111 | 3.7 | 220.2 |
| 1996 | 239 | 7.7 | 474.0 | 139 | 4.6 | 275.7 | 113 | 3.6 | 224.1 | 97 | 3.1 | 192.4 | 112 | 3.7 | 222.1 |
| 1997 | 173.5 | 5.6 | 344.1 | 158.7 | 5.3 | 314.8 | 143.5 | 4.6 | 284.6 | 154 | 5.0 | 305.5 | 153.5 | 5.1 | 304.5 |
| 1998 | 215.9 | 7.0 | 428.2 | 175.8 | 5.9 | 348.7 | 140.5 | 4.5 | 278.7 | 112.9 | 3.6 | 223.9 | 125.4 | 4.2 | 248.7 |
| AVERAGES | 4.7 | 290.4 | 4.7 | 278.6 | 4.4 | 271.3 | 4.1 | 253.3 | 3.3 | 198.3 | |||||