Wyoming State Water Plan
Wyoming State Water Plan
Wyoming Water Development Office
6920 Yellowtail Rd
Cheyenne, WY 82002
Phone: 307-777-7626

Wyoming Water Development Office
6920 Yellowtail Rd
Cheyenne, WY 82002
Phone: 307-777-7626


| SUBJECT: |
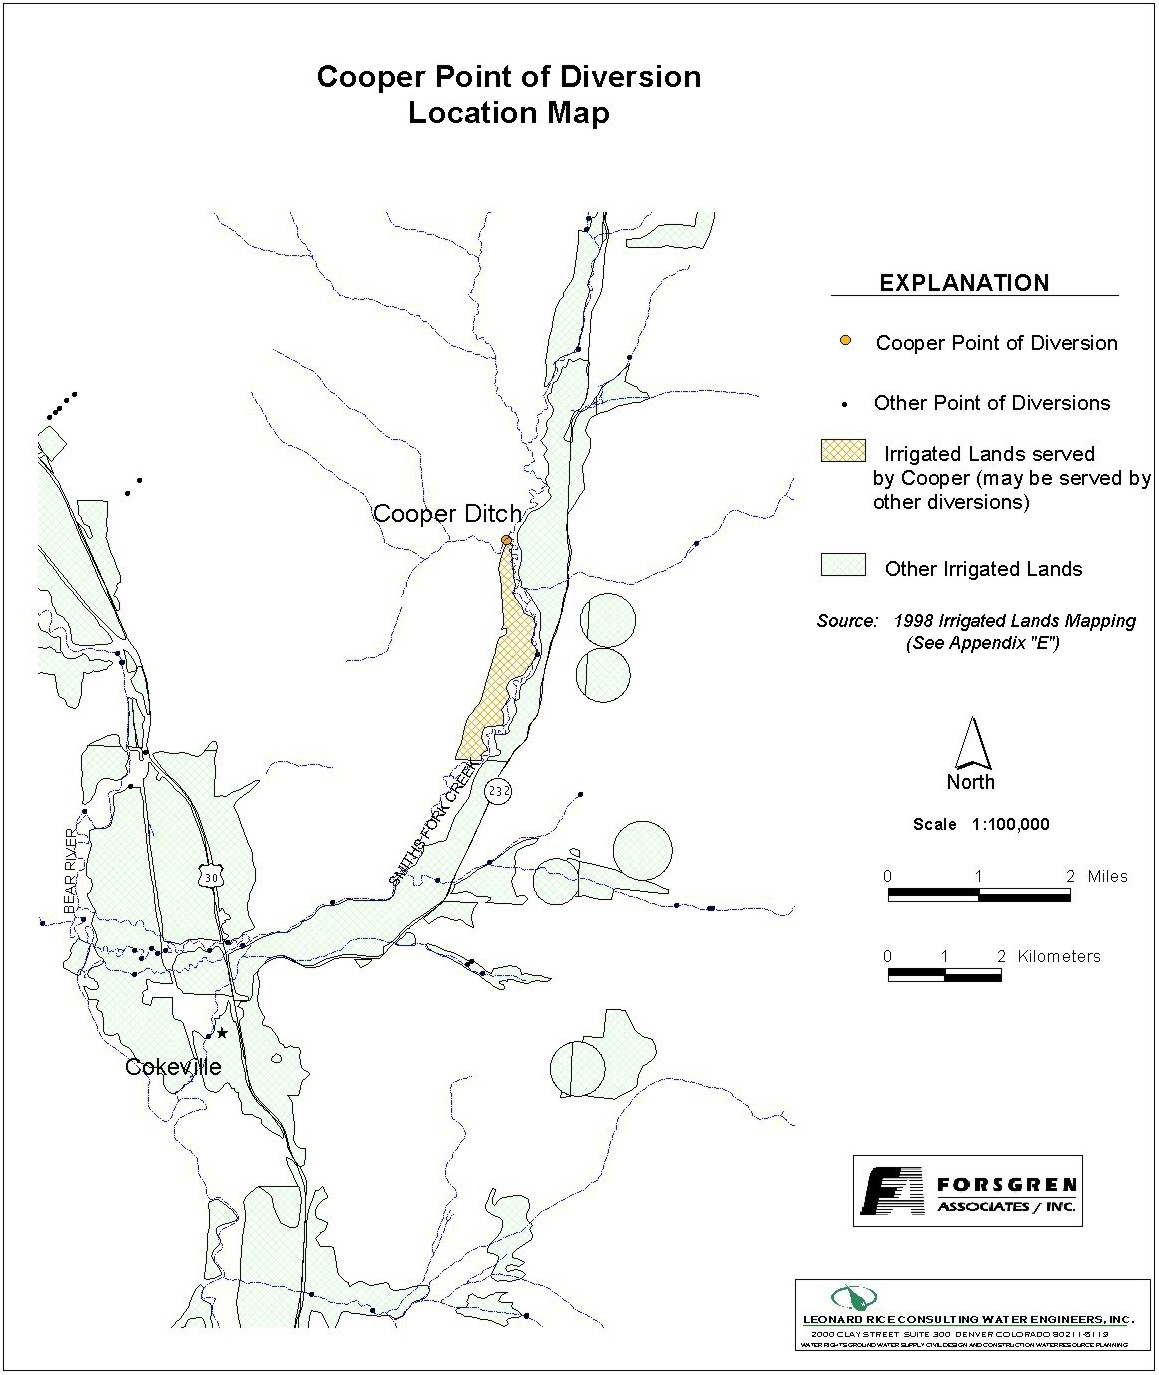
Appendix D Key Structures and Diversions COOPER DITCH DIVERSION |
| PREPARED BY: | Bear River Basin Planning Team |
| DATE: | August 7, 2000 |
| Diversion Description: The Cooper Ditch headgate consists of a 44-inch rectangular slide gate set in a concrete headwall. The river is diverted using wood planks supported on vertical steel pipe piling driven into the river. | 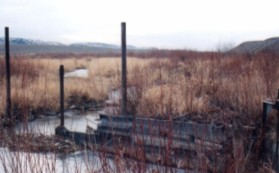 Cooper Ditch headgate structure |
|
Conveyance Description: Open channel canal, approximately 15,840 feet in length.1
Direct Flow Water Rights:2
| Priority Date | Permit Number |
Permitted Use | Permitted Acres |
Flow (CFS) |
Cumulative (CFS) |
Comments |
|---|---|---|---|---|---|---|
| 08-27-1892 | 330 | Irrigation, Storage | 206 | 2.94 | 2.94 | |
| 01-31-1900 | 578E | Irrigation | 135 | 1.92 | 4.86 | |
| 09-23-1907 | 1844E | Irrigation | 25 | 0.35 | 5.21 | |
| 09-05-1911 | 2556E | Irrigation, Domestic, Storage | 60 | 0.86 | 6.07 |
Associated Storage Rights: None
Irrigation Practices: Land is flood irrigated.3
Estimated Diversion Efficiency:
Calculated Diversion Efficiency = Conveyance Efficiency X Application Efficiency:
Conveyance Efficiency: 65% Application Efficiency: 55% Overall Diversion Efficiency: 36% Conveyance efficiency is estimated by total length of main canal. Application efficiency for flood irrigation and sprinkler irrigation is estimated at 55% and 85% respectively.
Crop Types / Consumptive Use: Water is used entirely to irrigate meadow grasses, primarily Timothy, Meadow Foxtail, etc.3
Return Flows: Return flow is primarily captured by the Covey Canal.
The following return flow pattern was adopted for modeling in this study are as follows:
		Month
      (after initial Diversion)	 Percent of Return
		0			70%
		1			20%
		2			10%
                3                        0%
                                       100%
References:
Monthly Diversion Records
Cooper (on Smith's Fork)
| YEAR | MAY | JUNE | JULY | AUGUST | SEPTEMBER | ||||||||||
|---|---|---|---|---|---|---|---|---|---|---|---|---|---|---|---|
| Total of Daily Ave for Month | Average CFS |
Monthly Total Ac-Ft |
Total of Daily Ave for Month | Average CFS |
Monthly Total Ac-Ft |
Total of Daily Ave for Month | Average CFS |
Monthly Total Ac-Ft |
Total of Daily Ave for Month | Average CFS |
Monthly Total Ac-Ft |
Total of Daily Ave for Month | Average CFS |
Monthly Total Ac-Ft | |
| 1970 | 0 | 0.0 | 0.0 | 328 | 10.9 | 650.6 | 74 | 2.4 | 146.8 | 20 | 0.6 | 39.7 | 0 | 0.0 | 0.0 |
| 1971 | 0 | 0.0 | 0.0 | 0 | 0.0 | 0.0 | 0 | 0.0 | 0.0 | 0 | 0.0 | 0.0 | 0 | 0.0 | 0.0 |
| 1972 | 0 | 0.0 | 0.0 | 0 | 0.0 | 0.0 | 353 | 11.4 | 700.2 | 93 | 3.0 | 184.5 | 13 | 0.4 | 25.8 |
| 1973 | 0 | 0.0 | 0.0 | 47 | 1.6 | 93.2 | 1 | 0.0 | 2.0 | 0 | 0.0 | 0.0 | 0 | 0.0 | 0.0 |
| 1974 | 0 | 0.0 | 0.0 | 195 | 6.5 | 386.8 | 539 | 17.4 | 1069.1 | 21 | 0.7 | 41.7 | 12 | 0.4 | 23.8 |
| 1975 | 0 | 0.0 | 0.0 | 282 | 9.4 | 559.3 | 567 | 18.3 | 1124.6 | 52 | 1.7 | 103.1 | 0 | 0.0 | 0.0 |
| 1976 | 0 | 0.0 | 0.0 | 256 | 8.5 | 507.8 | 181 | 5.8 | 359.0 | 103 | 3.3 | 204.3 | 95 | 3.2 | 188.4 |
| 1977 | 105 | 3.4 | 208.3 | 22 | 0.7 | 43.6 | 0 | 0.0 | 0.0 | 0 | 0.0 | 0.0 | 0 | 0.0 | 0.0 |
| 1978 | 124 | 4.0 | 246.0 | 93 | 3.1 | 184.5 | 0 | 0.0 | 0.0 | 0 | 0.0 | 0.0 | 0 | 0.0 | 0.0 |
| 1979 | 158 | 5.1 | 313.4 | 112 | 3.7 | 222.1 | 104 | 3.4 | 206.3 | 32 | 1.0 | 63.5 | 0 | 0.0 | 0.0 |
| 1980 | 170 | 5.5 | 337.2 | 159 | 5.3 | 315.4 | 56 | 1.8 | 111.1 | 0 | 0.0 | 0.0 | 0 | 0.0 | 0.0 |
| 1981 | 190 | 6.1 | 376.9 | 249 | 8.3 | 493.9 | 81 | 2.6 | 160.7 | 4 | 0.1 | 7.9 | 0 | 0.0 | 0.0 |
| 1982 | 15 | 0.5 | 29.8 | 52 | 1.7 | 103.1 | 182 | 5.9 | 361.0 | 16 | 0.5 | 31.7 | 71 | 2.4 | 140.8 |
| 1983 | 42 | 1.4 | 83.3 | 0 | 0.0 | 0.0 | 44 | 1.4 | 87.3 | 7 | 0.2 | 13.9 | 0 | 0.0 | 0.0 |
| 1984 | 555 | 17.9 | 1100.8 | 345 | 11.5 | 684.3 | 0 | 0.0 | 0.0 | 0 | 0.0 | 0.0 | 0 | 0.0 | 0.0 |
| 1985 | 0 | 0.0 | 0.0 | 56 | 1.9 | 111.1 | 0 | 0.0 | 0.0 | 7 | 0.2 | 13.9 | 0 | 0.0 | 0.0 |
| 1986 | 205 | 6.6 | 406.6 | 1225 | 40.8 | 2429.8 | 0 | 0.0 | 0.0 | 0 | 0.0 | 0.0 | 0 | 0.0 | 0.0 |
| 1987 | 304 | 9.8 | 603.0 | 93 | 3.1 | 184.5 | 94 | 3.0 | 186.4 | 93 | 3.0 | 184.5 | 0 | 0.0 | 0.0 |
| 1988 | 233 | 7.5 | 462.1 | 662 | 22.1 | 1313.1 | 527 | 17.0 | 1045.3 | 180 | 5.8 | 357.0 | 0 | 0.0 | 0.0 |
| 1989 | 196 | 6.3 | 388.8 | 102 | 3.4 | 202.3 | 37 | 1.2 | 73.4 | 0 | 0.0 | 0.0 | 0 | 0.0 | 0.0 |
| 1990 | 162 | 5.2 | 321.3 | 156 | 5.2 | 309.4 | 106 | 3.4 | 210.2 | 106 | 3.4 | 210.2 | 0 | 0.0 | 0.0 |
| 1991 | 263 | 8.5 | 521.7 | 270 | 9.0 | 535.5 | 286 | 9.2 | 567.3 | 191 | 6.2 | 378.8 | 0 | 0.0 | 0.0 |
| 1992 | 93 | 3.0 | 184.5 | 120 | 4.0 | 238.0 | 96 | 3.1 | 190.4 | 27 | 0.9 | 53.6 | 0 | 0.0 | 0.0 |
| 1993 | 196 | 6.3 | 388.8 | 618 | 20.6 | 1225.8 | 112 | 3.6 | 222.1 | 17 | 0.5 | 33.7 | 9 | 0.3 | 17.9 |
| 1994 | 263 | 8.5 | 521.7 | 326 | 10.9 | 646.6 | 26 | 0.8 | 51.6 | 0 | 0.0 | 0.0 | 0 | 0.0 | 0.0 |
| 1995 | 276 | 8.9 | 547.4 | 629 | 21.0 | 1247.6 | 122 | 3.9 | 242.0 | 32 | 1.0 | 63.5 | 0 | 0.0 | 0.0 |
| 1996 | 146 | 4.7 | 289.6 | 536 | 17.9 | 1063.1 | 171 | 5.5 | 339.2 | 58 | 1.9 | 115.0 | 45 | 1.5 | 89.3 |
| 1997 | 209.9 | 6.8 | 416.3 | 391.5 | 13.1 | 776.5 | 30.1 | 1.0 | 59.7 | 10.3 | 0.3 | 20.4 | 7.3 | 0.2 | 14.5 |
| 1998 | 561.5 | 18.1 | 1113.7 | 494 | 16.5 | 979.8 | 9.6 | 0.3 | 19.0 | 0 | 0.0 | 0.0 | 0 | 0.0 | 0.0 |
| AVERAGES | 5.0 | 305.6 | 9.0 | 534.8 | 4.2 | 259.8 | 1.2 | 73.1 | 0.3 | 17.3 | |||||