Wyoming State Water Plan
Wyoming State Water Plan
Wyoming Water Development Office
6920 Yellowtail Rd
Cheyenne, WY 82002
Phone: 307-777-7626

Wyoming Water Development Office
6920 Yellowtail Rd
Cheyenne, WY 82002
Phone: 307-777-7626


| SUBJECT: |
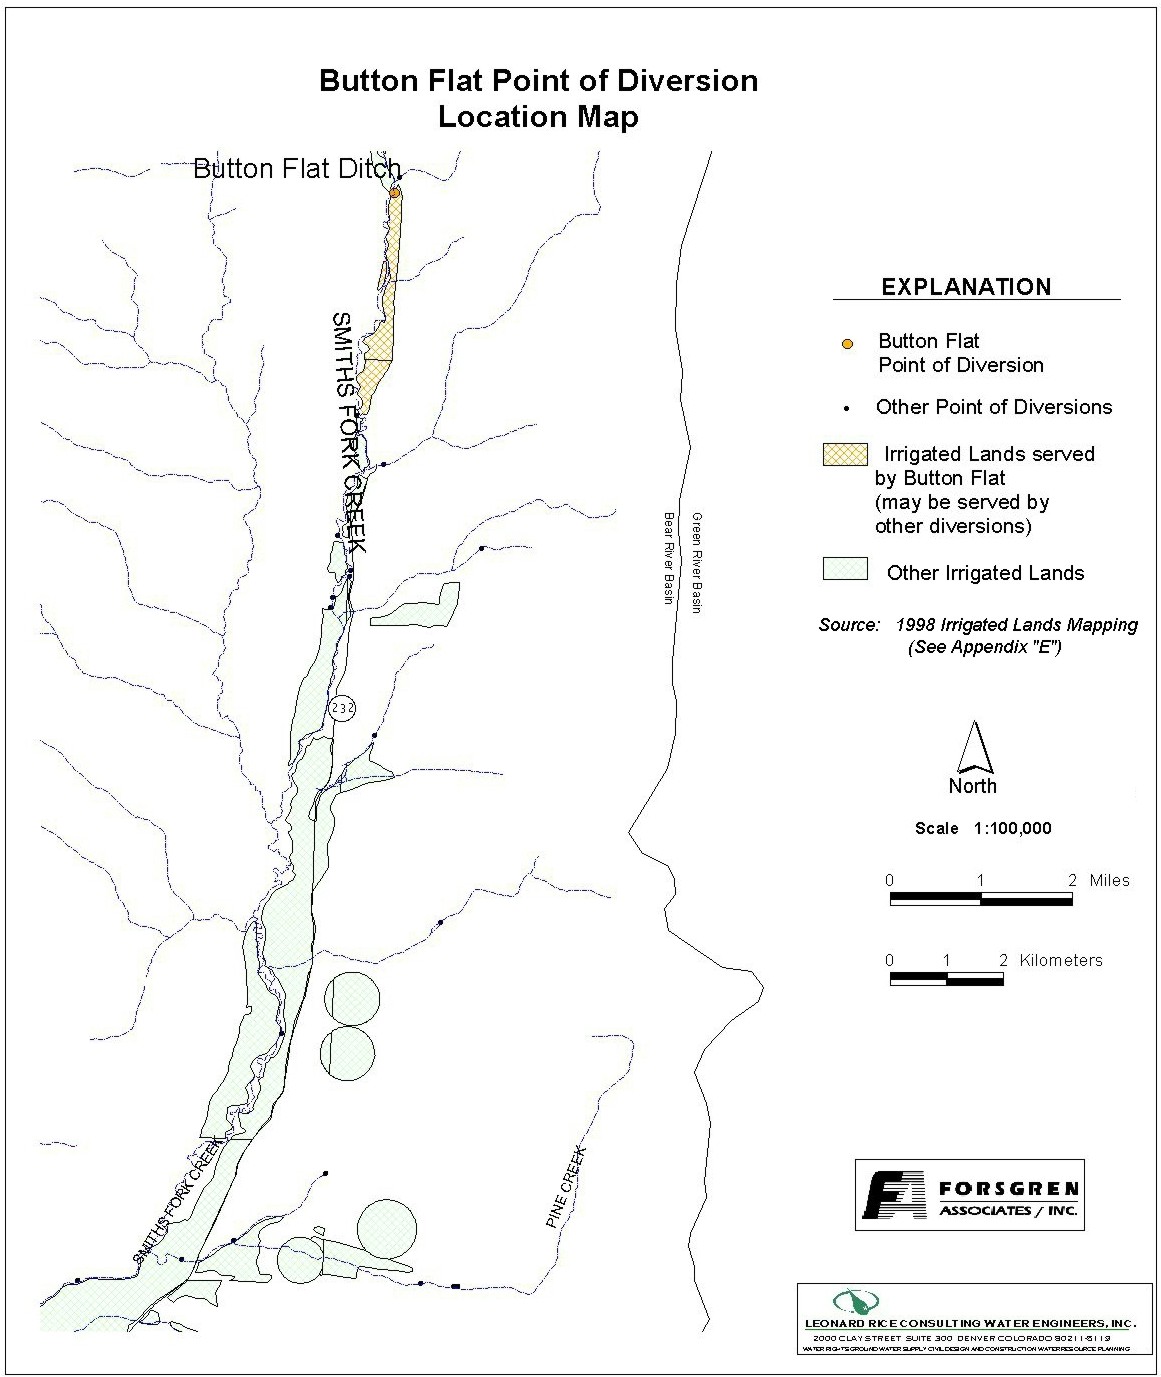
Appendix D Key Structures and Diversions BUTTON FLAT DIVERSION |
| PREPARED BY: | Bear River Basin Planning Team |
| DATE: | August 7, 2000 |
| Diversion Description:The Button Flat diversion structure consists of a 30-inch CMP with a canal gate. The river is diverted using wood boards. | 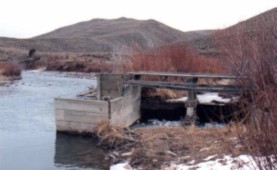 Button Flat headgate structure |
|
Conveyance Description: Open channel canal, approximately 10,560 feet in length.1
Direct Flow Water Rights:2
| Priority Date | Permit Number |
Permitted Use | Permitted Acres |
Flow (CFS) |
Cumulative (CFS) |
Comments |
|---|---|---|---|---|---|---|
| 03-13-1906 | 7164 | Irrigation, Domestic, Storage | 160 | 2.28 | 2.28 | |
| 03-13-1906 | 7164 | Irrigation, Domestic, Storage | 185 | 2.64 | 4.92 | |
| 02-04-1910 | 2175E | Irrigation, Domestic, Storage | 77 | 1.10 | 6.02 | |
| 05-19-1950 | 5506E | Irrigation, Storage | 56 | 0.80 | 6.82 |
Associated Storage Rights: None
Irrigation Practices: Land is flood irrigated.3
Estimated Diversion Efficiency:
Calculated Diversion Efficiency = Conveyance Efficiency X Application Efficiency:
Conveyance Efficiency: 65% Application Efficiency: 55% Overall Diversion Efficiency: 36% Conveyance efficiency is estimated by total length of main canal. Application efficiency for flood irrigation and sprinkler irrigation is estimated at 55% and 85% respectively.
Crop Types / Consumptive Use: Water is used to irrigate meadow grasses (approx. 20%) and alfalfa & grains (approx. 80% rotated).3
Return Flows: Return flow is primarily captured by Progress Canal and/or other downstream ditches
The following return flow pattern was adopted for modeling in this study are as follows:
		Month
      (after initial Diversion)	 Percent of Return
		0			70%
		1			20%
		2			10%
                3                        0%
                                       100%
References:
Monthly Diversion Records
Button Flat (on Smith's Fork)
| YEAR | MAY | JUNE | JULY | AUGUST | SEPTEMBER | ||||||||||
|---|---|---|---|---|---|---|---|---|---|---|---|---|---|---|---|
| Total of Daily Ave for Month | Average CFS |
Monthly Total Ac-Ft |
Total of Daily Ave for Month | Average CFS |
Monthly Total Ac-Ft |
Total of Daily Ave for Month | Average CFS |
Monthly Total Ac-Ft |
Total of Daily Ave for Month | Average CFS |
Monthly Total Ac-Ft |
Total of Daily Ave for Month | Average CFS |
Monthly Total Ac-Ft | |
| 1970 | 0 | 0.0 | 0.0 | 68 | 2.3 | 134.9 | 96 | 3.1 | 190.4 | 60 | 1.9 | 119.0 | 50 | 1.7 | 99.2 |
| 1971 | 0 | 0.0 | 0.0 | 56 | 1.9 | 111.1 | 127 | 4.1 | 251.9 | 152 | 4.9 | 301.5 | 83 | 2.8 | 164.6 |
| 1972 | 0 | 0.0 | 0.0 | 26 | 0.9 | 51.6 | 179 | 5.8 | 355.0 | 121 | 3.9 | 240.0 | 60 | 2.0 | 119.0 |
| 1973 | 132 | 4.3 | 261.8 | 155 | 5.2 | 307.4 | 155 | 5.0 | 307.4 | 200 | 6.5 | 396.7 | 30 | 1.0 | 59.5 |
| 1974 | 124 | 4.0 | 246.0 | 180 | 6.0 | 357.0 | 194 | 6.3 | 384.8 | 128 | 4.1 | 253.9 | 66 | 2.2 | 130.9 |
| 1975 | 17 | 0.5 | 33.7 | 105 | 3.5 | 208.3 | 156 | 5.0 | 309.4 | 86 | 2.8 | 170.6 | 19 | 0.6 | 37.7 |
| 1976 | 124 | 4.0 | 246.0 | 151 | 5.0 | 299.5 | 150 | 4.8 | 297.5 | 159 | 5.1 | 315.4 | 116 | 3.9 | 230.1 |
| 1977 | 0 | 0.0 | 0.0 | 0 | 0.0 | 0.0 | 0 | 0.0 | 0.0 | 0 | 0.0 | 0.0 | 0 | 0.0 | 0.0 |
| 1978 | 19 | 0.6 | 37.7 | 153 | 5.1 | 303.5 | 134 | 4.3 | 265.8 | 209 | 6.7 | 414.5 | 148 | 4.9 | 293.6 |
| 1979 | 0 | 0.0 | 0.0 | 98 | 3.3 | 194.4 | 171 | 5.5 | 339.2 | 137 | 4.4 | 271.7 | 0 | 0.0 | 0.0 |
| 1980 | 0 | 0.0 | 0.0 | 68 | 2.3 | 134.9 | 131 | 4.2 | 259.8 | 97 | 3.1 | 192.4 | 62 | 2.1 | 123.0 |
| 1981 | 135 | 4.4 | 267.8 | 160 | 5.3 | 317.4 | 118 | 3.8 | 234.0 | 72 | 2.3 | 142.8 | 5 | 0.2 | 9.9 |
| 1982 | 46 | 1.5 | 91.2 | 119 | 4.0 | 236.0 | 70 | 2.3 | 138.8 | 115 | 3.7 | 228.1 | 43 | 1.4 | 85.3 |
| 1983 | 0 | 0.0 | 0.0 | 65 | 2.2 | 128.9 | 48 | 1.5 | 95.2 | 29 | 0.9 | 57.5 | 13 | 0.4 | 25.8 |
| 1984 | 0 | 0.0 | 0.0 | 73 | 2.4 | 144.8 | 22 | 0.7 | 43.6 | 4 | 0.1 | 7.9 | 12 | 0.4 | 23.8 |
| 1985 | 67 | 2.2 | 132.9 | 80 | 2.7 | 158.7 | 141 | 4.5 | 279.7 | 63 | 2.0 | 125.0 | 18 | 0.6 | 35.7 |
| 1986 | 0 | 0.0 | 0.0 | 232 | 7.7 | 460.2 | 26 | 0.8 | 51.6 | 0 | 0.0 | 0.0 | 0 | 0.0 | 0.0 |
| 1987 | 33 | 1.1 | 65.5 | 42 | 1.4 | 83.3 | 18 | 0.6 | 35.7 | 2 | 0.1 | 4.0 | 0 | 0.0 | 0.0 |
| 1988 | 13 | 0.4 | 25.8 | 60 | 2.0 | 119.0 | 59 | 1.9 | 117.0 | 15 | 0.5 | 29.8 | 0 | 0.0 | 0.0 |
| 1989 | 0 | 0.0 | 0.0 | 58 | 1.9 | 115.0 | 49 | 1.6 | 97.2 | 27 | 0.9 | 53.6 | 0 | 0.0 | 0.0 |
| 1990 | 10 | 0.3 | 19.8 | 46 | 1.5 | 91.2 | 0 | 0.0 | 0.0 | 0 | 0.0 | 0.0 | 0 | 0.0 | 0.0 |
| 1991 | 33 | 1.1 | 65.5 | 139 | 4.6 | 275.7 | 65 | 2.1 | 128.9 | 5 | 0.2 | 9.9 | 0 | 0.0 | 0.0 |
| 1992 | 108 | 3.5 | 214.2 | 150 | 5.0 | 297.5 | 155 | 5.0 | 307.4 | 0 | 0.0 | 0.0 | 0 | 0.0 | 0.0 |
| 1993 | 30 | 1.0 | 59.5 | 12 | 0.4 | 23.8 | 149 | 4.8 | 295.5 | 72 | 2.3 | 142.8 | 7 | 0.2 | 13.9 |
| 1994 | 2 | 0.1 | 4.0 | 130 | 4.3 | 257.9 | 106 | 3.4 | 210.2 | 0 | 0.0 | 0.0 | 0 | 0.0 | 0.0 |
| 1995 | 35 | 1.1 | 69.4 | 22 | 0.7 | 43.6 | 151 | 4.9 | 299.5 | 21 | 0.7 | 41.7 | 0 | 0.0 | 0.0 |
| 1996 | 34 | 1.1 | 67.4 | 220 | 7.3 | 436.4 | 134 | 4.3 | 265.8 | 79 | 2.5 | 156.7 | 16 | 0.5 | 31.7 |
| 1997 | 0 | 0.0 | 0.0 | 0 | 0.0 | 0.0 | 71.8 | 2.3 | 142.4 | 32.4 | 1.0 | 64.3 | 8 | 0.3 | 15.9 |
| 1998 | 21.6 | 0.7 | 42.8 | 40.3 | 1.3 | 79.9 | 68.3 | 2.2 | 135.5 | 10.4 | 0.3 | 20.6 | 0 | 0.0 | 0.0 |
| AVERAGES | 1.1 | 67.3 | 3.1 | 185.2 | 3.3 | 201.4 | 2.1 | 129.7 | 0.9 | 51.7 | |||||