Wyoming State Water Plan
Wyoming State Water Plan
Wyoming Water Development Office
6920 Yellowtail Rd
Cheyenne, WY 82002
Phone: 307-777-7626

Wyoming Water Development Office
6920 Yellowtail Rd
Cheyenne, WY 82002
Phone: 307-777-7626


| SUBJECT: |
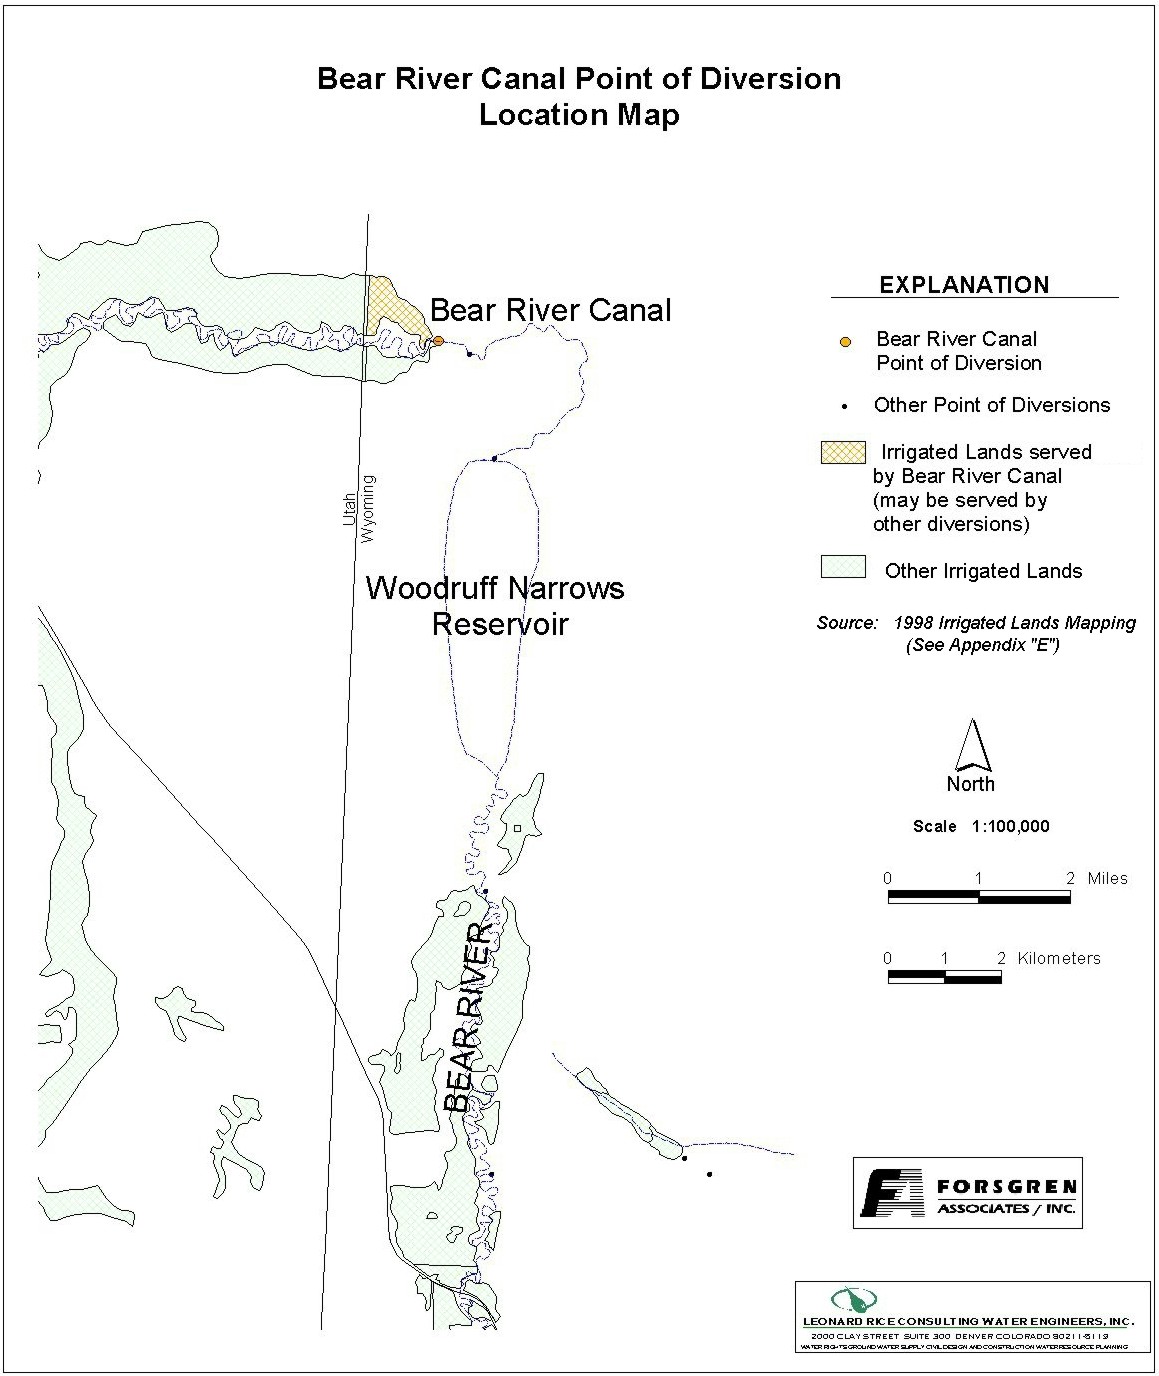
Appendix D Key Structures and Diversions BEAR RIVER CANAL (Below Woodruff Narrows) |
| PREPARED BY: | Bear River Basin Planning Team |
| DATE: | August 7, 2000 |
| Diversion Description: The headgate structure consists of a concrete headwall with two 4-foot steel slide gates. | 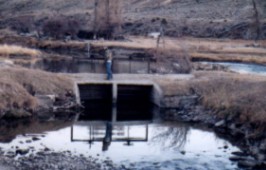 Bear River Canal headgate |
|
Conveyance Description: Open channel canal, approximately 26,400 feet in length.1
Direct Flow Water Rights:2
| Priority Date | Permit Number |
Permitted Use | Permitted Acres |
Flow (CFS) |
Cumulative (CFS) |
Comments |
|---|---|---|---|---|---|---|
| -1874 | Terr | Irrigation | 74 | 1.06 | 1.06 | Wyoming Lands |
| -1874 | Terr | Irrigation | 1535 | 21.92 | 22.98 | Utah Lands |
Irrigation Practices: Flood Irrigated.3
Estimated Diversion Efficiency: Most of the water is used in the top third of the canal. The largest losses tend to occur in the bottom two-thirds. The city of Evanston is planning on using this canal to irrigate their cemetery, and will likely clean and repair the canal in the near future.3
Calculated Diversion Efficiency = Conveyance Efficiency X Application Efficiency:
Conveyance Efficiency: 60% Application Efficiency: 55% Overall Diversion Efficiency: 33% Conveyance efficiency is estimated by total length of main canal. Application efficiency for flood irrigation and sprinkler irrigation is estimated at 55% and 85% respectively.
Crop Types / Consumptive Use: Water is used entirely to irrigate mixed meadow grasses, primarily Meadow Foxtail, etc.3
Return Flows: Return flow is intercepted in Utah.
The following return flow pattern was adopted for modeling in this study are as follows:
		Month
      (after initial Diversion)	 Percent of Return
		0			50%
		1			25%
		2			15%
		3		        10%
                                       100%
Other Operational Information: The Bear River Canal is regulated by the Utah Commissioner as a matter of practicality. Most of the irrigated lands (over 95%) are located in Utah.3
References:
Monthly Diversion Records
Bear River Canal (Below Woodruff Narrows)
| YEAR | MAY | JUNE | JULY | AUGUST | SEPTEMBER | ||||||||||
|---|---|---|---|---|---|---|---|---|---|---|---|---|---|---|---|
| Total of Daily Ave for Month | Average CFS |
Monthly Total Ac-Ft |
Total of Daily Ave for Month | Average CFS |
Monthly Total Ac-Ft |
Total of Daily Ave for Month | Average CFS |
Monthly Total Ac-Ft |
Total of Daily Ave for Month | Average CFS |
Monthly Total Ac-Ft |
Total of Daily Ave for Month | Average CFS |
Monthly Total Ac-Ft | |
| *1970 | |||||||||||||||
| 1971 | 572 | 18.5 | 1134.5 | 3002 | 100.1 | 5954.4 | 933 | 30.1 | 1850.6 | 327 | 10.5 | 648.6 | 393 | 13.1 | 779.5 |
| 1972 | 879 | 28.4 | 1743.5 | 3076 | 102.5 | 6101.2 | 896 | 28.9 | 1777.2 | 236 | 7.6 | 468.1 | 122 | 4.1 | 242.0 |
| 1973 | 1084 | 35.0 | 2150.1 | 1707 | 56.9 | 3385.8 | 728 | 23.5 | 1444.0 | 74 | 2.4 | 146.8 | 120 | 4.0 | 238.0 |
| 1974 | 1179 | 38.0 | 2338.5 | 2615 | 87.2 | 5186.8 | 794 | 25.6 | 1574.9 | 84 | 2.7 | 166.6 | 367 | 12.2 | 727.9 |
| 1975 | 253 | 8.2 | 501.8 | 3147 | 104.9 | 6242.0 | 2305 | 74.4 | 4571.9 | 0 | 0.0 | 0.0 | 761 | 25.4 | 1509.4 |
| 1976 | 1330 | 42.9 | 2638.0 | 2527 | 84.2 | 5012.2 | 621 | 20.0 | 1231.7 | 95 | 3.1 | 188.4 | 388 | 12.9 | 769.6 |
| 1977 | 614 | 19.8 | 1217.9 | 938 | 31.3 | 1860.5 | 499 | 16.1 | 989.8 | 85 | 2.7 | 168.6 | 49 | 1.6 | 97.2 |
| 1978 | 1112 | 35.9 | 2205.6 | 2706 | 90.2 | 5367.3 | 1142 | 36.8 | 2265.1 | 37 | 1.2 | 73.4 | 207 | 6.9 | 410.6 |
| 1979 | 1483 | 47.8 | 2941.5 | 1712 | 57.1 | 3395.7 | 455 | 14.7 | 902.5 | 18 | 0.6 | 35.7 | 0 | 0.0 | 0.0 |
| 1980 | 665 | 21.5 | 1319.0 | 1072 | 35.7 | 2126.3 | 872 | 28.1 | 1729.6 | 92 | 3.0 | 182.5 | 177 | 5.9 | 351.1 |
| 1981 | 855 | 27.6 | 1695.9 | 2042 | 68.1 | 4050.2 | 863 | 27.8 | 1711.7 | 106 | 3.4 | 210.2 | 137 | 4.6 | 271.7 |
| 1982 | 1382 | 44.6 | 2741.2 | 2654 | 88.5 | 5264.1 | 1257 | 40.5 | 2493.2 | 34 | 1.1 | 67.4 | 0 | 0.0 | 0.0 |
| 1983 | 836 | 27.0 | 1658.2 | 2358 | 78.6 | 4677.0 | 1215 | 39.2 | 2409.9 | 273 | 8.8 | 541.5 | 19 | 0.6 | 37.7 |
| 1984 | 738 | 23.8 | 1463.8 | 1705 | 56.8 | 3381.8 | 564 | 18.2 | 1118.7 | 49 | 1.6 | 97.2 | 118 | 3.9 | 234.0 |
| 1985 | 1656 | 53.4 | 3284.6 | 2535 | 84.5 | 5028.1 | 885 | 28.5 | 1755.4 | 93 | 3.0 | 184.5 | 90 | 3.0 | 178.5 |
| 1986 | 1225 | 39.5 | 2429.8 | 1973 | 65.8 | 3913.4 | 947 | 30.5 | 1878.3 | 75 | 2.4 | 148.8 | 90 | 3.0 | 178.5 |
| 1987 | 2167 | 69.9 | 4298.2 | 2638 | 87.9 | 5232.4 | 548 | 17.7 | 1086.9 | 31 | 1.0 | 61.5 | 30 | 1.0 | 59.5 |
| 1988 | 2200 | 71.0 | 4363.6 | 1795 | 59.8 | 3560.3 | 200 | 6.5 | 396.7 | 90 | 2.9 | 178.5 | 90 | 3.0 | 178.5 |
| 1989 | 934 | 30.1 | 1852.6 | 2182 | 72.7 | 4327.9 | 868 | 28.0 | 1721.7 | 204 | 6.6 | 404.6 | 40 | 1.3 | 79.3 |
| 1990 | 526 | 17.0 | 1043.3 | 2222 | 74.1 | 4407.3 | 560 | 18.1 | 1110.7 | 108 | 3.5 | 214.2 | 165 | 5.5 | 327.3 |
| 1991 | 1046 | 33.7 | 2074.7 | 2892 | 96.4 | 5736.2 | 1014 | 32.7 | 2011.2 | 104 | 3.4 | 206.3 | 173 | 5.8 | 343.1 |
| 1992 | 1894 | 61.1 | 3756.7 | 2186 | 72.9 | 4335.9 | 105 | 3.4 | 208.3 | 105 | 3.4 | 208.3 | 0 | 0 | 0.0 |
| 1993 | 2155 | 69.5 | 4274.4 | 2702 | 90.1 | 5359.3 | 736 | 23.7 | 1459.8 | 82 | 2.6 | 162.6 | 555 | 18.5 | 1100.8 |
| 1994 | 2121 | 68.4 | 4206.9 | 2634 | 87.8 | 5224.5 | 456 | 14.7 | 904.5 | 0 | 0.0 | 0.0 | 0 | 0.0 | 0.0 |
| 1995 | 1080 | 34.8 | 2142.1 | 2083 | 69.4 | 4131.6 | 533 | 17.2 | 1057.2 | 858 | 27.7 | 1701.8 | 569 | 19.0 | 1128.6 |
| 1996 | 1913 | 61.7 | 3794.4 | 2681 | 89.4 | 5317.7 | 471 | 15.2 | 934.2 | 372 | 12.0 | 737.9 | 250 | 8.3 | 495.9 |
| 1997 | 1629 | 52.5 | 3231.1 | 2036 | 67.9 | 4038.3 | 556.5 | 18.0 | 1103.8 | 0 | 0.0 | 0.0 | 0 | 0.0 | 0.0 |
| 1998 | 1325.7 | 42.8 | 2629.5 | 2370 | 79.0 | 4700.8 | 1246 | 40.2 | 2471.4 | 0 | 0.0 | 0.0 | 285.7 | 9.5 | 566.7 |
| 1999 | 1182 | 38.1 | 2344.5 | 2500 | 83.3 | 4958.7 | 746 | 24.1 | 1479.7 | 0 | 0.0 | 0.0 | 437 | 14.6 | 866.8 |
| AVERAGES | 40.1 | 2464.7 | 76.7 | 4561.3 | 25.6 | 1574.2 | 4.0 | 248.4 | 6.5 | 385.3 | |||||