Wyoming State Water Plan
Wyoming State Water Plan
Wyoming Water Development Office
6920 Yellowtail Rd
Cheyenne, WY 82002
Phone: 307-777-7626

Wyoming Water Development Office
6920 Yellowtail Rd
Cheyenne, WY 82002
Phone: 307-777-7626


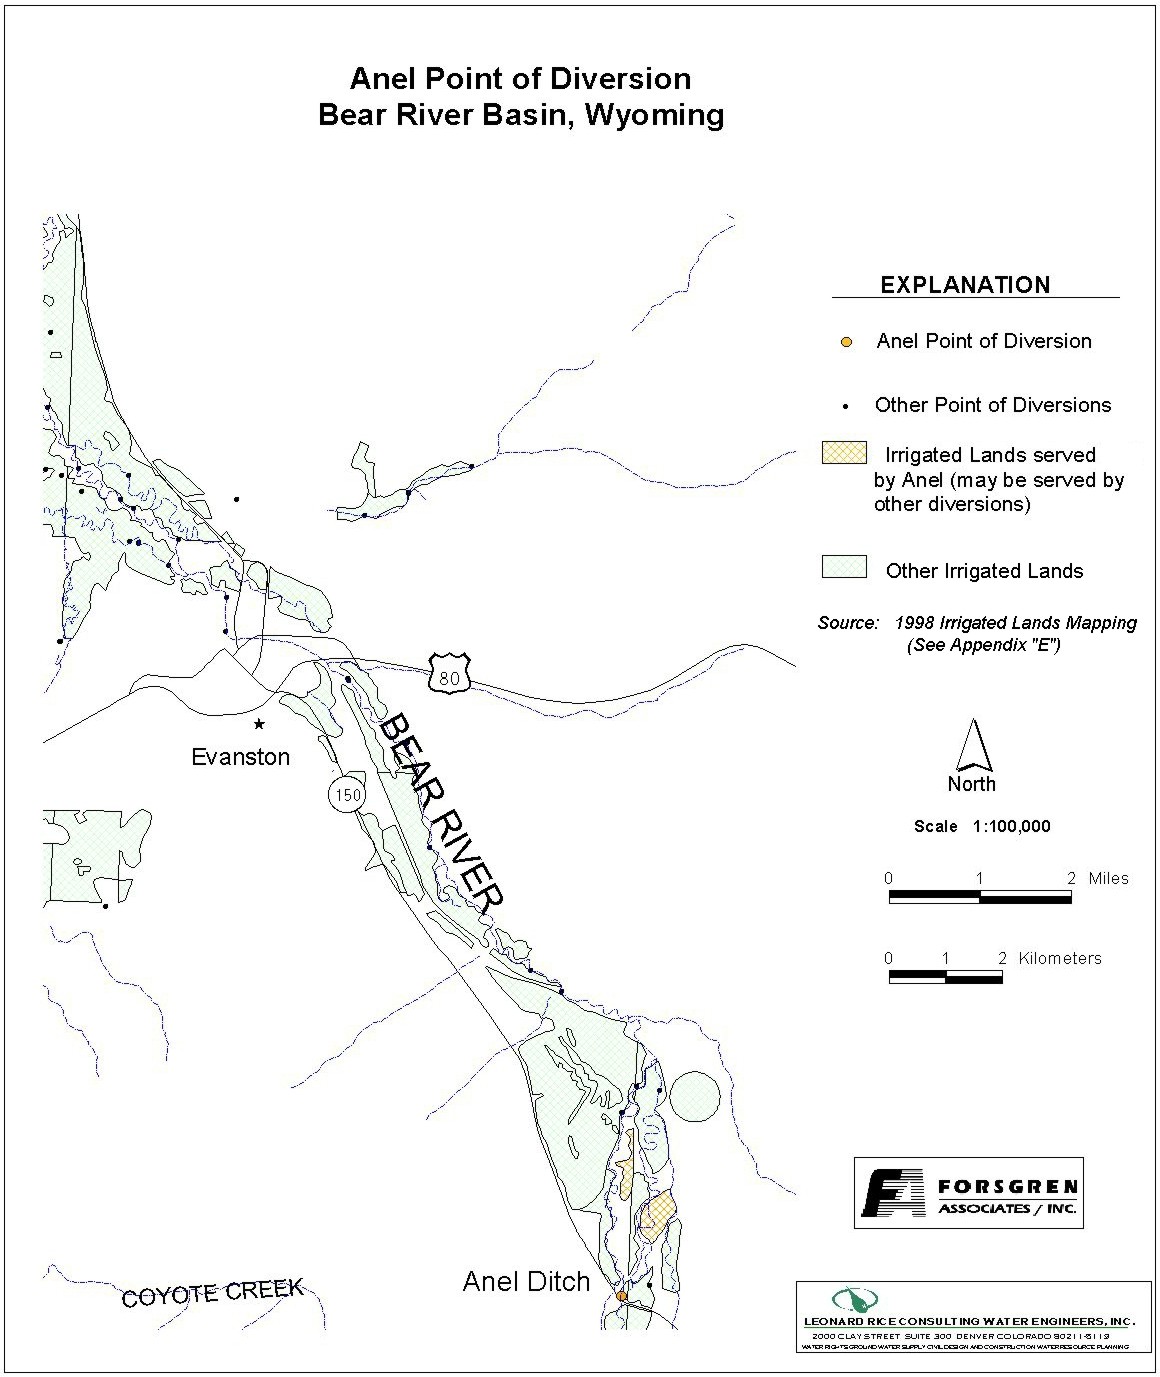
| Diversion Description: The Anel headgate structure consists of a 48-inch CMP culvert with a slide gate. The structure appears to be 60% to 40% buried. It tends to periodically plug up during in the spring. | 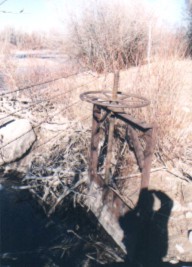 Anel Ditch headgate |
|
Conveyance Description: Open channel ditch, approximately 10,560 feet in length.1
Direct Flow Water Rights:2
| Priority Date | Permit Number |
Permitted Use | Permitted Acres |
Flow (CFS) |
Cumulative (CFS) |
Comments |
|---|---|---|---|---|---|---|
| 04-15-1887 | Terr | Irrigation | 295 | 4.21 | 4.21 | |
| 04-19-1904 | 59582 | Irrigation | 31.2 | 0.94 | 12.18 | |
| 05-24-1978 | 6847E | Irrigation | 102.2 | 1.46 | 6.11 |
Associated Storage Rights:
| Reservoir | Shareholder | Volume (Acre-ft) |
Est. % of Shares Used this Diversion3 | Comments |
|---|---|---|---|---|
| Sulphur Creek | Dennis Cornelison | 207 | 50% | By Exchange |
Irrigation Practices: Land is all flood irrigated.3
Estimated Diversion Efficiency: Conveyance losses are relatively high due to porous nature of soils in the higher reaches of the Upper Bear.
Calculated Diversion Efficiency = Conveyance Efficiency X Application Efficiency:
Conveyance Efficiency: 50% Application Efficiency: 55% Overall Diversion Efficiency: 30%
Conveyance efficiency is estimated by total length of main canal. Application efficiency for flood irrigation and sprinkler irrigation is estimated at 55% and 85% respectively.
Crop Types / Consumptive Use: Water is used entirely to irrigate mixed meadow grasses, primarily Meadow Foxtail, Redtop, etc.3
Return Flows: Return flow is primarily intercepted by the main channel of the Bear River between the Mill Creek and Sulphur Creek confluences.
The following return flow pattern was adopted for modeling in this study are as follows:
		Month
      (after initial Diversion)	 Percent of Return
		0			70%
		1			20%
		2		        10%
		3                        0%
Other Operational Information: The Anel Ditch is typically operated from May through mid August of each year.3
References:
Monthly Diversion Records
Anel
| YEAR | MAY | JUNE | JULY | AUGUST | SEPTEMBER | ||||||||||
|---|---|---|---|---|---|---|---|---|---|---|---|---|---|---|---|
| Total of Daily Ave for Month | Average CFS |
Monthly Total Ac-Ft |
Total of Daily Ave for Month | Average CFS |
Monthly Total Ac-Ft |
Total of Daily Ave for Month | Average CFS |
Monthly Total Ac-Ft |
Total of Daily Ave for Month | Average CFS |
Monthly Total Ac-Ft |
Total of Daily Ave for Month | Average CFS |
Monthly Total Ac-Ft | |
| *1970 | |||||||||||||||
| 1971 | 60 | 1.9 | 119.0 | 425 | 14.2 | 843.0 | 47 | 1.5 | 93.2 | 319 | 10.3 | 632.7 | 211 | 7.0 | 418.5 |
| 1972 | 117 | 3.8 | 232.1 | 488 | 16.3 | 967.9 | 131 | 4.2 | 259.8 | 119 | 3.8 | 236.0 | 0 | 0.0 | 0.0 |
| 1973 | 0 | 0.0 | 0.0 | 268 | 8.9 | 531.6 | 137 | 4.4 | 271.7 | 83 | 2.7 | 164.6 | 132 | 4.4 | 261.8 |
| 1974 | 109 | 3.5 | 216.2 | 79 | 2.6 | 156.7 | 118 | 3.8 | 234.0 | 6 | 0.2 | 11.9 | 6 | 0.2 | 11.9 |
| 1975 | 91 | 2.9 | 180.5 | 170 | 5.7 | 337.2 | 611 | 19.7 | 1211.9 | 37 | 1.2 | 73.4 | 32 | 1.1 | 63.5 |
| 1976 | 237 | 7.6 | 470.1 | 135 | 4.5 | 267.8 | 137 | 4.4 | 271.7 | 78 | 2.5 | 154.7 | 69 | 2.3 | 136.9 |
| 1977 | 91 | 2.9 | 180.5 | 118 | 3.9 | 234.0 | 50 | 1.6 | 99.2 | 0 | 0.0 | 0.0 | 0 | 0.0 | 0.0 |
| 1978 | 179 | 5.8 | 355.0 | 461 | 15.4 | 914.4 | 171 | 5.5 | 339.2 | 41 | 1.3 | 81.3 | 46 | 1.5 | 91.2 |
| 1979 | 76 | 2.5 | 150.7 | 145 | 4.8 | 287.6 | 103 | 3.3 | 204.3 | 43 | 1.4 | 85.3 | 0 | 0.0 | 0.0 |
| 1980 | 27 | 0.9 | 53.6 | 432 | 14.4 | 856.9 | 136 | 4.4 | 269.8 | 67 | 2.2 | 132.9 | 36 | 1.2 | 71.4 |
| 1981 | 110 | 3.5 | 218.2 | 248 | 8.3 | 491.9 | 32 | 1.0 | 63.5 | 41 | 1.3 | 81.3 | 0 | 0.0 | 0.0 |
| 1982 | 40 | 1.3 | 79.3 | 294 | 9.8 | 583.1 | 217 | 7.0 | 430.4 | 84 | 2.7 | 166.6 | 217 | 7.2 | 430.4 |
| 1983 | 204 | 6.6 | 404.6 | 24 | 0.8 | 47.6 | 149 | 4.8 | 295.5 | 64 | 2.1 | 126.9 | 34 | 1.1 | 67.4 |
| 1984 | 0 | 0.0 | 0.0 | 332 | 11.1 | 658.5 | 204 | 6.6 | 404.6 | 0 | 0.0 | 0.0 | 24 | 0.8 | 47.6 |
| 1985 | 59 | 1.9 | 117.0 | 825 | 27.5 | 1636.4 | 379 | 12.2 | 751.7 | 54 | 1.7 | 107.1 | 12 | 0.4 | 23.8 |
| 1986 | 27 | 0.9 | 53.6 | 0 | 0.0 | 0.0 | 259 | 8.4 | 513.7 | 53 | 1.7 | 105.1 | 247 | 8.2 | 489.9 |
| 1987 | 333 | 10.7 | 660.5 | 455 | 15.2 | 902.5 | 141 | 4.5 | 279.7 | 119 | 3.8 | 236.0 | 82 | 2.7 | 162.6 |
| 1988 | 249 | 8.0 | 493.9 | 238 | 7.9 | 472.1 | 155 | 5.0 | 307.4 | 0 | 0.0 | 0.0 | 0 | 0.0 | 0.0 |
| 1989 | 213 | 6.9 | 422.5 | 266 | 8.9 | 527.6 | 147 | 4.7 | 291.6 | 69 | 2.2 | 136.9 | 9 | 0.3 | 17.9 |
| 1990 | 121 | 3.9 | 240.0 | 132 | 4.4 | 261.8 | 143 | 4.6 | 283.6 | 56 | 1.8 | 111.1 | 0 | 0.0 | 0.0 |
| 1991 | 64 | 2.1 | 126.9 | 176 | 5.9 | 349.1 | 65 | 2.1 | 128.9 | 23 | 0.7 | 45.6 | 14 | 0.5 | 27.8 |
| 1992 | 105 | 3.4 | 208.3 | 127 | 4.2 | 251.9 | 61 | 2.0 | 121.0 | 0 | 0.0 | 0.0 | 38 | 1.3 | 75.4 |
| 1993 | 36 | 1.2 | 71.4 | 325 | 10.8 | 644.6 | 234 | 7.5 | 464.1 | 43 | 1.4 | 85.3 | 99 | 3.3 | 196.4 |
| 1994 | 41 | 1.3 | 81.3 | 256 | 8.5 | 507.8 | 117 | 3.8 | 232.1 | 72 | 2.3 | 142.8 | 25 | 0.8 | 49.6 |
| 1995 | 59 | 1.9 | 117.0 | 405 | 13.5 | 803.3 | 14 | 0.5 | 27.8 | 68 | 2.2 | 134.9 | 137 | 4.6 | 271.7 |
| 1996 | 2 | 0.1 | 4.0 | 765 | 25.5 | 1517.4 | 205 | 6.6 | 406.6 | 4 | 0.1 | 7.9 | 19 | 0.6 | 37.7 |
| 1997 | 62.3 | 2.0 | 123.6 | 525 | 17.5 | 1041.3 | 211 | 6.8 | 418.5 | 185.7 | 6.0 | 368.3 | 151.9 | 5.1 | 301.3 |
| 1998 | 394.8 | 12.7 | 783.1 | 318.4 | 10.6 | 631.5 | 186.8 | 6.0 | 370.5 | 109.8 | 3.5 | 217.8 | 27.1 | 0.9 | 53.8 |
| 1999 | 15 | 0.5 | 29.8 | 570 | 19.0 | 1130.6 | 383 | 12.4 | 759.7 | 99 | 3.2 | 196.4 | 35 | 1.2 | 69.4 |
| AVERAGES | 3.5 | 213.5 | 10.3 | 615.7 | 5.5 | 338.1 | 2.2 | 132.5 | 2.0 | 116.5 | |||||