Wyoming State Water Plan
Wyoming State Water Plan
Wyoming Water Development Office
6920 Yellowtail Rd
Cheyenne, WY 82002
Phone: 307-777-7626

Wyoming Water Development Office
6920 Yellowtail Rd
Cheyenne, WY 82002
Phone: 307-777-7626


| SUBJECT: |
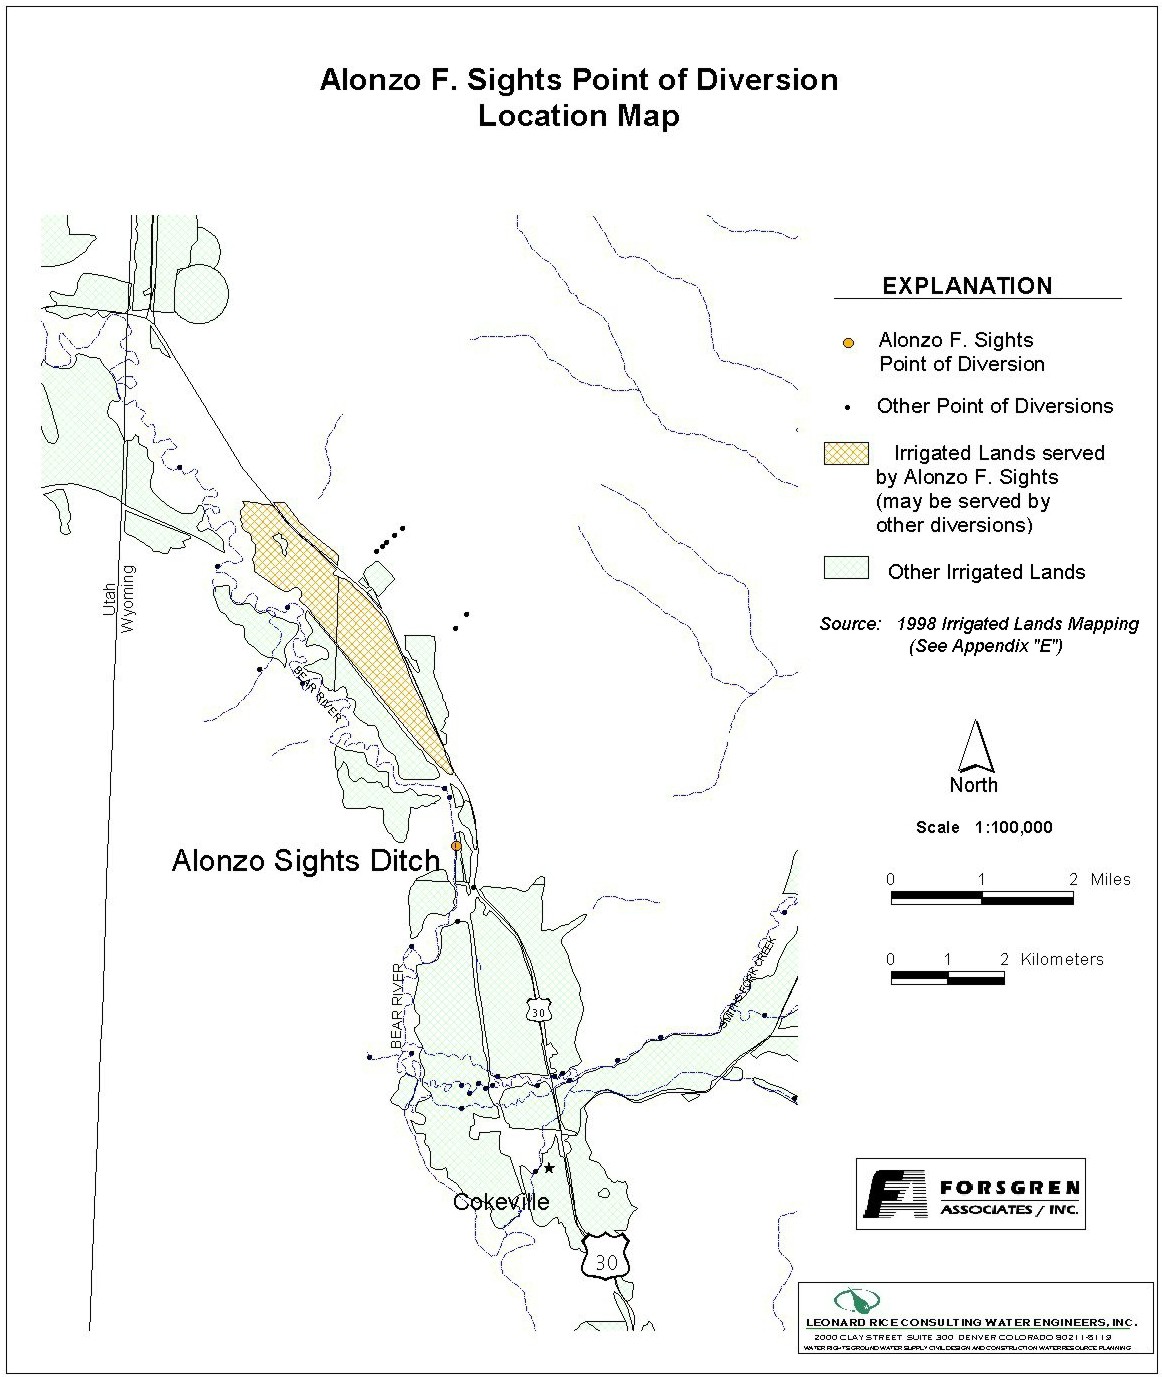
Appendix D Key Structures and Diversions ALONZO F. SIGHTS DIVERSION |
| PREPARED BY: | Bear River Basin Planning Team |
| DATE: | August 7, 2000 |
| Diversion Description: The Alonzo F. Sights diversion structure consists of a concrete chute with wing walls and a 65-inch wide steel slide gate. | 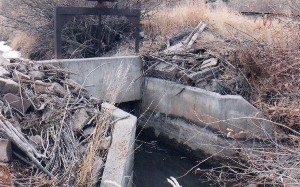 Alonzo F. Sights headgate structure |
|
Conveyance Description: Open channel ditch, approximately 15,840 feet in length.1
Direct Flow Water Rights:2
| Priority Date | Permit Number |
Permitted Use | Permitted Acres |
Flow (CFS) |
Cumulative (CFS) |
Comments |
|---|---|---|---|---|---|---|
| 05-30-1884 | Terr | Irrigation | 97 | 1.38 | 1.38 | |
| 05-30-1884 | Terr | Irrigation, Storage | 250 | 3.57 | 4.95 | |
| 05-30-1884 | Terr | Irrigation, Storage | 227 | 3.24 | 8.19 | |
| 01-11-1954 | 5721E | Irrigation, Storage | 33 | 0.47 | 8.66 | George Bourne - Garret Springs (Non-Compact tributary - deducted from compact accounting.) |
Associated Storage Rights: None
Irrigation Practices: Irrigation practices are mixed (Approx. 60% flood irrigation, 40% hand line sprinklers & side rolls).3
Estimated Diversion Efficiency:
Calculated Diversion Efficiency = Conveyance Efficiency X Application Efficiency:
Conveyance Efficiency: 65% Application Efficiency: 65% Overall Diversion Efficiency: 42% Conveyance efficiency is estimated by total length of main canal. Application efficiency for flood irrigation and sprinkler irrigation is estimated at 55% and 85% respectively.
Crop Types / Consumptive Use: Approximately 40% of the irrigated acreage is alfalfa and grains (primarily oats). The remainder of the acreage is meadow grasses.3
Return Flows: Return flow is primarily captured the Oscar E. Snyder Ditch (approx. 50%) and the Cook Brothers Ditch (approx. 50%).
The following return flow pattern was adopted for modeling in this study are as follows:
		Month
      (after initial Diversion)	 Percent of Return
		0			70%
		1			20%
		2			10%
                3                        0%
                                       100%
References:
Monthly Diversion Records
Alonzo F. Sights
| YEAR | MAY | JUNE | JULY | AUGUST | SEPTEMBER | ||||||||||
|---|---|---|---|---|---|---|---|---|---|---|---|---|---|---|---|
| Total of Daily Ave for Month | Average CFS |
Monthly Total Ac-Ft |
Total of Daily Ave for Month | Average CFS |
Monthly Total Ac-Ft |
Total of Daily Ave for Month | Average CFS |
Monthly Total Ac-Ft |
Total of Daily Ave for Month | Average CFS |
Monthly Total Ac-Ft |
Total of Daily Ave for Month | Average CFS |
Monthly Total Ac-Ft | |
| 1970 | 11 | 0.4 | 21.8 | 268 | 8.9 | 531.6 | 320 | 10.3 | 634.7 | 143 | 4.6 | 283.6 | 0 | 0.0 | 0.0 |
| 1971 | 1229 | 39.6 | 2437.7 | 1284 | 42.8 | 2546.8 | 432 | 13.9 | 856.9 | 105 | 3.4 | 208.3 | 15 | 0.5 | 29.8 |
| 1972 | 612 | 19.7 | 1213.9 | 1890 | 63.0 | 3748.8 | 200 | 6.5 | 396.7 | 304 | 9.8 | 603.0 | 36 | 1.2 | 71.4 |
| 1973 | 79 | 2.5 | 156.7 | 462 | 15.4 | 916.4 | 470 | 15.2 | 932.2 | 132 | 4.3 | 261.8 | 0 | 0.0 | 0.0 |
| 1974 | 413 | 13.3 | 819.2 | 696 | 23.2 | 1380.5 | 392 | 12.6 | 777.5 | 213 | 6.9 | 422.5 | 20 | 0.7 | 39.7 |
| 1975 | 0 | 0.0 | 0.0 | 327 | 10.9 | 648.6 | 138 | 4.5 | 273.7 | 113 | 3.6 | 224.1 | 2 | 0.1 | 4.0 |
| 1976 | 0 | 0.0 | 0.0 | 192 | 6.4 | 380.8 | 412 | 13.3 | 817.2 | 784 | 25.3 | 1555.0 | 0 | 0.0 | 0.0 |
| 1977 | 202 | 6.5 | 400.7 | 216 | 7.2 | 428.4 | 175 | 5.6 | 347.1 | 2 | 0.1 | 4.0 | 0 | 0.0 | 0.0 |
| 1978 | 148 | 4.8 | 293.6 | 567 | 18.9 | 1124.6 | 504 | 16.3 | 999.7 | 119 | 3.8 | 236.0 | 0 | 0.0 | 0.0 |
| 1979 | 404 | 13.0 | 801.3 | 471 | 15.7 | 934.2 | 323 | 10.4 | 640.7 | 28 | 0.9 | 55.5 | 0 | 0.0 | 0.0 |
| 1980 | 447 | 14.4 | 886.6 | 693 | 23.1 | 1374.5 | 360 | 11.6 | 714.0 | 35 | 1.1 | 69.4 | 116 | 3.9 | 230.1 |
| 1981 | 223 | 7.2 | 442.3 | 445 | 14.8 | 882.6 | 450 | 14.5 | 892.6 | 28 | 0.9 | 55.5 | 9 | 0.3 | 17.9 |
| 1982 | 1683 | 54.3 | 3338.2 | 1245 | 41.5 | 2469.4 | 328 | 10.6 | 650.6 | 14 | 0.5 | 27.8 | 73 | 2.4 | 144.8 |
| 1983 | 2 | 0.1 | 4.0 | 2783 | 92.8 | 5520.0 | 118 | 3.8 | 234.0 | 21 | 0.7 | 41.7 | 0 | 0.0 | 0.0 |
| 1984 | 990 | 31.9 | 1963.6 | 2482 | 82.7 | 4923.0 | 448 | 14.5 | 888.6 | 12 | 0.4 | 23.8 | 0 | 0.0 | 0.0 |
| 1985 | 0 | 0.0 | 0.0 | 216 | 7.2 | 428.4 | 206 | 6.6 | 408.6 | 107 | 3.5 | 212.2 | 130 | 4.3 | 257.9 |
| 1986 | 0 | 0.0 | 0.0 | 168 | 5.6 | 333.2 | 314 | 10.1 | 622.8 | 246 | 7.9 | 487.9 | 0 | 0.0 | 0.0 |
| 1987 | 291 | 9.4 | 577.2 | 283 | 9.4 | 561.3 | 242 | 7.8 | 480.0 | 68 | 2.2 | 134.9 | 0 | 0.0 | 0.0 |
| 1988 | 11 | 0.4 | 21.8 | 809 | 27.0 | 1604.6 | 268 | 8.6 | 531.6 | 275 | 8.9 | 545.5 | 42 | 1.4 | 83.3 |
| 1989 | 104 | 3.4 | 206.3 | 596 | 19.9 | 1182.1 | 614 | 19.8 | 1217.9 | 224 | 7.2 | 444.3 | 0 | 0.0 | 0.0 |
| 1990 | 32 | 1.0 | 63.5 | 207 | 6.9 | 410.6 | 266 | 8.6 | 527.6 | 256 | 8.3 | 507.8 | 23 | 0.8 | 45.6 |
| 1991 | 125 | 4.0 | 247.9 | 285 | 9.5 | 565.3 | 272 | 8.8 | 539.5 | 267 | 8.6 | 529.6 | 147 | 4.9 | 291.6 |
| 1992 | 279 | 9.0 | 553.4 | 270 | 9.0 | 535.5 | 279 | 9.0 | 553.4 | 118 | 3.8 | 234.0 | 0 | 0.0 | 0.0 |
| 1993 | 202 | 6.5 | 400.7 | 718 | 23.9 | 1424.1 | 504 | 16.3 | 999.7 | 151 | 4.9 | 299.5 | 96 | 3.2 | 190.4 |
| 1994 | 283 | 9.1 | 561.3 | 283 | 9.4 | 561.3 | 274 | 8.8 | 543.5 | 28 | 0.9 | 55.5 | 18 | 0.6 | 35.7 |
| 1995 | 266 | 8.6 | 527.6 | 672 | 22.4 | 1332.9 | 362 | 11.7 | 718.0 | 106 | 3.4 | 210.2 | 0 | 0.0 | 0.0 |
| 1996 | 211 | 6.8 | 418.5 | 786 | 26.2 | 1559.0 | 475 | 15.3 | 942.1 | 0 | 0.0 | 0.0 | 282 | 9.4 | 559.3 |
| 1997 | 75.1 | 2.4 | 149.0 | 434.2 | 14.5 | 861.2 | 545.1 | 17.6 | 1081.2 | 240.7 | 7.8 | 477.4 | 14 | 0.5 | 27.8 |
| 1998 | 87.5 | 2.8 | 173.6 | 69.6 | 2.3 | 138.0 | 465.8 | 15.0 | 923.9 | 98.7 | 3.2 | 195.8 | 0 | 0.0 | 0.0 |
| AVERAGES | 9.4 | 575.2 | 22.8 | 1355.4 | 11.3 | 694.7 | 4.7 | 289.9 | 1.2 | 70.0 | |||||