Wyoming State Water Plan
Wyoming State Water Plan
Wyoming Water Development Office
6920 Yellowtail Rd
Cheyenne, WY 82002
Phone: 307-777-7626

Wyoming Water Development Office
6920 Yellowtail Rd
Cheyenne, WY 82002
Phone: 307-777-7626


|
BBC Consulting, Inc. Denver, CO 80209 | Boyle Engineering, Inc. Lakewood, CO 80228 |
|
Hinckley Consulting Laramie, WY 82070 | Fassett Consulting Cheyenne, WY 82003 |
|
Rendezvous Engineering Jackson, WY 83001 | Nelson Engineering Jackson, WY 83001 |
A. INTRODUCTION
The 2001 Wyoming Legislature authorized the Wyoming Water Development Commission (WWDC) to complete the Snake/Salt River Basin portion of the State Water Plan. According to the WWDC, the river basin planning process has the following goals:
As part of the initial planning process, the WWDC decided to construct a set of guidelines for the various plan components in order to promote consistency among the various basin plans. A document entitled "State of Wyoming Water Basin Planning Process, Guidelines for Development of Basin Plans" was created in 2001 by the WWDC and States West Water Resources Corporation. The consultant team utilized these guidelines during creation of the Snake/Salt River basin plan. The following topics are included in the Snake/Salt River basin plan:
Numerous technical memoranda were created as the background to this final report. All topics discussed in this report are covered in detail in the technical memoranda. These documents, as well as other Wyoming river basin plans, can be found electronically on the Wyoming State
Water Plan homepage at http://waterplan.state.wy.us/. For practical purposes, all references used in the creation of this report can be found in its corresponding technical memorandum.
The initial Snake/Salt River Basin Advisory Group meeting was held May 15, 2001 in Jackson. At that time the Basin Advisory Group (BAG) was formed, consisting of over 30 citizens from throughout the basin. The members represent a variety of interests, such as agriculture, industry, environmental, government and recreation. Their knowledge and input was invaluable to the creation of this basin plan and their efforts were much appreciated.
B. DESCRIPTION
Location:
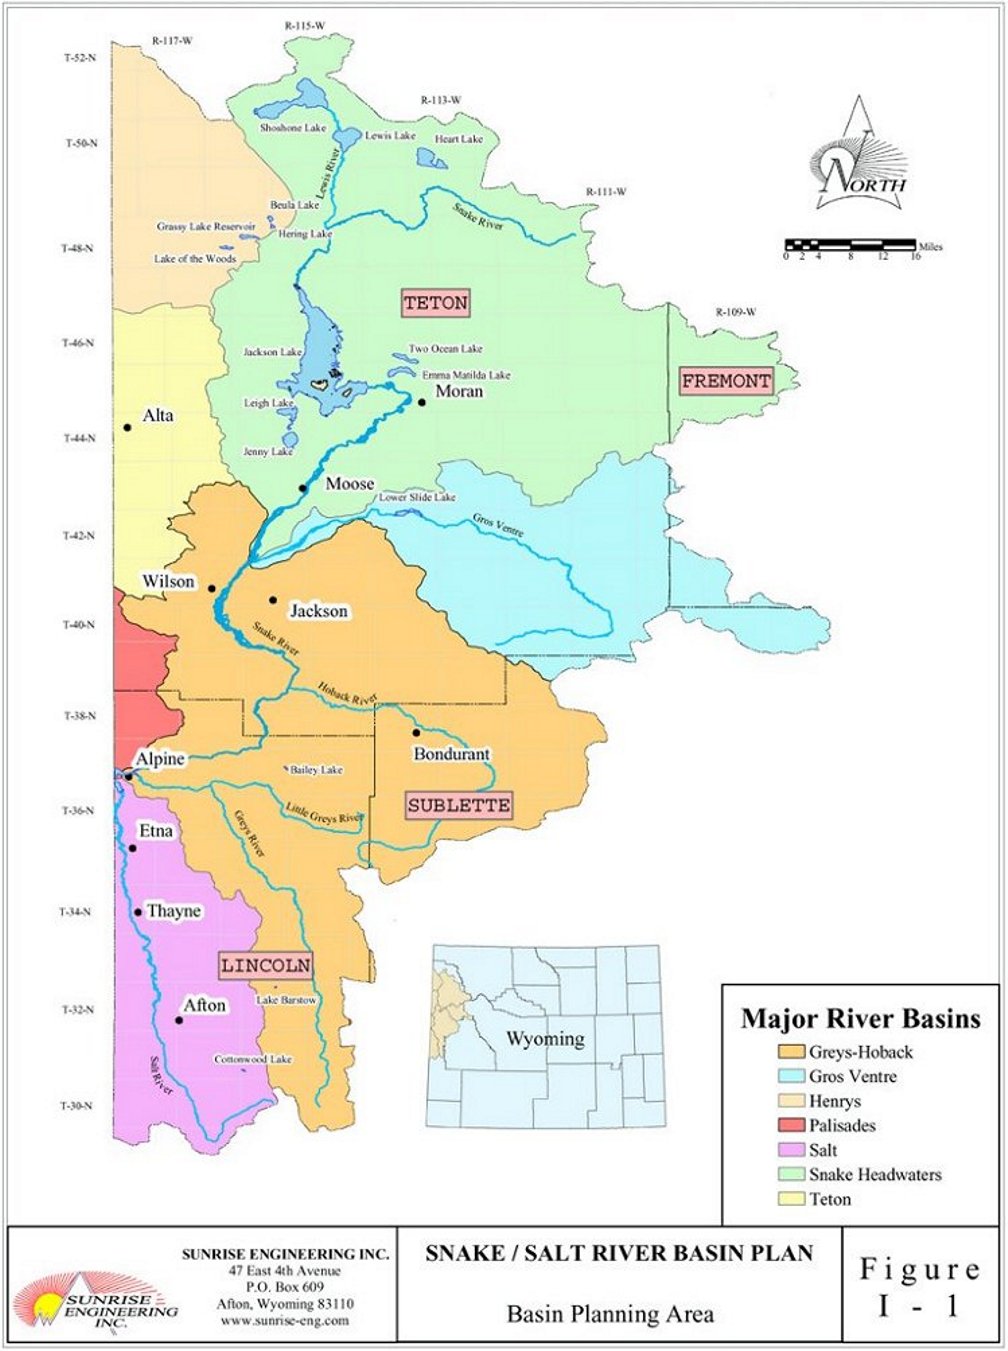
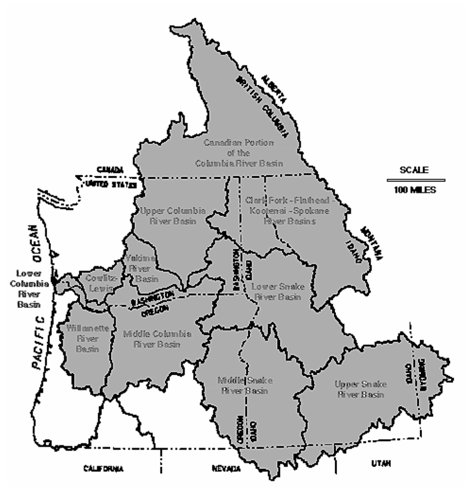
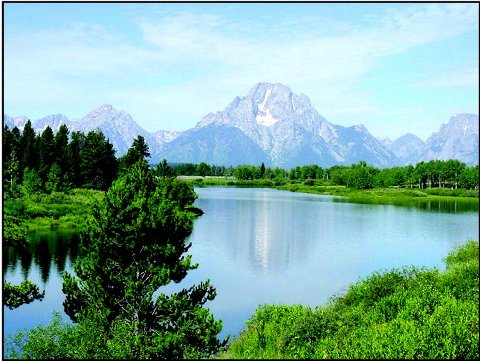
The Snake River Basin is part of the Columbia River drainage that flows to the Pacific Ocean. The Snake/Salt River basin in Wyoming is a portion of the headwaters of the Snake River, and contains all of the Snake Headwaters, Gros Ventre, Greys, and Hoback sub-basins, as well as portions of the Salt, Palisades, Teton, Lower Henry's, and Upper Henry's sub-basins. The Wyoming portion of the Snake/Salt River basin covers approximately 5,100 square miles. A map of the Snake/Salt River basin planning area can be found in Figure I-1. The Snake River is one of the major rivers of the West, flowing from Wyoming across Idaho before converging with the Columbia River in Washington. The basin covers all of Teton County and portions of Lincoln, Sublette, and Fremont Counties. The basin includes all of Grand Teton National Park, as well as a portion of Yellowstone National Park.
Topography:
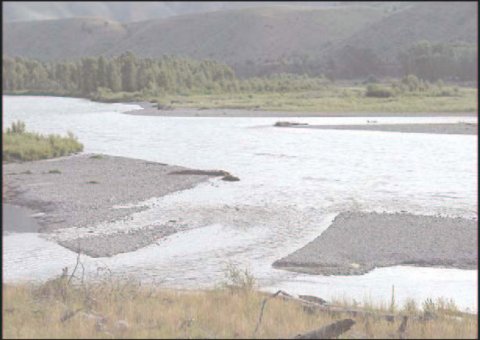
The basin is quite mountainous, with populated areas located mainly in the larger valley locations. The main stem of the Snake River flows generally north to south, while the tributaries flow in varied directions prior to meeting the Snake. The Salt River runs primarily south to north. The Snake, Salt, and Greys Rivers converge at Palisades Reservoir, which is located on the Wyoming-Idaho border.
The west slope of the Teton Range flows to the west toward the Henry's Fork of the Snake River and its tributary, the Teton River. The Henry's Fork merges with the main stem of the Snake River downstream in Idaho. Elevation of the basin ranges from the Grand Teton at 13,770 feet to Palisades Reservoir at 5,500 feet.
Climate:
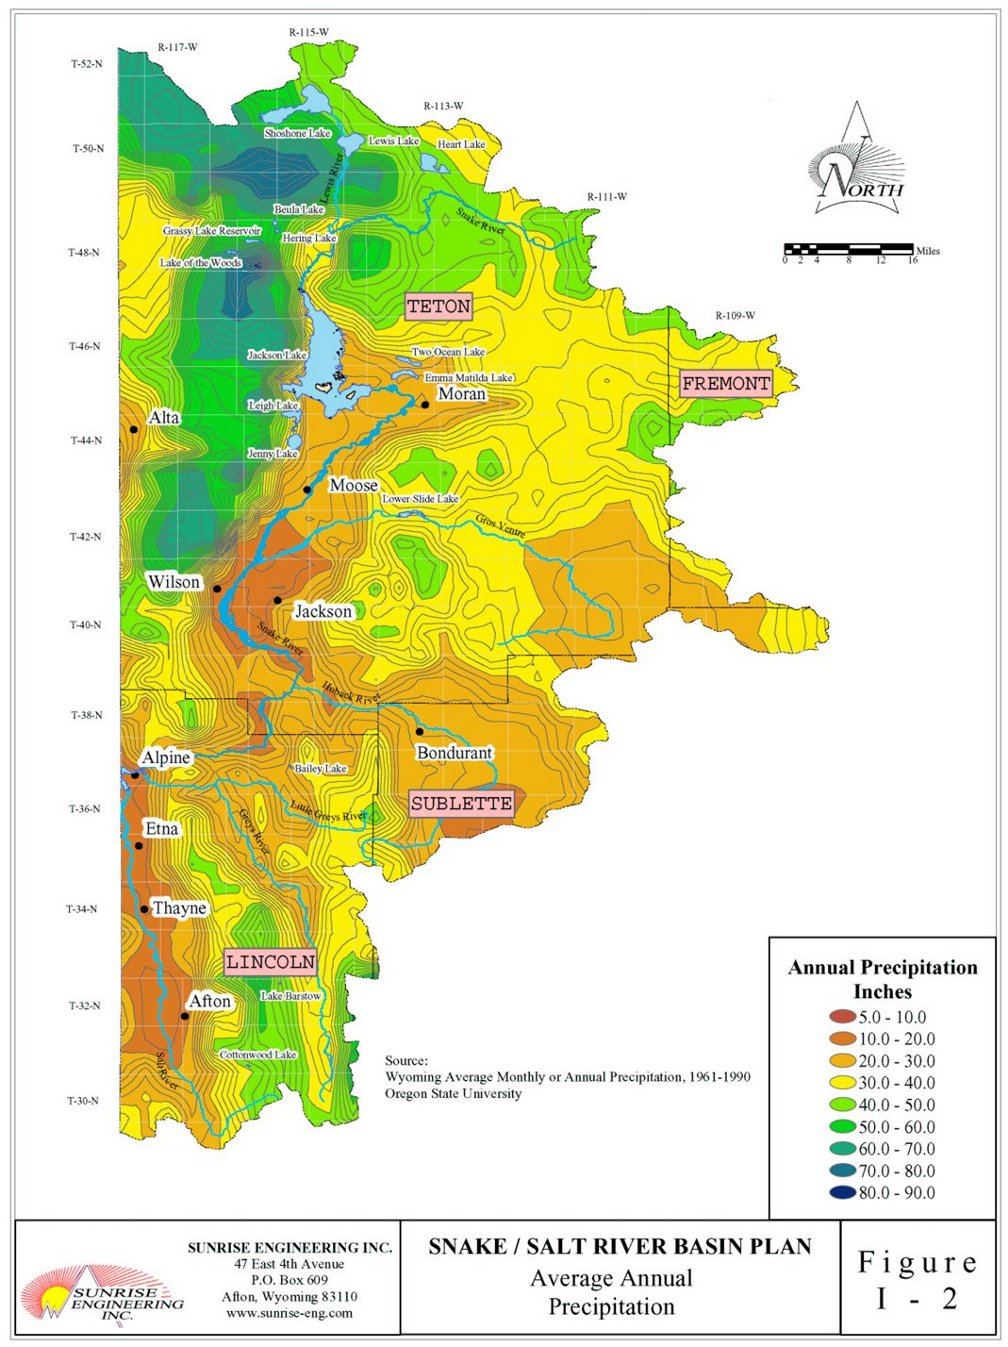
Climate in the basin can be quite variable due to the range of elevation that is present. Of the locations with recorded data, the average annual precipitation ranges from approximately 17 inches in Jackson to over 28 inches at the Snake River site near Flagg Ranch. Examples of precipitation at other populated areas include over 18 inches at Afton, nearly 24 inches at Alta, and over 20 inches at Boundurant. Mountainous areas typically have much higher average annual precipitation, with some areas at over 60 inches in areas of the Tetons. The majority of the precipitation falls in the winter as snowfall, which then melts and flows as runoff during the spring and summer months. The average annual precipitation across the basin is shown in Figure I-2.
The high elevation of the mountain valleys in the basin results in a fairly short growing season capable of supporting only native hay, alfalfa, and small grains. The average growing seasons are 139 days and 144 days for Jackson and Afton respectively. Also, the relative lack of precipitation during the summer results in a need for crop irrigation in order to maximize crop production.
Water Features:
The main water features in the Snake/Salt River basin are the rivers themselves. The Snake River is the largest in the basin, and its sizeable tributaries include the Buffalo Fork, Gros Ventre, and Hoback Rivers. The Salt and Greys Rivers are also tributary to the Snake, and join the main river at Palisades Reservoir. Numerous streams feed each of these rivers on their journey through the basin.
There are many natural lakes in the basin, which include Shoshone, Heart, and Lewis Lakes in Yellowstone National Park. There are many sizeable lakes in Grand Teton National Park, including Jackson, Jenny, Leigh, Two Ocean, and Emma Matilda Lakes. Many smaller lakes are located throughout the basin, generally on Forest Service lands. There are few major reservoirs in the basin. The major reservoirs are Jackson Lake, Grassy Lake, and Palisades Reservoir. These three features are managed by the U.S. Bureau of Reclamation.
History:
Prior to the early 1800's, the Snake/Salt River basin was frequented by Sioux, Blackfeet, Gros Ventre, Crow, and Shoshone tribes for hunting during the warmer months. The area was not used for year-round habitation due to the harsh winters.
Fur trappers began to frequent the area in the early 1800's. It is believed that John Colter first visited the Jackson Hole area in 1807 and eventually traveled through the Yellowstone Park area. Many famous trappers worked in the area, such as Jedediah Smith, Jim Bridger, and Davey Jackson, after which Jackson Hole was named. The mountain men annually held a rendezvous in the summer. By 1840, the fur trade had virtually ended, and the area was again left unsettled and visited only occasionally.
The area was acquired by the United States as part of the Oregon Territory in 1846. Many travelers passed through the Star Valley area on the Lander Trail, a cut-off from the original Oregon Trail, from 1856 until the late 1860's. However the area didn't see permanent settlers until the late 1870's to mid 1880's. With settlement, the livestock industry began to grow, and by the 1890's dairy production had begun in the Star Valley area.
C. WATER RELATED HISTORY OF THE BASIN
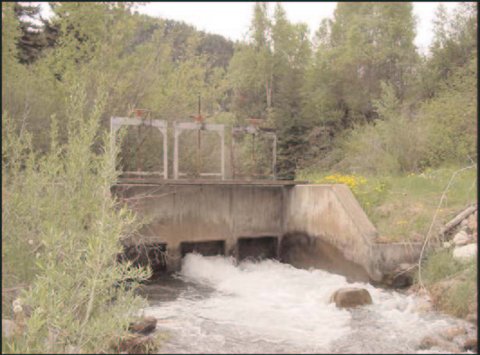
The Wyoming Territorial Legislature adopted laws regarding the appropriation of irrigation water in 1886. In 1889, the Constitutional Convention established water law under which the state had control of the water. These laws were in place as Wyoming achieved Statehood in 1890. While water was undoubtedly used previously for irrigation purposes, the first approved water right in the Star Valley area was in 1885 on Spring Creek, a tributary of Crow Creek. Rights were filed on many of the tributaries and rivers in the basin soon afterward.
Irrigation developed more rapidly downstream in Idaho due to the longer growing season and rich soils. A rock filled crib dam was initially constructed on Jackson Lake in 1907, which was replaced by a concrete dam in 1911. The dam height was increased to its current level by 1916. Additional reservoirs were later constructed for the benefit of Idaho irrigation, with Grassy Lake Reservoir in 1939 and Palisades Reservoir in 1957.
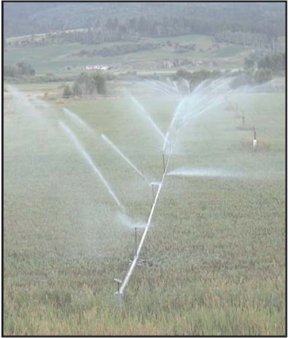
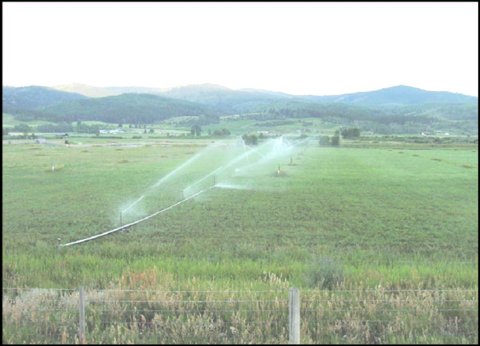
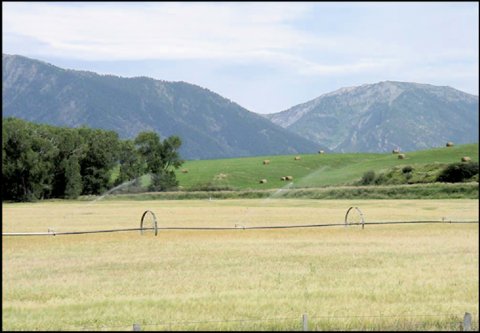
Due to the increase in water use in Idaho, conflicts arose between Idaho and Wyoming regarding the use of water. These conflicts resulted in the Roxanna Decree in 1941, which governs the use of Teton Creek and South Leigh Creek on the west side of the Teton Range. Soon afterward in 1950 the Snake River Compact was agreed upon by the two states as well as by federal agencies. Gravity flow sprinkler systems were established in many areas of Star Valley in the 1960's and 1970's. This resulted in an increase of productivity of the farmland under sprinkler irrigation. Only isolated areas in the Jackson Hole area have converted to sprinkler irrigation, and many continue with flood irrigation to keep the Old West atmosphere. Also, some formerly irrigated areas have been converted into residential subdivisions.
There is very little use of stored water for irrigation within the Snake/Salt River basin. The large reservoirs located in the basin, Jackson Lake and Grassy Lake, store water for use on farmland located downstream in Idaho.
D. WYOMING WATER LAW
One of the primary tenets established in the Wyoming Water Development Commission water planning process is that Wyoming water law would be respected in all aspects throughout the process. Wyoming water law is the foundation upon which all water use, development and protection is based; it provides the predictable basis upon which existing use and future planning and investment in the State's most valuable and renewable resource are made. The water rights system in Wyoming is administered by the State Engineer's Office and State Board of Control, both constitutionally-based administrative and quasi-judicial entities of state government.
Wyoming's water laws have evolved from the early establishment of legal principles that were later embodied in our state's Constitution and a series of statutory laws written and adopted early in Wyoming's history that have stood the strong test of time and certainty. One early water dispute that involved two territorial pioneers, William McCrea and Charles Moyer, is instructive regarding the history of water law in Wyoming. Moyer, whose name is associated with a now-famous spring in the coal-mining region north of Gillette, developed that spring for irrigation in 1890. Previously, Mr. McCrea developed an irrigation project along the Little Powder River downstream of, and partially supplied by, Moyer's spring. With Moyer's development, McCrea's ditch was now short of water and the resulting argument was eventually elevated to the Wyoming Supreme Court. In one of the first Court rulings on water matters, the Court affirmed the "first in time, first in right" doctrine by siding with McCrea. Through this 1896 ruling, the Supreme Court recognized the concepts of the prior appropriation doctrine that Territorial Engineer Elwood Mead had been advocating throughout his early tenure in the days leading to statehood and the constitutional conventions.
As Engineer for the Territory of Wyoming, and later its first State Engineer, Mead understood that water, in an arid region, must be administered in a predictable and equitable fashion, and the methods he was fostering were to allow the earlier developer of water to establish the senior right for its continued use. The Wyoming State Constitution, in Article VIII, adopted this priority system of appropriation and established the position of State Engineer. Through the efforts of Mead, the Constitution also embodied the basis of appropriating water on the concept of "beneficial use" to avoid the potential for greatly exaggerated amounts of water being tied up needlessly by early settlers and developers of water diversion systems. Mead was also at the forefront of affirming a strong and active state role, as an independent, responsive and unbiased decision-maker, in all aspects of appropriating and administrating the waters of the state. In this light, Mead was also the architect of the process for resolving of water disputes. Rather than use a water court system as in the neighboring state of Colorado, Wyoming established the State Board of Control within its Constitution. In addition to its independent authority to review matters initially decided by the State Engineer, the Board of Control is the adjudicator of all water rights and the decision-maker of all requests for changes to water rights. The Constitution declares all water in the state to be the property of the state, subject to appropriation for beneficial use through the administrative permitting of water rights. Water rights are considered property rights that attach to the land or place of use. Yet, the law provides that the owner of these rights may change the location of use, or the type of use, by seeking approval of a change or modification to the water right from the Board of Control. The final decisions of the Board of Control are subject to judicial review. The Board of Control is made up of the State Engineer and the four Water Division Superintendents.
Within this constitutional framework, the detailed statutory authority, procedures, and administration were further defined by legislation and periodic Court decisions. The State Engineer's role is defined in Title 9, Chapter 1, Article 9, along with the general authority to establish fees for certain services and some other minor activities of the agency. The majority of Wyoming's water laws are now codified primarily in Title 41 of Wyoming Statutes, entitled "Water".
Under this title, there are fourteen chapters that now include the authority and activities of the Water Development Commission and the laws associated with irrigation, drainage, watershed improvement, and water and sewer districts. Several chapters also address interstate compacts, described elsewhere in this basin plan, and the use of watercraft. Chapters 3 and 4 contain the important laws relating to the appropriation, administration and adjudication of water rights in Wyoming. These statutes provide the detailed authorities and procedures for the State Engineer and Board of Control as they relate to their respective responsibilities for the general supervision of the waters of the state, whether they be from surface streams, springs, natural lakes or underground waters.
The key elements of Wyoming's water laws were established in the Constitution and the early statutory laws before and near the turn of the century. From time to time, the legislature has judiciously and periodically modified this longstanding body of law to address emerging new issues of the water users in the state. The laws addressing reservoirs were passed in the early 1900's; laws specific to ground water sources were introduced in the 1940's and 1950's, with the last significant change adopted in 1969. Recently, laws addressing instream flow water rights were codified in 1986. The basic framework of water right permitting actions and administration has remained the same, all the while allowing for flexibility in answering the needs of water users and subject to selective statutory changes that address emerging concerns regarding the beneficial use of water. That is why this set of laws is a part of the principles upon which the Snake/Salt River Basin Plan is based.
E. INTERSTATE COMPACTS
Wyoming is a headwater state; its mountain ranges are often the highest elevation source of water for many of the most significant rivers in the western United States. Wyoming straddles a portion of the continental divide and is a primary contributing source of water to the Colorado River (via the Green, Henry’s Fork and Little Snake Rivers), the Missouri River (via the Clarks Fork, Big Horn/Wind, Powder, Tongue, Belle Fourche, Cheyenne, Niobrara, North Platte, South Platte and Laramie Rivers), Great Salt Lake Basin (vis the Bear River) and the Columbia River (via the Snake and Salt River); the basins of interest in this river basin plan. As such, the waters originating in Wyoming are shared by water users in many surrounding downstream states.
As a result of more rapid development and population growth in downstream states, an upstream state is critically interested in protecting its long-term right and ability to develop the waters of a shared interstate river, for the future. Soon after the turn of the century, upstream states were concerned that the "first in time, first in right" doctrine, uniformly adopted for intrastate distribution of water, would be applied across state lines to the detriment of "junior" or later developing upstream water uses. To address these concerns and circumstances, legal processes were established over the past ninety years to provide for the orderly allocation and protection of the use, rights and privileges of the waters of streams and rivers that flow across state lines.
There are two basic ways the rights and allocations of water sources shared between states are established. The first is a result of litigation between states that is resolved by a decree of the Courts of the United States that equitably apportions the shared water resources between the states. The second way is established cooperatively through an interstate compact, which is an agreement between the participating states, with the consent of Congress, dividing the waters of an interstate stream. Wyoming has many such arrangements for the interstate rivers and streams leaving our borders, including the Snake and Salt River basins. The rights of Wyoming and Idaho to the waters of Teton Creek and South Leigh Creek, on the west side of the Teton Mountain Range, have been settled by a decree of the District Court of the United States for the District of Wyoming, and the rights to the waters of the Snake and Salt River watersheds are included in the Snake River Compact. Both of these important documents are discussed herein.
The primary purpose of an interstate compact or a decree of the Court is the equitable division or apportionment of stream flow among participating states. These legal protections provide the long-term certainty of access to the available water resources for the slower developing state and the security for the downstream state that all of the upstream resources will not be depleted. Often, the basis for the division is the amount of historic and potential future use of water in the river basin of interest, but of course, there is no hard rule to follow in a negotiated agreement. An integral part of these documents or decisions is also the method of measurement or accounting of the agreed allocations of water. Often, this is an amount of consumptive use for a variety of beneficial purposes or a percentage of available water supply at a designated point of measurement.
The Snake River Compact:
Congress, by the Act of June 3, 1948, provided their consent to Wyoming and Idaho negotiating a compact over the waters of the Snake River. The Snake River Compact, negotiated by the representatives of both states with participation of a representative of the United States, was signed on October 10, 1949. The compact divided the waters of the Snake and Salt River watersheds between the states of Idaho and Wyoming. This agreement was subsequently ratified by the State of Idaho on February 11, 1950, by the State of Wyoming on February 20, 1950 and by an act of Congress on March 21, 1950.
The compact recognizes, without restriction, all existing water rights in Wyoming and Idaho established prior to July 1, 1949. It permits Wyoming unlimited use of water for domestic and stock watering purposes, providing stock water reservoirs shall not exceed 20 acre-feet in capacity. The compact allocates to Wyoming, for all future uses, the right to divert or store 4% of the Wyoming-Idaho state line flow of the Snake River. Idaho is entitled to the remaining 96% of the flow. The use of water is limited to diversions or storage within the Snake River drainage basin unless both states agree otherwise. The compact also provides preference for domestic, stock and irrigation use of the water over storage for the generation of power.
The historical perspective of this seemingly "un-equitable" division of water, was the fact that the majority of the existing and potential future use of water was in Idaho. In 1949, the lack of arable land for irrigation and the high percentage of federal land (national parks, national forests and wildlife reserves) in the Wyoming portion of the basin, were factors in the negotiations. As documented in this planning report, Wyoming's demands for water have, even after 50 years, been well within the allocations provided the state under the compact.
One unique aspect of the Snake River Compact, compared to other compacts to which Wyoming is a party, is a requirement that calls for Wyoming to provide Idaho replacement storage for one-third of any usage after the first 2% is put to beneficial use. Early estimates of these replacement storage quantities, based upon the average state line flow, are 33,000 acre-feet. A valuable technical result, provided in Chapter III of this planning report, is the update of Wyoming's current use of water in the basin. This will provide the state and water users with an important component of information for future development and project planning.
The Roxanna Decree:
The Roxanna Decree is a shorthand name for a United States District Court decision resolving an interstate dispute between water users in Wyoming and Idaho diverting from Teton Creek and South Leigh Creek. The District Court for the District of Wyoming docket Equity No. 2447, Roxanna Canal Co., a Corporation, et al. v. Daniels, et al. entered its decision and decree on February 4, 1941. This decree adopted a stipulation of agreement entered into by the water user parties to the case located within Wyoming and Idaho, dated March 20, 1940.
The stipulation generally sets forth that Wyoming water users shall be unlimited in their diversions from Teton Creek and its tributaries until the measured flow of the creek diminishes to 170 cubic feet per second (cfs). After that, the Wyoming water users are limited to a diversion of 1 cfs for each 50 acres of irrigated land. When the flow further reduces to 90 cfs, the flow of Teton Creek and its tributaries is divided equally between the Wyoming and Idaho water users.
For South Leigh Creek, the stipulation generally provides the appropriators in Wyoming the unlimited diversion of water from South Leigh Creek until the natural flow of the creek diminishes to a total of 16 cfs, after which time the Wyoming water users are permitted to divert one-half of the streamflow and Idaho water users can divert the balance.
The decree provides for the installation and use of proper measuring devices in canals and along the stream as needed for the administration of the decree by the Wyoming and Idaho water officials in each state. The stipulation and decree also specify certain details for the handling of several named irrigation canals and other local implementation matters.
F. PALISADES RESERVOIR CONTRACT
While the initial Congressional authorization for the Bureau of Reclamation (Bureau) projects in the Snake River basin was provided in 1904, the series of reservoir and irrigation canal projects developed over a number of years. In response to the drought of the 1930's additional pressure for reservoir development occurred. After the requisite planning and technical analyses and enactment of the negotiated 1949 Snake River Compact by Congress, on March 21, 1950 the Bureau received specific Congressional authorization for the Palisades Dam and Reservoir project on September 30, 1950. In 1951 the Bureau began construction of the Palisades Reservoir project, which was completed in 1957. During the early planning and development efforts the Bureau administratively reserved a portion of the storage space in Palisades Reservoir as a source of the replacement storage space for Wyoming's obligations, pursuant to the Compact.
As a partial result of the dry sequence of streamflow years beginning in 1988, and continuing through to 1990, the State of Wyoming became more actively involved in the operations of the set of reservoirs in the Upper Snake River basin, including Jackson Lake and Palisades. These facilities and others are owned and managed by the Bureau in close cooperation with the Idaho water right administration officials, the Water District No. 1 Watermaster. Initially, pressure from the fishery and recreation interests in Teton County focused important attention on the Bureau's reservoir operations under these low streamflow conditions and the dramatic impacts upon the river resources and the valuable tourism and recreation segments of the local economy. One realization resulting from detailed river operation inquiries was the fact that neither the State of Wyoming nor our water users had a firm stake in any portion of the extensive storage water supplies that dominate the basin. Indeed 100% of the storage water in Jackson Lake and Palisades Reservoir was controlled by the Bureau and under contract with water users in Idaho. During normal or average year streamflow conditions this arrangement had been satisfactory, however when the river system is stressed by drought, many Wyoming residents felt their interests were discounted and not considered an important factor in planning and influencing Bureau reservoir operation decisions.
For Wyoming, several important results were derived from the increased attention by the State through the State Engineer's Office and Wyoming Game and Fish Department. These were 1) the re-discovery of the storage space set aside by the Bureau in Palisades Reservoir and 2) a change in procedures by the Bureau to actively consult with and involve the State agencies, local environmental, fishing and recreation interest groups and the public at large in the annual reservoir and river operation planning for the upper Snake River basin. These changes took place over several years, but were prompted by the State of Wyoming deciding to engage in the successful negotiation of a contract with the Bureau for the "reserved storage space" in Palisades Reservoir. At that point, the State became a "spaceholder" and a more direct player in the reservoir and river operations like other downstream water users in this river system.
As a result of evaluation and involvement with the reservoir and river operations, use of storage space set aside by the Bureau soon became the State's primary opportunity for addressing several important issues in the Snake/Salt River basin. First, the quantity of storage space "reserved" by the Bureau was the amount estimated to be required to meet Wyoming's compact replacement storage space obligations. By securing the replacement storage space Wyoming would assure its long-term ability to continue to develop and beneficially use the waters allocated from this river basin. Secondly, by holding a contract for storage space in the Bureau reservoir system, through an exchange of storage water between Palisades and Jackson Lake reservoirs, the state could also provide water or protection for the minimum river flow regime below Jackson Lake Dam and for the maintenance of higher levels in Jackson Lake during periods of drought.
To accomplish these dual benefits, the State initiated the negotiation and contracting process with the Bureau to obtain control over the "set aside" storage space in 1988 and eliminate any other potential water user from obtaining this water resource. On July 13, 1989 the Commissioner of the Bureau of Reclamation approved the "basis of negotiation", an internal Bureau document authorizing the regional representatives to move forward with the detailed negotiations. The Bureau entered the final contract, through then Regional Director John Keys (now the Commissioner of the Bureau) with Governor Mike Sullivan on behalf of the State of Wyoming effective October 31, 1990.
In summary, the contract provides Wyoming with 33,000 acre-feet (AF) or 2.75% of the 1,200,000 AF of active storage space in Palisades Reservoir. Wyoming is entitled to the water accruing to this space in priority for a variety of purposes, including the compact replacement storage space obligations, subcontracting the use of storage water to others and to maintain instream flows and lake levels within Wyoming, through an exchange. Wyoming is contractually treated for the most part like any other storage spaceholders in Palisades Reservoir under contract with the Bureau, with the same general rights and obligations for the use, accounting, and administration of the storage space.
Under the spaceholders contract Wyoming agreed to pay a proportion of the Bureau's (federal) construction costs allocated to irrigation and a corresponding share of the interest during construction for the 33,000 AF (2.75%) of Palisades Reservoir storage space. This amount totaled $567,270, which was appropriated from the water development fund by the Wyoming legislature during the 1991 session. In addition, Wyoming will annually pay a proportion (2.75%) of the operation and maintenance (O&M) costs associated with Palisades Reservoir. A capital account called a "sinking fund" was established within the State Treasurer's accounts, which is administered by the Wyoming Water Development Commission (WWDC), with a deposit of funds from the Wyoming Game and Fish Department. The interest accruing to this fund is used by the WWDC to annually pay the O&M obligations to the Bureau.
The amount of replacement storage space is determined based upon the provisions of Article III A of the Snake River Compact. Under the Compact, 4% of the waters of the Snake River basin (including the Greys and Salt Rivers) are allocated to Wyoming for direct diversion or storage. The first half or 2% of the compact allocation can be diverted or stored without any storage space replacement requirement. Wyoming shall provide replacement storage space equal to one-third of any additional use under the second half of the 4% allotment. It is estimated that Wyoming's 4% share at the Wyoming-Idaho border is approximately 200,000 AF (5,000,000 AF X 4%). One-half is approximately 100,000 AF and one-third of this amount is 33,000 AF of storage space. This was the amount "set aside" by the Bureau and, in 1990 placed under contract with Wyoming.
The estimate of current use within Wyoming outlined in this plan indicates that Wyoming is using less than the first 2% and as such, at this time the state has no compact requirement for this storage space. As growth and the demand for water increases in the basin under the terms of the Snake River Compact, this storage space will be incrementally used to meet the compact obligations to the State of Idaho. Since the potential for developing new replacement storage in the Snake River basin is limited, it was uniquely beneficial for the State to contract for the 33,000 AF of existing space available in Palisades Reservoir. Until the need for replacement storage arrives Wyoming can use the storage space for other authorized and beneficial purposes. As mentioned previously, to protect the important instream values of the Snake River between Jackson Lake and Palisades Reservoirs and the reservoir level at Jackson Lake, Wyoming's contract provides the opportunity to exchange the purchased Palisades storage for an equal amount of storage water in Jackson Lake under contract to others. Since all of the space and water contracts in Jackson Lake are held by irrigation users in Idaho, the opportunity to exchange (make an accounting trade) the storage water held by Wyoming for an equal amount held by downstream Idaho irrigation districts exists. Operationally, it makes no difference to the Idaho irrigators where the irrigation water is derived, as long as they receive their proper contractual amount. Under this alternative, at Wyoming's discretion and based on water availability, Wyoming has the option to exchange the Palisades water upstream to Jackson Lake, and use the Wyoming water to help maintain higher lake levels or to release the water to satisfy the instream flow needs along the Snake River during low streamflow periods. These Wyoming releases would supplement the minimum releases provided by the Bureau. These low streamflow circumstances generally occur during the non-irrigation season.
Figure I-1: Basin Planning Area
Figure I-2: Average Annual Precipitation
II. BASIN WATER USE PROFILE
A. AGRICULTURAL WATER USE
Agricultural water uses consume more water than any other use in the Snake/Salt River basin. Agricultural uses mainly consist of irrigation of crops by either flood or sprinkler irrigation. The vast majority of irrigation water is diverted from surface water sources, although there are small areas served by groundwater sources.
History of Agriculture in the Basin:
The first homestead was built in Jackson Hole in 1884, and by 1900 the cattle industry dominated the area. Settlement in the Star Valley area began in the late 1870's and 1880's, with many of the early settlers interested in raising beef cattle. Prior to that time, the area had been used as summer range for cattle from the Bear Lake area. The first approved water right in the Star Valley area was on Spring Creek, a tributary of Crow Creek, in 1885. Rights were filed on for many of the tributaries in Star Valley soon afterward. The rise of the dairy industry soon followed, and the first creamery in Star Valley was established in 1900.
Flood irrigation was initially utilized for forage production for farm animals. Initially, water was generally diverted out of the smaller tributaries, as opposed to the main stems of rivers. This was due to the varied locations of the tributaries, as well as the difficulty associated with diverting from a large river.
Irrigated cropland developed more rapidly downstream in Idaho than it did in the Snake/Salt River basin, mainly due to the longer growing season. As a result, conflicts on water use arose between irrigators in the two states. These conflicts resulted in the Roxanna Decree in 1941, which governs the use of Teton Creek and South Leigh Creek on the west side of the Teton Range. Soon afterward in 1950 the Snake River Compact was agreed upon by the two states as well as by federal agencies.
Grand Teton National Park was initially created in 1929, consisting of approximately 100,000 acres. The Park was later enlarged to over 300,000 acres in 1950. While provisions were made to accommodate existing private homesteads located within the Park, much of the land located within the Park that had been irrigated in the past is no longer irrigated or used for agricultural purposes. Also, with the relative lack of land under private ownership in the Jackson Hole area, there is great pressure to convert agricultural lands to residential use. Gravity flow sprinkler systems were established in many areas of Star Valley in the 1960's and 1970's, which increased irrigation application efficiency. This increase in efficiency resulted in an increase in the productivity of the farmland. Several hundred dairy farms were in operation in Star Valley up until the early 1980's, when market prices and new regulations prompted many to sell their cows and leave the business. Presently less than 50 dairies are still in operation, however they tend to have larger herds than the dairies of the past.
Agricultural Water Use Methodology:
While attempting to quantify the use of water for agricultural uses in the Snake/Salt River basin, it was discovered that there are very few diversion records available that quantify the amount of water diverted. Records obtained from the Board of Control as well as various irrigation districts and companies generally consist of spot records on a specific ditch, with sometimes only one spot reading being made in a particular year. Many diversions do not have any records as to the diverted flow. This situation is mainly due to the method of regulation currently used in the basin. Generally, irrigators do not call upon the State to regulate the flow of water in irrigation diversions. In locations where water becomes scarce later in the season (generally the tributaries), canal companies or irrigation districts have been formed in order to run the irrigation facilities more efficiently. These companies or districts regulate the flow of water to the irrigators on the system, and commonly distribute the water equally among all irrigators regardless of priority. In some cases, the irrigation district or company is essentially the only irrigator on a particular tributary.
When regulation is required, flows are read and the water distributed by Water Division IV of the Board of Control. This is the source of the majority of flow records available. However, these readings are generally only made on an as-needed basis, thus the records on regulated streams are very often sparse. The major exception to this is on Teton Creek, which is a tributary to the Teton River. This creek is governed by the Roxanna Decree, and so water must be divided between users in Wyoming and Idaho as part of that ruling.
Irrigated Lands Mapping:
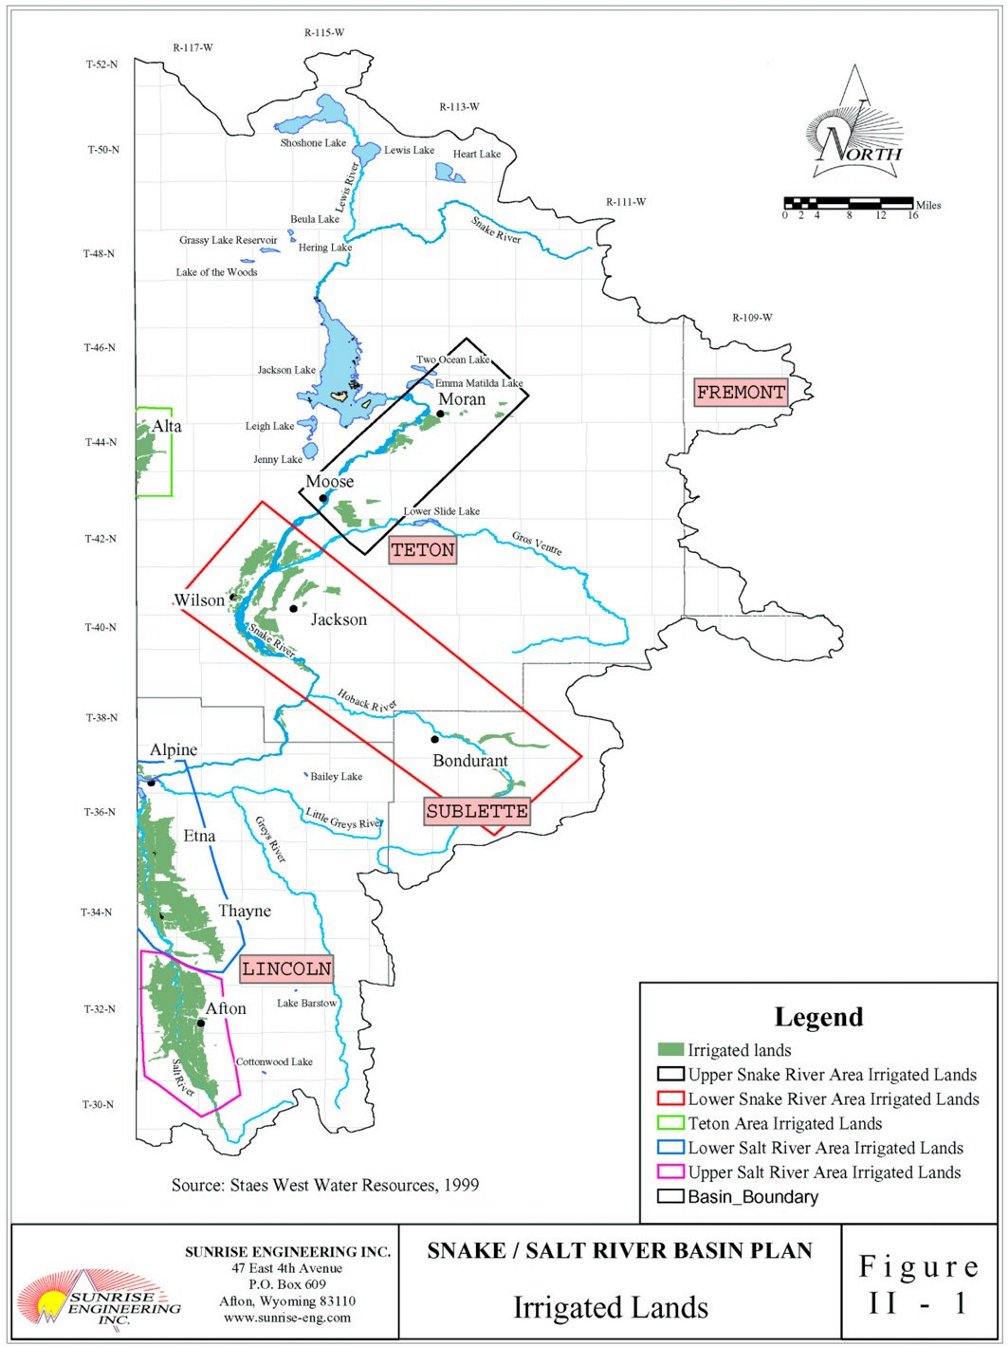
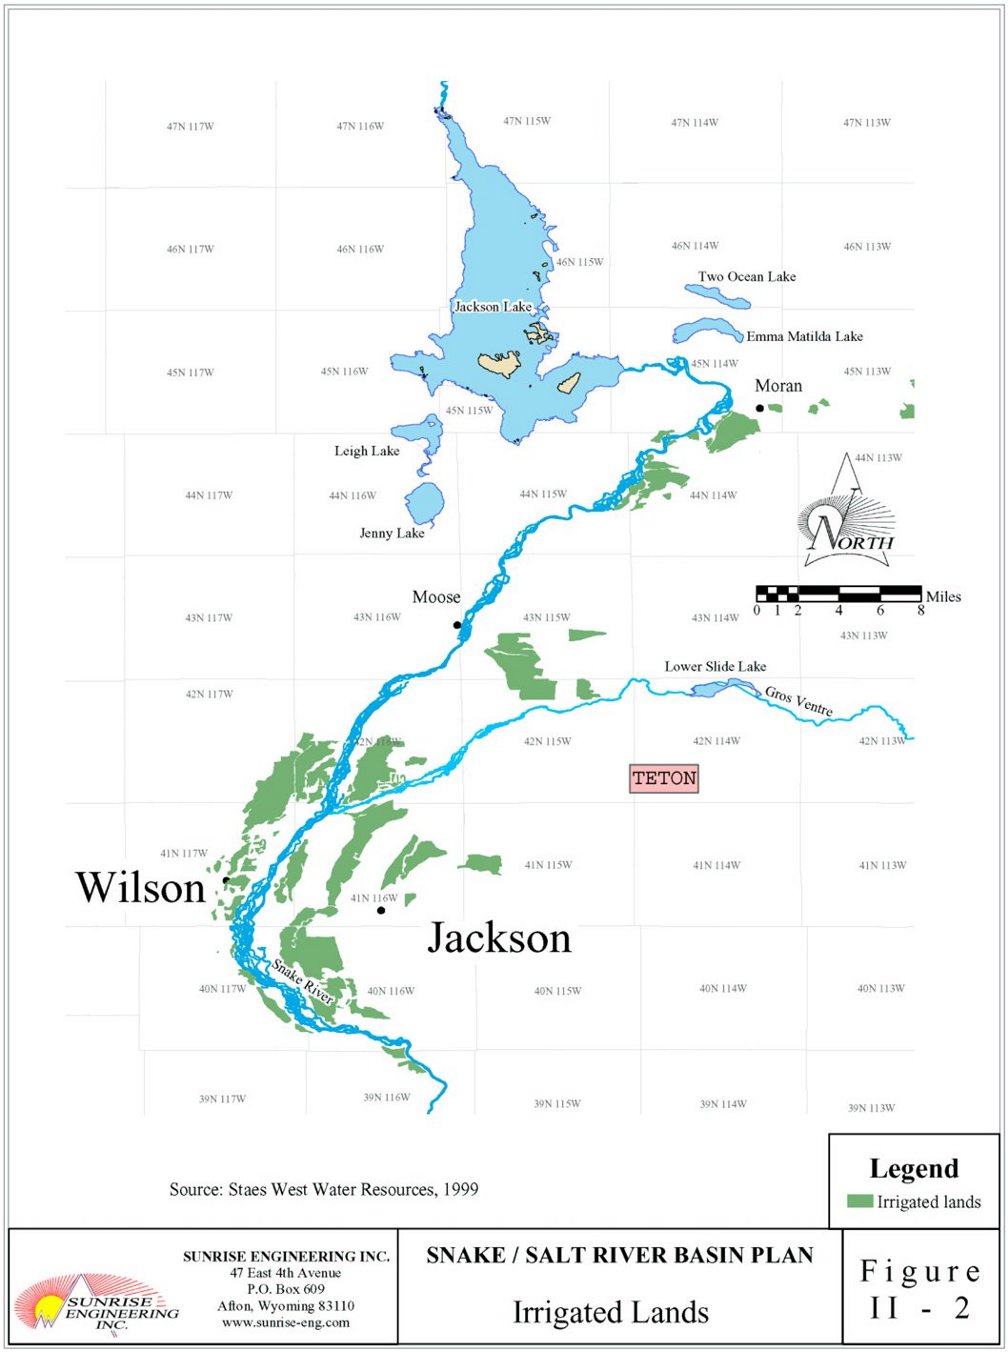
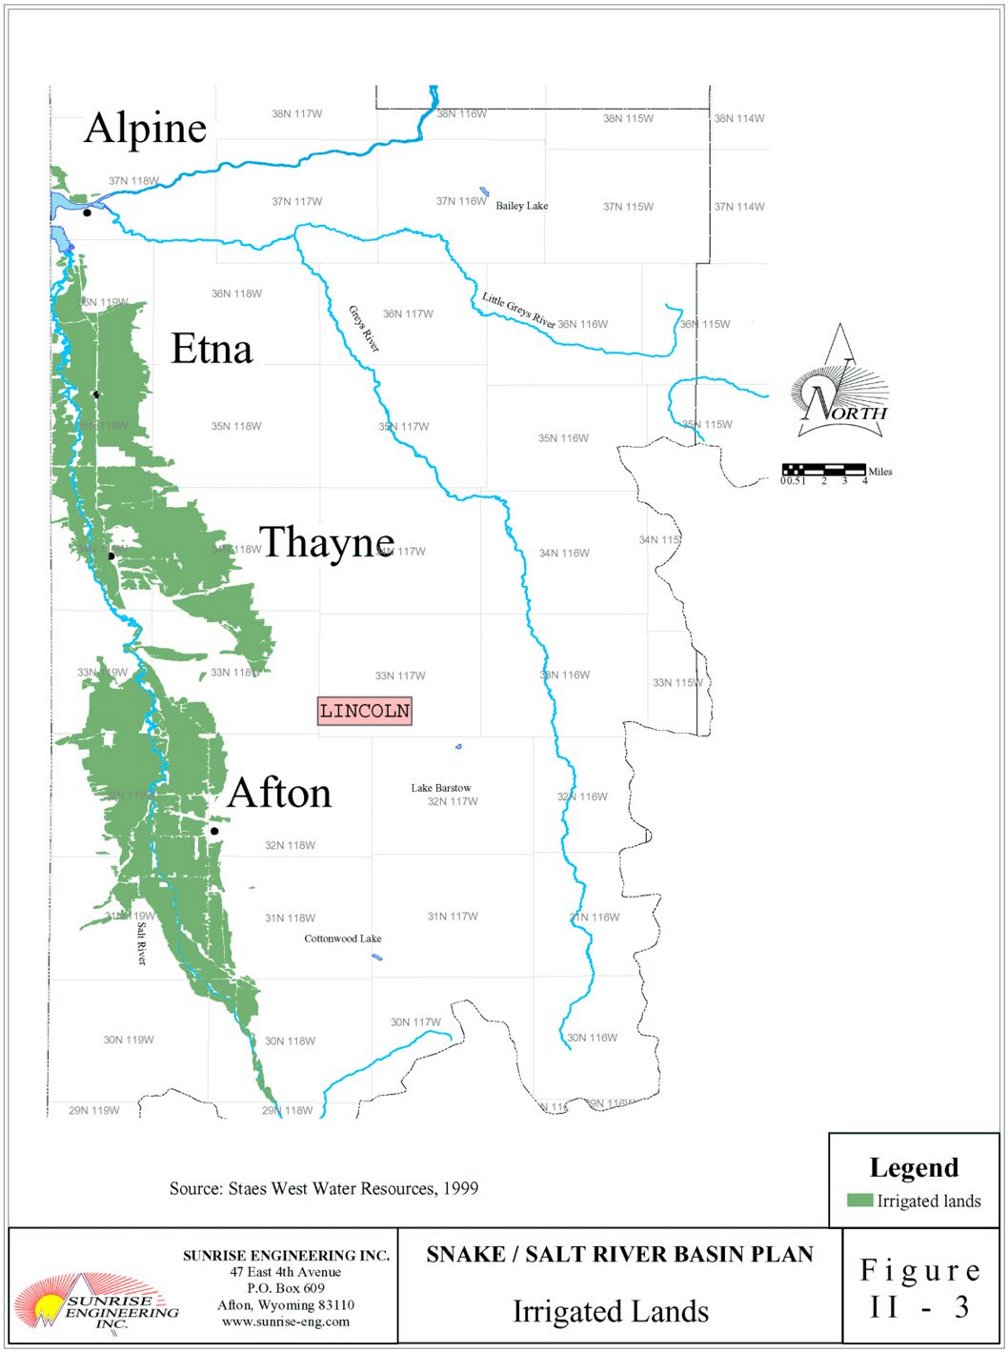
GIS mapping of irrigated lands as well as associated water rights and points of diversion has been completed as part of this study. The process started with irrigated lands mapping previously prepared by States West Water Resources Corporation for the WWDC. States West utilized aerial infra-red photos from 1982-3.
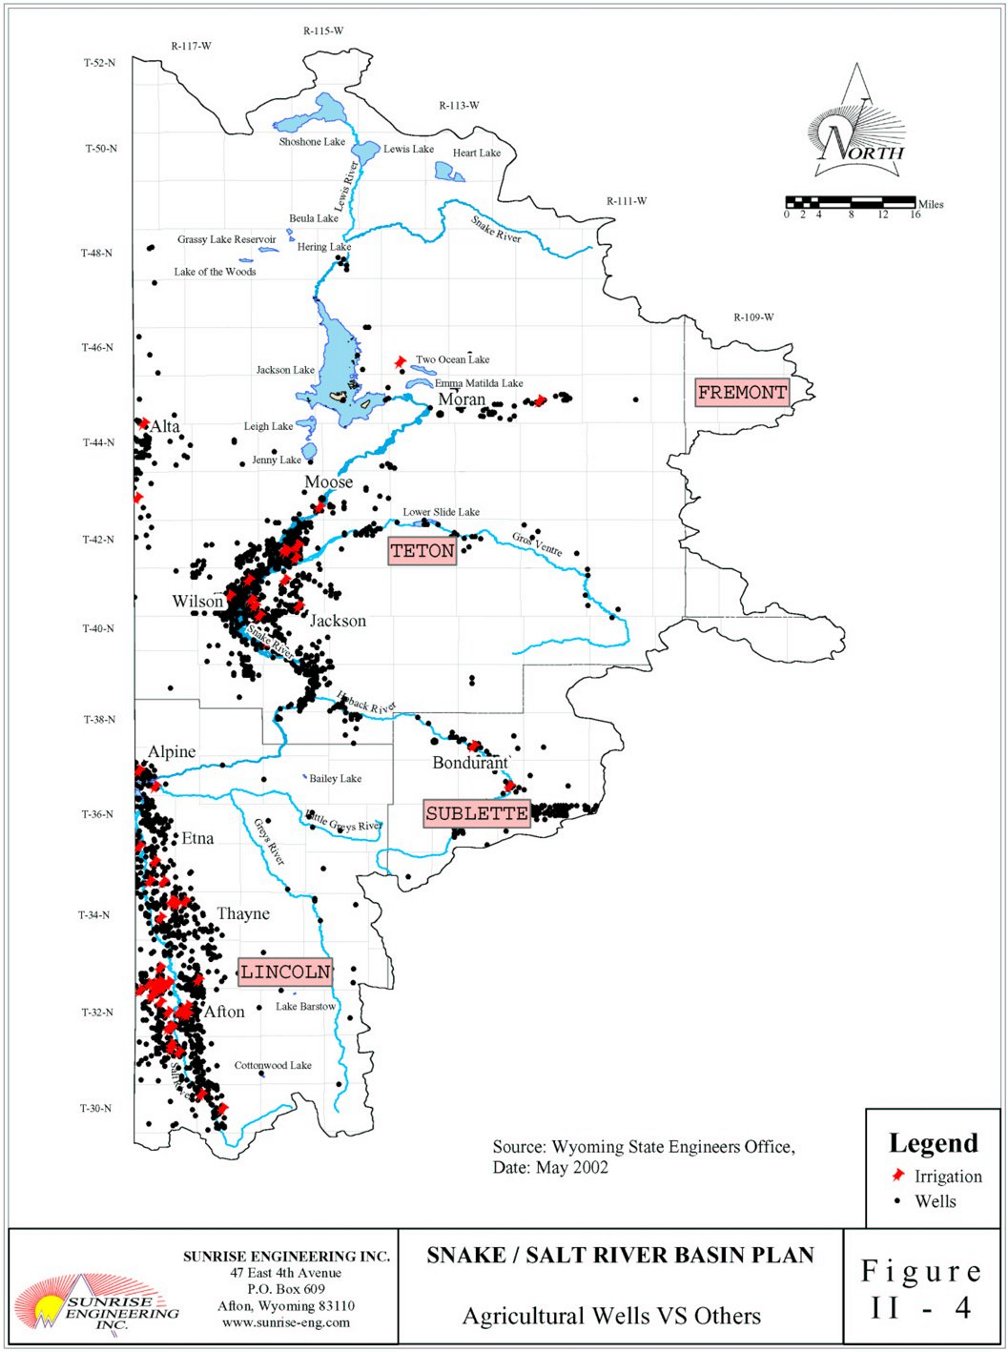
This mapping was overlaid on USGS topographic maps and plotted. Water rights attribution for each identified irrigated polygon was completed. The water right database fields include the permit number, source, ditch or well name, priority date, amount of appropriations (cfs-gpm), number of acres, type of supply (original, additional, supplemental, secondary), and status (adjudicated, unadjudicated, expired, and canceled). The water rights attached to each individual irrigated polygon were abstracted from the original records on file in the office of the Wyoming State Engineer and State Board of Control located in Cheyenne, Wyoming. The irrigated acreage within the Snake/Salt River basin as obtained from the GIS is shown in Table II-1. Irrigated acreage throughout the basin is also shown in Figures II-1 through II-3, and irrigation wells are shown in Figure II-4.
Table II-1. Irrigated Acreage By Sub-Basin
|
There has been very little use of stored water for irrigation in the basin. The large reservoirs that are located in the basin, such as Jackson Lake and Grassy Lake, serve farmland that is located downstream in Idaho. Palisades Reservoir, which is located partially in Wyoming, also serves Idaho irrigation interests. At this point, there are essentially no storage reservoirs used for irrigation of Wyoming lands located within the Snake/Salt River basin. Because of this fact, flow records from these reservoirs have no bearing on irrigation diversion flows in the basin.
Cropping Patterns in the Basin:
The types of crops grown in the Snake/Salt River basin are greatly influenced by climate. Typical farmland in the basin is located in the high mountain valleys where there is low to moderate precipitation. These valleys have relatively short growing seasons and long winters with significant accumulations of snow. Hard frosts have been observed in every month of the year. Because of these conditions typical crops consist of alfalfa, small grains (mainly barley with some oats), and native hay and grass. In addition to these crops, the portion of the study area that is in the Teton River sub-basin also produces a small amount of potatoes.
As part of the effort to model the surface water features in the basin, the consumptive irrigation requirement for the crops being raised was determined. This requirement for water by the plant varies by crop type as some plants require more water than others. Obtaining a distribution of the various crops in the basin allows for an estimate of the water used during specific conditions of irrigation.
Cropping Patterns Methodology:
Data regarding the types of crops grown in the basin were obtained from various sources such as the USDA Service Center, Wyoming Agricultural Statistics, and the Census of Agriculture. However, this data was difficult to use as it covered all of Lincoln County while the basin covers only the northern portion of the county. Also, agricultural activities tend to be under-reported in these types of reports as many farmers do not respond to surveys and questionnaires regarding their farm activities. The most extensive data was obtained through interviews with those involved with individual irrigation districts and canal companies. It is important to note that in some locations crops are rotated between alfalfa and small grains, and that the acreage of each crop will vary somewhat every season.
In order to estimate the distribution of crops grown in the Snake/Salt River basin, information was obtained from various ditch operators as well as from Water Division IV Hydrographers. These estimates are based on knowledge of the area and of the crops grown by various producers. Other sources of crop information such as crop records or detailed aerial photography were not available for analysis.
Cropping Pattern Conclusions:
In order to determine the crop distribution for the Snake/Salt River drainage, data for each of the major diversions were used. Generally, the determination of crop types as well as the acreage of each crop was obtained from those involved with each ditch, such as water masters, producers, and hydrographers. The assumption was made that the crop distribution in each sub-basin roughly followed the crop distribution of the major ditches combined. In addition to information regarding individual ditches, crop distributions were also estimated by sub-basin in some cases by those with local knowledge of the crops. The crop categories used in this distribution were similar to those used in other previous basin studies and consisted of alfalfa, small grains, pasture grass, and mountain meadow hay. The distinction between pasture grass and mountain meadow hay is essentially based on the method of irrigation as described in “Consumptive Use and Consumptive Irrigation Requirements in Wyoming” by Pochap, et al., 1992, with pasture being sprinkler irrigated and mountain meadow hay being flood irrigated. The resulting distribution of irrigated crops is shown in Table II-2. The determination of consumptive irrigation requirements used as part of the surface water modeling incorporated this crop distribution.
Table II-2. Crop Type Distribution by Sub-Basin
|
Alfalfa is the most extensive crop grown in the Salt River basin. Much of the alfalfa grown in Star Valley is used to feed local dairy and beef cattle. Small grains such as barley are also grown. There is also a significant amount of acreage used for native hay or pasture. The Snake River portion of the basin produces native hay almost exclusively. Nearly all of this crop is flood irrigated. The Teton River basin has a mix of crops, with alfalfa being the most predominant. Also, a significant amount of small grains are produced, as well as pasture. A small amount of potatoes are grown in the Teton basin.
Consumptive Use:
According to Pochop et al. 1992, Consumptive Use (CU) is the water use of a well-watered crop under optimum growing conditions, and is considered to be the maximum use of water by the specified crop with the given conditions. This consumptive use must be met either through precipitation or irrigation. Consumptive Irrigation Requirement (CIR) is the CU of a crop minus the precipitation. In other words, CIR is the irrigation water required to fulfill the consumptive use of a crop.
Data regarding CU and CIR for this basin study were obtained from the publication Consumptive Use and Consumptive Irrigation Requirements in Wyoming written by Pochop et al., 1992. Background data regarding this report were also collected from the author for use in this basin plan. Data associated with the various data sites within the basin were used. These sites included Afton, Bedford, Jackson, Moran, and Alta. Consumptive use data for alfalfa, grass hay, mountain meadow hay, and grains were collected at the various sites in the Snake/Salt River basin. Indicator gages were selected for the basin plan and used to determine which years to classify as average, wet, or dry for each climate station used for CU/CIR data. Once the years were classified as average, wet, or dry, the results from the CU/CIR study were used to create representative figures for each scenario at each climate station. There were adequate climate stations in the CU/CIR study to enable the various sub-basins in the study to utilize a climate station within its area. For example, Afton was used for the Upper Salt, Moran for Upper Snake, and so forth. The process of obtaining representative CIR information was completed for each crop type. The CIR results for each location, broken into wet, dry, and average years, were then applied to the sub-basin depending upon the distribution of crops grown in that area. The resulting CIR number was weighted based upon the percentage of each crop grown in the sub-basin. This weighted CIR number was used to determine the amount of water consumed by the crops in a particular sub-basin by applying the irrigation requirement over the period of days irrigated.
Irrigation Days:
Consumptive use of crops assumes well watered crops under optimum growing conditions. Field conditions rarely represent optimum growing conditions due to factors such as inefficient irrigation methods, climate, soil conditions, topography, and so forth. Due to this fact, much of the water diverted from the rivers and streams is not consumed by agricultural crops. However, much of this unconsumed water returns to the system through ground water augmentation and return flows. Thus, aside from losses through evaporation and so forth, this water can be used at a later time, and is not depleted from the system.
In order to quantify the water used for crop irrigation, the number of days in which crops are irrigated was determined for each sub-basin. Due to the lack of irrigation water use records in the basin, other methods were used to estimate how many days of each month in the growing season in which irrigation typically occurs. The main source of data for irrigation days was conversations with Water Division IV Hydrographer-Commissioners. Their input was vital in determining the irrigation days to be used for the average, wet, and dry scenarios.
By estimating the number of days in which irrigation is taking place in the basin, the effects of being short of water in a particular sub-basin are taken into account. Also, the period of time in which irrigation is stopped in order to harvest crops is included. For example, fields under flood irrigation must have the water shut off of the field for a number of days in order to let the ground dry up enough to allow harvest. However, areas under sprinkler irrigation experience very little down time, as many will have the sprinklers back on one side of the field before the harvest is completed on the other.
Agricultural Depletion Estimate:
Agricultural depletions consist of the water supplied by artificial means that is consumed by irrigated crops. This is water required by the plants beyond natural precipitation. The determination of agricultural depletions consisted of taking the weighted monthly CIR for each sub-basin, and multiplying that value by the number of irrigated acres. This monthly result was then adjusted based on the number of days irrigated for each month, resulting in the agricultural depletion. This was conducted for average, wet, and dry year scenarios. Agricultural depletion results are included in the surface water modeling portion of this basin plan.
B. MUNICIPAL WATER USE
The majority of the population in the basin is located in valleys along the Snake and Salt Rivers, although water used for municipal purposes comes from sources other than those rivers. The following towns, communities, subdivisions, and water systems are considered municipal systems for this study:
Incorporated municipalities with primary groundwater sources:
Other entities with primary groundwater sources:
The following community also obtains water from groundwater sources in Wyoming, however the town itself is located in Idaho:
There are no entities in the basin that obtain water from surface water sources.
Municipal & Domestic Water Use Methodology:
While investigating the use of water for municipal purposes, it was recognized that only four of the communities in the basin are incorporated municipalities. Many other systems serving various unincorporated communities or subdivisions also provide water for municipal type uses, and it was felt that these systems should also be included in the municipal portion of the basin water use profile. In order to have a consistent method of determining whether or not to include a particular system, it was decided that the EPA definition of a Community Public Water System should be used. According to the EPA website, "Public water systems provide water for human consumption through pipes or other constructed conveyances to at least 15 service connections or serves an average of at least 25 people for at least 60 days a year." Public water systems are further defined by EPA as Community, Non-Transient Non-Community, and Transient Non-Community. EPA states that a Community water system "supplies water to the same population year-round." A Non-Transient Non-Community system "supplies water to at least 25 of the same people at least six months per year, but not year-round. Some examples are schools, factories, office buildings, and hospitals which have their own water systems." A Transient Non-Community system "provides water in a place such as a gas station or campground where people do not remain for long periods of time." Using this method of classification ensured that municipal type uses were looked at collectively, while other uses such as schools, restaurants, and dude ranches were included in other portions of the basin water use profile, such as domestic use.
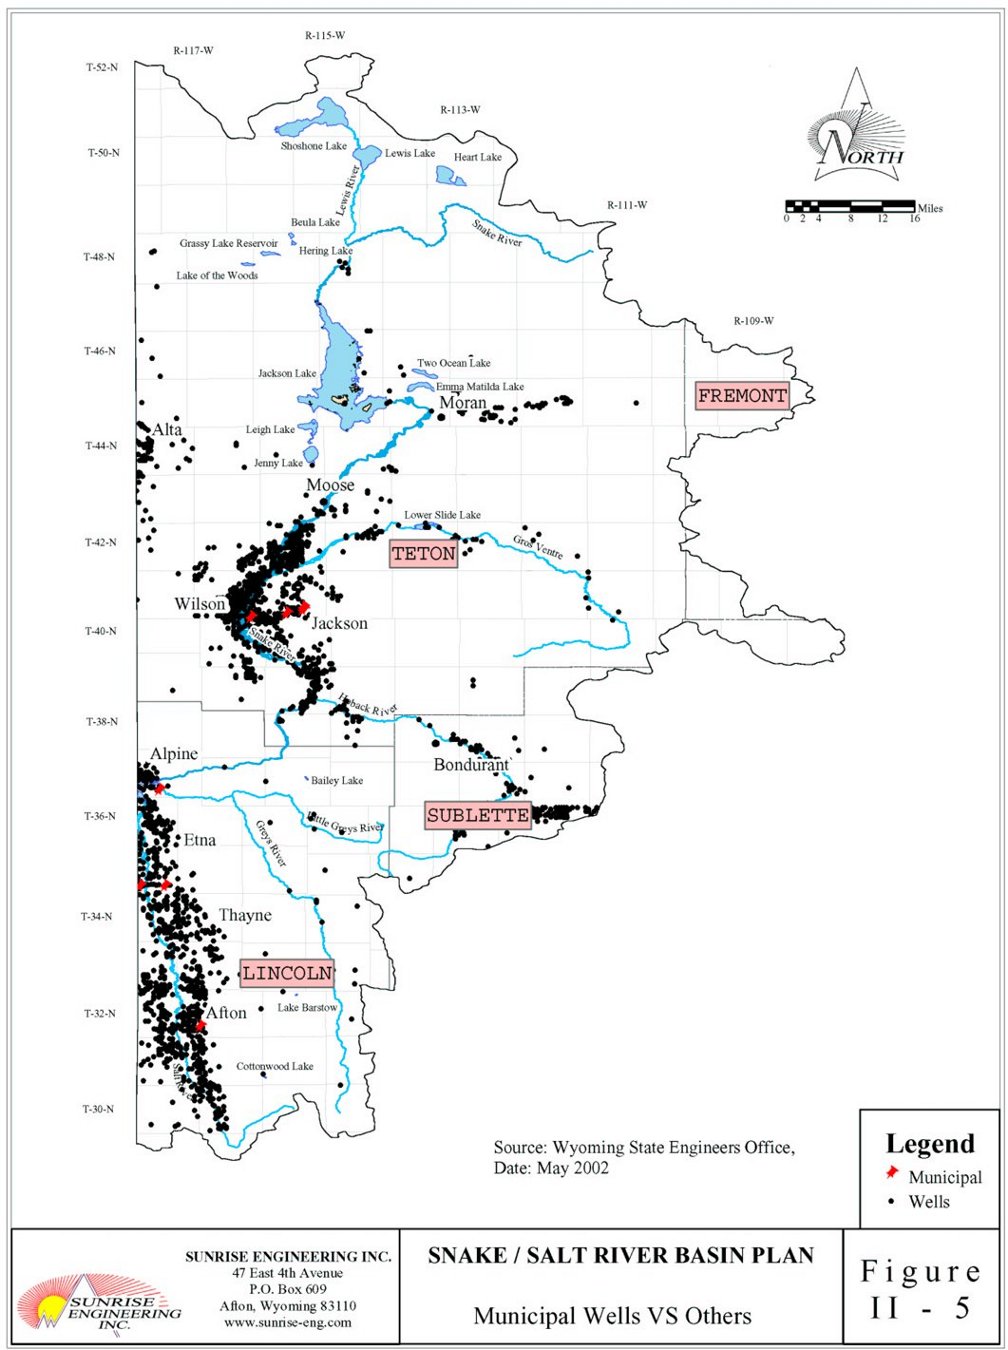
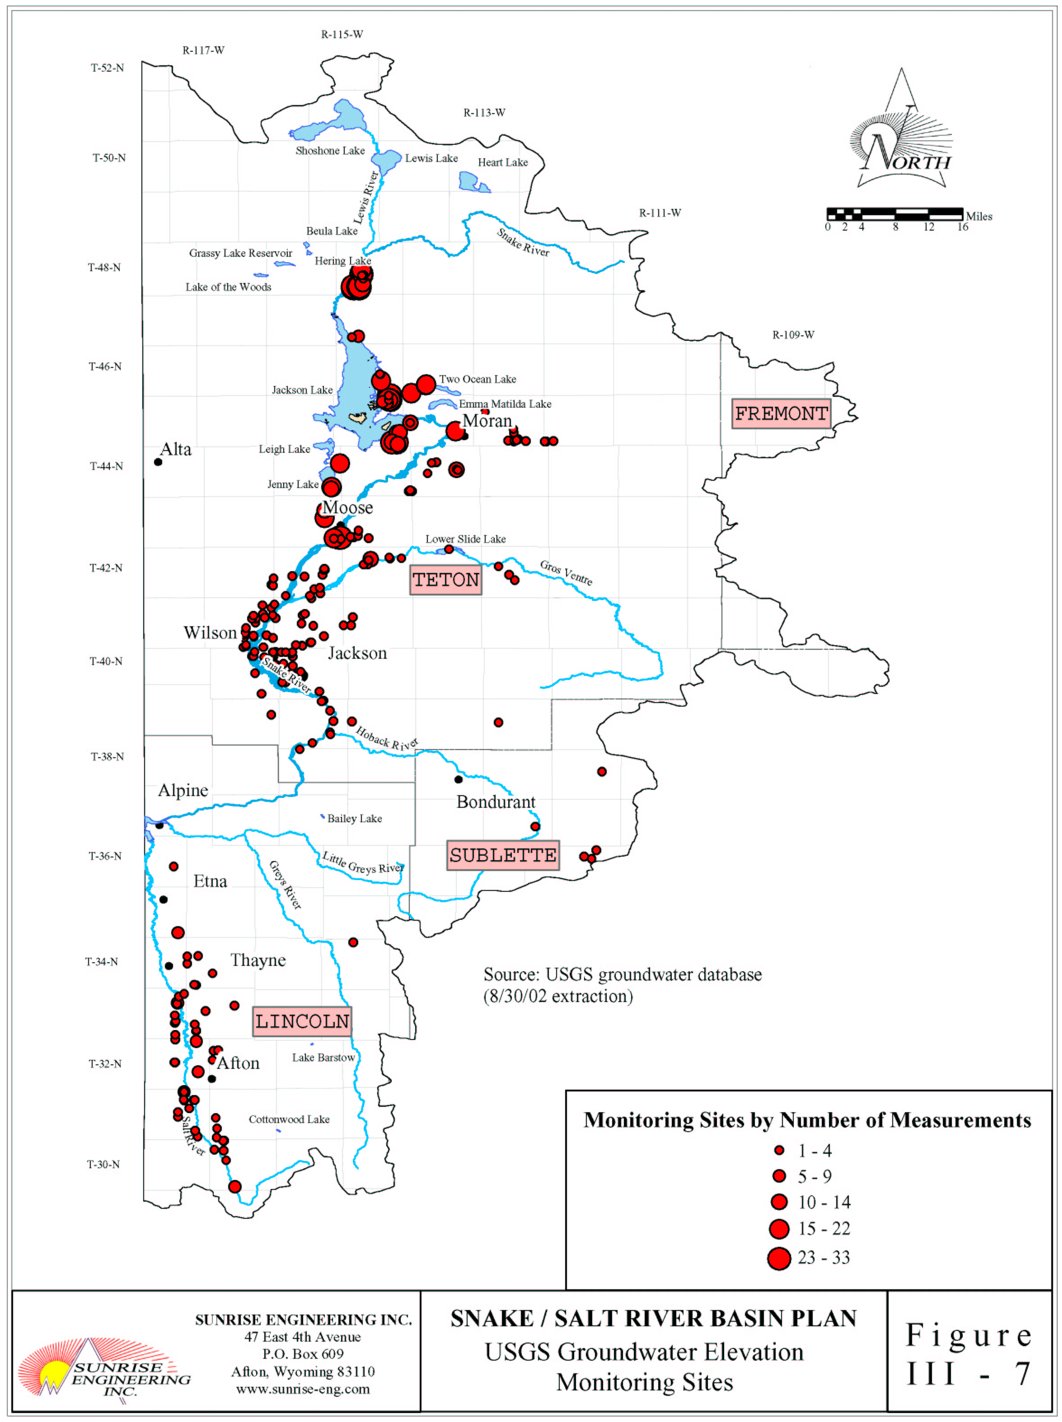
Information regarding municipal use of water in the basin was primarily obtained from the 2002 Water System Survey Report produced by the Wyoming Water Development Commission. Interviews were also held with representatives of some of the water systems to obtain additional information, such as water use records. If information was not available for a particular system in the 2002 Survey Report, the 2000 Survey Report was used, as well as EPA Sanitary Surveys of various dates. Past studies conducted on various water systems were also consulted for additional information. Municipal wells across the basin are shown in Figure II-5.
Many of the water systems in the basin utilize water from spring sources. Were it not for the municipal depletion, this water would enter a stream and flow through the surface water system. Thus, the municipal use in the basin in reality does have an impact on surface water, although water is not diverted from a surface source directly. However, upon further review of this situation, the amount diverted is not significant. For example, the average water use in Afton, which obtains a majority of its water from spring sources, is approximately 1.25 MGD. This corresponds to less than 2 cfs, which is considered minor when compared to other surface water diversions such as irrigation headgates. This is in light of the fact that Afton represents the largest spring source use in the basin, and many other spring users only divert a fraction of the above amount. Due to the fact that the depletion from a major municipal use equates to the depletion of a minor irrigation use, it was determined that the depletions from the various municipal and community systems due to spring sources would not be included in the surface water modeling effort.
Some wastewater treatment systems discharge water to a river or stream following collection and treatment of the wastewater to appropriate standards. A majority of the systems covered in this study utilize individual wastewater disposal systems, such as septic systems. The incorporated municipalities do have wastewater collection and treatment systems, however the majority do not necessitate discharge. Only two systems in the basin have flows that return directly to surface water following the treatment of wastewater. These flows represent a slight increase to the stream flow. Similar to the discussion regarding surface water depletions due to use of springs, the quantity of water discharged and returned to the surface water system is minor, and it was determined that these inflows would not be included in the surface water modeling.
C. DOMESTIC WATER USE
Domestic water use consists of the water necessary for the function of residences, subdivisions, ranches, commercial establishments, campgrounds, and so forth. Prior to determination of the domestic water use in the basin, a distinction between domestic and municipal water use had to be made. In essence, the use of water for domestic and municipal are the same, consisting of residential, commercial, and any other uses that can be served by a municipal water system. While the use is similar, the source of the water and method of supplying that water to the user are not. Municipal systems generally utilize large water supply sources, such as rivers, lakes, wells, and springs. On the other hand, domestic sources generally consist of a single well or spring that only has one service connection, or possibly a few connections.
The municipal section covered public community water systems, which is defined as a system that serves at least 15 connections or 25 people on a year round basis. Many connections, such as those that serve restaurants or schools, may serve more than this number, but are not considered community systems as they do not serve the same people year round. Non-community systems, as well as those that serve individual residences or businesses, are included as domestic uses.
In order to determine the extent of domestic use in other river basin plans in Wyoming, the population within a particular basin was obtained. The population served by municipal systems were then subtracted, resulting in the population served by rural systems. A daily water use per capita was then used to determine the water use for this population.
Population Estimates:
Nearly 26,000 people reside in just over 10,000 households within the Wyoming portions of the Snake and Salt River basins. Also, roughly 44 percent of the population of the basin lives within the incorporated boundaries of Jackson, Afton, Thayne, and Alpine. The remainder of the basin's population lives within unincorporated areas of Lincoln, Sublette, and Teton Counties. Table II-3 outlines a breakdown of the estimated population in the Snake/Salt River basin. It must be mentioned that this population data represents year-round residents according to census information.
Table II-3. Estimated Snake/Salt River Basin 2000 Population and
Related Political Jurisdictions
Location | Population | ||
| Lincoln/Sublette | Teton | Total | |
| Jackson | 0 | 8,647 | 8,647 |
| Afton | 1,818 | 0 | 1,818 |
| Alpine | 550 | 0 | 550 |
| Thayne | 341 | 0 | 341 |
| Municipal Subtotal | 2,709 | 8,647 | 11,356 |
| Unicorporated Areas | 6,623 | 7,970 | 14,593 |
| Basin Total | 9,332 | 16,617 | 25,949 |
Data regarding the populations served by various public community water systems was also collected as part of the study, and is summarized in Tables II-4 and II-5.
An interesting observation can be made by looking at the population estimates for Teton County. The number of residents served by public community water systems in the county is nearly equal to the estimated full-time population. However, there are a significant number of residences in the county that are not located within the Town of Jackson or the subdivisions served by the mentioned water systems. There is a missing component that is not accounted for in these numbers, and that component is the population that has second or vacation homes in the area. These people are not included in the full-time residence numbers, however they are included in the population served by the various water systems.
Table II-4. Snake Sub-Basin Municipal and Domestic Use Units
|
Due to the large number of seasonal residents, use of population figures to determine domestic use would have erroneous results. Some community systems include a significant number of second homes, while others consist of mainly full-time residents. The systems with a significant number of second homes are Jackson, Teton Village, and Aspens. Systems such as Rafter J and Melody Ranch have a small number of second homes. Approximately 30 percent of Teton County's housing inventory is seasonal homes. As a result, it is not possible to simply subtract the number of residents served by the above systems from the total population of the sub-basin to obtain the rural population.
Instead of using population to determine the domestic water use in the Snake River sub-basin, it was decided to use the number of households. This is possible since the census data has information regarding households in the sub-basin as well as the number that were vacant at the time of the census in April. The resulting numbers would generally represent the full time residents, as April is considered off-season in the area. By utilizing this information, it was possible to estimate the number of residences in the Snake River sub-basin that are not obtaining water from community systems. This way, the use of water can be calculated for both tourist season and off season. Also, data regarding commercial establishments not connected to community systems were collected. This covered uses for schools, food establishments, guest ranches, campgrounds, motels, and other uses. These uses were added to the rural residential uses to result in the domestic water use. From this data, approximately 2,980 residences obtain their water from small or individual systems, along with various commercial establishments.
Table II-5. Salt Sub-Basin Municipal and Domestic Use Population
|
While there are part-time residents in the Salt River sub-basin as well, their impact on water use is not as dramatic as that in the Snake River sub-basin. Many seasonal residents leave only during the winter months, although the time of their absence varies greatly. Some will leave from October to May, while others only leave for January and February. While the number of part-time residents in the Salt River sub-basin is unknown, it is believed that a majority of the seasonal residents that leave for the winter are located in the Star Valley Ranch area, including the Star Valley Ranch RV Park. The number of residents in both summer and winter are known for these areas, so it is possible to use population as a basis to determine domestic water use. As shown in Table II-5 approximately 7,564 of the 9,332 living in the Salt River sub-basin area are served by community systems. That leaves 1,768 people served by domestic use systems.
Domestic Water Use:
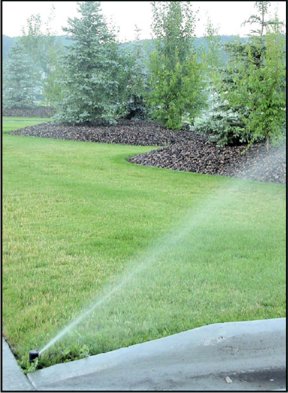
Water use in the unincorporated portions of the basin can be quite variable. For example, a residence may have a well that provides for indoor use. Additional uses may be lawn and landscape irrigation, which may be many times the indoor use. Some may run water for horses or cattle, which may be constantly running month after month. Faucets may run to prevent freezing during winter. The various uses means that the actual water use may be quite variable from person to person. Also, methods of billing can influence water use, as those billed by water use will likely use less than those with flat rates. Also, people obtaining their water from a well may be more conservative in their water use to reduce power costs compared to those served by a spring. As this is a basin wide study, a daily per capita use has been determined that will likely serve as an average for domestic users in the basin.
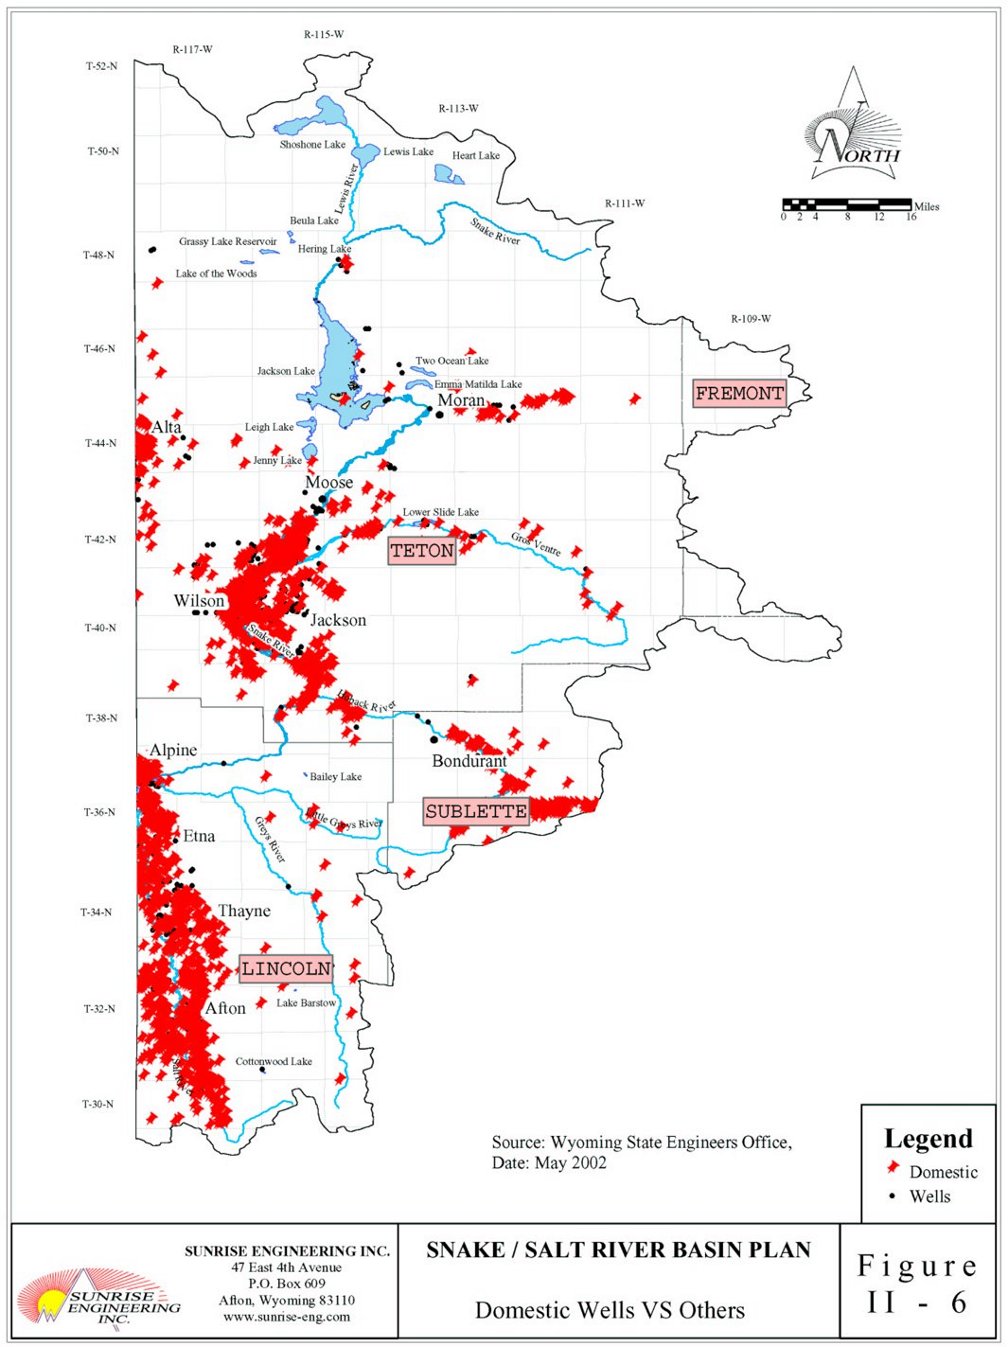
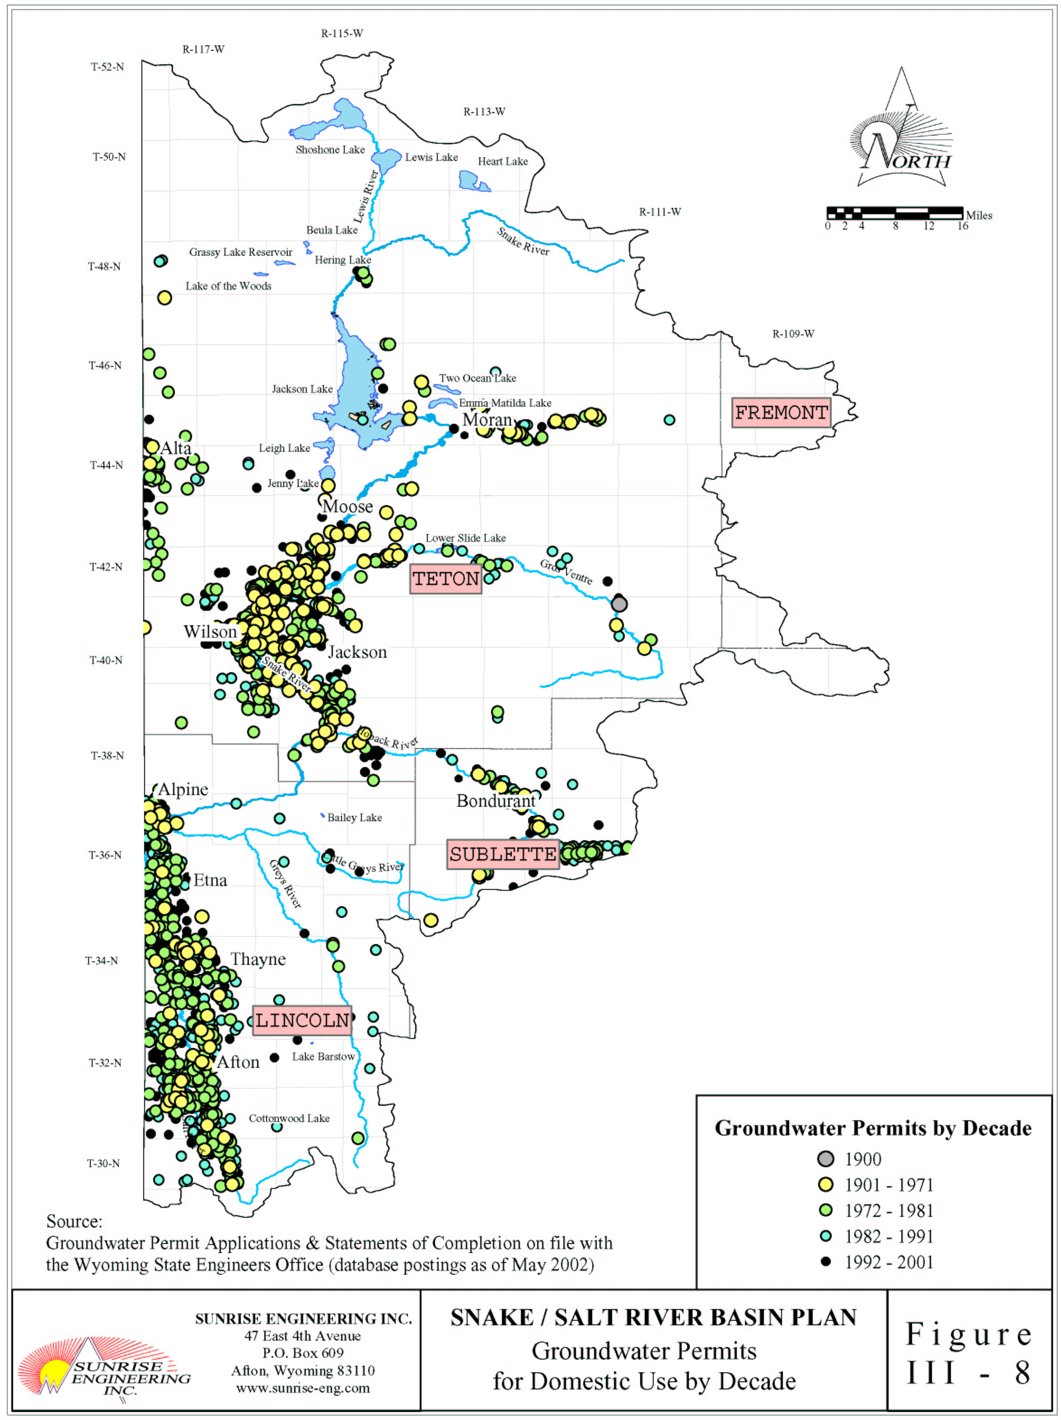
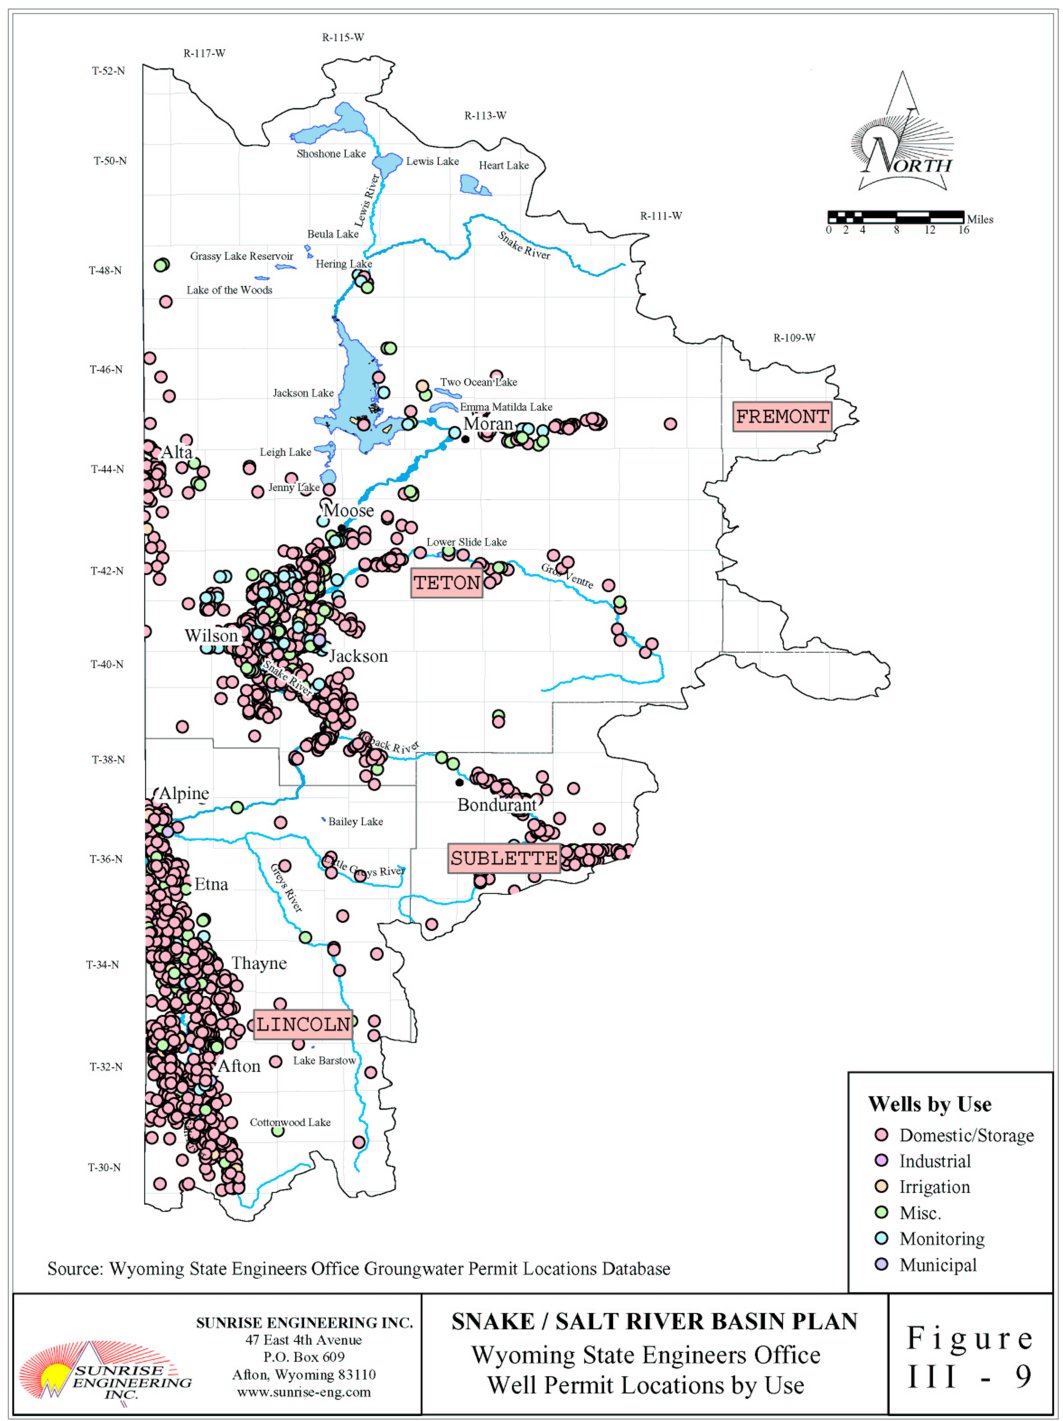
Domestic use water rights have been reviewed as part of this basin plan. Generally, domestic water is served by wells, which will be permitted for a particular flow rate in gallons per minute (GPM). In reality, this flow rate is the maximum that will be pumped at any given time, and is only realized when the pump is in use. The pump will sit idle the majority of the time, and will only kick on to serve water needs. Many systems will utilize a tank of some type to minimize the number of starts required for the pump, thus reducing wear and tear on the pump. For example, a pump for a residence may be permitted to run at 5 gpm, which could result in 7,200 gallons per day. However, a typical residence may only use 500 gallons per day. Thus, a compilation of water rights by permitted flow rate is not particularly meaningful. Domestic wells in the basin are shown in Figure II-6, and this data is available in the GIS coverage.
After reviewing the water use on the community systems in the basin, as well as various studies on water use in the basin, it was determined by the project team to use an average daily water use of 450 gallons per residence. This rate appears to be a good average when looking at the factors affecting use described previously. A summary of the average daily domestic water use in the basin is presented in Table II-6.
Table II-6. Average Daily Domestic Water Use by Sub-Basin
|
D. INDUSTRIAL WATER USE
Compared to other river basins in Wyoming, there is little industrial activity in the Snake/Salt River basin, and the facilities that are present use relatively little water. Some of the industries that are present have origins based in the dairy activity that has been part of the Salt River basin for over a century. The industries and their water sources are:
Food Processing
Mining
Industrial Surface Water Use:
Water for these industries is mainly supplied through or in conjunction with municipal water systems. While much of the water use for these municipalities and industries is covered by surface water rights, the water actually comes from springs that are considered ground water sources. Also, similar to the use of springs for municipal uses discussed previously, the quantity of water involved in industrial uses in the basin is quite small when compared to other surface water uses such as irrigation. Due to the negligible impact that industrial water use would have on the surface water modeling, these uses have not been included in the surface water modeling effort.
The Smoky Canyon Mine obtains much of its water from surface water runoff. This water is not diverted from a stream, but the runoff from the mine area is collected in a pond. The water rights associated with this are unknown, as the mining operation and tailings/collection pond is located in Idaho. Were this runoff not collected, it would eventually flow to Tyghee Creek, which is tributary to Stump Creek, which is tributary to Salt River. The surface water that is collected is used in the milling of the phosphate ore, and much is transported out of the Salt River basin in the phosphate ore slurry, which is piped west toward Pocatello, Idaho. While this is not out of the Snake River basin overall, the water used in the slurry does not travel to the Salt River. There are no interstate compacts on the streams that flow past the Idaho border into the Salt River drainage.
Industrial Groundwater Use:
The Northern Foods plant and the Water Star Bottling Company obtain their water directly from the Town of Afton municipal system, which is supplied by springs and wells. The main source for the Town of Afton is the Periodic Spring, which is tributary to Swift Creek. Northern Foods, whose facility was formerly a cheese processing plant, utilizes water as part of their processing of soy into various products. Water Star Bottling sells bottled water, with added flavors and without, under the Geyser Water label. (Note: At the time of this report, Water Star Bottling has ceased operations. It is believed that other water bottling activities will continue in the future.) The Star Valley Cheese Corporation obtains their water from the same spring source as the Town of Thayne, utilizing the same pipeline. Through an agreement between the two entities in 1948, the transmission pipeline was sized to accommodate both the town and the cheese factory. The Star Valley Cheese Corporation manufactures cheese products, mainly using milk from area dairy operations.
The Smoky Canyon Mine also uses a deep well to provide water for its operation. This well is located in Idaho, and is used to supplement the surface water that is used in the mining operation. As stated above in the Surface Water Use section, the groundwater from the well is used in the milling operation as well as the slurry.
According to the records of the State Engineer's Office, there are groundwater wells classified as industrial use in the Snake/Salt River basin. These wells are used for purposes such as concrete ready mix plants, and do not represent a significant use of water on an annual basis. Because of this, data on these industrial groundwater wells will not be included as part of this report.
The use of water for industrial purposes is very limited in the Snake/Salt River Basin. Typical industries from other parts of Wyoming such as coal mines, trona mines, and natural gas and oil wells are not found in the basin, and the communities in the basin are relatively small and do not have large industrial facilities. The facilities that do exist are generally related to food processing and production, with most of the use having its roots in the dairy industry. A summary of the industrial water use in the basin is presented in Table II-7, which compares the larger industrial uses.
Table II-7. Industrial Water Users Ground Water Sources
Hydropower Generation:
|
There are many places in the West where the energy of water is harnessed to produce electricity. However, there has been relatively little development of hydropower in the Snake/Salt River basin. Table II-8 lists the projects in the basin with Federal Energy Regulatory Commission (FERC) licenses.
Table II-8. Current Snake/Salt River Basin FERC Licensed Projects
|
Please note that the power generation facilities at Swift Creek and Salt River described above are currently not active. Also, in addition to these listed facilities within the basin, electricity is generated at Palisades Dam on the Snake River immediately downstream of Wyoming in Idaho.
E. RECREATIONAL WATER USE
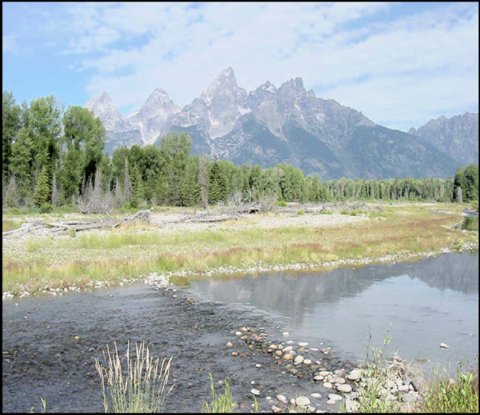
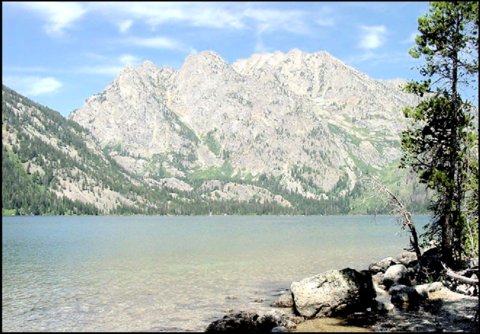
Recreation is generally considered a non-consumptive use of water. There is a significant amount of recreational activity within the Snake/Salt River basin. People travel from around the world in order to boat, fish, ski, camp, and hike in this part of Wyoming. Tourism has a major impact on the economies of the communities in the basin, with much of the tourism being linked to Grand Teton and Yellowstone National Parks. Many of the draws of these parks are water related, with the most notable water features within the basin being Jackson Lake and the Snake River. The Snake River is also a major draw throughout the Jackson Hole area as well as through the Snake River Canyon toward Alpine, sometimes referred to as the Grand Canyon of the Snake River. Thousands visit the river each year for rafting, kayaking, fishing, and other activities. In addition to the Snake River and Jackson Lake, there are numerous rivers, streams, and lakes throughout the basin that are used for recreation. Other activities that utilize or require water in some form include waterfowl hunting and winter sports such as skiing.
Grand Teton National Park:
Grand Teton National Park is the largest tourist destination located entirely within the basin. There are many water-based recreational activities that draw people to the park. The main focus of recreational water use in the park is divided between Jackson Lake and the Snake River.
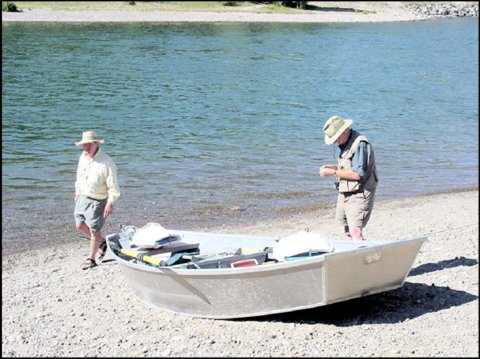
Most of the use of Jackson Lake is by private individuals participating in various activities, such as motorboating, pontoon boating, canoeing, kayaking, camping, and fishing. In the winter, activities such as ice fishing, cross country skiing, and snowshoeing are common. Many ice fisherman have used snowmobiles or snow planes for transportation across the frozen lake. The Park Service has concessioners that provide services such as boat rentals, scenic lake tours, guided fishing trips, and marina services. Data obtained from Grand Teton National Park outlining visitors using park concessioners for water-related recreation are shown in Table II-9.
Table II-9. Grand Teton National Park Visitors by Use (Concessionaire Use)
|
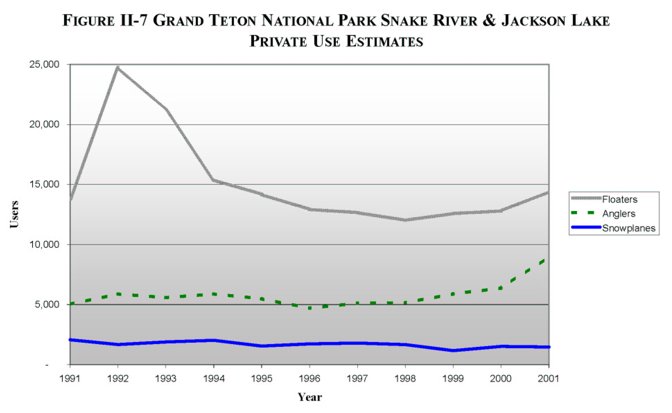
The National Park Service has estimated private users on the Snake River for both floating and angling activities. A graph indicating the number of private users for these recreational activities is shown in Figure II-7. In addition to estimating the number of floaters and anglers in the park, the National Park Service has also estimated the number of snowplane users on Jackson Lake during the winter months. Snowplanes are used as a mode of transportation on the lake when it is frozen over, much like snowmachines. It must be noted that recent decisions by the National Park Service have resulted in the banning of snowplanes from the park beginning in the winter of 2002-2003.
Bridger-Teton National Forest:
Snake River
There is significant use of the Snake River within the Bridger-Teton National Forest. A majority of the use consists of rafting, boating, and kayaking in Snake River Canyon between Hoback Junction and Alpine. In this area, there are also six campgrounds maintained by the Forest Service. Many commercial rafting outfitters use this area as part of their rafting business. Statistics regarding the use of the river by rafters, both commercial and non-commercial, are kept by the Forest Service and are shown in Table II-10.
Table II-10. Snake River Rafting Use - Bridger Teton National Forest
|
* Non-outfitted numbers reflect number of persons coming to the river, and not the number of times those persons ran the river in a given visit. Noncommercial users average 2-3 trips down the river in a given day of use. Noncommercial numbers are estimates based on periodic counts, reviews of river photographs and group permit numbers.
**The decrease in noncommercial use in 2001 is a result of enforcement of the large group permit system required by the Snake River Management Plan.
Other Recreational Uses
There are many other water-based recreational opportunities in the Bridger-Teton National Forest besides rafting the Snake River. According to the Greys River Ranger District of the BTNF, other activities include canoeing and other watercraft use, fishing, and to a lesser extent ice fishing, waterfowl hunting, and swimming. Recreational Visitor Days (RVD's) for the Greys River Ranger District and Jackson Ranger District as estimated by the Forest Service for 1994 are shown in the following Table II-11.
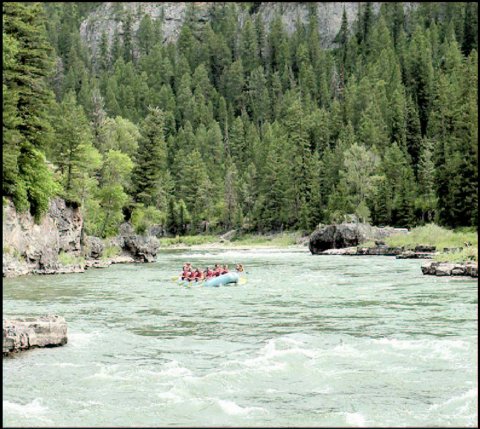
Table II-11. Bridger-Teton National Forest Recreational Visitor Days (1994)
| |||||||||||||||||||||||||||||||||||
The above mentioned recreational activities take place throughout the forest, which has numerous rivers, streams, lakes, and ponds.
Ski Areas & Winter Sports:
There are three major ski resorts located in the Snake/Salt River basin. Snow King Resort is located in the Town of Jackson, and has 400 skiable acres. The resort has a base elevation of 6,237 feet and a top elevation of 7,808 feet, for a vertical rise of 1,571 feet. Tubing and ice skating are also available at Snow King. Grand Targhee Resort is located 5 miles east of Alta, and has 2,000 lift-served skiable acres and 1,000 snowcat served skiable acres. The resort has a top elevation of 10,000 feet, and a vertical rise of 2,395 feet. They also have 15 kilometers of groomed cross country trails. Jackson Hole Mountain Resort is located at Teton Village and has 2,500 skiable acres. The resort has a base elevation of 6,311 feet and a top elevation of 10,450 feet, for a vertical rise of 4,139 feet. Over 17 kilometers of groomed cross country trails are also available, as well as sleigh rides and dog sledding. All three resorts have incorporated snowmaking facilities into their resorts. For the 1998-99 ski season, the three resorts combined for nearly 550,000 skier days. Skier days for the ski areas in the basin are shown in Table II-12. In addition to the resorts described above, there are also companies that provide heli-skiing in the mountain ranges throughout the basin.
Table II-12. Skier Days
| ||||||||||||||||||||||||
The three ski areas utilize snowmaking during the early season, which can be from mid-October through January. Snow King snowmaking typically starts in October to accommodate World Cup race training prior to the season opening. Ground water is typically utilized for snowmaking operations. While all three resorts have installed snowmaking facilities on portions of their ski areas, the success of the ski season is dependent upon natural snowfall. Typical snowfall amounts for the resorts are 500 inches per year at Grand Targhee, 400 inches per year at Jackson Hole Mountain Resort, and 150 inches per year at Snow King.
There is generally adequate snowfall across the basin to support winter sports at locations other that the ski areas. Other activities such as cross-country skiing, snowshoeing, and snowmobiling are popular, and miles of trails are groomed throughout the basin for use by snowmachiners and skiers. Also, the annual World Championship Snowmobile Hill Climb has been held at Snow King for over 25 years.
Fishing:
Fishing is a significant recreational activity throughout the Snake/Salt River basin. Fly fishing dominates on the Snake River, and the significant game fish in the basin are shown in Table II-13.
Table II-13. Gamefish of the Snake/Salt River Basin
| Common Gamefish Name | Scientific Name |
| Snake River Cutthroat Trout | Oncorhynchus clarki ssp. |
| Yellowstone Cutthroat Trout | Oncorhynchus clarki bouvieri |
| Mountain Whitefish | Prosopium williamsoni |
| Lake Trout | Salvelinus namaycush |
| Brook Trout | Salvelinus fontinalis |
| Rainbow Trout | Oncorhynchus mykiss |
| Golden trout | Oncorhynchus aguabonita |
| Kokanee Salmon | Oncorhynchus nerka |
| Brown Trout | Salmo trutta |
| Arctic Grayling | Thymallus arcticus |
| Rainbow-Cutthroat Trout Hybrid |
According to the Wyoming Game and Fish Department, many of the streams and lakes in the basin are managed to preserve the indigenous Snake River Cutthroat Trout as well as to preserve wild trout fisheries. Maintaining the supply and increasing the diversity of sport fishing in the basin is also a management goal of the department. There are also trophy fish in the area, as evidenced by two state record fish. A 50 pound lake trout was caught in Jackson Lake, and a mountain whitefish over 4 pounds was caught in the Snake River.
There is a variety of lakes and streams in the basin that provide a wide range of fishing experiences, from small wilderness streams and lakes to the Snake River and Jackson Lake. Some areas, such as Jackson Lake, see a considerable amount of ice fishing in the winter. A document produced by the Game and Fish Department entitled "Jackson Fish Management - Sub-basin Management Plans" in 1995 contains data on fishing in the Snake/Salt River basin. In this report, the basin has been broken into various sub-basins, with information on the existing fishery and future management plans outlined for each sub-basin. Table II-14 provides a summary of selected data from this report from each sub-basin.
The Wyoming Game and Fish Department has developed a stream classification system for the rivers and streams in the State of Wyoming. This classification system is based on the aesthetics, availability, and productivity of the stream. Aesthetics includes the characteristics of the stream channel, water quality, development, and landscape. Availability looks into the quantity and ease of access. Productivity is the pounds of trout per mile in the stream. This classification system is for trout only. The classifications are as follows:
In the Snake/Salt River basin, the Snake River is the only Class 1 or blue stream. The Salt and Greys Rivers are Class 2 or red streams. The stream classifications are presented as a GIS theme as part of this basin plan.
Table II-14. Fishery Management Data by Sub-Basin
| Sub-basin | Stream Miles | Lake Surface Acres | Angling Pressure (d/yr) |
| Snake River (below Jackson Lake Dam) | 311 | 5,232 | 47,453 |
| Snake River (above Jackson Lake Dam) | 91 | 17,966 | 25,764 |
| Snake River Basin (wilderness waters) | 67 | 30 | 518 |
| Hoback River Basin | 224 | 41 | 7,690 |
| Gros Ventre River Basin | 167 | 1,334 | 4,270 |
| Fish Creek Basin | 90 | 350 | 3,711 |
| Spread Creek Basin | 48 | 23 | 912 |
| Buffalo Fork Basin | 57 | 28 | 1,378 |
| North Buffalo Fork Basin | 39 | 123 | 344 |
| South Buffalo Fork Basin | 45 | 60 | 620 |
| Cub Creek Basin | 15 | 38 | 297 |
| Pacific Creek Basin | 68 | 228 | 2,426 |
| Palisades Basin | 11 | 0 | 336 |
| Teton River Basin | 135 | 338 | 2,333 |
| Lower Salt River Basin | 155 | 18 | 9,577 |
| Upper Salt River Basin | 42 | 41 | 1,805 |
| Greys River Basin | 133 | 69 | 5,845 |
| Little Greys River Basin | 45 | 2 | 688 |
| Totals | 1,743 | 25,921 | 15,967 |
Source: Jackson Fish Management - Sub-Basin Management Plans, WGFD, 1995.
Waterfowl Hunting:
Waterfowl hunting is another recreational activity that is possible due to water features in the basin. The Snake/Salt River basin is located between the Central and Pacific Flyways, which are major routes for migratory birds between Canada and Mexico. While the basin is not directly in a major flyway route, there are a significant number of birds that migrate through the area, and there are numerous locations that attract waterfowl as well as hunters.
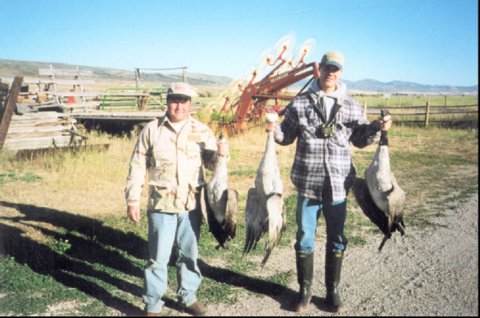
Estimates on waterfowl hunting activity in various sub-basins in Wyoming are made by the Wyoming Game and Fish Department, and are also included in their annual report. These estimates cover the number of hunters, the number of days they hunted, and the harvest of waterfowl. This data for the 2000 hunting season is presented in Table II-15 for ducks and Table II-16 for geese.
Table II-15. Duck Hunting Estimates for 2000
|
Table II-16. Goose Hunting Estimates for 2000
|
Other waterfowl included in this report, though they are hunted in much smaller numbers, include coots and mergansers. Migratory game birds included in the report include sandhill cranes, mourning doves, rail, and snipe. Data regarding various other birds are included in the Game and Fish report as well, however they will not be included in this river basin plan.
Recreational Water Use Conclusions:
While recreation is generally a non-consumptive use of water, it is a very important part of life in the Snake/Salt River basin. A large portion of the economy is driven by tourist activity, most of which is due to the recreational opportunities in the area. Different forms of recreation are enjoyed each season of the year. These opportunities are available due to the water resources in the basin, which are renewed annually through the hydrologic cycle. Recreation also contributes greatly to the quality of life for those who live in the basin.
F. ENVIRONMENTAL WATER USE
Water features such as rivers, streams, and lakes are an integral part of the landscape and environment in the Snake/Salt River basin. Among the various uses of water studied as part of the Snake/Salt River basin plan, this report also looks at the use of water for environmental purposes. Many of these uses are controlled by man to maintain or improve existing conditions, while others, such as wetlands, may occur naturally and are subject to management by various means.
Maintenance Flows:
The construction of the Jackson Lake Dam in 1911 allowed for control of the flow of Snake River below Jackson Lake. This control was generally exercised to the benefit of farmers located downstream in Idaho. Peak flows that would have spilled from the lake were held back for use later in the growing season. However, management of the flow for optimal use by farmers does not necessarily mean that the flow will be suited for fish in the river. Frequent or large adjustments in releases from the lake that may be desired by downstream users tend to be detrimental to the fish population. Also, very low flows during the winter when the reservoir is filling can have a negative effect on fish.
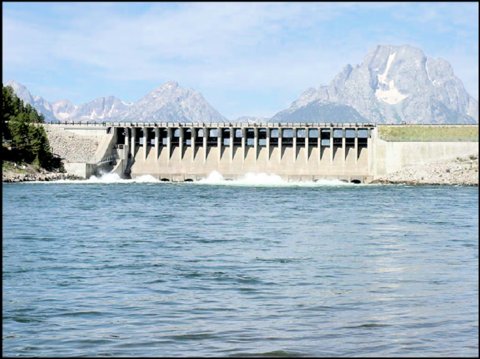
Drought in the basin in the late 1980's brought concern for the fish in Snake River. Farmers wanted to save as much water as possible during the winter in order to have adequate water for irrigation the following summer. However this would compound the problem of stream flows already low due to drought. During this time, it was determined that there was storage space available to the State of Wyoming in Palisades Reservoir. This storage space was later purchased by the State. Purchase of this storage space enabled interests upstream of Idaho in Wyoming to be heard. Since all Bureau of Reclamation water contracts in Palisades Reservoir and Jackson Lake were for uses downstream in Idaho, it did not matter to the downstream users in which reservoir the water controlled by Wyoming was located. As a result, Wyoming is able to exchange water in Palisades for water in Jackson Lake. This water can then be used to augment fish flows if needed, without impact to irrigators in Idaho. According to the Wyoming Game and Fish Department, a minimum winter release of 280 cfs from Jackson Lake is desired for the Snake River fishery.
In addition to the use of water in Jackson Lake, the State of Wyoming also had opportunity for input regarding the operation of the water storage facilities at Jackson Lake and Palisades Reservoir, similar to any other space holder in these facilities. As a result, the State Engineer's Office and Wyoming Game and Fish Department now have semi-annual meetings with the U.S. Bureau of Reclamation regarding operations of the reservoir facilities.
Wetlands Mapping:
According to their website, the National Wetlands Inventory (NWI) of the U.S. Fish & Wildlife Service produces information on the characteristics, extent, and status of the nation's wetlands and deepwater habitats. Wetlands are lands transitional between terrestrial and aquatic systems where the water table is usually at or near the surface or the land is covered by shallow water. For purposes of this classification wetlands must have one or more of the following three attributes:
The wetland classification system is hierarchical, with wetlands and deepwater habitats divided among five major systems at the broadest level. The five systems include Marine (open ocean and associated coastline), Estuarine (salt marshes and brackish tidal water), Riverine (rivers, creeks, and streams), Lacustrine (lakes and deep ponds), and Palustrine (shallow ponds, marshes, swamps, sloughs). Systems are further subdivided into subsystems which reflect hydrologic conditions. Below the subsystem is the class which describes the appearance of the wetland in terms of vegetation or substrate. Each class is further subdivided into subclasses; vegetated subclasses are described in terms of life form and substrate subclasses in terms of composition. The classification system also includes modifiers to describe hydrology (water regime), soils, water chemistry (pH, salinity), and special modifiers relating to man's activities (e.g., impounded, partly drained). The three major wetland systems mapped within the Snake/Salt River basin are Riverine, Lacustrine, and Palustrine.
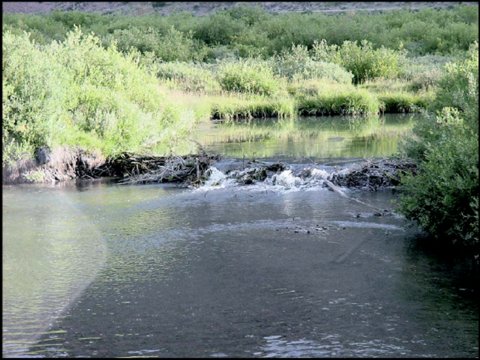
The wetlands mapping produced by the National Wetland Inventory and converted into Arc/Infor coverages by the Spatial Data and Visualization Center is included in the GIS mapping for the Snake/Salt River basin plan. The mapping is at a scale of 1:24,000.
Wetlands in the basin provide food, shelter, and breeding habitat for waterfowl and other wildlife. Wetlands may also improve water quality by contributing to the removal of nutrients, sediment, and other impurities in water, in turn protecting rivers and lakes. Also, wetlands can help control erosion and flooding during high water events.
Wetlands Projects:
Many wetland creation and enhancement projects were constructed throughout the Snake/Salt River basin by the Soil Conservation Service and the Natural Resource Conservation Service (NRCS) in the 1990's. Various projects near Jackson were constructed as part of the mitigation plan for Jackson Lake rehabilitation due to loss of wetlands, and are located in the Gros Ventre, Buffalo Fork, and South Park areas.
At the upper end of the Palisades Reservoir, the Wyoming Game and Fish Department had created a wildlife viewing area adjacent to Highway 89. However, much of the wildlife and waterfowl would leave when the reservoir level would drop and leave the area dry. The NRCS, with funding help from U.S. Bureau of Reclamation, Wyoming Game and Fish Depart-ment, U.S. Forest Service, and the Town of Alpine, designed a wetland area that would keep water in the area to provide wildlife habitat year round. A system of seven dikes was constructed, up to seven feet in height, with clay cores and gravel shells. The design called for the lower dikes to be under water when the reservoir was full, and 35 islands were placed in the created pond areas. The water for the wetland area is diverted from Salt River, and as much as 30 cfs of water can be diverted. By creating a flow-through system, problems with mosquitoes and moss were avoided. Nearly all of the water that flows through the system returns to Palisades Reservoir. Currently, the facility is operated by the Wyoming Game and Fish Department, who is also the holder of the associated water rights.
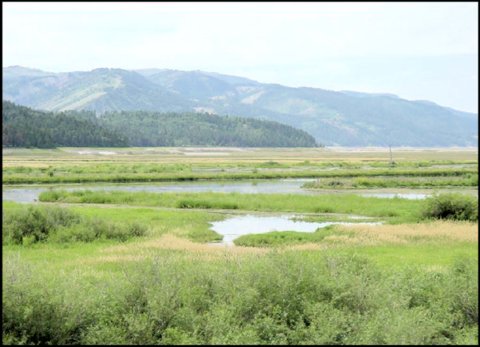
Snake River Restoration Project:
The Upper Snake River Restoration Project is located in the Jackson valley, and is intended to rehabilitate and restore fishery and wildlife habitat along the Snake River. In the 1950's, approximately 22 miles of dikes and levees were constructed along the Snake River in an effort to reduce flooding. For example, the elevation of the community of Wilson is actually lower than that of the nearby river bed, and extensive flooding would occur during a 100 year event. The levees now protect residents in the area from flood events, and the 100 year flood plain is now within the levee system in this area. These structures reduced the flood plain from approximately 25,000 acres to 2,500 acres throughout the Jackson valley. As a result of the reduced area available to the river during flood events, river velocities can increase to the point that the river bed is unstable. Over the years this has greatly reduced fish and wildlife habitat along the river, as well as vegetation. In an effort to restore some of what was lost, Teton County and the Teton Conservation District have sponsored this project, along with the U.S. Corps of Engineers. According to the USCOE, this will be a $54 million project spanning 14 years.
Cutthroat Trout Management:
The Wyoming Game and Fish Department has created and implemented a cutthroat trout management program for various species of cutthroat across Wyoming. In the Snake/Salt River basin, this program is managed for the success of the Yellowstone cutthroat trout. At the current time, Snake River cutthroat are considered the same species as Yellowstone cutthroat, although there are visual differences between the two. Interestingly, it is possible for fish to travel from the Snake River basin into the Yellowstone River basin by way of Pacific Creek and Atlantic Creek on Two Ocean Pass. In this location, the stream splits into two, with one flowing into the Yellowstone drainage and the other into the Snake, providing a free waterway to cross the divide.
According to the management plan, there has been a decline in Yellowstone cutthroat due to habitat loss and genetic introgression. Specific threats to the species include stocking, angling pressure, habitat loss, whirling disease, and the New Zealand mud snail. Genetic purity has been a major concern of some groups, and has prompted them to petition to list the Yellowstone cutthroat as an endangered species.
Management in the Jackson Region
A fish management crew was established for the Snake/Salt River basin in 1955 in Jackson. Their management responsibilities primarily include enhancement of the wild trout fishery and preservation of the native Snake River cutthroat trout. According to the Yellowstone cutthroat management document, there are 987 streams and lakes in the region, of which 701 are suitable for trout. Of the waters suitable for fish, 653 contain native cutthroat populations. Nearly all of these water features contain Snake River cutthroat, with only three containing Yellowstone cutthroat. Interestingly, the Snake River cutthroat is the only subspecies of cutthroat trout that has increased in numbers over time. This is generally due to the widespread introduction of the fish outside of its historical range, as well as continued strength within the Snake/Salt River basin. Various management activities have been incorporated by the Jackson crew of the Wyoming Game & Fish Department to ensure success of the Snake River cutthroat trout. Major spawning habitat projects have been conducted over the last 30 years to improve the year to year increase of the fish population. Special regulations have been implemented to protect the wild trout fishery. The main example of this is the reduced limit of two trout per day in wilderness areas, which are most likely to hold pure strains of cutthroat. This regulation has been in effect for nearly 30 years. Likewise, additional brook trout can be kept by anglers in an effort to reduce the impact on the native fishery by this introduced species. Other management techniques such as spawning season closures, slot limits, and trophy regulations have also been implemented.
Present Cutthroat Management
The Wyoming Game and Fish Department has managed the fisheries in the Snake/Salt River basin primarily as a wild trout fishery. Stocking has been eliminated on all wild trout streams in the basin, with the exception of the Salt and Hoback Rivers. However, stocking is required in some areas where factors such as temperature, icing, reduced winter flows, and inadequate spawning habitat limit the success of the fishery. Cutthroat trout used for stocking in the basin have been obtained from the Auburn fish hatchery, which initially utilized fish taken from Flat Creek in 1953. The Jackson National Fish Hatchery also utilized fish from this source. In 1987, fish were taken from Lower Bar BC Spring Creek for creation of another cutthroat broodstock at the Wigwam state hatchery. Genetic testing has since revealed that the Wigwam fish population is much more genetically pure than the Auburn fish population. Additional DNA testing is to be conducted throughout the basin to determine the integrity of the native fish stocks in various streams and rivers. Additional work is being conducted to determine if genetic markers can be found to distinguish Snake River and Yellowstone cutthroats. Results from this testing will help with future management decisions regarding stocking and so forth. In other areas of Wyoming, upstream barriers and other management tools have been used to manage native fish stocks. This is not, however, anticipated in the Snake/Salt River basin.
Future Cutthroat Management
Future management of the cutthroat fishery will include protocols to deal with whirling disease. This disease has devastated fish populations of particular rivers in other states such as Montana, although rainbow trout populations have seen the most severe impact. Regulations now require all imported fish to be certified free of the pathogen. Also, disinfection procedures using chlorine are used within the Game and Fish Department to prevent further spread of the disease. Fish facilities are inspected annually for this and other problems, as are areas downstream of fish hatcheries. In waters where the parasite has been found, such as the Salt River, sampling is conducted on a two year cycle. Other waters that are currently free of whirling disease are sampled on a four year cycle. At this time, there have been no recorded losses of trout to the disease. Education of the public is also a major focus to prevent further spread of the disease. The Game and Fish Department has created and distributed signs and brochures regarding procedures to avoid spreading the problem to adjacent tributaries and waters.
In addition to whirling disease, a threat to the fishery could come from the New Zealand mud snail. While the snail itself is not harmful to fish, they can reproduce in dramatic numbers and compete with other food sources for trout. In certain areas in the Madison River in Montana, as many as 300,000 snails have been found in one square meter. The snails themselves do not provide an adequate food source for trout. The snails have been detected in Yellowstone Park, as well as in the Snake River above Jackson Lake in the Polecat Creek area. However, they have not been a problem in the Snake/Salt River basin at this point. Future management objectives are aimed to prevent spread of the snails to new streams and rivers by education of the public, as well as continued monitoring.
As stated by the management plan, most objectives have been in place for over 25 years, although additional recommendations may come from DNA testing and other recent issues. The following are possible management scenarios presented by the plan.
Big Game Habitat:
A significant portion of the Snake/Salt River basin serves as habitat for various big game animals. Much of this habitat is considered crucial in that a particular species cannot maintain its population in a specific herd over the long term without utilizing that habitat. There are many other areas that are not classified as crucial to wildlife, yet are utilized by them in different parts of the year. While big game habitat is not necessarily a use of water, water features in these areas are necessary for survival. The Snake/Salt River basin serves as habitat for elk, moose, mule deer, big horn sheep, and antelope. GIS files outlining big game habitat for various species have been created by the Wyoming Game and Fish Department, and are included in the GIS mapping for the Snake/Salt River basin plan.
The National Elk Refuge is located just north of Jackson, and covers approximately 25,000 acres. In the winter, the refuge is home to more than 7,500 elk. The area includes nearly 1,600 acres of wetlands and marshlands, and is home to 47 different species of mammals and nearly 175 species of birds. The National Elk Refuge is managed by the U.S. Fish and Wildlife Service.
In addition to the National Elk Refuge, there are five other elk management and feeding areas across the basin. These areas are managed by the Wyoming Game and Fish Department, and are located at Alpine, Forest Park, Dog Creek, Camp Creek/Horse Creek, and South Park. These feedgrounds were established to substitute for natural winter range lost to human development and to prevent elk from competing with domestic livestock for winter hay.
G. SALMON RECOVERY EFFORTS
Introduction and Background:
Wyoming is a headwaters state. As such, the beneficial use of water within Wyoming can often be influenced or affected by the issues and decisions made by others located downstream of Wyoming. While interstate compacts provide certainty for the long-term development and use of Wyoming's apportioned water resources, new issues important to a larger public beyond Wyoming and often derived from enactments of federal law periodically bring pressures upon and affect the use and management of water in Wyoming. In this regard, the State of Wyoming, through the State Engineer's Office, is routinely engaged in a variety of "downstream issues" to represent and protect the State's water interests.
In the Snake River basin, the primary downstream issue relates to the on-going efforts at recovering a variety of salmon and steelhead fish species that are listed as either threatened or endangered by the National Marine Fishery Service (NMFS) pursuant to the Endangered Species Act (ESA). These anadromous fish species are located along the Columbia River and Lower Snake River in eastern Idaho. Interestingly, there are additional listed species of trout, snails and plants located along the Snake River upstream of the river reaches directly affected by the salmon and steelhead yet downstream of the Wyoming/Idaho border. These ESA listings are under the management of the Fish and Wildlife Service (FWS) and the flow and habitat needs of these species often conflict with the desired flow regimes for the listed anadromous fish. For a number of years federal agencies, primarily through the Corps of Engineers (COE) and NMFS, have committed extensive financial resources to a large variety of scientific studies and structural changes to existing COE dams and hydropower plants. River and reservoir operational changes within the Columbia River system were also addressed. One of the many options and potential solutions targeted for species recovery that was identified in the 1995 Biological Opinion of the NMFS on the Federal Columbia River Power System, focused on a COE juvenile migration study responding to concerns about the declining propagation of the listed salmon and steelhead. This study evaluated methods of moving the juveniles more rapidly to the ocean.
Of the contentious alternatives evaluated, one option proposed to augment the natural flow of the river system by increasing the downstream river flow velocity to convey the juvenile fish to and through the Columbia River and the existing set of mainstem reservoirs, to the ocean. Another controversial alternative to achieve this same migration result was an evaluation of the removal of some of the mainstem COE dams and reservoirs, thereby eliminating flow impediments and slack water regimes. With regard to river flow augmentation, the COE and NMFS requested that the Bureau evaluate their Upper Snake River reservoir operations and identify additional water resources that could be committed to the recovery of the listed fish species. Separate from facilities owned by Idaho Power Company, all of the larger reservoirs in the Snake River system upstream of Lower Granite Dam are owned and operated by the Bureau. This system of reservoirs has a combined capacity of about 7 million AF of active storage space. While most of this space is contracted for irrigation purposes, some quantities are also assigned to environmental quality, other water supplies, and flood control purposes.
In 1995, the Bureau agreed to annually provide 427,000 AF of water to these efforts, derived primarily from the Upper Snake River Rental Pool, the purchase of a small amount of natural flow water rights, and un-contracted storage space in the Bureau's extensive Snake River reservoir system. This initial commitment of water did not significantly impact the operations of Palisades or Jackson Lake Reservoirs, or the Snake River flow regime through Wyoming. However, the Bureau has reported that there have been some problems and concerns expressed by residents, irrigators, the states, tribes and elements of the federal government.
Million Acre Feet Study:
In 1997, the COE requested that the Bureau analyze the effects of providing flow augmentation for the listed species at a level of an additional one million (1,000,000) acre-feet of water from the entire Snake River basin upstream of Lower Granite Dam. This is a commitment of water beyond the 427,000 AF already being provided for the recovery efforts. This study evaluated the possible affects of acquiring both natural flow water rights and reservoir storage space in Bureau facilities located in the Boise, Payette and Owyhee River basins, as well as the upper Snake River. The Bureau study developed new water demand schedules up to a total of 1,427,000 AF under several reservoir operation scenarios and then evaluated the environmental, economic, social, cultural and recreational effects of meeting these new demands. Admittedly, due to limited time and study scope, the Bureau's analysis was theoretical and presented general results on a broad basin-wide basis. Indeed, the actual selection of any particular water right or source would have a direct bearing on the specific and degree of potential impacts.
The Bureau study identified a block of water coming from natural flow water rights in Wyoming (approx. 30,000 AF) as well as from other areas of the basin. The Bureau simply assumed for their study that they would be able to acquire certain quantities of water rights from existing appropriators in Wyoming, and from Nevada, Idaho, and Oregon, that would be a portion of the additional one million acre-feet.
Because of the abbreviated and broad basin-wide nature of this study, specific and definitive impacts on the resources within Wyoming are not provided. A summary of the general findings related to Jackson Lake and Palisades Reservoir are:
The Bureau properly noted that the costs and degree of local opposition to an acquisition program such as this would be substantial. Even though the Bureau recommended willing buyer/willing seller types of water right transactions, it noted even those arrangements would require a lot of time, resources and state approval to provide proper protection of the water acquired and conveyed to the location of the new use. The Bureau also mentioned the high social and political price that could be paid if an aggressive and heavy-handed approach to water acquisitions was pursued, whether from federal storage space contractors or natural flow water rights. These less desired options included those legally based on federal takings and prior and superior claims legal arguments. The Bureau noted that those approaches would be resisted strenuously by many water and power users and other constituents by all legal means. The Bureau's "million acre-feet study" was submitted to the COE and since that time no further actions evaluating or implementing the options and alternatives presented have been pursued. Officials representing the State of Wyoming's interests were and continue to be involved in monitoring this study and other related ESA efforts downstream of the Wyoming/Idaho border.
H. INSTREAM FLOWS:
Wyoming water law originated during territorial days and is based on the doctrine of prior appropriation. Under this scenario the first person to put water to beneficial use has the first right, which is also referred to as "first in time is first in right." As a result, water rights in Wyoming are regulated by priority, as they are in most of the western states. This means that the earliest rights are entitled to water during periods of limited supply, while those with later rights are denied water during these times.
The Wyoming Constitution states that water of all natural streams, springs, lakes, or other collections of still water is the property of the State, and is administered through the State Engineer. Water division superintendents administer the water within each of the four water divisions in the State, with assistance from local water commissioners and hydrographer-commissioners. Prior to 1986, Wyoming water law stated that water must be diverted and conveyed in order to be beneficially used. However, the passing of the Instream Flow Law in 1986 changed this to allow water to be left in the stream for a beneficial use, such as for fisheries. This instream right can only be held by the State of Wyoming, and the priority system still applies to these rights.
Instream Flow Law:
After much debate, the instream flow law was passed by the wyoming Legislature in 1986. The concept had not been recognized by the State Engineer prior to this, as it was generally accepted that water must be diverted to be beneficially used. Also, there were questions regarding the abandonability of the rights since it was not diverted. The Wyoming Legislature declared in 1986 that instream flow for maintenance or improvement of existing stream fisheries is a beneficial use of water that can be provided from natural streamflows or from storage water. The instream flow process includes three State agencies, which are: the Game and Fish Department, the Water Development Commission, and the State Engineer's Office. The Game and Fish Department first selects the stream segment on which to file for a right. This is done using biological reports, knowledge of the fisheries, and stream flow models, along with determination of how much flow will be required. The Wyoming Water Development Commission then applies for the appropriation. The WWDC must also conduct a hydrologic study to determine whether the instream flow can be provided from the unappropriated natural flow of the stream or whether storage water from an existing or new reservoir will be needed for part or all of the instream use. The WWDC study is then supplied to the State Engineer for his consideration.
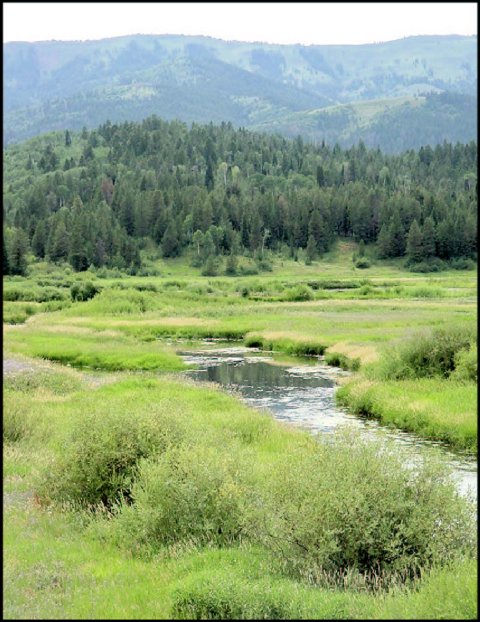
After receiving reports from the Game and Fish Department and WWDC, the State Engineer may conduct his own evaluation of the proposed appropriations for instream use. Before granting or denying a permit for instream flow in the specified stream segment, the State Engineer must conduct a public hearing and consider all available reports and information. In the past, public involvement has ranged from very little to quite significant. Following the public input period, the State Engineer decides whether or not to approve, approve with modifications, or reject the application. If granted, an instream flow permit can contain a condition for review of continuation of the permit at a future time. Also, the Wyoming Water Development Commission is named as holder of the permit.
The instream flow appropriation goes into effect the date the State Engineer approves the permit. The water right cannot be adjudicated by the Board of Control for three years thereafter. An instream water right has a date of priority as of the date that the application was received and recorded by the State Engineer, and all senior priority water rights must be recognized in administration of the stream.
Only municipalities can condemn an instream flow right. However, within one mile of the State border, the water for an instream flow right is still open to appropriation. This allows for additional utilization of water prior to the flow leaving the State. Existing water rights cannot be condemned for instream flow, however, they can be gifted to the State for instream use. This has not happened as yet. As for regulation of water rights on a stream, this must be called for by the Game and Fish Department with the request proceeding through WWDC. Instream flow rights do not ensure ingress and egress rights to the stream for public use, however, the Game and Fish Department has tried to ensure that the segments with instream rights have public access as well. Also, these rights cannot be issued if they will limit Wyoming's use of water with respect to interstate compacts. This will be reviewed with all of the pending applications in the Snake/Salt River basin.
Instream Flow Right Applications:
The first filings in Wyoming for instream flow rights were for protection of various species of cutthroat trout. There are currently three applications pending in the Snake/Salt River basin, two of which are on Fish Creek below Wilson, with the other on the Salt River. There are currently 85 instream flow applications filed with the State, with 26 having been permitted as of December 2002. The right for the Greys River, Permit Number 11IF, is the ony permitted instream flow rights located within the Snake/Salt River basin. Instream flow filings for rivers and streams in the Snake/Salt River basin are shown in Table II-17. A map outlining the locations of these streams is shown in Figure II-8.
Table II-17. Snake/Salt River Basin Instream Flow Applications
| Permit No. | Priority | Stream Segment | Stream Length | CFS | Beginning (S, T, R) | Ending (S, T, R) |
| 01/05/93 | Salt River | 2.60 mi. | 221 | 21-36-119 | 16-36-119 | |
| 10/08/93 | Fish Creek No. 1 | 0.60 mi. | 150 | 22-41-117 | 27-41-117 | |
| 10/08/93 | Fish Creek No. 2 | 1.50 mi. | 150 | 34-41-117 | 03-40.117 | |
| 111F | 10/08/93 | Greys River | 10.10 mi. | 204-350 | 07-36-117 | 33-37-118 |
S, T, R = Section, Township, Range
MAJOR RESERVOIRS
For consistency with the other Wyoming basin plans, data has been collected on all of the major reservoirs that are of particular significance to the basin. Facilities with capacities of 1000 acre-feet or larger define this criteria. In depth data regarding these reservoirs such as capacity tables and water rights have been compiled on each of these larger facilities.
In addition to the information on key storage facilities in the basin, an inventory of reservoirs was compiled. As with the other basin plans, facilities with a dam height of 20 feet or greater or with capacities of 50 acre-feet or greater were included in the inventory. These facilities are within the limits of the Safety of Dams Law coverage.
Data on the various reservoirs were collected from a variety of sources, such as the Water Rights Database from the State Engineer's Office, the Active Dams Database, the Tabulation of Surface Water Rights and the U.S. Bureau of Reclamation. It was found during the data collection that there are a number of larger dams that were permitted at one time yet were never built, or were built and have since been removed. Generally, these facilities were to be in the vicinity of Grand Teton National Park, and some were to enlarge existing lakes. Dams that either were not built or have been removed were not considered for this study. Details on the major reservoirs in the basin are presented in Table II-18.
Table II-18. Major Reservoirs in the Snake/Salt River Basin
| Reservoir | Permit No. | Year Complete | Normal Capacity (acre/feet) | Dam Height (feet) | Surface Area (acres) |
| Grassy Lake | 4631R | 1939 | 15,182 | 70 | 310 |
| Jackson Lake | Various | 1911 | 847,000 | 65 | 25,530 |
| Palisades | Idaho | 1957 | 1,200,000 | 270 | 16,150 |
Compact & Court Decree Issues:
The Snake River Compact recognizes, without restriction, all existing water rights in Wyoming and Idaho established prior to July 1, 1949. It permits Wyoming unlimited use of water for domestic and stock watering purposes, providing stock water reservoirs shall not exceed 20 acre-feet in capacity. The compact allocates to Wyoming, for all future uses, the right to divert or store 4% of the Wyoming-Idaho state line flow of the Snake River. Idaho is entitled to the remaining 96% of the flow. The use of water is limited to diversions or storage within the Snake River drainage basin unless both states agree otherwise. The compact also provides preference for domestic, stock and irrigation use of the water over storage for the generation of power.
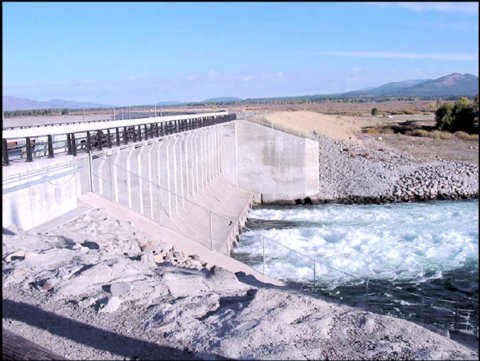
One unique aspect of the Snake River Compact, compared to other compacts to which Wyoming is a party, is a requirement that calls for Wyoming to provide Idaho replacement storage for one-third of any usage after the first 2% is put to beneficial use. Early estimates of these replacement storage quantities, based upon the average state line flow, are 33,000 acre-feet. One result of this planning report is the update of Wyoming's estimated current use of water in the basin, which is presented in Chapter III. This will provide the state and water users with an important component of information for future development and project planning. In addition to the Snake River Compact, a court decision referred to as the Roxanna Decree is also in effect within the Snake/Salt River basin. Currently this decision does not have an impact on the operation of any major reservoir in the basin.
All of the major reservoir facilities in the Snake/Salt River basin are owned and managed by the U.S. Bureau of Reclamation for irrigation and hydropower production in Idaho. Jackson Lake Dam and Grassy Lake Dam are managed as part of the Minidoka Project, which provides irrigation water for over 1 million acres of farmland in Idaho. Palisades Dam, part of the Palisades Project, is also managed in conjunction with the Minidoka Project.
J. WATER QUALITY
Water quality issues can affect the development and use of water in a river basin. Various properties are used to determine water quality such as physical, chemical, biological, bacteriological, and radiological characteristics. Quality of water can be affected by human activities as well as natural events.
The Environmental Quality Act was passed by the Wyoming Legislature in 1973. The purpose of the law was to address the concern that pollution "will imperil public health and welfare, create public and private nuisances, be harmful to wildlife, fish and aquatic life, and impair domestic, agricultural, industrial, recreational and other beneficial uses". The act authorized the state "to prevent, reduce and eliminate pollution; to preserve, and enhance the water and reclaim the land of Wyoming; to plan development, use, reclamation, preservation and enhancement of the air, land, and water resources of the state; to preserve and exercise the primary responsibilities and rights of the state of Wyoming; to secure cooperation between agencies of the state, agencies of other states, interstate agencies, and the federal government in carrying out these objectives" (Environmental Quality Act, 1973).
The State of Wyoming has designated the Water Quality Division (WQD) of the Wyoming Department of Environmental Quality (WDEQ) to oversee water quality and enforce the Environmental Quality Act. This is being done through various programs that have been set up to control various forms of potential pollution. Pollution can come from point and non-point sources, and can affect surface water and groundawater.
There have been numerous federal legislative efforts that authorize the remediation and protection of water quality and the environment. These include the Clean Water Act, Pollution Prevention Act, Safe Drinking Water Act, Clean Air Act, National Environmental Protection Act, Solid Waste Disposal Act, Toxic Substance Control Act, and the Federal Insecticide, Fungicide and Rodenticide Act. Most of the federal programs involved with water quality allow individual states to obtain primacy to administer the federal programs. The Environmental Protection Agency (EPA) can step in if a state is not conducting the program to their satisfaction, even if the state has primacy.
Basin Groundwater Quality:
Chapter 8 of the Wyoming Water Quality Rules and Regulations addresses groundwater quality standards and protection. These rules are enforced by the Wyoming Department of Environmental Quality Water Quality Division. Chapter 8 describes various classifications that have been created for groundwater and outlines the rules for discharges to these waters. Additional information regarding groundwater quality can be found in the groundwater availability portion of Section IV.
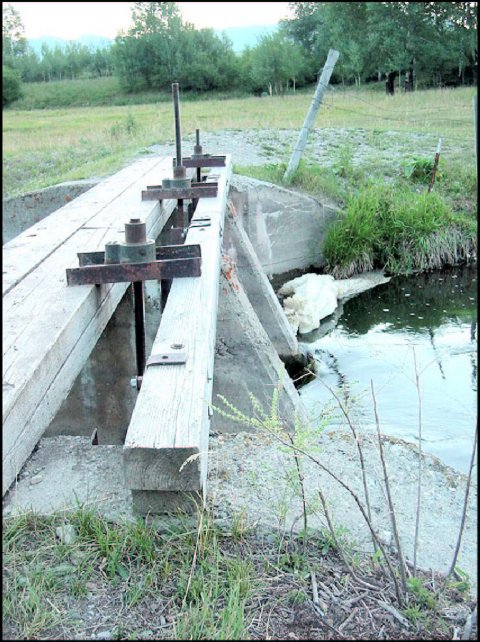
Basin Surface Water Quality:
According to the Wyoming Surface Water Classification List (WDEQ, 2001) there are many surface waters within the Snake/Salt River basin designated as Class 1 waters, including the following:
Many of the remaining rivers and streams in the basin are classified as 2AB in the primary classification from WDEQ, while a few are classified as 3B.
The Clean Water Act requires that a 305(b) report be created which covers statewide water quality, along with a 303(d) list, which is a list of impaired streams in the state. Impaired streams require the establishment of total maximum daily loads (TMDLs) for problem pollutants. A TMDL is the amount of a specific pollutant that a water body can receive and assimilate in a given time period and still meet water quality standards.
The classification of stream indicates what use is being or can be supported by that stream. In general, the quality of water in the Snake/Salt River basin is good based upon water bodies supporting their designated uses. This is evident in the lack of basin water features included in Wyoming's 2002 305(b) State Water Quality Assessment Report produced by WDEQ, which includes 303(d) listings. These listings are broken into four parts, the first being the 303(d) Waterbodies with Water Quality Impairments. There are no Snake/Salt River basin water features on this list. The second is the 303(d) Waterbodies with NPDES Discharge Permits Containing Waste loan Allocations Expiring. Flat Creek near Thayne and Snake River near Alpine are on this list, as NPDES discharge permits for the wastewater treatment plants in these areas have imminent expiration dates. The third is the 303(d) Waterbodies with Water Quality Threats, which includes Spread Creek-North Fork due to habitat degradation, Flat Creek between Snake River and Cache Creek due to habitat degradation, and Salt River near the Etna Gaging Station due to fecal coliform bacteria. There are no waters in the Snake/Salt River basin that were delisted from the 2000 303(d) list.
In summary, there are no water features in the basin requiring TMDLs, and there are current threats only in a few areas. Other water quality problems described in the 2002 Water Quality Assessment Report (though not on the 2002 303(d) list) include physical degradation of the Pacific Creek stream channel and general erosion in the Greys-Hoback watershed. Stream channel rehabilitation on the North Fork of Spread Creek has been done, however the stream will remain on the above mentioned 303(d) list until the riparian vegetation is better established.
According to "Water Resources Data Wyoming Water Year 2001" produced by U.S. Geological Survey (USGS), only three water quality sampling stations are currently being operated by USGS in the Snake/Salt River basin. These stations are shown in Table II-19.
Table II-19. Current USGS Water Quality Sampling Stations In The Snake/Salt River Basin
| Station Name | Station Number | Period of Record |
| Snake River above Jackson Lake, at Flagg Ranch | 13010065 | 1987 to Present |
| Snake River at Moose | 13013650 | 1995 to Present |
| Salt River above Reservoir, near Etna | 13027500 | 1994 to Present |
Water quality data for the stations listed in Table II-19 can be found in the Water Quality technical memorandum. The data is for the 2001 water year, which covers results from October 2000 to September 2001. Review of the data indicates that there are no water quality problems apparent in the sample testing results, other than the fecal coliform test results at the Salt River station described above.
Additional water quality monitoring across Wyoming is conducted by WDEQ as part of their watershed monitoring program. During the late 1990's, water quality collection sites were selected in order to provide reference quality data. These sites generally did not have water quality problems, as the data were used as a reference for later testing. Due to the fact that these sites were intended to provide reference data, there are no evident impairments of the rivers and streams from the test results. Since 2000, data have been collected from sites that were targeted as being potentially impaired waters. This data will be available to the public later in 2003 following completion of WDEQ quality control procedures.
Aquifer Sensitivity and Vulnerability:
A program to assess the vulnerability of groundwater to contamination from surface pollutants was initiated in 1992 by WDEQ in cooperation with the University of Wyoming's Water Resources Center, the Wyoming State Geological Survey, and the US Environmental Protection Agency . This modified DRASTIC model takes into account depth to water, recharge, aquifer media, soil media, topography, impact to vadose zone, and hydraulic conductivity. Geographic Information System (GIS) software was used to combine various geologic, topographic, and soils characteristics into composite scores. These scores describe "aquifer sensitivity" - the intrinsic ability of the subsurface environment to transport surface contaminants into groundwater, and "groundwater vulnerability" - the integration of aquifer sensitivity with current land use practices likely to cause groundwater contamination. Final reports for this program were completed in 1998, and data was available digitally in 1999.
Figure II-1: Irrigated Lands
Figure II-2: Irrigated Lands
Figure II-3: Irrigated Lands
Figure II-4: Agricultural Wells
Figure II-5: Municipal Wells
Figure II-6: Domestic Wells
Figure II-8: Grand Teton National Park Snake River & Jackson Lake Private Use Estimates
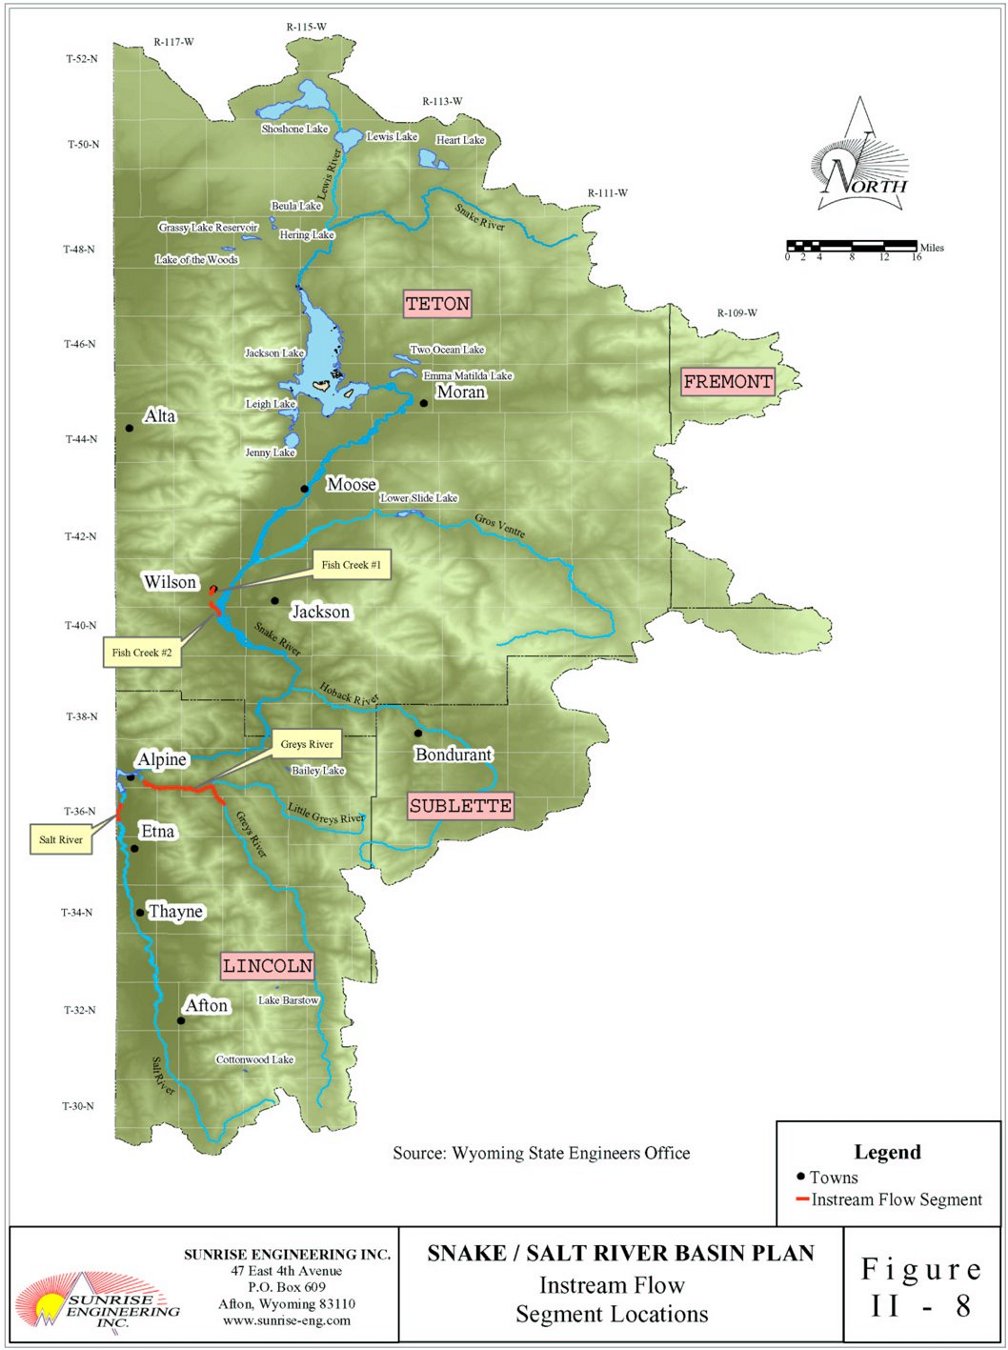
A. SURFACE WATER DATA COLLECTION
Introduction:
Prior to beginning the latest basin planning effort for the State, the Wyoming Water Development Commission (WWDC) considered the methods to be used for basin surface water modeling. They determined that three 12-month spreadsheet models (one each representing average-year, dry-year, and wet-year streamflows) constitute an appropriate level of detail for a modeling tool to verify existing uses and evaluate future surface water uses. Gage flows used in the three spreadsheets are to be typical of three different conditions, and are to be developed by averaging observed or estimated streamflows that occurred during historical average, wet, or dry years. Accordingly, the objectives of this task were to:
Study Period Selection:
It is important in any water availability evaluation to select a study period that is long enough to include a variety of hydrologic conditions, including an extended period of dry years as well as wet years and average years. At the same time, it is important to avoid selecting a study period so long that many streamflows must be synthesized to fill-in missing data. Additionally, a single annual cycle will be used to model each hydrologic condition; therefore, the average data developed for input to the model should be derived from an operationally consistent time period. Construction of reservoir storage, changes in irrigation practices or change in water use (agricultural to suburban ranchette) are all significant in the study period selection.
Salt River
It is desirable in evaluating long-term hydrologic conditions to utilize streamflow records that have a long period of continuous record and reflect natural (virgin) flow, unaffected by upstream depletions or storage regulation. Unfortunately, no such streamflow gaging station exists in the Salt River basin. However, the Greys River above Reservoir, near Alpine gage has less than 500 acres of irrigated lands upstream of this gage (per USGS Water Resources Data) and has been in continuous operation since the 1954 water year. Since the irrigated acreage is small relative to the overall drainage basin (less than one percent), diversions were assumed to be small compared to the total natural flow. Therefore this gage was considered a natural flow gage and was used for the study period selection for the Salt River. The long term hydrograph is shown in Figure III-1.
Numerous irrigation systems were converted from flood to sprinkler systems during the late 1960's - early 1970's. Improvements in irrigation efficiencies ultimately impacted the overall watershed. Venn (2002) presented a double mass balance analysis of Salt River flows versus Greys River flows, showing a break in the trend line beginning in approximately 1971. He attributed the shift to changes in irrigation practice, from flood to sprinkler. This would suggest that the study period for the Salt River should begin no sooner than 1971. On the other hand, as no other major water developments have occurred in the Salt River basin since 1971, there's no reason to begin the study period any later in time.

Based on an evaluation of the long-term hydrologic conditions on the Greys River, together with an understanding of the availability of historical stream flow records and irrigation practices within the Salt River basin, a 31-year study period of 1971 through 2001 was selected as the candidate study period.
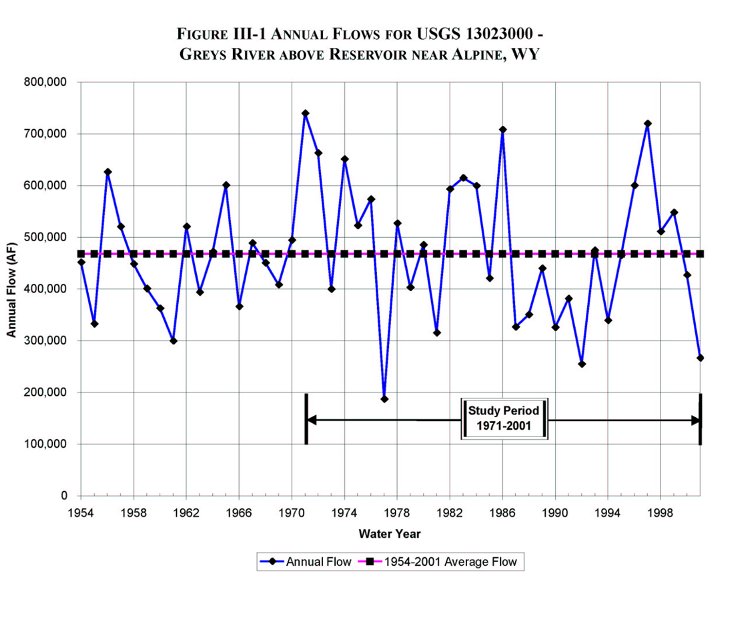
This selection was further supported by an analysis of the characteristics of the long term (1954-2001) record and the proposed study period (1971-2001). This information is tabulated below:
Table III-1
Characteristics of Annual Flow Series for
USGS 13023000 - Greys River above Reservoir, near Alpine, WY
| 1954-2001 | 1971-2001 | |||||
| Mean (AF) | 468,627 | 478,985 | ||||
| Standard Deviation | 128,603 | 143,253 | ||||
| Three highest years | 1971 | 1997 | 1986 | 1971 | 1997 | 1986 |
| Three highest values (AF) | 740,050 | 720,160 | 708,630 | 740,050 | 720,160 | 708,630 |
| Three lowest years | 1977 | 1992 | 2001 | 1977 | 1992 | 2001 |
| Three lowest values (AF) | 187,390 | 255,120 | 267,035 | 187,390 | 255,120 | 267,035 |
Table III-1 shows that means of the two periods are very similar. Standard deviation for the shorter period is higher, which is to be expected for a smaller sample size. Most notably, the shorter study period includes both the three highest annual flows of record, as well as the three lowest.
Snake River
The Snake River near Moran gage has the longest period of record (1904-2001) of all the gages within the Snake River basin. However, this gage is located immediately downstream of Jackson Lake Dam, and measured flows are directly influenced by reservoir releases which makes it unsuitable for evaluating long-term hydrologic conditions within the Snake River basin. The Cache Creek near Jackson gage has no diversions upstream of the station and has been in continuous operation since 1963. However, it has a small drainage area (approximately 10.6 square miles) and as such, may not be representative of the overall basin. The Buffalo Fork above Lava Creek, near Moran gage has approximately 410 acres of land irrigated upstream of the gage and has been in operation since 1966. Because the irrigated acreage is small relative to the gage's drainage basin (less than one percent), this gage can be considered a natural flow gage. The long term hydrograph of the Buffalo Fork gage is presented in Figure III-2. There is no distinct time frame in which reservoir operations, irrigation, or other water use practices changed significantly within the Snake River basin. Jackson Lake was constructed at the mouth of a natural lake during 1910-11, and enlarged in 1916. The dam was modified in 1991 to correct dam safety deficiencies. This appears to have been accomplished without significantly impacting the reservoir's operations. Therefore, it would have been possible to use a longer study period in the Snake River basin than in the Salt, but in the interest of consistency, 1971-2001 was used for the Snake River as well.
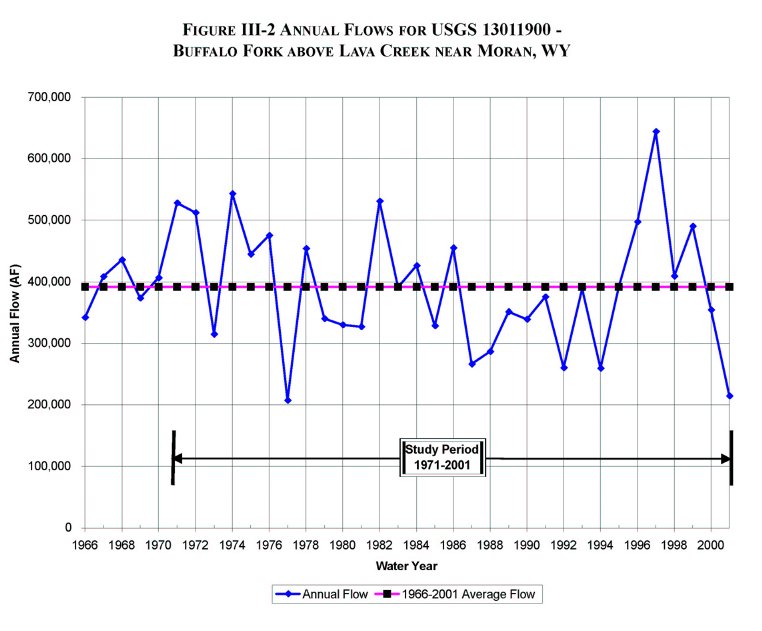
This selection is further supported by an analysis of the characteristics of the long term (1966-2001) record and the proposed study period (1971-2001). This information is tabulated below:
Table III-2
Characteristics of Annual Flow Series for
USGS 13011900 - Buffalo Fork above Lava Creek near Moran, WY
| 1966-2001 | 1971-2001 | |||||
| Mean (AF) | 391,912 | 391,678 | ||||
| Standard Deviation | 98,314 | 105,363 | ||||
| Three highest years | 1997 | 1974 | 1982 | 1997 | 1974 | 1982 |
| Three highest values (AF) | 644,360 | 543,410 | 531,160 | 644,360 | 543,410 | 531,160 |
| Three lowest years | 1977 | 2001 | 1994 | 1977 | 2001 | 1994 |
| Three lowest values (AF) | 207,270 | 214,628 | 259,370 | 207,270 | 214,628 | 259,370 |
Table III-2 shows that means of the two periods are very similar. Standard deviation forthe shorter period is higher, which is to be expected for a smaller sample size. Most notably, the shorter study period includes both the three highest annual flows of record, as well as the three driest.
Indicator Gage Selection:
Approach
The periods of record for gaging stations in the basin were reviewed. Gages that operated throughout the study period were selected for evaluation as indicator gages. These gages were to provide annual flow characterization (average, wet, or dry) that could be applied to portions of the basin where long-term information did not exist. Table III-3 lists the gages that met this initial screening criterion.
Table III-3
Potential Indicator Gages for the Snake and Salt River Basins
| USGS Number |
Station Name | Drainage Area (mi2) |
Period of Record | |
| From | To | |||
| 13011000 | Snake River near Moran, WY | 807.0 | Sep-1903 | Sep-2001 |
| 13011900 | Buffalo Fork above Lava Creek near Moran, WY | 323.0 | Sep-1965 | Sep-2001 |
| 13018300 | Cache Creek near Jackson, WY | 10.6 | Jul-1962 | Sep-2001 |
| 13022500 | Snake River above Reservoir near Alpine, WY | 3465.0 | Jul-1953 | Sep-2001 |
| 13023000 | Greys River above Reservoir near Alpine, WY | 448.0 | Oct-1953 | Sep-2001 |
| 13027500 | Salt River above Reservoir, near Etna, WY | 829.0 | Oct-1953 | Sep-2001 |
The wettest and driest 20 percent of the study period years, on an annual basis, were identified for the gages listed above and are shown in Table III-4. To the extent possible, virgin flow gages, free from transbasin diversion, irrigation depletions, or storage regulation were desirable. Each potential indicator gage is discussed below:
Snake River near Moran, WY - As stated above, gages that are impacted by reservoir operations are not typically selected as an indicator gage. Located immediately below Jackson Lake, this gage reflects reservoir operations and would have required adjustment for change in reservoir storage and reservoir evaporation.
Buffalo Fork above Lava Creek near Moran, WY - This gage is one of the few long term gages that is minimally impacted by man's activities. Located very near the Snake River Moran gage, this gage was expected to reflect the same hydrologic conditions as the Snake River gage, without requiring adjustment. Therefore, average, wet, and dry year determinations from this gage record were applied to gages and headwater inflow nodes for the entire Snake River basin.
Cache Creek near Jackson, WY - Although this gage is also unaffected by man's activities, it was eliminated as an indicator gage because its small drainage area may not be hydrologically representative of larger sub-basins. For example, all other potential index gages have 1987 as a dry year. All except the Greys River have 1988 as a dry year as well. Cache Creek shows neither year as being dry. This gage was not selected as an indicator gage.
Snake River above Reservoir near Alpine, WY - This gage is significantly impacted by man's activities. It reflects reservoir deliveries from Jackson Lake to Palisades Reservoir, as well as all consumptive uses in the Snake River basin. Since it is not a virgin flow gage, it was not selected as an indicator gage.
Greys River above Reservoir, near Alpine, WY - This gage is minimally impacted by man's activities and can be assumed to be a virgin flow gage. Therefore, it was selected as an indicator gage. Average, wet and dry years determined from this gage were used to determine average, wet and dry year flows for the Salt River.
Salt River above Reservoir near Etna, WY - This gage is significantly impacted by man's activities. Since it is not a virgin flow gage, it was not selected as an indicator gage. The Greys River gage will serve as the indicator gage for the Salt River.
Results
In summary, the same two gages that served in determining study period of record became designated indicator gages for the study: Buffalo Fork above Lava Creek near Moran, WY, and Greys River above Reservoir, near Alpine, WY. If there had been additional suitable gages, more indicator gages could have been selected and applied to different sub-areas of the basin, but this was not the case.
Table III-4
Potential Indicator Gages for the Snake and Salt River Basins
| 71 | 72 | 73 | 74 | 75 | 76 | 77 | 78 | 79 | 80 | 81 | 82 | 83 | 84 | 85 | 86 | 87 | 88 | 89 | 90 | 91 | 92 | 93 | 94 | 95 | 96 | 97 | 98 | 99 | 00 | 01 | ||
| 13011000 | Snake River near Moran, WY | W | N | N | W | N | N | D | D | N | N | N | N | N | W | N | W | D | D | D | D | N | N | D | N | N | W | W | N | N | N | N |
| 13011900 | Buffalo Fork above Lava Creek nearMoran,WY | W | W | D | W | N | N | D | N | N | N | N | W | N | N | N | N | D | D | N | N | N | D | N | D | N | W | W | N | N | N | D |
| 13018300 | Cache Creek near Jackson,WY | W | W | N | N | N | N | D | N | N | N | N | N | N | N | D | W | N | N | N | D | D | D | N | D | N | W | W | W | N | N | D |
| 13022500 | Snake River above Reservoir near Alpine, WY | W | W | N | W | N | N | D | N | N | N | D | N | N | N | N | W | D | D | N | N | N | D | N | D | N | W | W | N | N | N | D |
| 13023000 | Greys River above Reservoir near Alpine, WY | W | W | N | W | N | N | D | N | N | N | D | N | W | N | N | W | D | N | N | D | N | D | N | D | N | N | W | N | N | N | D |
| 13027500 | Salt River above Reservoir near Etna, WY | W | W | N | N | N | N | D | N | N | N | D | N | W | W | N | W | D | D | N | D | N | D | N | N | N | N | W | N | N | N | D |
LEGEND
| Dry Year | D |
| Wet Year | W |
| Normal | N |
Gage Filling and Data Extension:
Six gages in the Snake/Salt River basin, including the Greys River gage selected as an indicator gage, have complete records over the study period. The remaining gages required data filling or extension for all or part of the study period.
The mixed-station method described by Alley and Burns (1981) was used to fill the gage records for the Snake/Salt River Basin Models. Ayres Associates developed a Graphical User Interface for the Colorado Decision Support System as a front end to the USGS Mixed Station Model (Colorado River Decision Support System, 2000). This GUI and model were used to perform the data filling and extension.
The mixed station method allows the use of different independent gages to estimate gage flows for different missing members of a monthly time series. The Simple Linear Regression calculation option was used in this study. Accordingly, a simple linear regression model is developed for each independent gage with which a dependent gage has a common period of record. The regression that produces the smallest standard error of prediction (SEP) for a given month is then used to fill the missing data. The mixed station model also allows for either a cyclic or non-cyclic regression. The non-cyclic regression is developed from pairs of data for all months in the common record, and can be applied to any month. The cyclic approach, on the other hand, uses only same-month data pairs to develop a regression model for a given month. A minimum of five concurrent values was the threshold for use of the cyclic option. The smallest standard error is again the criterion to determine whether the cyclic or non-cyclic value is used. To fill gages in the Snake River basin, the set of independent gages was limited to those within the basin and the gage on the Greys River above the Reservoir at Alpine. Due to the fewer potential independent gages in the Salt River basin, all Snake and Salt basin gages were available in the filling of the Salt River basin gages.
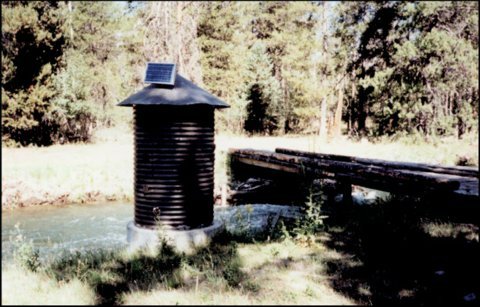
Ungaged Tributary Inflow Estimation:
Several tributaries to the Snake and Salt Rivers, while included in the model network, do not have maintained gaging stations/records. It was therefore necessary to estimate average, wet, and dry year flows for these catchments as inflows to the models. Inflow was estimated for tributaries with sizable diversion rights. Flow contributions from tributaries that do not have modeled diversions were included in the basin gain calculation.
An average annual runoff for these catchments was estimated using regression equations derived for mountainous regions of Wyoming published in USGS WRIR 88-4045 (Lowham, 1988). Derived from several long-term gage records, these regression equations estimate annual average runoff from physical parameters of catchment area and average elevation, or area and average annual precipitation. For this study, the average basin elevation method was used because it is the more basin-specific method. Catchment areas and mean basin elevations were derived from USGS 1:100000 scale topographic maps. The average elevation regression equation is:
Qa=0.0015A^1.01(Elev/1000)^2.88
where,
Qa = annual runoff (cfs)
A = contributing area (mi2)
Elev = average basin elevation (feet)
Once average annual discharge values were calculated, it was necessary to derive monthly runoff values for the entire model period. This was done by correlation to a nearby gaging station with similar catchment characteristics. The derived monthly values are the product of the respective gaged monthly flow multiplied by the ratio of the annual ungaged and gaged discharges. Once the time series of estimated flows was created, average, wet, and dry years flows were calculated based on the respective indicator gage. Table III-5 presents the average annual runoff estimate using the above regression and the corresponding gage used in the distribution of flows for the Salt and Snake River basins.
In some cases the annual flow estimations appeared low in comparison to nearby gaged catchments. In the event that this resulted in shortages to diversions in the spreadsheet models, a second estimation method was used. In this case, a simple area weighting of the monthly flows of a similar watershed in close proximity was used. This was the case in Cedar Creek, Lee Creek, Birch Creek, and Stewart Creek in the Salt River basin. These tributary flows were estimated based on gaged flow in Strawberry Creek.
Summary and Conclusions:
Table III-5 Ungaged Tributary Streamflow Estimates,
Methods of WRIR 88-4045
| Basin | Catchment and Downstream Extent | Drainage Area (sq. mi.) |
Mean Basin Elevation (ft amsl) |
Estimated Annual Runoff (Mean Basin Elevation Method) |
1971-2001 Average Annual Flow at Nearest Recording Gage |
Notes | ||
| Annual Runoff AF |
Annual Runoff AF/sq.mi. |
Gage # | Annual Gaged Runoff AF/sq.mi. |
|||||
| Salt | Spring Creek, S16 T31N R119W | 42.7 | 7532 | 16127 | 378 | 13025500 | 430 | MBE Method used. |
| Stewart Creek, S22 T36N R119W1 | 7.9 | 7201 | 2595 | 330 | 13027000 | 2610 | MBE Method was not used. Estimate based on Strawberry Creek Flows. | |
| Birch Creek, S36 T36N R119W | 2.8 | 8143 | 1270 | 460 | 13027000 | 2610 | MBE Method was not used. Estimate based on Strawberry Creek Flows. | |
| Lee Creek, S12 T35N R119W2 | 6.66 | 8094 | 2976 | 452 | 13027000 | 2610 | MBE Method was not used. Estimate based on Strawberry Creek Flows. | |
| Cedar Creek, S5 T34N R118W | 5.9 | 8216 | 2823 | 476 | 13027000 | 2610 | MBE Method was not used. Estimate based on Strawberry Creek Flows. | |
| Willow Creek near Turnerville, S14 T33N R118W | 14.2 | 8333 | 7126 | 500 | 13027000 | 2610 | MBE Method used. | |
| Dry Creek, S8 T31N R118W | 20.5 | 8326 | 10250 | 501 | 13024500 | 1253 | MBE Method used. | |
| Toms Creek, S6 T32N R119W | 18.8 | 6651 | 4932 | 262 | 13025500 | 430 | MBE Method used. | |
| Stump Creek, S6 T32N R119W1 | 102.7 | 7226 | 34542 | 336 | 13025500 | 430 | MBE Method used. | |
| Snake | Lava Creek, confluence with Buffalo Fork | 27.1 | 7995 | 12096 | 447 | 13011900 | 1213 | MBE Method used. |
| Ditch Creek, confluence with Snake River | 63.2 | 7543 | 24078 | 381 | 13014500 | 634 | MBE Method used. | |
| Spring Creek, S13 T40N R117W | 13.1 | 6440 | 3121 | 238 | 13016450 | 1600 | MBE Method used. | |
| Fish Creek, S11 T41N R117W | 14.5 | 7680 | 5731 | 396 | 13016450 | 1600 | MBE Method used. | |
| Nowlin, Twin and Sheep Creeks, S11 T41N R116W | 32.9 | 7826 | 13846 | 421 | 13018000 | 848 | MBE Method used. | |
| Granite Creek (Hoback), confluence with Little Granite Creek | 61.5 | 8758 | 36003 | 586 | 13019500 | 925 | MBE Method used. | |
| Upper Hoback, confluence of Granite Creek | 367.9 | 7828 | 158831 | 432 | 13019438 | 1146 | MBE Method used. | |
Notes:
1. Calculations based on multiple sub-basins
2. Includes Green and Prater Canyons.
B. SURFACE WATER MODEL
The WWDC has undertaken water basin planning efforts throughout Wyoming. The purpose of the statewide planning process is to provide decision-makers with current, defensible data to allow them to manage water resources for the benefit of all the state's citizens. Spreadsheet models were developed to determine average monthly streamflow in the basin during normal, wet, and dry years. The purpose of these models was to validate existing basin uses, assist in determining the timing and location of water available for future development, and help to assess impacts of future water supply alternatives.
The WWDC specified that the models developed for the various Wyoming river basins be consistent, and use software available to the average citizen. Accordingly, Excel was selected as the platform to support the spreadsheet modeling effort. The spreadsheet model developed for the Bear River, the first basin plan undertaken, became a template for subsequent river basin modeling, and new features were added as unique circumstances were encountered in those basins. In this task, the spreadsheet models used in the Powder/Tongue River Basin Plan were used as a basis and were re-populated with Salt and Snake River node networks and associated data. The existing logic was adequate to express operations in these two basins, and there were no substantial changes to the spreadsheet logic.
This study encompassed creating and calibrating six spreadsheet workbooks, one for each of three hydrologic conditions and two distinct sub-basins:
The three workbooks for each sub-basin are yoked together with a simple menu-driven graphical user interface (GUI), effectively creating two sub-basin models.
Model Overview:
For each Snake/Salt River sub-basin, three models were developed, reflecting each of three hydrologic conditions: dry, normal, and wet year water supply. The spreadsheets each represent one calendar year of flows, on a monthly time step. The modelers relied on historical gage data from 1971 to 2001 to identify the hydrologic conditions for each year in the study period. Because historical diversion data were virtually unavailable for this period, total diversions and resulting return flows were not explicitly included in the spreadsheets. Instead, only the consumptive portion of diversions is taken out of the stream in the models. Thus, streamflow and consumptive use are the basic input data to the model. For these data, average values drawn from the dry, normal, or wet subset of the study period were computed for use in the spreadsheets. The models do not explicitly account for water rights, appropriations, or compact allocations nor is the model operated based on these legal constraints. It is assumed that the limitations that may be placed on users due to water rights restrictions are reflected in the number of irrigating days included in the consumptive use calculations for each of the three hydrologic conditions.
To mathematically represent each sub-basin system, the river system was divided into reaches based primarily upon the location of major tributary confluences. Each reach was then sub-divided by identifying a series of individual nodes representing diversions, tributary confluences, gages, or other significant water resources features. The resulting network is the simplification of the real world that the model represents. Figure III-3 and Figure III-4 present node diagrams of the models developed for the Snake and Salt River sub-basins. The numbered nodes in the diagram represent primarily gage or inflow nodes and confluence nodes; the diagram does not depict diversion nodes.
Virgin flow for each month is supplied to the model by specifying flow at every headwater node, and incremental stream gains and losses within each downstream reach. Where available, upper basin gages were selected as headwater nodes; in their absence, flow at the ungaged headwater point was estimated outside the spreadsheet. For each reach, incremental stream gains (e.g., ungaged tributaries, groundwater inflow, and inflow resulting from human-caused but unmodeled processes) and losses (e.g. seepage, evaporation, and unspecified diversions) are computed by the spreadsheet. These are calculated by adding net modeled effects (diversions) within the reach back into the difference between the upstream and downstream historical gage flows. Stream gains are input at a point in the reach below the gaged or estimated inflow to be available for diversion downstream and losses are subtracted at the bottom of each reach.
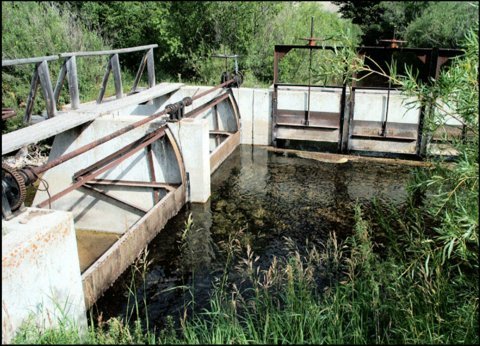
At each node, a water budget computation is completed to determine the amount of water that flows downstream out of the node. The amount of flow available to the next node downstream is the difference between inflow, including upstream inflows, return flows, imports and reach gains, and outflows, including diversions, reach losses and exports. For the Snake/Salt Rivers, imports/exports and return flows are not modeled explicitly, but are set to zero in the water budget calculation. Diverted amounts at diversion nodes are the minimum of demand (consumptive use requirements) and physically available streamflow. Mass balance, or water budget, calculations are repeated for all nodes in a reach.
Model output includes the diversion demand and simulated diversions at each of the diversion points, and streamflow at each of the Snake/Salt River basin nodes. Impacts associated with various water projects can be estimated by changing input data, as decreases in available streamflow or as changes to diversions occur. New storage projects that alter the timing of streamflows or shortages may also be evaluated.
Model Structure and Components:
Each of the Snake/Salt River sub-basin models is a workbook consisting of numerous individual pages (worksheets). Each worksheet is a component of the model and completes a specific task required for execution of the model. There are five basic types of worksheets:
The delineation of a river basin by reaches and nodes is more an art than a science. The choice of nodes must consider the objectives of the study and the available data. It also must contain all the water resources features that govern the operation of the basin. The analysis of results and their adequacy in addressing the objectives of the study are based on the input data and the configuration of the river basin by the computer model.
The following reaches and nodes are contained in each basin model:
Gage Data:
Monthly stream gage data were obtained from the Wyoming Water Resources Data System (WRDS) and the USGS for each of the stream gages used in the model. Linear regression techniques were used to estimate missing values for the many gages that had incomplete records. The Mixed Station Model developed by the USGS was used to perform the regression and data filling. Once the gages were filled in for the study period, monthly values for dry, normal, and wet conditions were averaged from the dry, normal, or wet years of the study period. The dry, normal, and wet years were determined on a sub-basin level from indicator gages in each sub-basin.
Headwater inflow at several ungaged locations is also on the Gage Data worksheet. The model uses estimated flow at ungaged headwater nodes as if they were gages. Several approaches to estimating the flow were used, depending on the complexity of the stream system, availability of data, and reasonableness of fit. For instances where the contributing area above a stream gage was small, diversions above this gage were simply added to the gage to estimate the inflow to the reach. Regression equations for estimating streamflow in Wyoming (Lowham, 1988) were used in estimating the majority of the ungaged basins. However, there where occurrences when this appeared to underestimate streamflow, as indicated by an inability to meet reach diversions. In these cases, a third approach was used where a simple correlation to a nearby gaged basin was made.
Diversion Data:
Surface water diversions in the Snake/Salt River Basin Models are primarily for agricultural use, as municipal use is supplied from groundwater. Because actual diversion records were unavailable in these basins, the model simulates the depletion, that is, the consumptive portion of the diversion, being taken from the stream. Since the model treats this quantity as if it was the diverted amount, and for consistency with other basin spreadsheets, we refer to this information as "diversion data", although it is a depletion quantity.
Data on the diversion data sheet are used to calculate ungaged reach gains and losses, and in some cases, inflow at ungaged headwater nodes. They are also used as the diversion demand in the Reach/Node worksheets.
When diversions are modeled as depletions, overall mass balance of the system is preserved because the inefficient fraction of the diversion is accounted for in the calculated gain/loss term for the reach. For example, consider a ditch located in a reach that gains 1,000 AF one month from the upstream gage to the downstream gage, due to small tributary inflow, groundwater interaction, and other non-point contributions. The ditch diverts 100 AF during the month, consumes 33 AF, returns 40 AF to the stream this month, and returns 27 AF to the stream over the following months. Net depletion to the stream this month is 60 AF, meaning that 940 AF of the reach gain actually shows up at the downstream gage. From the model's perspective, the ditch diverts 33 AF, the reach gain is only 973 AF, and 940 AF of the reach gain shows up at the modeled downstream gage also.
Reach Gain/Loss:
The Snake/Salt River Basin Models simulate major diversions and features of the basins, but minor water features (e.g., small tributaries lacking historical records, diversions for small permitted acreage) are not explicitly included. Some features are aggregated and modeled, while the effects of many others are lumped together using a modeling construct called "ungaged reach gains and losses". These ungaged gains and losses account for all water in the budget that is not explicitly named and can reflect ungaged tributaries, groundwater/surface water interactions, lagged return flows associated with structures that divert consumptive use only in the model, or any other process not explicitly or perfectly modeled.
C. SURFACE WATER AVAILABLITY
Available supply per the spreadsheet model is further subject to compact limitations. The limitation is on basinwide annual use, based on total annual flow at the Idaho state line. As a practical matter, Wyoming's current post-compact diversions of approximately twenty thousand acre-feet can increase by five to ten times before the compact becomes limiting. However, in some parts of the basin, particularly on the Snake River main stem, the compact is much more limiting than the amount of water unappropriated within Wyoming. Furthermore, availability across the entire basin, once the compact is considered, is much less than the combined available supplies of the Snake and Salt Rivers, as defined by the spreadsheet analysis.
Available Flow (Spreadsheet Model Analysis):
Each basin model is divided into a number of reaches, each composed of several nodes, or water balance points. Reaches are typically defined by gages or confluences, and represent tributary basins or subsections of the main stem. An output worksheet in each spreadsheet model summarizes monthly flow at the downstream end of each reach, and provides the basis of this analysis. In general, simulated flow at the reach terminus indicates how much water is physically present, but it may not fully reflect flow that is available for future appropriation. This apparently "available flow" may already be appropriated to a downstream user, may be satisfying an instream flow right, or may result from reservoir storage water being delivered to specific points of diversion downstream. In short, it is important to acknowledge these existing demands when determining available flow.
To determine how much of the physical supply is actually available to future uses, physical supply at several reaches was first adjusted for the following circumstances:
The "available flow" at each point is defined as the minimum of the physical supply value, adjusted to take into account the above-listed instream demands, and "available water" at all downstream reaches. In other words, if adjusted physical supply at the node is the limiting value, then all that water can be removed from the stream without impacting either instream demand at this location, or downstream appropriators. Thus water available for future appropriation must be defined first at the most downstream point, with upstream availability calculated in stream order. These calculations were made on a monthly basis, and annual availability was computed as the sum of monthly available water. Note that calculating annual availability in this way can yield a different value than applying the same logic to annual flows for each reach. The summation of monthly values is more accurate, reflecting constraints of downstream use on a monthly basis.
Jackson Lake Operations:
Jackson Lake is the most upstream main stem feature of the U.S. Bureau of Reclamation's (USBR's) Minidoka Project, which serves irrigators generally located along the Snake River from the Wyoming border to south central Idaho near Twin Falls. The project operates under flexible administration which allows water in storage to be credited to whichever water right has access to it, regardless of where the water is stored. For instance, water generated above Palisades Reservoir can be stored there under the more senior downstream American Falls Reservoir right at the beginning of the runoff season. If and when American Falls successfully fills physically, the water in Palisades reverts to Palisades' right and ownership. The objective is to keep water as high in the basin as possible, thereby maximizing the ability to distribute the supply and minimizing the risk of spilling water from lower reservoirs when upper reservoirs are unable to fill. As another example, Jackson Lake under normal operations matches winter outflow to inflow in order to maintain flood control capacity in the reservoir as well as minimum fish flows in the river below the dam. When water is released while Jackson Lake water rights are in priority the “bypass” may be stored to Jackson Lake’s credit in a downstream reservoir. Another frequent situation occurs when water is delivered from Jackson Lake accounts but physically delivered from a downstream reservoir. Then, water released from Jackson Lake through the subsequent winter may already belong downstream.
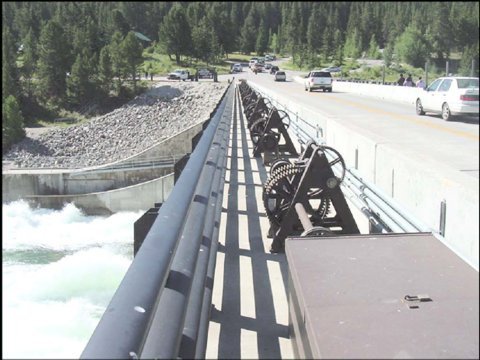
Jackson Lake's operational year begins October 1st. Ideally the lake level is drawn down to 6760.95 feet, an elevation that provides 200,000 af of winter flood control space. Under these circumstances, outflows are set to match inflows, which in an average year might be on the order of 400 or 500 cfs. Wyoming has the option, to utilize its storage water supply from Palisades Reservoir to augment the stream flow, provided there is a commensurate amount of water in Wyoming's pool in Palisades Reservoir. The exchange water is reallocated within Palisades Reservoir to Jackson Lake spaceholders. When spring runoff begins, typically in April, storage begins gradually in accordance with flood control criteria covering both Jackson Lake and Palisades. These criteria take into consideration forecasted inflow, downstream flow limitations, and a specified division of the total required space between Jackson Lake and Palisades Reservoir. Target levels are re-computed daily as the hydrograph rises. The objectives are to maintain adequate space in the reservoirs to control runoff while flow is increasing, and complete filling during the receding limb of the hydrograph. Generally, filling is achieved by mid-June. For the remainder of the water year, the Bureau tries to maintain outflows as uniformly as possible to reach elevation 6760.95 by October 1st. In other words, over this period of a normal or wet year, they are moving inflows plus 200,000 AF down the river. In a dry year, they will move more storage water and Jackson Lake will be below 6760.95 feet on October 1st. In a normal or above normal year, releases rates are dictated by the need to evacuate for winter and spring flood control; in drier years, the rates may be more influenced by downstream demand.
To estimate the amount of water available to a new appropriator on the Snake River main stem, certain assumptions were made regarding normal, wet, and dry year operations. These assumptions are extremely general, since in any given year, circumstances are unique. In particular, antecedent conditions bear greatly on annual operations, as a wet year following a dry or normal year is operationally different from a wet year following a wet year. Furthermore, these generalizations are based on historical practice, which has neither required strict administration of the river nor forced resolution of potential conflicts in perspective between Wyoming and USBR. With that in mind, these scenarios were envisioned for each modeled hydrologic condition:
Normal Year
October -March: all flows immediately below Jackson Lake Dam are project deliveries, and cannot be appropriated.
April - June: filling at both Jackson Lake and Palisades Reservoir is in accordance with flood control operations; outflows from Jackson Lake are excesses that can't be stored, and any amount above the 280 cfs fishery requirement is available to appropriators.
July-September: 200,000/3=66,666 AF/mo of flow below Jackson Lake are project deliveries and cannot be appropriated; the balance is available to appropriators.
Wet Year
October-December: all flows immediately below Jackson Lake Dam are project deliveries, but…
January - March: …as winter progresses it becomes evident that spring flows will be high. Palisades Reservoir no longer stores water coming past Jackson Lake, and it may be appropriated.
April-June: outflows from Jackson Lake are excesses that can't be stored, and any amount above 280 cfs is available to appropriators.
July - September: 200,000/3=66,666 AF/mo of flow below Jackson Lake are project deliveries and cannot be appropriated; the balance is available to appropriators.
Dry Year
October-March: winter outflows from Jackson Lake are project flows, and cannot be appropriated.
April-May: flows immediately below Jackson Lake are excesses that can't be stored; runoff ends early and the reservoir may or may not have achieved fill.June - September: approximately 477,000/4 = 120,000 AF/mo are project deliveries, and the balance can be appropriated. The value 477,000 AF is the sum of 200,000 AF out of the flood control/irrigation pool, and an additional 277,000 AF out of storage. The latter value is the average annual change in storage for four recent dry years (1973, 1977, 1992, 1994).
Results:
Tables III-7 through III-12 summarize available water for the two sub-basins and three hydrologic conditions. The shaded reaches are mainstem reaches. These tables take into account instream flow requirements and Jackson Lake operations as described above, as well as downstream appropriation. For instance, the proposed Salt River instream flow permit is in the most downstream model reach. Even though it has the greatest physical supply, the available supply is limited to flows above 221 cfs (approximately 13,000 AF/mo). Table III-10 shows that available supply is estimated as 20,904 AF in June of a dry year. The available supply at all upstream nodes is likewise limited to 20,904 AF in June; if more water was removed from the river in the upstream reach, the 221 cfs would be violated at the instream flow reach. The available water determination was estimated in a spreadsheet separate from the models themselves.
Table III-6 shows annual available supply at the most downstream node for each basin as follows:
TABLE III-6 ANNUAL AVAILABLE FLOW AT DOWNSTREAM NODE
| Dry Year (AF/yr) | Normal Year (AF/yr) | Wet Year (AF/yr) | |
| Snake River | 1,768,960 | 2,887,630 | 4,158,807 |
| Salt River | 216,249 | 458,153 | 694,494 |
These numbers represent much more water than can actually be developed, because of the Snake River Compact. The next section describes the compact and presents an estimate of the basinwide future development permitted under the compact.
Compact Limitations:
The compact protects all Wyoming rights that existed on July 1, 1949. It further permits Wyoming to divert, for new development post-1949, 4% of the Wyoming-Idaho state line flow of the Snake River. Domestic and stock uses are exempt from the limitation, and out-of-basin exports are not permitted without Idaho's permission. Wyoming can develop the first half of the 4% without providing anything additional to Idaho. To develop the second half, however, Wyoming must provide replacement storage space for Idaho's use to the extent of one-third of the second half of the diversions allowed by the Compact. This provision is expected to be addressed by Wyoming's 33,000 acre-foot pool in Palisades Reservoir, at whatever time Wyoming's post-compact use exceeds 2% of the state line flows. To date, this has not happened.
The Snake River Compact does not formally designate a commission as do some western interstate compacts. As a result, Wyoming and Idaho do not meet on a regular basis under the auspices of the compact. As shown later in the report in Table III-13, Wyoming has not yet reached the final 2% of its allocation.
For this study, an estimate was made of compact limitations on future development under the three hydrologic conditions. This approach is appropriate because the Compact does not refer to rolling average limitations that would permit average limits in years of less-than-average supply. The first step was to estimate the amount of post-compact use during the study period. This was done by assuming that the fraction of post-1949 adjudicated rights among all adjudicated rights also represents the amount of post-compact use among all use. The "post-compact fraction" was determined to be 4 percent in the Salt River basin, and 13 percent in the Snake River basin. Actual basis of the computation was adjudicated acres associated with each right. Post-compact depletions for each hydrologic condition were then calculated as the post-compact fraction multiplied by the depletion modeled in each spreadsheet model. Post-compact depletions on the Greys River were assumed to be negligible, as there has been no significant development in the basin over the last five decades.
State line flow was calculated next for each hydrologic condition, as specified in Article III of the compact. Specifically, the quantity of water crossing the State line was computed as the sum of annual flows for USGS gages Snake River above Reservoir near Alpine (13022500), Salt River above Reservoir near Etna (13027500), and Greys River above Reservoir, near Alpine (13023000). Annual change in storage in reservoirs that serve Idaho (i.e., Jackson Lake) was assumed to be zero in normal and wet years, and -277,000 acre-feet in dry years. This number is the average of the historical annual change for water years 1973, 1977, 1992, and 1994. (Values for 1987 and 1988 were not representative because of construction on Jackson Lake Dam.) The sum of the terms gage flow, change in storage, and post-compact depletions, is the amount of water to which 4% is applied in order to determine compact limits.
Once the compact limitation was computed, current post-compact diversions needed to be subtracted from the upper limit in order to estimate the remaining diversion allowance. A factor of 3.0 was used to convert depletions to diversions, based on logic implicit in the compact. The compact specifies that pre-compact flow be computed by adding one-third of the post-compact diversions to the state line gage flow; and that Wyoming's replacement duty to Idaho, once the first half of the compact allowance has been used, is one-third of post-compact diversions. These terms indicate that depletion to the river is generally accepted to be one-third of the diversion amount, with the remaining two-thirds of the diversion eventually returning to the stream.
Table III-13 summarizes the computations described above. It shows that the remaining allowable surface diversions from the basin are 90,000 AF/yr, 155,000 AF/yr, and 221,000 AF/yr in dry, normal, and wet years respectively.
Conclusion:
Surface water availability in the Snake and Salt River basins is a matter of physical supply, availability with respect to others' uses, and basinwide compact limits. In both the Salt and Snake basins, a new appropriation in a tributary basin will be limited by local supply, and without storage, may be severely limited in some months of the year. On the other hand, overall water supply in the basin greatly exceeds current use. On the main stems of both rivers, and in the larger tributaries of the Snake, the compact is more limiting than physical supply relative to existing demand. There are locations and months in which the entire annual compact allowance could be diverted within one month. Thus the supply available to any given proposed use varies greatly across the basin, and could be impacted by concurrent development of the compact allowance elsewhere in the basin.
Table III-7
Available Flow for Snake River Basin and Dry Hydrologic Condition
(values in acre-feet)
| Rch | Reach Name | Jan | Feb | Mar | Apr | May | Jun | Jul | Aug | Sep | Oct | Nov | Dec | Annual |
| 1 | Snake River near Moran | 0 | 0 | 0 | 2,705 | 83,502 | 59,095 | 58,458 | 63,011 | 0 | 0 | 0 | 0 | 266,770 |
| 2 | Pacific Creek near Moran | 2,548 | 2,434 | 3,041 | 12,071 | 43,812 | 20,873 | 6,201 | 3,166 | 2,704 | 4,259 | 3,366 | 2,828 | 107,302 |
| 3 | Snake River below Pacific Creek | 3,812 | 3,650 | 3,870 | 16,302 | 131,888 | 81,305 | 67,387 | 67,708 | 4,553 | 5,998 | 4,851 | 4,040 | 395,364 |
| 4 | Buffalo Fork above Lava Creek | 7,409 | 6,494 | 7,353 | 15,560 | 55,594 | 77,825 | 25,091 | 12,691 | 9,617 | 13,226 | 10,041 | 8,268 | 249,169 |
| 5 | Lava Creek | 244 | 214 | 242 | 513 | 2,113 | 2,459 | 743 | 349 | 308 | 436 | 331 | 272 | 8,224 |
| 6 | Buffalo Fork below Lava Creek | 8,012 | 7,367 | 10,175 | 18,902 | 55,594 | 106,193 | 36,420 | 12,997 | 10,093 | 14,711 | 11,221 | 9,275 | 300,962 |
| 7 | Snake River below Buffalo Fork | 11,824 | 11,017 | 14,044 | 35,204 | 187,482 | 187,499 | 103,807 | 80,704 | 14,646 | 20,709 | 16,073 | 13,315 | 696,326 |
| 8 | Spread Creek | 1,057 | 927 | 1,049 | 2,220 | 8,891 | 9,752 | 2,497 | 917 | 1,255 | 1,887 | 1,433 | 1,180 | 33,066 |
| 9 | Snake River below Spread Creek | 17,800 | 16,678 | 18,319 | 43,365 | 214,177 | 202,456 | 116,923 | 87,579 | 23,098 | 29,364 | 23,284 | 19,214 | 812,259 |
| 10 | Ditch Creek | 748 | 641 | 666 | 988 | 4,613 | 2,419 | 607 | 222 | 560 | 985 | 735 | 731 | 13,915 |
| 11 | Snake River below Ditch Creek | 29,446 | 27,805 | 26,130 | 57,514 | 257,909 | 215,401 | 140,255 | 100,389 | 39,569 | 45,339 | 36,820 | 30,399 | 1,006,976 |
| 12 | Gros Ventre River | 10,695 | 9,421 | 11,063 | 15,309 | 65,475 | 40,122 | 13,807 | 9,138 | 8,973 | 15,787 | 11,883 | 11,386 | 223,059 |
| 13 | Snake River between Gros Ventre and Fish Creek | 40,141 | 37,226 | 37,193 | 72,823 | 310,940 | 254,774 | 153,466 | 109,072 | 48,518 | 61,126 | 48,703 | 41,785 | 1,215,767 |
| 14 | Lake Creek | 0 | 0 | 0 | 0 | 4,781 | 9,747 | 3,738 | 1,417 | 0 | 0 | 0 | 0 | 19,682 |
| 15 | Granite Creek | 0 | 0 | 0 | 0 | 4,781 | 5,187 | 1,648 | 389 | 0 | 0 | 0 | 0 | 12,004 |
| 16 | Lake Creek below Granite Creek | 0 | 0 | 0 | 0 | 4,781 | 14,255 | 5,177 | 1,646 | 0 | 0 | 0 | 0 | 25,858 |
| 17 | Fish Creek | 0 | 0 | 0 | 0 | 646 | 982 | 785 | 441 | 0 | 0 | 0 | 0 | 2,854 |
| 18 | Fish Creek below Lake Creek | 0 | 0 | 0 | 0 | 4,781 | 14,255 | 9,291 | 1,765 | 0 | 0 | 0 | 0 | 30,091 |
| 19 | Snake River below Fish Creek | 42,837 | 39,632 | 41,173 | 77,987 | 310,940 | 274,730 | 160,025 | 121,126 | 56,360 | 67,663 | 53,387 | 45,713 | 1,291,572 |
| 20 | Spring Creek | 193 | 248 | 691 | 663 | 170 | 0 | 0 | 372 | 348 | 861 | 672 | 514 | 4,732 |
| 21 | Snake River below Spring Creek | 44,751 | 42,505 | 50,253 | 86,167 | 310,940 | 274,730 | 160,025 | 127,904 | 58,936 | 78,364 | 61,899 | 52,090 | 1,348,564 |
| 22 | Flat Creek | 540 | 474 | 591 | 563 | 4,336 | 4,553 | 2,246 | 1,455 | 1,080 | 1,045 | 728 | 602 | 18,214 |
| 23 | Cache Creek | 446 | 383 | 431 | 646 | 1,341 | 1,093 | 735 | 475 | 402 | 675 | 593 | 532 | 7,751 |
| 24 | Flat Creek below Cache Creek | 3,242 | 3,166 | 3,360 | 3,997 | 5,036 | 4,553 | 4,125 | 2,724 | 2,755 | 4,054 | 3,793 | 3,472 | 44,278 |
| 25 | Snake River below Flat Creek | 47,993 | 45,671 | 53,612 | 90,165 | 310,940 | 274,730 | 160,025 | 130,520 | 61,685 | 82,418 | 65,692 | 55,562 | 1,379,013 |
| 26 | Hoback River | 11,297 | 9,417 | 8,974 | 26,048 | 87,413 | 50,540 | 20,244 | 13,510 | 10,847 | 14,621 | 11,757 | 10,412 | 275,080 |
| 27 | Little Granite Creek | 322 | 279 | 368 | 1,500 | 4,935 | 2,476 | 1,067 | 570 | 408 | 524 | 410 | 369 | 13,227 |
| 28 | Granite Creek | 2,125 | 1,781 | 1,792 | 5,603 | 18,868 | 10,956 | 4,651 | 3,010 | 2,147 | 2,849 | 2,280 | 2,026 | 58,089 |
| 29 | Hoback River below Granite Creek | 13,422 | 11,198 | 10,765 | 31,651 | 106,281 | 61,496 | 24,896 | 16,520 | 12,994 | 17,471 | 14,037 | 12,437 | 333,168 |
| 30 | Snake River below Hoback River | 63,907 | 59,831 | 70,339 | 133,269 | 408,526 | 342,169 | 192,112 | 151,226 | 79,449 | 107,730 | 86,484 | 73,917 | 1,768,960 |
Table III-8
Available Flow for Snake River Basin and Normal Hydrologic Condition
(values in acre-feet)
| Rch | Reach Name | Jan | Feb | Mar | Apr | May | Jun | Jul | Aug | Sep | Oct | Nov | Dec | Annual |
| 1 | Snake River near Moran | 0 | 0 | 0 | 42,162 | 131,888 | 204,061 | 84,674 | 78,272 | 55,388 | 0 | 0 | 0 | 596,444 |
| 2 | Pacific Creek near Moran | 2,686 | 2,673 | 3,487 | 10,715 | 61,683 | 74,049 | 19,878 | 5,942 | 4,204 | 3,839 | 3,255 | 3,010 | 195,422 |
| 3 | Snake River below Pacific Creek | 3,984 | 3,950 | 4,420 | 54,320 | 196,817 | 283,046 | 111,211 | 87,672 | 62,565 | 5,955 | 4,746 | 4,614 | 823,300 |
| 4 | Buffalo Fork above Lava Creek | 7,448 | 6,732 | 7,830 | 13,032 | 59,337 | 130,171 | 82,477 | 26,195 | 15,323 | 13,086 | 9,992 | 8,351 | 379,972 |
| 5 | Lava Creek | 245 | 222 | 258 | 429 | 1,937 | 4,207 | 2,873 | 801 | 500 | 431 | 329 | 275 | 12,508 |
| 6 | Buffalo Fork below Lava Creek | 8,130 | 7,539 | 11,538 | 18,635 | 85,144 | 170,867 | 82,477 | 27,059 | 16,459 | 13,359 | 10,832 | 9,362 | 461,400 |
| 7 | Snake River below Buffalo Fork | 12,115 | 11,489 | 15,958 | 72,956 | 281,961 | 453,913 | 193,688 | 114,731 | 79,024 | 19,313 | 15,578 | 13,976 | 1,284,700 |
| 8 | Spread Creek | 1,063 | 961 | 1,117 | 1,860 | 8,227 | 17,512 | 11,698 | 2,943 | 2,127 | 1,867 | 1,426 | 1,192 | 51,993 |
| 9 | Snake River below Spread Creek | 18,231 | 17,421 | 20,704 | 80,431 | 302,821 | 490,635 | 231,302 | 131,131 | 92,724 | 29,413 | 22,806 | 21,410 | 1,459,031 |
| 10 | Ditch Creek | 748 | 644 | 673 | 1,076 | 6,064 | 6,772 | 2,120 | 839 | 919 | 898 | 738 | 737 | 22,228 |
| 11 | Snake River below Ditch Creek | 30,174 | 29,080 | 29,417 | 93,947 | 336,558 | 539,158 | 289,989 | 161,210 | 119,255 | 48,549 | 36,397 | 35,975 | 1,749,710 |
| 12 | Gros Ventre River | 11,512 | 10,025 | 11,768 | 17,047 | 84,390 | 98,646 | 36,651 | 16,159 | 13,025 | 14,598 | 12,433 | 11,271 | 337,525 |
| 13 | Snake River between Gros Ventre and Fish Creek | 41,686 | 39,105 | 41,185 | 110,994 | 404,331 | 637,204 | 326,011 | 176,944 | 132,260 | 63,147 | 48,830 | 47,246 | 2,068,944 |
| 14 | Lake Creek | 0 | 0 | 0 | 0 | 3,163 | 15,080 | 10,177 | 2,374 | 0 | 0 | 0 | 0 | 30,794 |
| 15 | Granite Creek | 0 | 0 | 0 | 0 | 3,163 | 10,209 | 6,224 | 1,325 | 0 | 0 | 0 | 0 | 20,921 |
| 16 | Lake Creek below Granite Creek | 0 | 0 | 0 | 0 | 3,163 | 21,810 | 16,181 | 2,374 | 0 | 0 | 0 | 0 | 43,527 |
| 17 | Fish Creek | 0 | 0 | 0 | 0 | 566 | 1,400 | 1,211 | 479 | 0 | 0 | 0 | 0 | 3,656 |
| 18 | Fish Creek below Lake Creek | 0 | 0 | 0 | 0 | 3,163 | 21,810 | 17,903 | 2,374 | 0 | 0 | 0 | 0 | 45,249 |
| 19 | Snake River below Fish Creek | 45,175 | 42,162 | 45,895 | 118,362 | 404,331 | 659,592 | 354,498 | 188,852 | 141,081 | 69,232 | 53,991 | 51,077 | 2,174,247 |
| 20 | Spring Creek | 469 | 437 | 898 | 886 | 131 | 307 | 799 | 122 | 225 | 855 | 842 | 450 | 6,422 |
| 21 | Snake River below Spring Creek | 51,028 | 47,692 | 57,889 | 129,120 | 404,331 | 659,592 | 363,563 | 191,425 | 141,306 | 80,008 | 64,944 | 56,509 | 2,247,406 |
| 22 | Flat Creek | 597 | 538 | 570 | 771 | 3,830 | 7,686 | 6,545 | 3,302 | 1,786 | 945 | 725 | 675 | 27,971 |
| 23 | Cache Creek | 455 | 408 | 444 | 625 | 1,644 | 2,736 | 1,568 | 977 | 637 | 631 | 550 | 500 | 11,175 |
| 24 | Flat Creek below Cache Creek | 3,313 | 3,206 | 3,342 | 3,957 | 5,316 | 7,686 | 6,545 | 8,678 | 4,777 | 3,935 | 3,673 | 3,445 | 57,874 |
| 25 | Snake River below Flat Creek | 54,341 | 50,899 | 61,231 | 133,077 | 404,331 | 659,592 | 369,958 | 200,002 | 142,551 | 83,943 | 68,617 | 59,954 | 2,288,496 |
| 26 | Hoback River | 11,284 | 9,433 | 9,621 | 31,621 | 113,844 | 121,631 | 58,311 | 24,211 | 16,015 | 14,710 | 11,352 | 10,578 | 432,610 |
| 27 | Little Granite Creek | 336 | 312 | 431 | 1,828 | 7,557 | 7,478 | 2,579 | 1,027 | 602 | 533 | 441 | 387 | 23,512 |
| 28 | Granite Creek | 2,135 | 1,815 | 1,955 | 6,809 | 25,571 | 26,995 | 12,229 | 5,144 | 3,160 | 2,872 | 2,244 | 2,069 | 92,997 |
| 29 | Hoback River below Granite Creek | 13,419 | 11,248 | 11,576 | 38,429 | 139,415 | 148,626 | 70,540 | 29,354 | 19,175 | 17,582 | 13,597 | 12,647 | 525,607 |
| 30 | Snake River below Hoback River | 68,639 | 63,338 | 78,241 | 186,363 | 549,212 | 802,257 | 452,941 | 241,794 | 172,641 | 108,635 | 87,544 | 76,025 | 2,887,630 |
Table III-9
Available Flow for Snake River Basin and Wet Hydrologic Condition
(values in acre-feet)
| Rch | Reach Name | Jan | Feb | Mar | Apr | May | Jun | Jul | Aug | Sep | Oct | Nov | Dec | Annual |
| 1 | Snake River near Moran | 17,452 | 22,588 | 59,682 | 158,882 | 235,554 | 271,196 | 150,220 | 104,691 | 73,363 | 0 | 0 | 0 | 1,093,627 |
| 2 | Pacific Creek near Moran | 3,039 | 2,976 | 3,847 | 8,237 | 77,163 | 132,916 | 43,183 | 8,144 | 5,287 | 3,883 | 3,306 | 3,306 | 295,286 |
| 3 | Snake River below Pacific Creek | 21,970 | 26,982 | 64,520 | 168,208 | 315,597 | 414,148 | 194,529 | 117,677 | 81,921 | 6,113 | 4,987 | 4,789 | 1,421,442 |
| 4 | Buffalo Fork above Lava Creek | 7,644 | 6,450 | 8,163 | 12,079 | 68,471 | 209,157 | 129,563 | 39,252 | 20,895 | 13,137 | 10,781 | 9,064 | 534,657 |
| 5 | Lava Creek | 252 | 213 | 269 | 398 | 2,236 | 6,814 | 4,181 | 1,239 | 693 | 433 | 355 | 299 | 17,380 |
| 6 | Buffalo Fork below Lava Creek | 8,631 | 7,970 | 12,671 | 16,081 | 97,037 | 247,841 | 167,630 | 39,252 | 20,895 | 13,916 | 11,063 | 9,778 | 652,766 |
| 7 | Snake River below Buffalo Fork | 30,602 | 34,952 | 77,191 | 184,289 | 412,635 | 661,990 | 362,159 | 156,929 | 102,817 | 20,029 | 16,049 | 14,566 | 2,074,207 |
| 8 | Spread Creek | 1,091 | 920 | 1,165 | 1,724 | 9,505 | 28,840 | 17,350 | 4,794 | 2,966 | 1,875 | 1,539 | 1,293 | 73,063 |
| 9 | Snake River below Spread Creek | 37,453 | 41,393 | 82,214 | 190,250 | 433,350 | 729,891 | 383,896 | 180,568 | 118,516 | 30,582 | 24,130 | 21,631 | 2,273,872 |
| 10 | Ditch Creek | 757 | 654 | 684 | 1,146 | 8,298 | 10,295 | 4,152 | 1,202 | 1,136 | 909 | 748 | 738 | 30,718 |
| 11 | Snake River below Ditch Creek | 50,971 | 54,276 | 91,446 | 200,782 | 466,132 | 825,970 | 396,928 | 222,926 | 147,838 | 50,714 | 39,372 | 35,154 | 2,582,509 |
| 12 | Gros Ventre River | 12,507 | 10,519 | 12,589 | 19,456 | 115,267 | 147,528 | 69,706 | 21,015 | 15,992 | 14,911 | 13,236 | 12,807 | 465,532 |
| 13 | Snake River between Gros Ventre and Fish Creek | 63,478 | 64,795 | 104,035 | 220,238 | 581,141 | 972,942 | 466,012 | 243,502 | 163,814 | 65,625 | 52,608 | 47,961 | 3,046,150 |
| 14 | Lake Creek | 0 | 0 | 0 | 0 | 5,512 | 25,624 | 14,540 | 3,478 | 859 | 0 | 0 | 0 | 50,012 |
| 15 | Granite Creek | 0 | 0 | 0 | 0 | 4,639 | 16,238 | 9,019 | 1,849 | 859 | 0 | 0 | 0 | 32,603 |
| 16 | Lake Creek below Granite Creek | 0 | 0 | 0 | 0 | 5,512 | 25,624 | 21,655 | 4,742 | 859 | 0 | 0 | 0 | 58,392 |
| 17 | Fish Creek | 0 | 0 | 0 | 0 | 678 | 1,603 | 1,402 | 595 | 489 | 0 | 0 | 0 | 4,767 |
| 18 | Fish Creek below Lake Creek | 0 | 0 | 0 | 0 | 5,512 | 25,624 | 21,655 | 4,742 | 859 | 0 | 0 | 0 | 58,392 |
| 19 | Snake River below Fish Creek | 67,997 | 68,313 | 109,452 | 231,611 | 581,576 | 1,007,756 | 502,480 | 257,298 | 173,592 | 72,591 | 58,493 | 53,258 | 3,184,417 |
| 20 | Spring Creek | 764 | 561 | 1,126 | 1,445 | 173 | 635 | 2,534 | 0 | 254 | 929 | 1,066 | 959 | 10,447 |
| 21 | Snake River below Spring Creek | 77,989 | 75,578 | 124,677 | 249,403 | 581,576 | 1,010,854 | 535,061 | 257,298 | 173,847 | 84,168 | 72,618 | 65,964 | 3,309,034 |
| 22 | Flat Creek | 557 | 471 | 594 | 1,230 | 4,753 | 10,703 | 7,165 | 4,220 | 2,372 | 949 | 781 | 659 | 34,455 |
| 23 | Cache Creek | 508 | 446 | 476 | 595 | 2,188 | 4,791 | 2,050 | 1,282 | 811 | 669 | 577 | 546 | 14,940 |
| 24 | Flat Creek below Cache Creek | 3,236 | 3,095 | 3,289 | 4,063 | 5,960 | 10,703 | 7,165 | 11,375 | 5,004 | 3,726 | 3,542 | 3,384 | 64,543 |
| 25 | Snake River below Flat Creek | 81,225 | 78,674 | 127,966 | 253,465 | 581,576 | 1,021,425 | 542,079 | 259,346 | 176,207 | 87,894 | 76,160 | 69,349 | 3,355,366 |
| 26 | Hoback River | 11,415 | 9,541 | 10,132 | 35,372 | 158,232 | 181,502 | 78,499 | 31,976 | 18,600 | 15,082 | 11,461 | 11,046 | 572,859 |
| 27 | Little Granite Creek | 352 | 318 | 476 | 2,066 | 11,670 | 15,009 | 3,499 | 1,187 | 707 | 542 | 480 | 429 | 36,734 |
| 28 | Granite Creek | 2,171 | 1,838 | 2,079 | 7,635 | 36,582 | 43,639 | 16,342 | 6,556 | 3,673 | 2,941 | 2,298 | 2,183 | 127,937 |
| 29 | Hoback River below Granite Creek | 13,587 | 11,378 | 12,211 | 43,008 | 194,814 | 225,142 | 94,841 | 38,532 | 22,273 | 18,023 | 13,759 | 13,229 | 700,796 |
| 30 | Snake River below Hoback River | 96,597 | 91,073 | 146,069 | 304,925 | 787,383 | 1,254,196 | 656,220 | 314,777 | 216,648 | 110,129 | 94,621 | 86,169 | 4,158,807 |
Table III-10
Available Flow for Salt River Basin and Dry Hydrologic Condition
(values in acre-feet)
| Rch | Reach Name | Jan | Feb | Mar | Apr | May | Jun | Jul | Aug | Sep | Oct | Nov | Dec | Annual |
| 1 | Salt River near Smoot | 334 | 264 | 537 | 1,526 | 6,623 | 6,854 | 3,331 | 2,460 | 1,616 | 811 | 490 | 401 | 25,247 |
| 2 | Cottonwood Creek near Smoot | 1,043 | 842 | 836 | 1,628 | 3,415 | 2,408 | 1,193 | 1,417 | 1,331 | 1,312 | 1,151 | 1,088 | 17,664 |
| 3 | Salt River below Cottonwood Creek Confluence | 1,377 | 1,106 | 1,374 | 3,201 | 13,365 | 15,752 | 8,144 | 6,493 | 4,378 | 2,258 | 1,641 | 1,489 | 60,577 |
| 4 | Dry Creek near Afton | 324 | 262 | 260 | 502 | 962 | 0 | 0 | 203 | 380 | 408 | 358 | 338 | 3,997 |
| 5 | Salt River below Dry Creek Confluence | 1,701 | 1,368 | 1,634 | 3,734 | 16,514 | 19,876 | 10,413 | 8,376 | 5,700 | 2,756 | 1,999 | 1,828 | 75,897 |
| 6 | Swift Creek near Afton | 2,006 | 1,798 | 2,012 | 2,850 | 6,458 | 7,275 | 2,903 | 2,388 | 2,395 | 3,109 | 2,343 | 2,290 | 37,827 |
| 7 | Salt River below Swift Creek Confluence | 3,707 | 3,166 | 3,646 | 6,612 | 24,991 | 20,904 | 11,357 | 9,052 | 8,965 | 5,946 | 4,342 | 4,118 | 106,805 |
| 8 | Spring Creek (trib to Crow Creek) | 826 | 614 | 858 | 1,173 | 1,112 | 988 | 842 | 825 | 664 | 930 | 921 | 784 | 10,536 |
| 9 | Crow Creek near Fairview | 2,529 | 1,879 | 2,628 | 3,595 | 3,438 | 3,285 | 2,768 | 2,608 | 2,045 | 2,848 | 2,820 | 2,402 | 32,844 |
| 10 | Crow Creek below Spring Creek Confluence | 3,355 | 2,493 | 3,485 | 4,801 | 7,148 | 8,417 | 5,718 | 5,222 | 3,841 | 3,890 | 3,740 | 3,186 | 55,298 |
| 11 | Salt River below Crow Creek Confluence | 7,062 | 5,659 | 7,132 | 11,413 | 28,521 | 20,904 | 11,357 | 9,052 | 11,235 | 9,836 | 8,082 | 7,304 | 137,555 |
| 12 | Stump Creek | 1,769 | 1,314 | 1,837 | 2,508 | 2,248 | 1,078 | 1,054 | 1,449 | 1,377 | 1,992 | 1,972 | 1,680 | 20,278 |
| 13 | Salt River below Stump Creek | 8,152 | 6,794 | 7,975 | 13,942 | 28,521 | 20,904 | 11,357 | 9,052 | 11,235 | 11,910 | 9,956 | 8,983 | 148,781 |
| 14 | Toms Creek | 253 | 188 | 262 | 356 | 282 | 0 | 0 | 114 | 183 | 284 | 282 | 240 | 2,444 |
| 15 | Salt River below Toms Creek | 8,152 | 6,794 | 7,975 | 14,364 | 28,521 | 20,904 | 11,357 | 9,052 | 11,235 | 12,381 | 9,956 | 9,064 | 149,754 |
| 16 | Willow Creek | 479 | 459 | 449 | 406 | 3,276 | 4,955 | 2,786 | 2,398 | 1,527 | 605 | 469 | 478 | 18,286 |
| 17 | Salt River below Willow Creek Confluence | 8,152 | 6,794 | 7,975 | 14,786 | 28,521 | 20,904 | 11,357 | 9,052 | 11,235 | 13,032 | 9,956 | 9,064 | 150,826 |
| 18 | Strawberry Creek near Bedford | 3,733 | 3,584 | 3,500 | 2,858 | 4,312 | 2,216 | 2,208 | 3,341 | 2,797 | 3,850 | 3,658 | 3,727 | 39,784 |
| 19 | Salt River below Strawberry Creek Confluence | 13,834 | 11,524 | 13,846 | 20,843 | 28,521 | 20,904 | 11,357 | 9,052 | 11,235 | 20,078 | 16,655 | 15,304 | 193,153 |
| 20 | Cedar Creek | 1,039 | 998 | 974 | 796 | 1,214 | 911 | 821 | 1,012 | 786 | 1,072 | 1,018 | 1,038 | 11,680 |
| 21 | Salt River below Cedar Creek Confluence | 13,956 | 11,524 | 15,801 | 24,533 | 28,521 | 20,904 | 11,357 | 9,052 | 11,235 | 24,041 | 20,425 | 18,215 | 209,565 |
| 22 | Prater Canyon, Green Canyon, and Lee Creek | 1,155 | 1,109 | 1,083 | 884 | 1,364 | 1,317 | 1,126 | 1,210 | 881 | 1,191 | 1,132 | 1,153 | 13,605 |
| 23 | Salt River below Lee Creek Confluence | 13,956 | 11,524 | 15,801 | 26,641 | 28,521 | 20,904 | 11,357 | 9,052 | 11,235 | 26,501 | 22,542 | 18,215 | 216,249 |
| 24 | Birch Creek | 484 | 464 | 454 | 370 | 552 | 139 | 182 | 391 | 359 | 499 | 474 | 483 | 4,850 |
| 25 | Salt River below Birch Creek Confluence | 13,956 | 11,524 | 15,801 | 26,641 | 28,521 | 20,904 | 11,357 | 9,052 | 11,235 | 26,501 | 22,542 | 18,215 | 216,249 |
| 26 | Stewart Creek | 1,379 | 1,324 | 1,293 | 1,056 | 1,628 | 1,563 | 1,339 | 1,442 | 1,052 | 1,422 | 1,352 | 1,377 | 16,228 |
| 27 | Salt River below Stewart Creek Confluence | 13,956 | 11,524 | 15,801 | 26,641 | 28,521 | 20,904 | 11,357 | 9,052 | 11,235 | 26,501 | 22,542 | 18,215 | 216,249 |
Table III-11
Available Flow for Salt River Basin and Normal Hydrologic Condition
(values in acre-feet)
| Rch | Reach Name | Jan | Feb | Mar | Apr | May | Jun | Jul | Aug | Sep | Oct | Nov | Dec | Annual |
| 1 | Salt River near Smoot | 361 | 310 | 585 | 1,789 | 9,792 | 15,856 | 8,696 | 3,156 | 1,986 | 879 | 524 | 416 | 44,352 |
| 2 | Cottonwood Creek near Smoot | 1,030 | 847 | 854 | 1,351 | 4,918 | 7,870 | 4,646 | 2,208 | 1,898 | 1,298 | 1,152 | 1,114 | 29,186 |
| 3 | Salt River below Cottonwood Creek Confluence | 1,391 | 1,157 | 1,447 | 3,165 | 16,750 | 33,473 | 19,833 | 8,133 | 5,202 | 2,376 | 1,676 | 1,530 | 96,134 |
| 4 | Dry Creek near Afton | 320 | 263 | 266 | 420 | 1,287 | 1,784 | 791 | 368 | 572 | 404 | 358 | 346 | 7,180 |
| 5 | Salt River below Dry Creek Confluence | 1,712 | 1,421 | 1,717 | 3,601 | 19,333 | 41,571 | 24,780 | 10,263 | 6,645 | 2,912 | 2,035 | 1,876 | 117,866 |
| 6 | Swift Creek near Afton | 1,960 | 1,835 | 2,012 | 2,446 | 6,351 | 13,950 | 10,824 | 4,460 | 3,741 | 2,901 | 2,339 | 2,270 | 55,090 |
| 7 | Salt River below Swift Creek Confluence | 3,672 | 3,256 | 3,733 | 6,062 | 26,923 | 61,439 | 39,545 | 16,404 | 11,186 | 5,934 | 4,374 | 4,147 | 186,676 |
| 8 | Spring Creek (trib to Crow Creek) | 807 | 659 | 867 | 1,690 | 3,736 | 2,237 | 1,251 | 1,049 | 910 | 875 | 896 | 779 | 15,757 |
| 9 | Crow Creek near Fairview | 2,472 | 2,018 | 2,657 | 5,175 | 11,525 | 7,076 | 4,051 | 3,319 | 2,793 | 2,681 | 2,743 | 2,387 | 48,897 |
| 10 | Crow Creek below Spring Creek Confluence | 3,279 | 2,677 | 3,530 | 6,885 | 16,566 | 16,333 | 9,641 | 6,155 | 4,767 | 3,722 | 3,639 | 3,166 | 80,360 |
| 11 | Salt River below Crow Creek Confluence | 6,951 | 5,933 | 7,264 | 12,948 | 43,441 | 77,641 | 48,683 | 22,496 | 15,949 | 9,655 | 8,012 | 7,313 | 266,287 |
| 12 | Stump Creek | 1,729 | 1,411 | 1,858 | 3,619 | 7,678 | 3,904 | 1,804 | 1,819 | 1,925 | 1,875 | 1,918 | 1,669 | 31,211 |
| 13 | Salt River below Stump Creek | 7,960 | 6,689 | 9,126 | 16,582 | 51,955 | 86,361 | 48,683 | 25,468 | 18,645 | 11,651 | 9,931 | 8,734 | 301,786 |
| 14 | Toms Creek | 247 | 202 | 265 | 517 | 1,001 | 297 | 1 | 135 | 268 | 268 | 274 | 238 | 3,713 |
| 15 | Salt River below Toms Creek | 7,960 | 6,689 | 9,401 | 17,132 | 55,783 | 91,501 | 48,683 | 27,826 | 20,739 | 12,195 | 9,976 | 8,734 | 316,620 |
| 16 | Willow Creek | 475 | 471 | 503 | 479 | 2,241 | 8,314 | 5,353 | 2,577 | 1,539 | 650 | 468 | 471 | 23,542 |
| 17 | Salt River below Willow Creek Confluence | 7,960 | 6,689 | 9,907 | 17,620 | 58,439 | 91,501 | 48,683 | 27,826 | 22,706 | 12,912 | 9,976 | 8,734 | 322,953 |
| 18 | Strawberry Creek near Bedford | 3,707 | 3,671 | 3,882 | 3,580 | 4,995 | 6,168 | 4,537 | 3,939 | 3,525 | 3,787 | 3,652 | 3,677 | 49,121 |
| 19 | Salt River below Strawberry Creek Confluence | 13,713 | 12,141 | 15,766 | 27,053 | 72,162 | 91,501 | 48,683 | 27,826 | 27,089 | 19,576 | 16,513 | 14,935 | 386,957 |
| 20 | Cedar Creek | 1,032 | 1,022 | 1,081 | 997 | 1,428 | 1,948 | 1,516 | 1,190 | 983 | 1,054 | 1,017 | 1,024 | 14,291 |
| 21 | Salt River below Cedar Creek Confluence | 14,284 | 12,673 | 16,183 | 33,345 | 81,781 | 91,501 | 48,683 | 27,826 | 27,089 | 23,232 | 20,141 | 17,844 | 414,582 |
| 22 | Prater Canyon, Green Canyon, and Lee Creek | 1,147 | 1,136 | 1,201 | 1,108 | 1,625 | 2,402 | 1,947 | 1,418 | 1,095 | 1,172 | 1,130 | 1,137 | 16,518 |
| 23 | Salt River below Lee Creek Confluence | 14,284 | 12,673 | 16,183 | 46,777 | 106,362 | 91,501 | 48,683 | 27,826 | 27,089 | 24,348 | 21,621 | 17,844 | 455,190 |
| 24 | Birch Creek | 480 | 476 | 503 | 464 | 628 | 683 | 460 | 464 | 456 | 491 | 473 | 476 | 6,055 |
| 25 | Salt River below Birch Creek Confluence | 14,284 | 12,673 | 16,183 | 46,777 | 109,325 | 91,501 | 48,683 | 27,826 | 27,089 | 24,348 | 21,621 | 17,844 | 458,153 |
| 26 | Stewart Creek | 1,370 | 1,356 | 1,434 | 1,323 | 1,939 | 2,862 | 2,317 | 1,690 | 1,307 | 1,399 | 1,349 | 1,358 | 19,707 |
| 27 | Salt River below Stewart Creek Confluence | 14,284 | 12,673 | 16,183 | 46,777 | 109,325 | 91,501 | 48,683 | 27,826 | 27,089 | 24,348 | 21,621 | 17,844 | 458,153 |
Table III-12
Available Flow for Salt River Basin and Wet Hydrologic Condition
(values in acre-feet)
| Rch | Reach Name | Jan | Feb | Mar | Apr | May | Jun | Jul | Aug | Sep | Oct | Nov | Dec | Annual |
| 1 | Salt River near Smoot | 510 | 375 | 1,169 | 3,241 | 11,833 | 31,661 | 13,915 | 4,256 | 2,715 | 1,071 | 602 | 529 | 71,877 |
| 2 | Cottonwood Creek near Smoot | 1,087 | 847 | 875 | 1,559 | 5,529 | 11,897 | 6,169 | 2,759 | 2,022 | 1,522 | 1,281 | 1,160 | 36,706 |
| 3 | Salt River below Cottonwood Creek Confluence | 1,597 | 1,222 | 2,577 | 5,611 | 19,687 | 62,036 | 31,159 | 10,833 | 6,573 | 2,897 | 1,883 | 1,690 | 147,764 |
| 4 | Dry Creek near Afton | 338 | 263 | 272 | 485 | 1,480 | 2,954 | 1,100 | 512 | 606 | 473 | 398 | 361 | 9,242 |
| 5 | Salt River below Dry Creek Confluence | 1,935 | 1,485 | 3,203 | 6,634 | 22,654 | 77,085 | 39,419 | 13,797 | 8,394 | 3,572 | 2,281 | 2,050 | 182,510 |
| 6 | Swift Creek near Afton | 2,032 | 1,775 | 2,152 | 2,577 | 6,923 | 20,242 | 13,621 | 5,645 | 4,385 | 3,363 | 2,515 | 2,417 | 67,650 |
| 7 | Salt River below Swift Creek Confluence | 3,967 | 3,261 | 5,680 | 9,704 | 30,988 | 108,547 | 59,764 | 21,760 | 13,894 | 7,120 | 4,796 | 4,468 | 273,948 |
| 8 | Spring Creek (trib to Crow Creek) | 1,063 | 812 | 1,199 | 2,356 | 5,744 | 3,825 | 1,551 | 1,110 | 958 | 1,061 | 1,060 | 947 | 21,687 |
| 9 | Crow Creek near Fairview | 3,255 | 2,488 | 3,673 | 7,217 | 17,672 | 11,965 | 5,025 | 3,515 | 2,943 | 3,250 | 3,248 | 2,902 | 67,151 |
| 10 | Crow Creek below Spring Creek Confluence | 4,317 | 3,300 | 5,314 | 10,245 | 24,962 | 29,914 | 14,450 | 7,237 | 5,387 | 4,563 | 4,308 | 3,849 | 117,847 |
| 11 | Salt River below Crow Creek Confluence | 8,284 | 6,218 | 10,994 | 19,949 | 55,903 | 138,312 | 69,983 | 28,928 | 19,276 | 11,683 | 9,105 | 8,317 | 386,953 |
| 12 | Stump Creek | 2,276 | 1,740 | 2,568 | 5,047 | 11,983 | 7,194 | 2,226 | 1,913 | 2,023 | 2,272 | 2,271 | 2,029 | 43,542 |
| 13 | Salt River below Stump Creek | 10,560 | 6,218 | 13,886 | 25,489 | 68,900 | 155,487 | 69,983 | 32,584 | 22,377 | 14,140 | 11,376 | 10,346 | 441,348 |
| 14 | Toms Creek | 325 | 248 | 367 | 721 | 1,617 | 735 | 0 | 137 | 280 | 324 | 324 | 290 | 5,368 |
| 15 | Salt River below Toms Creek | 10,708 | 6,218 | 14,993 | 27,333 | 73,738 | 160,616 | 69,983 | 38,012 | 25,202 | 14,886 | 11,700 | 10,636 | 464,025 |
| 16 | Willow Creek | 484 | 481 | 971 | 1,228 | 2,608 | 15,607 | 9,491 | 3,636 | 2,012 | 753 | 473 | 477 | 38,223 |
| 17 | Salt River below Willow Creek Confluence | 10,708 | 6,218 | 16,143 | 28,833 | 76,916 | 160,616 | 69,983 | 40,609 | 27,830 | 15,742 | 11,836 | 10,779 | 476,214 |
| 18 | Strawberry Creek near Bedford | 3,778 | 3,754 | 4,126 | 4,336 | 5,861 | 7,491 | 6,252 | 4,879 | 3,832 | 3,912 | 3,694 | 3,724 | 55,639 |
| 19 | Salt River below Strawberry Creek Confluence | 16,743 | 12,476 | 23,131 | 41,409 | 97,910 | 160,616 | 69,983 | 40,609 | 34,032 | 23,190 | 19,082 | 17,574 | 556,756 |
| 20 | Cedar Creek | 1,052 | 1,045 | 1,149 | 1,207 | 1,661 | 2,362 | 1,944 | 1,422 | 1,067 | 1,089 | 1,028 | 1,037 | 16,062 |
| 21 | Salt River below Cedar Creek Confluence | 18,443 | 15,786 | 26,869 | 50,070 | 113,491 | 160,616 | 69,983 | 40,609 | 36,782 | 27,479 | 23,323 | 21,389 | 604,841 |
| 22 | Prater Canyon, Green Canyon, and Lee Creek | 1,169 | 1,161 | 1,276 | 1,342 | 1,875 | 2,911 | 2,370 | 1,646 | 1,186 | 1,210 | 1,143 | 1,152 | 18,441 |
| 23 | Salt River below Lee Creek Confluence | 18,443 | 16,680 | 28,198 | 72,108 | 154,179 | 160,616 | 69,983 | 40,609 | 36,782 | 31,369 | 27,535 | 23,240 | 679,743 |
| 24 | Birch Creek | 490 | 486 | 535 | 562 | 745 | 831 | 708 | 600 | 497 | 507 | 479 | 483 | 6,921 |
| 25 | Salt River below Birch Creek Confluence | 18,443 | 16,680 | 28,198 | 73,774 | 167,264 | 160,616 | 69,983 | 40,609 | 36,782 | 31,369 | 27,535 | 23,240 | 694,494 |
| 26 | Stewart Creek | 1,396 | 1,387 | 1,524 | 1,602 | 2,239 | 3,467 | 2,824 | 1,963 | 1,416 | 1,445 | 1,365 | 1,376 | 22,005 |
| 27 | Salt River below Stewart Creek Confluence | 18,443 | 16,680 | 28,198 | 73,774 | 167,264 | 160,616 | 69,983 | 40,609 | 36,782 | 31,369 | 27,535 | 23,240 | 694,494 |
Table III-13
Summary of Compact Limits to Surface Water Development
(values in acre-feet)
| Sub-basin | Gage flow | Depletions | Post-compact fraction | Post-compact depletions | ΔStorage for Idaho use | Subject to Compact allocation |
| DRY YEAR | ||||||
| Snake | 2,420,790 | 41,607 | 0.1300 | 5,409 | -277,000 | 2,149,199 |
| Salt | 376,250 | 54,547 | 0.0400 | 2,182 | 0 | 378,432 |
| Greys | 288,336 | 0 | N/a | 0 | 0 | 288,336 |
|
| NORMAL YEAR | ||||||
| Snake | 3,303,870 | 37,789 | 0.13 | 4,913 | 0 | 3,308,783 |
| Salt | 618,154 | 58,502 | 0.04 | 2,340 | 0 | 620,494 |
| Greys | 478,255 | 0 | N/a | 0 | 0 | 478,225 |
|
| WET YEAR | ||||||
| Snake | 4,547,986 | 37,664 | 0.13 | 4,896 | 0 | 4,552,882 |
| Salt | 854,495 | 61,015 | 0.04 | 2,441 | 0 | 856,936 |
| Greys | 671,481 | 0 | N/a | 0 | 0 | 671,481 |
|
D. GROUND WATER DETERMINATION
The Snake/Salt River basin has the most complex geology of any basin in Wyoming. The basin shares with the rest of Wyoming the typical configuration of early Cenozoic-age folding and faulting controlling the depth and fracturing of bedrock, with the accumulation of relatively permeable Quaternary-age deposits along stream systems. Superimposed on this geology, however, are the volcanic and glacial deposits associated with the Yellowstone/Absaroka area in the north and the large-scale, low angle thrust faulting of the Overthrust Belt in the south. Figure III-5 provides an overview of the areal distribution of the geologic units of the Snake/Salt River basin, aggregated from the more detailed mapping by Love and Christiansen, 1985.
Stratigraphy and Structure:
Figure III-5 includes an overview of mapped faults in the Snake/Salt River basin (from Lines & Glass, 1975 and Cox, 1976). The critical assessment of these geologic folds and smaller-scale, local structural features will commonly be an important part of any successful ground water development project in the bedrock aquifers.
The most productive aquifer in the Snake/Salt River basin is formed by the thick alluvial deposits along the Snake River. Similarly productive materials, but of lesser thickness, occur along most rivers and streams of the study area. These are the sands, gravels, silts, and clays deposited relatively recently (geologically). (The Quaternary is the most recent geologic period.) Because of the major importance of alluvial aquifers in the study area, and the particularly productive nature of these deposits along the Snake River west of Jackson, Figure III-5 includes a subdivision termed the "Main Snake River Aquifer". Outside of the latter deposits, the alluvial materials are of more variable, and commonly lesser, permeability and thickness.
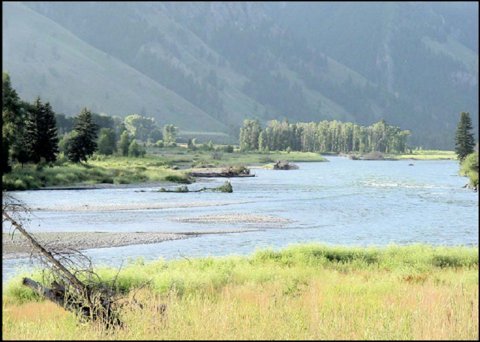
In the South Park area (from Jackson and Wilson to the narrowing of the valley 7 miles south), Love and Albee (1972) described the main aquifer: "Valley and stream deposits of gravel with lesser amounts of sand, silt, and clay. Surface is gravel underlain by thin discontinuous deposits of sand and silt." They mapped the remaining Quaternary alluvial deposits as "Flood-plain deposits; sand, silt, clay, and minor lenses of gravel; lesser amount of gravel at surface distinguishes these deposits." Nolan and Miller (1995) term the alluvial deposits occupying the main Snake River floodplain the "Jackson Aquifer" and provide geophysical evidence indicating the aquifer is between 380 feet (Antelope Flats area) and 2,400 feet (Potholes area) thick.
Water-well experience appears to bear out delineation of the Snake River alluvial aquifer within the larger body of Quaternary alluvial deposits. While prolific wells (transmissivities as high as 900,000 gpd/ft) are relatively common in the principal Snake River alluvial aquifer, wells in other areas of the alluvial aquifer are of more variable productivity and problems with sand production are not uncommon. The tested transmissivities of wells in the Rafter J and Melody Ranch areas (along Flat Creek south of Jackson), for example, are between 15,000 and 60,000 gpd/ft. These are still high-permeability deposits in the context of the surrounding bedrock geology, and are fully adequate for most non-agricultural applications, but are distinctly lower in permeability than in the coarser deposits along the Snake River.
"Other Quaternary Deposits" on Figure III-5 consist of a wide variety of glacial drift and outwash, loess, landslide debris and talus, swamp and lake deposits, talus breccia, conglomerate, and volcanic rocks. While these deposits are extraordinarily diverse in terms of their composition, they are grouped together here to reflect a generally lower groundwater production potential than the alluvial deposits discussed above. These deposits are also characterized by extreme heterogeniety. Particularly in deposits of glacial origin, highly-productive lenses of clean gravel may be present alongside dense clays with virtually no water-production potential. Loess deposits tend to be relatively unproductive of groundwater. Talus and landslide deposits, although quite permeable, tend to be relatively shallow and well-drained. Groundwater development in these non-alluvial deposits is best guided by detailed, site-specific investigations, for which the reader is referred to the bibliography and local experience.
In contrast to the Snake River alluvial aquifer, in many areas of the Salt River basin, the alluvium may be of substantial surficial extent, but is relatively thin, and successful wells have had to penetrate the underlying Salt Lake Formation. Contrary to the unfavorable descriptions of this formation provided by the USGS (Miller et al, 1996; Table 12), it has demonstrated quite variable water-bearing characteristics, both in terms of quantity and quality. For example, the spring system supplying the Town of Thayne issues from the Salt Lake Formation beneath a veneer of Quaternary-age alluvium. These springs are reported to flow 2,200 gpm, attributed to fracture enhanced permeability (Lines and Glass, 1975). Exploratory drilling west of this location (near the Town of Thayne) "encountered no significant water bearing formations", whereas a 310-ft. well nearer the springs was judged to be capable of 1,000 gpm (Forsgren Associates,1991).
Similarly, an exploratory well just west of Freedom encountered unacceptable groundwater quality in the Salt Lake Formation (total dissolved solids >1,000 mg/l), but a second well two miles east of Freedom had good quality and a yield of 650 gpm (Forsgren Associates,1991). Evaluation of Salt Lake Formation wells in the Alpine area found specific capacities (gpm per ft of drawdown) varied from over 10 to under 1 over distances of less than a mile. As with the Thayne springs, much of this was attributed to the influence of fracture systems (Sunrise, 1995).
Bedrock aquifers in the Snake/Salt River basin are mainly exposed in the upland areas. Tertiary-age rocks include volcanic deposits and a variety of conglomerate, sandstone, limestone, and mudstone sedimentary rocks. The productivity of these deposits with respect to groundwater varies locally, as a function of variations in texture, thickness, and fracturing. Successful development of useful water supplies, where possible at all, depends upon careful siting and exploration. For example, productive wells at Alpine and the spring system supplying Thayne both discharge water from the Tertiary-age Salt Lake Formation.
Mesozoic-age strata in the Snake/Salt River basin are dominated by thick shale formations. Productive wells have been developed locally from interbedded sandstone and conglomerate strata, but as a general rule these strata are relatively unproductive.
Paleozoic-age rocks consist primarily of thick limestone and sandstone formations. These include the Madison Limestone which is famous for producing high capacity groundwater wells at many Wyoming locations. As with all the other bedrock aquifers, however, the productivity of these strata can be quite site-specific, depending upon local enhancement of permeability through fracturing and variations in composition. Limestone, for example, is virtually impermeable in its native state of deposition. Given the faulting and folding of bedrock in the Snake/Salt River basin, however, and the ability of circulating groundwater to expand permeability through solution, limestone units provide very high groundwater production rates under locally favorable conditions.
Groundwater Circulation:
Hydrology textbooks commonly begin with a diagram of the "hydrologic cycle" that shows the constant passage of water between the atmosphere, the surface, and the subsurface. With the exception of the water associated with the original deposition of each geologic unit (termed "connate" water and generally of very poor quality), groundwater resources are a function of recharge from and discharge to the surface. Groundwater aquifers provide a large storage reservoir filled by infiltration of precipitation, snowmelt, and streamflow. Water moves through this "reservoir" as a function of groundwater elevation gradients and is "released" through discharge to springs, streams, and wells and though uptake and evapotranspiration by vegetation from the root zone. Groundwater quality is controlled by the solubility of the minerals with which it comes in contact as it travels from recharge to discharge and by its residence time in the subsurface. Thus, the surface and groundwater resource is one body of water, moving through the basin at widely different rates, but ultimately dependent upon the same fundamental sources.
As discussed above, groundwater recharge occurs primarily across the upland areas of the Snake/Salt River basin. Figure III-6 (from HA-539) presents this general pattern, which is the same in the northern portion of the study area, as evidenced by the losing and gaining reaches of specific streams. This same pattern is expressed by the general distribution of ephemeral/intermittent streams vs. perennial streams. The former are commonly indicative of surface water flow being lost to groundwater; the latter are sustained by the year-round discharge of groundwater to the stream.
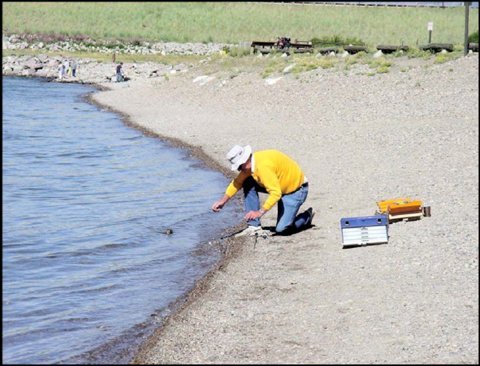
Combining groundwater gradients with permeability data for the alluvial aquifer, groundwater flow velocities on the order of 9 ft/day are indicated for the main Snake River alluvial aquifer (Jorgensen et al., 1999, p. 47). This is quite high, a reflection of the high permeability and abundant recharge to this aquifer. In the areas with a shallower and finer-grained alluvial aquifer and in bedrock aquifers, groundwater flow velocities are orders of magnitude slower. The time of travel from recharge to discharge of groundwater varies from days to years to decades to centuries to millenia, depending on the permeability, elevations, and distances involved (see Heath, 1983 for a general discussion).
Groundwater circulation is also influenced by seasonal and long-term fluctuations in groundwater levels. Figure III-7 presents those locations for which groundwater levels have been measured through the USGS monitoring program. In summary:
| Total number of sites | 308 |
| > 20 individual measurements | 13 (mostly from 1997/98 from the Jackson area) |
| 11 - 20 individual measurements | 19 (mostly from 1993/94 from Star Valley) |
| 3 - 10 individual measurements | 46 |
| 2 individual measurements | 48 |
| 1 individual measurement | 214 |
Those sites for which data have been collected over longer periods of time are most useful in the identification (and discrimination) of long-term and seasonal trends. Unfortunately, there are very few high-quality groundwater level monitoring data from the Snake/Salt River basin over any extended period of time. The most notable exception is the on-going research being conducted by the Wyoming State Engineer's Office in cooperation with Teton County in the "westbank" area (west of the Snake River, west of Jackson) as part of the "Jackson Hole, Wyoming, Environmental Restoration Feasibility Study".
Groundwater Development:
Geology
The geologic distribution of groundwater development is a function of the location of water demands and the availability of groundwater to meet those demands. Fortunately, in the case of the Snake/Salt River basin, these two factors are in rough coincidence, with the most productive aquifers occurring beneath the areas of highest demand, i.e. across the relatively gentle topography and private-land ownership of the floodplains of the Snake and Salt Rivers.
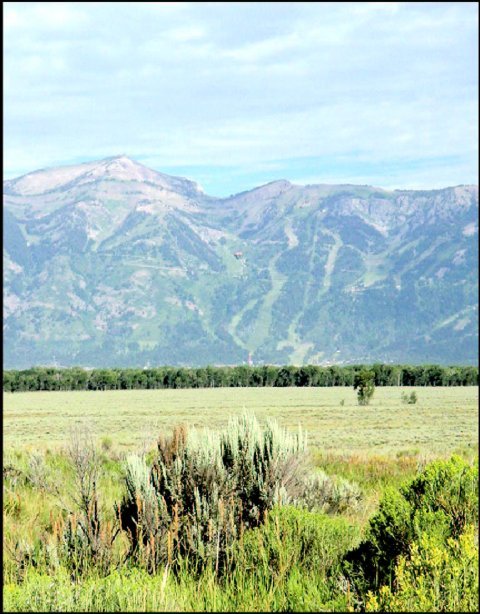
Use Trends
The primary development of groundwater in the Snake/Salt River basin is historically and currently for human consumption and related uses associated with domestic and municipal supplies (including subdivision, commercial, and other uses commonly permitted as "Miscellaneous"). Groundwater supplies the vast majority of these uses - approaching 100%. Although only a tiny proportion of total water use in the basin (approximately 8 % of that estimated for agriculture), this is arguably the most important water resource, as it directly sustains the human population.
From the companion technical memos of the Snake/Salt River Basin Plan, Table III-14 has been compiled:
Table III-14 - Groundwater Consumption in the Snake/Salt River Basin - 2002
| ac- ft/yr | Notes | |
| Public Water Supplies | 8000 | Average per capita “use” and population estimated for the 50 public water supplies in the study area (see Municipal Use Tech Memo), and assuming 50% consumption. |
| Rural Domestic | 1255 | (See Domestic Use Tech Memo) Assuming 50% consumption |
| Industrial | <10 | (See Industrial Use Tech Memo) |
| Agricultural | 650 | Compared with 99,000 acres under irrigation in the study area, there are only 603 acres with original-supply groundwater permits. At the average depletion rate calculated for irrigated acreage under the “wet year” scenario, the indicated groundwater depletion is 650 ac-ft, 86% of which is in the Salt River basin. |
The term "use" appears in many water studies without sufficient distinction between diversions/withdrawals and actual consumption (used up, removed from the local hydrologic system). Table III-14 presents estimates of groundwater consumption, with the understanding that actual withdrawals of groundwater necessary to sustain this consumption may be one or more times the listed quantities.
In the northern portion of the Snake/Salt River basin (i.e. the Jackson area), the great majority of this water is drawn from the alluvial aquifer along the Snake River, Flat Creek, and Fish Creek. In Star Valley, springs issuing from bedrock units (e.g. Madison Limestone, Bighorn Dolomite, Thaynes Limestone, and Twin Creek Limestone) along the east flank of the valley are the major source of groundwater developed by public water supplies. The Salt Lake Formation and the alluvial aquifer beneath the valley floor supplies local domestic wells and has seen substantial recent development to augment municipal supplies.
Table III-15 summarizes groundwater permit data for the Snake/Salt River basin. (The data for this and the remainder of this permit-based discussion comes from the electronic files of the WSEO, data entry current as of May 29, 2002.) Not surprisingly, domestic use dominates on a permit-count basis. Domestic, municipal, and miscellaneous uses, i.e. those representing human consumption, constitute 86% of the groundwater permits issued.
Table III-15 - Groundwater Permit Summary
| ||||||||||||||||||||||||||||||||||||||||
| Data from Wyoming State Engineer's Office files, current as of data entry on 5/29/02; wells with inactive permit status and with zero yields excluded. | ||||||||||||||||||||||||||||||||||||||||
Average well depths and average water levels reflect the relative abundance of developable shallow groundwater in the populated areas of the Snake/Salt River basin. The somewhat deeper average for municipal wells likely reflects the higher production requirements and the financial ability to penetrate more of the aquifer for additional protection from declining water levels and surface contamination.
Figure III-8 presents the temporal trend in groundwater development in the Snake/Salt River basin over the 20th century. From minimal development prior to the 1960's, groundwater permits have grown to over 4,000, with a cumulative permitted yield of 155,000 gpm. While this yield calculates to 250,000 ac-ft per year, the actual use of groundwater is far less. Few wells pump at their full permitted capacity more than a small percentage of the time. Following a decline in the pace of development in the mid-1980's, there have been 120 - 140 new domestic well permits issued each year throughout the 1990's. By county (within the Snake/Salt River basin) the last decade breaks down as:
| Teton County | 60 - 80 permits per year |
| Lincoln County | 45 - 55 permits per year |
| Sublette County | 6 - 8 permits per year |
The pace of stock, irrigation, and municipal groundwater development has remained relatively constant over the last 30 years, with an average of 6, 2, and 0.4 permits annually. The most recent permit issued for industrial groundwater use was in 1982. While this suggests no trend towards increased use, future groundwater development in this sector will be dependent upon the types of activity that may develop.
In summary, it is clear that the trend in groundwater development in the Snake/Salt River basin is dominated by additional, individual domestic wells. This trend is expected to continue as rural subdivisions proliferate in both the Jackson and Star Valley areas. Growth on the order of 100 to 150 wells per year are indicated, representing additional groundwater consumption on the order of 100 acre-ft per year.
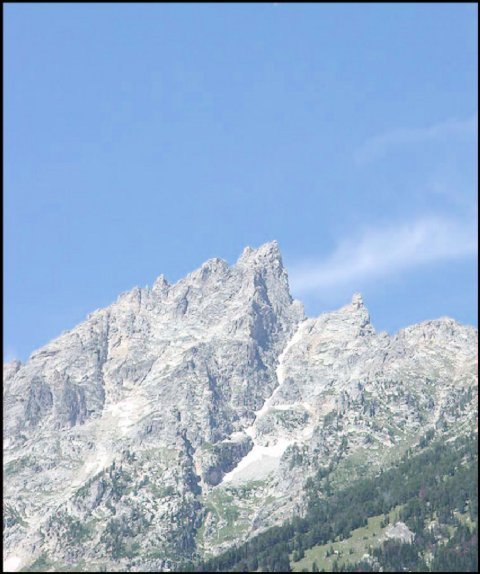
Municipalities (and subdivisions with sufficient density to warrant central water systems) will continue to add incrementally to water supply facilities and will almost certainly continue to turn to groundwater. Current trends indicate 1 or 2 additional municipal supply wells in the basin each year. Consumption of groundwater associated with such wells will track municipal population growth.
Groundwater Levels
As noted above, there are relatively few data that address the issue of long-term changes in groundwater levels. Hydrographs for monitoring wells in the Snake/Salt River basin (see Figure III-7) show similar, regular seasonal changes in groundwater elevation over several annual cycles, with no overall up or down trend. We are aware of no areas within the Snake/Salt River basin where there has been a sustained change (increase or decrease) in groundwater levels over time.
Groundwater Quality:
Analyses
The primary source of groundwater quality data for the Snake/Salt River basin is the USGS, who have collected and analyzed samples from throughout the basin. Additional, site-specific data are commonly available from individual project reports (e.g. those of the WWDC) and from the files of water system operators. USGS water chemistry data by geologic unit in terms of total dissolved solids, and cations and anions for each unit can be found in the “Available Groundwater Determination” technical memorandum.
In the relatively open hydrogeologic system represented by the alluvial aquifers, recharge is rapid and aquifer residence times are relatively short. Thus, surface-derived water has little opportunity to become seriously mineralized. Existing water chemistry data demonstrate that total dissolved solids (TDS) concentrations are commonly less than 200 mg/l from these deposits and only rarely are above the EPA secondary drinking water standard of 500 mg/l. (Secondary standards are established with reference to color, taste, and general aesthetic quality rather than human health.) Much of the alluvial groundwater is relatively hard, likely the result of the abundance of limestone-derived sands and gravels. Where underlying bedrock formations make substantial contributions to the groundwater, as may occur along the deep faults bordering the east side of Star Valley and Jackson Hole, additional mineralization of groundwater may occur. Trace element and organics analysis of these waters suggests little need for concern, with the possible exception of iron and manganese which may locally exceed secondary drinking water standards.
As with the basic productivity of the bedrock aquifers, groundwater quality is quite variable. Due to the generally lower permeabilities and longer groundwater residence times, groundwater tends to be somewhat more mineralized than in the alluvial aquifer, although exceptions are not uncommon. Total dissolved solids concentrations over 300 mg/l are common from the Mesozoic aquifers; one well producing from the Mesozoic-age Bear River Formation with a TDS value over 1,000 mg/l. Trace element analyses demonstrate locally elevated levels of boron, iron, manganese, and zinc, again likely dependent upon site-specific conditions. The range of groundwater chemistry for the bedrock aquifers demonstrates that many are capable of yielding water supplies of acceptable quality. Site-specific conditions are of most importance in this regard, and those systems drawing groundwater from bedrock formations are the most likely to experience unacceptable concentrations of aquifer minerals.
Groundwater Contamination
Jorgensen et al. (1999) present a detailed discussion of potential groundwater contamination and wellhead protection for the developed portion of Teton County, including relevant ground water quality standards and land use regulations and tables of groundwater contamination events. The following paragraphs are adapted and generalized from that report.
There are two general sources of potential contamination of groundwater supplies in the Snake/Salt River basin:
Figure III-9 depicts the density of domestic water wells in the Snake/Salt River basin by 40-acre tract, based on domestic well registration files of the Wyoming State Engineer's Office. (Groundwater permits are located only to the 1/4 1/4 Section.) Although aquifer contamination potential is a function of many local variables (e.g. depth-to-groundwater, permeability, aquifer thickness, aquifer lithology), a common "rule-of-thumb" is that domestic septic systems create potentially serious groundwater nitrate contamination problems at lot sizes of 2 acres or less. Assuming that each registered domestic-use well corresponds with a single-residence septic system, Figure III-9 provides a general picture of the density of potential nitrate sources. (2-acres lots correspond to 20 or more systems on a 40-acre tract.)
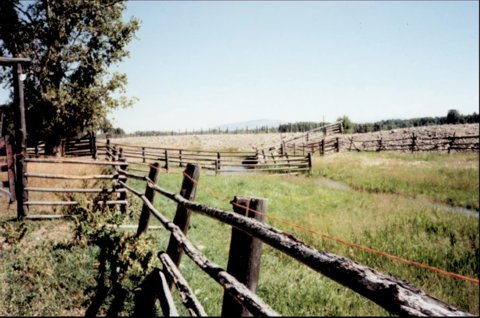
The spacing of individual wastewater septic systems is controlled by setback requirements with respect to water supply wells and septic systems and, perhaps most importantly, by minimum lot sizes in some areas. As an additional regulatory control on wastewater disposal contamination of groundwater, any subdivisions which have applied for county permitting after July 1, 1997 are subject to Wyoming Statute 18-5-306 which established the Subdivision Application Review Program within the Wyoming Department of Environmental Quality (WDEQ) - Water Quality Division. (See WDEQ, 1998.) Pursuant to this law, WDEQ has prepared guidelines to assess the adequacy of water and wastewater systems for all new subdivisions, and all new subdivisions are required to prepare engineering and hydrogeologic analyses of these systems. The required analysis includes investigation of groundwater contaminant loading by the proposed wastewater disposal system - whether a centralized facility or individual septic tanks and leach fields. The required area of investigation extends beyond the proposed subdivision to include the area through which groundwater will flow over a two-year time period.
The ease with which contamination may enter an aquifer is commonly termed the aquifer "sensitivity". It is primarily a function of the permeability distribution above and within the aquifer, the depth to groundwater, and the rate of recharge from the surface to the aquifer. As a general statement, the productive aquifers of the Snake/Salt River basin have a relatively high sensitivity to contamination because:
The University of Wyoming has recently completed a statewide assessment of groundwater vulnerability / aquifer sensitivity (Hamerlink and Arneson, 1998) based on general aquifer considerations. Their report includes a useful discussion of aquifer principles associated with sensitivity assessment; county-by-county appendices provide map details.
Figure III-10 presents a composite rating of aquifer sensitivity as developed by the University of Wyoming project. These ratings take into account generalized data on aquifer permeability, depth to the water table, the nature of the soils and other material above the water table, recharge rates, and land slope. Ratings have no absolute meaning; they simply reflect the relative sensitivity of the aquifer in one location as opposed to another. For perspective on these ratings, the area underlain by the main alluvial aquifer along the Snake River has received the highest possible sensitivity rating.
In summary, the developed aquifers of the Snake/Salt River basin are generally susceptible to aquifer contamination. Future planning and development should take this into account through appropriate site selection and design of water supply wells. In addition, the development of potentially conflicting uses in aquifer recharge areas should be monitored. Given the widespread use of the alluvial aquifer in the Snake/Salt River basin, individual "well-head protection plans" should be augmented with a general concern for all activities with potential for contamination of groundwater in and around the developable portions of the basin.
Groundwater Availability:
The "availability" of groundwater can be addressed in many ways, from calculation of the total groundwater present beneath a certain area or the total usefully recoverable groundwater present beneath a certain area (like a mineral resource), to calculation of the total annual groundwater output of an area (like streamflow), to calculation of the annual volume of groundwater that can be developed without significantly impacting other, existing water-resource users. The latter is the most appealing approach, but requires definition of "significant" and determination of which existing uses to consider (domestic, agricultural, environmental, aesthetic). The requirements of mass balance within any physical system ensure that any diversion of groundwater at one point results in an equal diminution of groundwater elsewhere, and that diminution must show up as a decrease in streamflow, evaporation, groundwater outflow from the system, evapotranspiration (crop, non-crop, human, animal), or groundwater storage.
The following paragraphs touch on each of these approaches in order to establish the general scale of the groundwater resource, but, as a practical matter, the availability of groundwater is a local and project-specific function of competing users, water quality needs, economics, and legal constraints, overlain upon the basic characteristics of aquifer properties and groundwater quality discussed above. Nonetheless, a few general conclusions can be made:
Basically, subsurface materials are saturated with water from the water table, a relatively short distance below land surface in most areas, to the depth at which there is no significant porosity to contain groundwater, e.g. the crystalline basement rocks underlying the entire Snake/Salt River basin and forming the visible core of the highest mountains. The volume of pore space in this material represents the volume of groundwater and is likely on the order of 100's of millions of acre-ft. Much of this water is of unusable quality (e.g. due to great depth) or is contained in formations from which groundwater cannot be extracted at useful rates (e.g. thick shale units), so the useable groundwater resource is vastly smaller than the total groundwater in storage.
Considering only the alluvial aquifer (covering approximately 400 mi2) in the Snake/Salt River basin, and assuming an average saturated thickness of 200 feet and an effective porosity of 20%, a volume of 10 million acre-ft of useful groundwater in storage is calculated. Were groundwater a static, nonrenewable resource, like coal, this volume might approximate the developable resource.
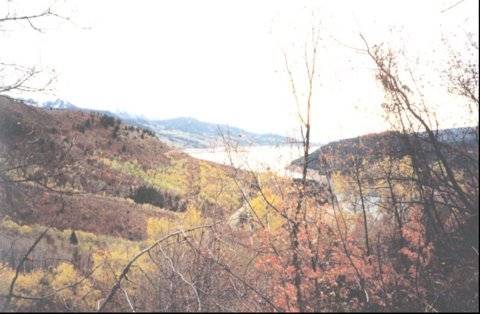
Groundwater is very dynamic resource, however, particularly groundwater of high quality occurring at depths feasible for development. Data suggest an average annual recharge rate of approximately 4 inches = 1 million ac-ft/yr spread across the 4700 mi2 of the Snake/Salt River basin. The base flows of the Salt and Greys Rivers (i.e. the streamflow that is sustained by groundwater input through the period of the year without significiant precipitation input) suggest average groundwater output of 250 and 350 ac-ft/mi2/yr, respectively. (The Snake River basin below Jackson Lake is not considered due to the impact of reservoir modulation on base flows.) Applying a value of 300 ac-ft/mi2/yr to the entire basin suggests a total groundwater output of 1.5 million ac-ft/yr, roughly comparable to the recharge-based estimate. Of course, development and consumption of this "available" groundwater would leave the streams of the Snake/Salt River basin dry through much of the year.
A more detailed, groundwater-model based mass balance for the alluvial aquifer between Jackson Lake and Hoback Junction was developed by San Juan and Kolm (1996). They estimated total recharge of approximately 50,000 acre-ft per year, with 25,000 acre-ft per year of groundwater discharge through evapotranspiration and 25,000 acre-ft per year of discharge to streams.
In any case, the inescapable requirements of mass balance mean that additional groundwater consumption causes either a decrease in groundwater storage (declining groundwater level/pressure), a decrease in consumption elsewhere in the hydrologic system, or depletion of surface water. As discussed above, there is little indication of widespread reductions in groundwater levels in the study area (although long-term data are sparse).
Geothermal Resources:
For certain applications, the temperature of groundwater may itself be a useful resource. Thermal energy can be usefully extracted from groundwater at temperatures as low as 40°F through the use of groundwater heat pumps, typically used for small space-heating loads. For small-scale, e.g. residential, applications of this level of geothermal energy, little is required beyond a sustainable source of groundwater on the order of a few gallons per minute. At the opposite extreme of geothermal resources are natural occurrences of super-heated steam which can be tapped to drive electrical generators. Such occurrences are quite rare and require special circumstances of heat sources and groundwater circulation. In between are a wide variety of geothermal applications, including spas, swimming pools, commercial space heating, de-icing systems, fish propagation, hydroponics, industrial process heating, district space heating, and generation through the use of binary fluid systems.
Most of the geothermal resources in Wyoming are a function of the deep circulation of groundwater. The natural "plumbing" of an aquifer carries recharge water sufficiently deep to be significantly heated by the normal geothermal gradient of the earth - approximately 14°F per 1,000 feet of depth. Groundwater circulation (or deep drilling) then brings this water sufficiently close to the surface that it can be economically developed for moderate-temperature, near-source applications. Only in the Yellowstone National Park area are there special subsurface sources of heat that produce very hot groundwater and even super-heated steam.
Occurrence
Although not hosting the extensive, deep sedimentary basin type of geothermal resources that are present elsewhere in Wyoming, the Snake/Salt River basin has a variety of local geothermal features. These vary from the 64°F flow of the Teton Valley Warm Springs near Kelly, to 200°F thermal springs in the Yellowstone Park portion of the basin. Geochemical indicators suggest a subsurface temperature of 270°F for the Huckleberry Hot Spring system, just south of Yellowstone, but this likely marks the southern extent of the Yellowstone geothermal system that draws its heat from a cooling body of molten rock at depth. South of Yellowstone, geothermal features are generally of lesser temperature and are largely a function of deep groundwater circulation along local fault systems. There is no concentration of geothermal features in the Snake/Salt River basin, but isolated occurrences in both valley and upland settings.
The only exception to this generally moderate-grade resource of which we are aware is at the Auburn Hot Springs. This is the only geothermal system in Wyoming outside Yellowstone (and the Huckleberry Hot Springs area immediately south of Yellowstone) where geochemical indicators suggest subsurface temperatures (300°F) potentially high enough to approach electrical generation potential. The surface discharge of this system has a maximum temperature of approximately 140°F.
Development
Due to its location primarily within the national park, the Yellowstone geothermal system has been developed only in terms of its scenic and aesthetic values, and scientific research has been focused on geological and biological processes rather than on the resource's commercial potential. (Prospecting with regard to exotic, high-temperature microbes may represent an exception.) Elsewhere in the basin, land ownership patterns also impact the potential development of geothermal resources, with several local systems falling within other National Park and National Forest lands. While several of these features host recreational use (e.g. Huckleberry Hot Springs, Granite Hot Springs) and thermal springs at the Jackson Fish Hatchery are used in fish-rearing operations, there is little likelihood of more intense development.
Geothermal features on non-federal and private lands are similarly used primarily simply as attractive sources of warm water for bathing, swimming, soaking, limited low-technology space heating, and, in the case of the Kelly Warm Springs, for kayak practice sessions.
Despite the limitations on geothermal development imposed by land ownership patterns in the Snake/Salt River basin, there are scattered occurrences of local geothermal systems with development potential for moderate-temperature applications. If the present understanding of these systems as largely fault controlled is correct, there is potential for increased development through drilling - an improvement in volume, reliability and control over simply taking the natural flow of warm springs. However, that potential is likely localized along the controlling geologic structures and the potential for subsurface temperatures substantially higher than the observed discharge temperatures (rarely >110°F) is small.
To date, development interest and economics have not justified applications much beyond the obvious pleasures of direct contact with warm water. The most viable candidate for development appears to be the system at Auburn, which is largely located on private lands. However, intermittent exploration interest over many decades has so far been unsuccessful in identifying an economically viable application.
E. WATER CONSERVATION
Introduction:
Water conservation in the Snake/Salt River basin involves all uses including agriculture, municipalities, industry, recreational, and environmental concerns. In the past, water conservation efforts were mainly focused on improving efficiency of agricultural water use. As communities within this basin have changed, there is a growing interest in flat water activities and stream flow related recreation. The following is an examination of water conservation activities and opportunities in the Snake/Salt River basin.
Agricultural Water Conservation:
Flood irrigation utilizing canals and ditches was the standard method of distributing irrigation water until the late 1960's and early 1970's. At that time, many areas of the Salt River basin converted from flood irrigation methods to pressure irrigation using sprinklers. This provided a much more efficient way of supplying water to the growing plants, and greatly reduced the quantity of water lost during conveyance as well as seepage losses from over-application of water. As the efficiency of water distribution increased, the reduced flows in late summer could be applied to a larger area, thus increasing yields. However, the reduction in conveyance and seepage losses also resulted in less water to recharge the groundwater system, and return flows in the fall and winter were reduced. Another result was that spring runoff that had been previously diverted and flooded in the fields was now allowed to stay in the stream, which resulted in higher peak flows during runoff.
The topic of change in agricultural production due to the conversion to sprinkler irrigation has been discussed with local producers. According to one producer in the Salt River basin, when utilizing flood irrigation he would produce approximately one ton of alfalfa per acre per year, and 34 bushels of barley per acre per year. Rarely did they have enough hay growth for a second crop. After the installation of sprinkler irrigation, yields increased to over 4 tons of alfalfa per acre per year, and 95 bushels of barley per acre per year. While previously the farm could support about 25 dairy cows and was short of hay on some years, they now have adequate feed for 50 cows utilizing the same farm ground. The improvement caused by sprinkler irrigation is seen in more than just crop yields. It was estimated that 10% of the farm ground was used for ditches and laterals, where now most of this ground is now used for growing crops due to the elimination of ditches within the field as well as the installation of buried pipe. Also, harvesting has become much more efficient without having to cut around the various distribution laterals and ditches in a field.
Municipal and Industrial Water Conservation:
Water conservation measures have been implemented by some of the municipalities in the basin, however it has not been a major focus. The largest town in the basin, Jackson, has implemented metering as have many other public water systems. However, many public systems do not meter their water use and have no incentive to conserve water. The expense of installing meters can be seen as prohibitive, and is unpopular politically. Also, some systems encourage water use during the winter months to prevent frozen pipes. Some systems are requiring meters on new hookups, and look to phasing in metering to the existing population.
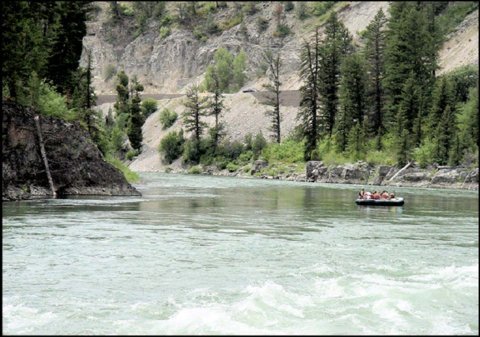
During the last two summers, drought conditions have prompted some communities, such as Afton, to implement voluntary and mandatory water restrictions. Generally, these restrictions have consisted of elimination of outside lawn watering during daytime hours with exceptions for automatic sprinkler systems. In Afton, this was done to reduce daytime demand to better match the output from the Periodic Spring.
Recreational and Environmental Water Conservation:
Various wetland and riparian enhancement projects have been conducted throughout the basin over the years. While these projects do not necessarily conserve water, they do conserve or enhance habitat for fish, waterfowl, and other animals. Also, maintenance flows at the Jackson Lake Dam have been agreed to by the U.S. Bureau of Reclamation in order to provide sufficient flow in the Snake River for fish during the winter months.
Future Conservation Opportunities:
In general, the Snake/Salt River basin has adequate water to serve the needs of basin residents. For the most part, water shortages are seasonal, and their effects can be magnified by drought conditions. In spite of the adequate availability of water, and perhaps because of it, conservation methods can be used in virtually every form of water use.
Agricultural Conservation Opportunities
The largest water savings by quantity are generally realized by conservation in the agricultural sector, as it represents the largest use of water in the basin. For this reason, much of the focus of water conservation is on irrigation practices. In order to determine what future conservation efforts will be effective, an inventory of existing facilities is necessary. Major items of interest in this inventory include conveyance facilities and irrigation methods. A summary of this data is presented in Table V-3. Only major irrigation diversions with adequate accompanying data were included. Roughly 60 percent of the irrigated land in the entire Snake/Salt River basin is included in these calculations.
Table V-3. Major Ditch Conveyance and Irrigation Methods Summary
|
A significant portion of water diverted for irrigation can be lost during conveyance to the field through seepage, deep percolation, phreatophytes, evaporation, and so forth. Water is typically diverted from the river or stream into a canal or ditch, which is generally of earth construction and unlined. The soils in the Snake/Salt River basin are predominantly gravelly loams as they were formed on the alluvium of the many rivers, streams, and washes that are present in the valleys. Naturally, water will quickly percolate through these granular soils. Essentially none of the canals and ditches in the basin are lined, yet many have been somewhat sealed over time with the deposition of fine material. Losses though unlined canals and ditches have been estimated at up to 40 percent of the diverted flow, however there are no extensive studies that have evaluated ditch conveyance losses in the Snake/Salt River basin.
Irrigation methods also present an opportunity for water conservation. In the Snake/Salt River basin, historically flood irrigation was the most popular method used in spite of its low efficiency. However, since the early 1970's many areas, particularly in the Salt River basin, have converted to sprinkler irrigation that utilize hand lines or wheel lines. There are a few isolated areas that have incorporated center pivot irrigation. For the most part, the conversion from flood to sprinkler irrigation has had a positive effect, as crop yields have increased considerably. Also, more acres of cropland can be irrigated late in the summer when there is less water available. However, some positive aspects of flood irrigation have been reduced with the conversion to sprinkler, such as groundwater recharge and delay of the peak runoff.
Municipal Conservation Opportunities
Municipal water use is the next significant use of water in the basin following agricultural water use. Conservation measures for these types of systems generally consist of individual customer meters that track actual water use. Meters can also help determine if there are major losses in the distribution system through leaks. Some municipal water systems have implemented water restrictions, both voluntary and mandatory, during the summer over the past two years of drought. These restrictions effected irrigation of lawns and landscaping during high use times, and encouraged the use of automatic sprinkler systems. Conservation efforts on municipal systems have been shown to reduce indoor use by over 20 gallons per capita per day. Outdoor water use for irrigation of lawns and landscaping can be significant, and can be greatly reduced by utilizing plants with lower water requirements and installing sprinkler systems and timers. Perhaps the largest municipal or domestic use of water is sprinklers and hoses left running around the clock during the summer. Also, due to water systems that are shallow and subject to frost, many communities encourage water use such as running a constant stream of water in the winter to prevent frozen pipes.
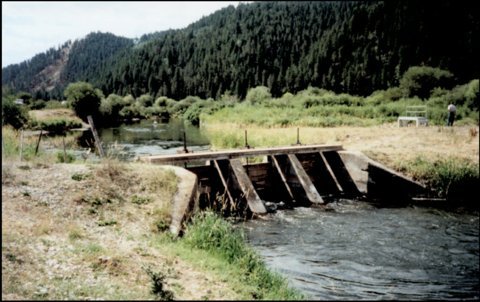
Recreation and Environmental Conservation Opportunities
Much of the use of water in the Snake/Salt River basin is related to recreational and environmental uses. While these are generally non-consumptive uses, water is still key to many of these activities. Conservation efforts in these areas generally do not conserve the quantity of water used, but rather focus on conservation of a fishery, wetland, or other resource that serves to improve the water use opportunity. Water storage can serve an important role in meeting these water needs by providing increased management of the available water supply for these uses. Storage can also serve to conserve water by meeting the needs of the resource while holding over surplus water for later use. For another example, fencing to keep cattle off of a stream bank can help reduce erosion, improve water quality, and maintain habitat. In these circumstances, an off-stream location for stock watering must be developed. Without an alternative water source, fencing may also mean that an irrigated crop, either by natural or artificial means, may not be harvested or grazed. Also, water utilized for wetlands may be considered conservation of bird or fish habitat, although more water is used than if the wetland was not maintained.
Conclusion:
In order for conservation methods to be successfully implemented, there must often be an incentive or benefit for those involved. This incentive may be in various forms, such as increased crop yields, improved fishing, reduced costs, and so forth. Reduction of conveyance losses and improvement of irrigation efficiency does not necessarily equate to less water used. In areas of deficit, conservation measures may result in the conserved water being applied to additional acres or providing a full supply of water throughout the season without a decrease in the water diverted. However, this improvement in efficiency will likely result in an increase in the crop quality and yield. Prior to implementation of conservation improvements, the system should be studied to see how conservation is addressing the issue and to make sure that the program will have the intended result.
Figure III-3: Snake River Node Diagram
Figure III-4: Salt River Node Diagram
Figure III-5: General Geology and Well Density
Figure III-6: Shallow Aquifer Recharge Rates
Figure III-7: USGS Ground Water Elevation Monitoring Sites
Figure III-8: Ground Water Permits for Domestic Use by Decade
Figure III-9: Wyoming State Engineer’s Office Permit Locations
Figure III-10: Aquifer Sensitivity
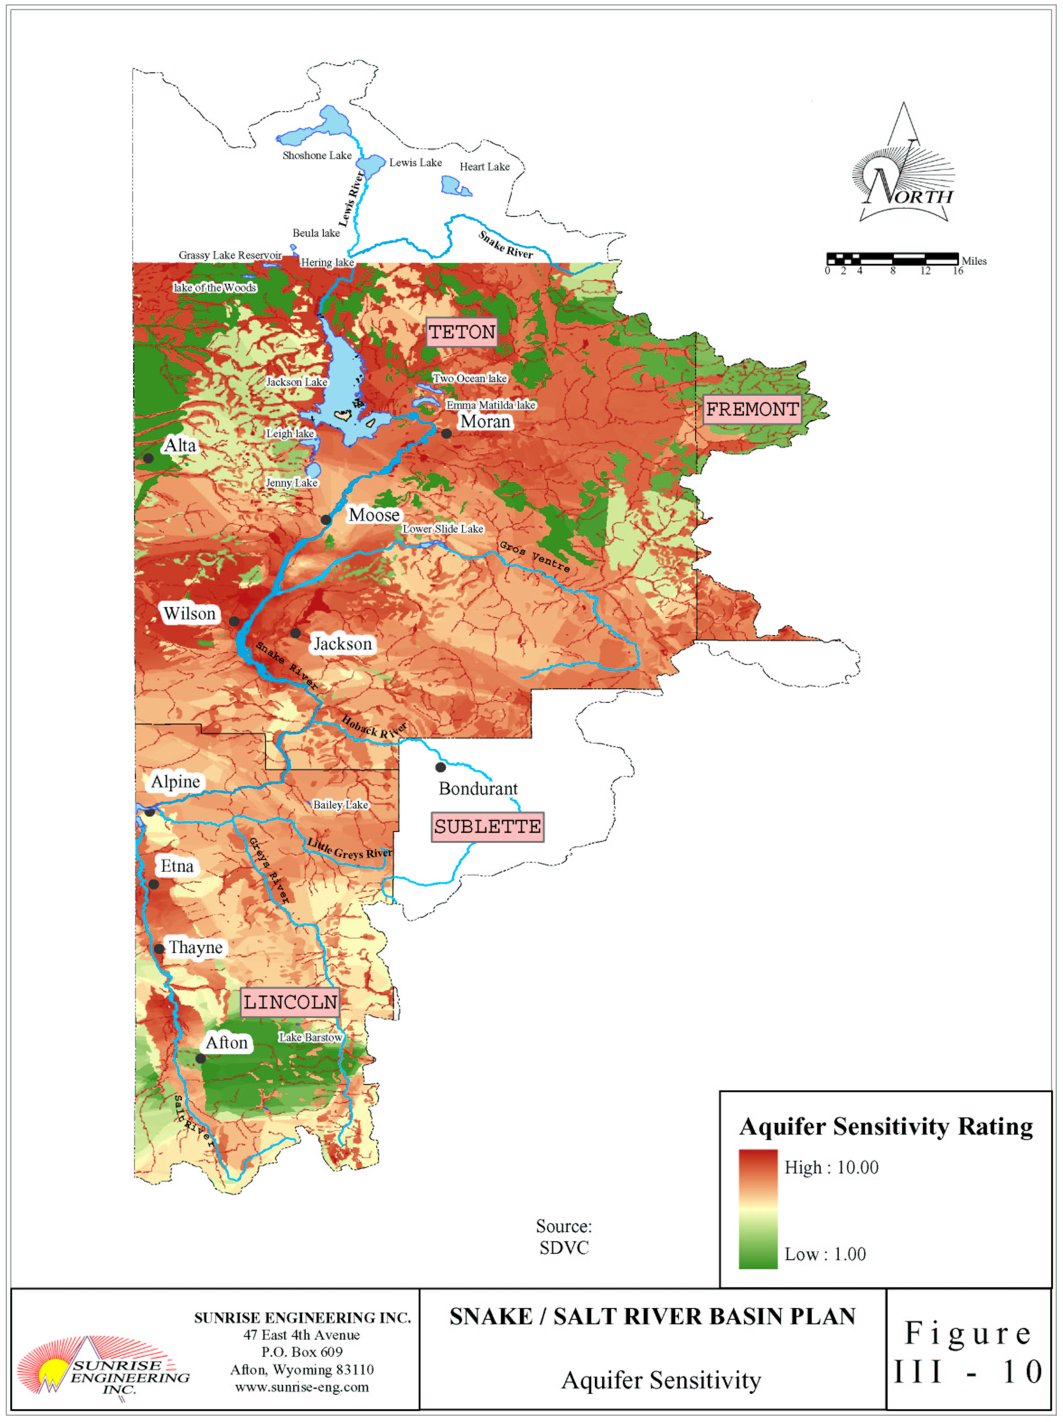
IV. DEMAND PROJECTIONS
A. HISTORIC & CURRENT ECONOMIC AND DEMOGRAPHIC CONDITIONS
Demographic Overview
At present, nearly 26,000 people reside in just over 10,000 households within the Wyoming portions of the Snake and Salt River basins. Roughly 44 percent of the population of the basin lives within the boundaries of the City of Jackson or the Towns of Afton, Alpine and Thayne, the four principal population centers within the basin. These municipalities also account for 45 percent of basin households.
The City of Jackson comprises 52 percent of the total population and 34 percent of the total households within Teton County, while the three towns in northern Lincoln County constitute 39 percent of the total population and 30 percent of total households in Lincoln County. The remainder of the basin's population lives within unincorporated areas of Lincoln, Sublette and Teton counties. A breakdown of the current population of the basin is provided in Table IV-1.
Table IV-1. Estimated 2000 Population, Households and Related Political
Jurisdictions in the Basin
| ||||||||||||||||||||||||||||||||||||||||||||||||||||||||||||||||||
Source: Wyoming Department of Administration and Information, Division of Economic Analysis. Profile of General Housing Characteristics by County and Place, 2000. Census Tracts from 2000 Census of Population and Housing, Census 2000, Bureau of the Census.
Historic Population Growth
Changes in census tract definitions from decade to decade and the imprecise relationship of census-defined geography to the watershed make it difficult, if not impossible, to precisely quantify historic population totals for the unincorporated portions of the basin. However, population changes in the four principal communities that comprise a good portion of the basin's population can be readily tracked over time from the decennial censuses.
Since 1950, the combined population of Alpine, Afton and Jackson has increased at an average annual rate of about 3 percent. This long-term average, however, masks considerable fluctuation during this 50-year period. As shown in Figure IV-1, the population of the three communities remained almost constant during the 1950's and 1960's before growing rapidly in the 1970's. While the 1980's were characterized by slow but steady growth, population during the 1990's increased dramatically, with the combined population of Alpine, Afton and Jackson increasing at an average annual rate of 6 percent over the past ten years. In general, the rates of population growth in these communities closely correspond to the rates of population growth for Lincoln and Teton Counties as a whole over the past five decades.
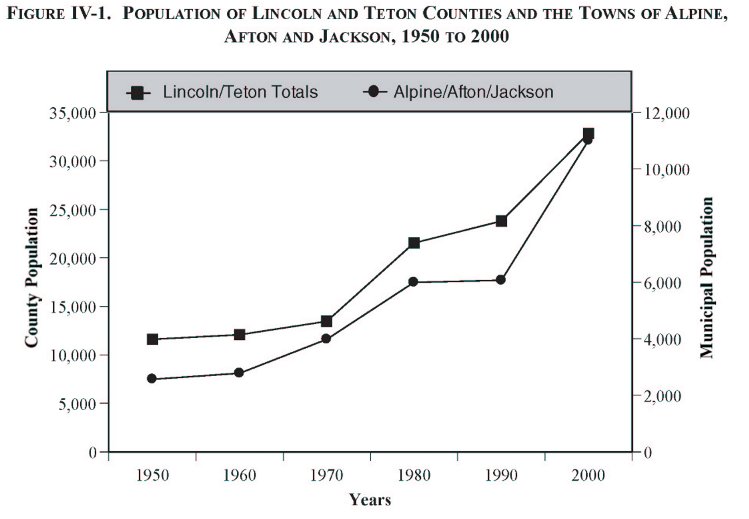
Source: Wyoming Department of Administration and Information, Economic Analysis Division.
Economic Overview
Based upon the extrapolation of 2000 data from the Bureau of Economic Analysis Regional Economic Information Systems (BEA-REIS) to the year 2002, the study team estimates that there are currently over 28,200 full and part-time jobs located in Lincoln and Teton Counties. The study team estimates that approximately 4,200 of these jobs are located within the basin portion of Lincoln County and about 24,000 jobs are located in Teton County.
Historic Employment Growth
Figure IV-2 depicts historical employment growth for Lincoln and Teton Counties (graphed against the left axis) and the State of Wyoming (graphed against the right axis) from 1970 through 2000. Over the past three decades, Teton County employment has grown at a rapid and increasing rate. Especially during the decade of the 1990’s, employment growth has outpaced the rate of growth for the State of Wyoming as a whole. This rapid growth refelcts the continued development of the tourism industry in Teton County. In general, Lincoln County employment growth during the past three decades has been much slower than either Teton County or the State of Wyoming as a whole. An exception was the brief period of power plant construction during the mid-1980’s; growth in county employment fell back shortly thereafter to rates comparable to the pre-construction period.
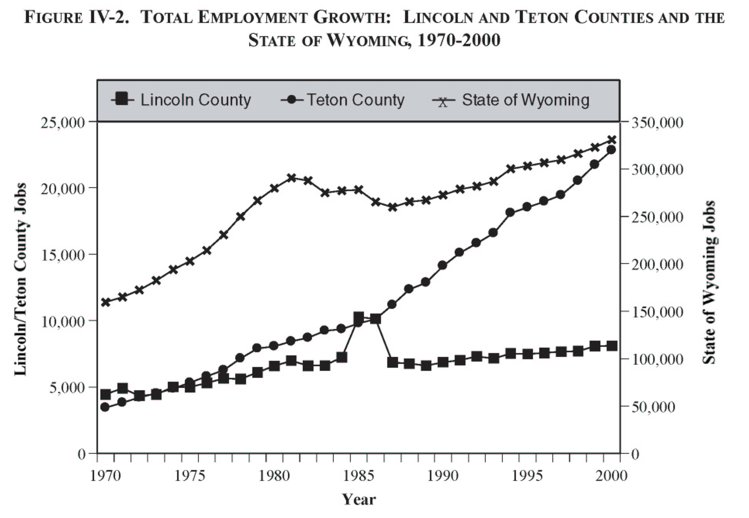
Source: Department of Commerce, Bureau of Economic Analysis, Regional Economic Information Systems, 2000.
Key Economic and Water Use Sectors
Current conditions in two key sectors in the basin are described in the following section. Agriculture, while no longer one of the largest sources of employment or income in the basin, still accounts for the largest amount of water use. Tourism and visitor related activities are a large and increasingly important component of the local economic base. Prospects for these sectors, and specific scenarios incorporating varying assumptions about each sector, provide the cornerstone to the economic, demographic and water demand projections for the basin.
Agriculture
In order to understand current agricultural activity in the basin and the factors affecting local agriculture in the future, relevant personnel from a variety of federal and state land management and agricultural agencies were interviewed. Representatives of several livestock operations currently operating within the basin were also interviewed. Current and historic livestock and hay production data for the basin counties published by Wyoming Agricultural Statistics Service was gathered and analyzed. In addition, information on current and historic stocking levels for livestock grazing allotments within the basin from the United States Forest Service (USFS), the Bureau of Land Management (BLM) and the National Park Service (NPS) was obtained. The following is an abbreviated summary of current agricultural conditions in the basin.
• Livestock. Livestock production (cattle and sheep) is the primary money-making, agricultural enterprise in the basin. Ranchers typically have permits tied to their operation that allow them to graze their livestock on a particular allotment of public (primarily Forest Service) land throughout the basin during the summer months. Cattle are grazed on public lands from roughly early June to mid-October, while sheep are grazed from early July through mid-September. The largest share of these allotments are Forest Service lands, divided between the Bridger-Teton National Forest (BTNF) and the Caribou Targhee National Forest (CTNF). BLM allotments are relatively small, and occur almost exclusively in the Salt River portion of the basin. In Teton County there are several large ranches where cattle are grazed exclusively on private lands.
In addition, horses used for pleasure riding on either small private ranchettes or in commercial riding operations are becoming more abundant in Teton County. Although it is difficult to estimate exact numbers, a conservative estimate of 1,000 such horses in Teton County is reasonable. According to the local brand inspector, there are at least 10-12 operations in Teton County with over 100 head, and roughly 1,000 Teton County horses have received lifetime brand inspections.
The horse population within the basin is highly seasonal. During the summer months, two large horse operations (one in northern Lincoln County) lease roughly 1,400 horses to Teton County dude ranches and outfitters. During the rest of the year, these horses return to their home pastures, and may be leased to hunters during the fall hunting season.
Table IV-2 presents estimates of existing stocking levels on public and private lands within the basin. The majority of cattle (76 percent) and sheep (97 percent) are grazed on land that is administered by the USFS. While the USFS authorizes a much larger number of sheep than cattle (all in Lincoln County), BLM and NPS allotments are exclusively devoted to cattle. Note that the cattle and sheep totals on private land in Teton County are estimated using anecdotal evidence from interviews, calibrated to Wyoming Agricultural Statistical Service (WASS) totals. Estimating similar totals for Lincoln County was problematic since only the northern portion of the county lies within the basin. Local agricultural officials, however, confirmed that county public land authorizations provided reasonable livestock estimates. Horse totals on private lands in both Lincoln and Teton Counties represent year round averages based on estimated seasonal totals. No corresponding information was available for Sublette County portions of the basin.
Table IV-2. Current Estimated Livestock Levels within the Snake/Salt River Basin
| |||||||||||||||||||||||||||||||||||||||||||||||||||||||||||||||||||
Sources: Kemmerer and Pinedale Offices, Bureau of Land Management, 2001 livestock data; Bridger-Teton and Caribou Targhee Forests, United States Forest Service, 2001 livestock data; and Park Service Grazing Use Report and personal interviews.
• Crops. Crop production in the basin consists mainly of hay (both irrigated meadow and alfalfa) used for supplemental livestock feed. The vast majority of hay grown within the basin is consumed by basin livestock (either own-farm or sold to neighbors) as supplemental feed during the winter months. There is some alfalfa and grain grown along the Salt River, but especially in Teton County, the majority of hay acreage is irrigated meadow. Roughly 85 percent of hay fields in each county have been irrigated historically, with the percentage being a bit higher in Teton County. Irrigated production in the basin occurs along the Salt and Snake Rivers, with significant supplemental acreage along the Hoback and Teton Rivers in Teton County. Irrigated acreage levels have been stable through time, and sources have confirmed that almost all irrigable land in the basin is in fact irrigated during years with normal precipitation levels.
Table IV-3 presents irrigated acreage estimates, by crop, for rivers within the basin and demonstrates the significant difference in crop types between the Lincoln and Teton County portions of the basin. The largest acreage along the Salt River in Lincoln County is planted to alfalfa and grains, with roughly 56 percent in alfalfa. In contrast, all the acreage along the Snake and Hoback Rivers in Teton County is irrigated pasture and mountain meadow hay. The land along the Teton River near Alta is somewhat of an exception, with roughly 40 percent of acreage planted to alfalfa and 30 percent apiece planted to irrigated pasture and small grains.
Table IV-3. 2002 Estimates of Irrigated Acreage within the Snake/Salt
River Basins
|
• Dairy. A small but entrenched dairy industry exists in the Star Valley portion of Lincoln County near Afton. The industry consists of roughly three to five larger operations (150 head) and roughly thirty smaller operations (50 head). The majority of production from these operations supplies the Star Valley Cheese Company, although some is sold outside the basin. Most operations grow their own hay for supplemental feed, and transport it directly to the confined dairy cows. While production has remained relatively constant over the past thirty years, the number of operators has declined dramatically from roughly 300 in 1970 to current levels.
• Employment. The number of ranches in the basin counties, reflected by farm proprietor employment levels, has remained around 600 over the last 30 years. The total number of farm jobs in these counties, despite a short term increase during the early 1980's has gradually declined over this time period, from about 1,050 to its current level near 850, reflecting a slight increase in labor productivity, probably due to technological innovation. Current agricultural related employment specifically within the basin is estimated to be the sum of Teton County agricultural employment and one-half of Lincoln county agricultural employment, or roughly 400 farm proprietor jobs and 500 total farm jobs within the basin.
Tourism and Visitor Related Activity
The tourist economy within the basin is vibrant and growing, with over 2.5 million visitors per year. Peak tourist season is still the summer, but winter use is noticeably on the rise, and the shoulder seasons are getting shorter and shorter. In order to gain local insight into tourism and visitor related activity in the basin, interviews were conducted with representatives of the Teton County Planning Department, planners for Grand Teton National Park, Recreation Specialists for the Bridger-Teton National Forest, and a variety of recreation service providers in the area. Extensive secondary data on recreational activities and associated visitor days were collected from both the USFS and the NPS.
The following is a brief summary of current tourism and visitor related activity in the basin.
• Visitor Types. The basin, and Teton County in particular, has historically served as a popular destination for tourists and outdoor recreation enthusiasts alike. The basin includes Grand Teton National Park (GTNP) and serves as the primary access point for Yellowstone National Park (YNP), two of the most heavily visited parks nationwide. Extensive recreation opportunities are available, not only within park boundaries, but also on the surrounding lands of BTNF and CTNF. In the winter, the area boasts of world-class alpine skiing opportunities at Jackson Hole, Grand Targhee and Snow King resorts as well as a host of other recreational opportunities. The primary locale for visitor lodging and other services in the basin is the City of Jackson. Jackson is the largest population center within the basin, and lies directly on Highway 191 north, which many visitors take to get to the two national parks.
Besides destination tourists, a second important component of visitation to the area comes from seasonal residents with second homes in the basin. The last decade saw an increase of roughly 3,200 housing units in Teton County, including nearly 700 new seasonal homes. This change represented an increase of 45 percent in both total and seasonal housing units within Teton County. As housing values in Teton County climb, northern Lincoln County is also seeing a marked increase in residential growth, especially for second homes. Over the past decade, roughly 550 new housing units, including 100 seasonal housing units, were developed in northern Lincoln County. These additional units represented an increase of 29 percent and 48 percent respectively over the existing housing base.
• Recreation Activities. In addition to park visitation in the summer and alpine skiing in the winter, the basin offers extensive, year around recreational opportunities, both within the boundaries of GTNP and on the surrounding lands of BTNF and CTNF. Participation is obviously seasonal, and although the summer months still constitute the peak tourist season, participation in winter recreational activities such as snowmobiling and backcountry skiing continues to grow in BTNF.
Table IV-4 presents a monthly summary of recreational visitation days by activity, with private outfitters and concessionaires associated with GTNP. While these numbers likely represent only a small portion of recreational activity within the basin, they provide some insight into the relative popularity of activities and the distribution of participation over the summer months. The summer season extends from May through October, with the peak participation months being July and August. The most popular activities include rafting on the Snake River, ferry rides on Jackson Lake, and guided horseback rides through the surrounding countryside. Peak rafting season is in July and August, while peak fishing season occurs during August and September, when the river water clears and fish are more visible. From May through September, roughly 75 percent of the participation comes from water-based activities. In contrast, during October, nearly 90 percent of participation is in land-based activities.
Table IV-4. Summer Recreational Visitor Days, by Activity, Private Outfitters and
GTNP Concessionaires, 2001
|
Source: Grand Teton National Park, Concessionaire's Office, 2002.
• Expenditures and Employment. Daily tourist/visitor expenditure patterns were used to estimate current spending levels in the basin for both destination tourists and seasonal residents. Estimates based on this information represent a current annual total of $507 million in destination tourist expenditures and $234 million in expenditures by seasonal residents. Total expenditures in the tourist/visitor sector are estimated to support nearly 20,000 local jobs (See Table IV-5 below). These include multiple jobs per individual and are by place of work, reflecting commuters from Lincoln County and Teton County, Idaho driving in the area.
Table IV-5. Number of Visitor Days, Visitor Expenditures and Jobs Supported by
Tourism Snake/Salt River Basins, 2000/2001
| |||||||||||||||||||||||||||||||||||||||||||||||||||||||||||||||||||||||||||||||||||||||||||
Sources: Morey and Associates, 1999, 2000. Prior and Associates, 2001.
Summary
At present, there are approximately 26,000 residents living in the Wyoming portions of the basin. The population of basin counties grew rapidly during the 1970's, slowed considerably during the 1980s and has resumed comparatively rapid growth during the 1990s. About 28,000 jobs are located within the basin, many of which are part-time. Employment is highly seasonal, especially in Teton County. Most jobs in the basin are held by residents in the northern Lincoln and Teton Counties, although some jobs in the basin are filled by residents of nearby Teton County Idaho. The most important sector of the basin's economic base is tourism and visitor related activity. Agriculture is not as large a factor in the local economy as it was in the past and continues to steadily decline, but remains an important sector from the standpoint of basin water use.
B. FUTURE ECONOMIC AND DEMOGRAPHIC SCENARIOS
Approach
There are numerous approaches to developing economic and demographic projections for a regional economy, ranging from simple statistical extrapolation to sophisticated econometric modeling. The projection approaches vary in terms of complexity, the amount of information they convey, and the amount of data they require. The following paragraphs provide a description of existing economic and demographic projections for the Snake/Salt River basin area and the study team's assessment of the appropriateness of those projections for the purposes of this study. This section concludes with an overview of the forecasting approach adopted by the study team, and reviewed by the Wyoming Water Development Commission, and an overview of the three planning scenarios that drive the subsequent projections.
Economic Base Methodology
The economic and demographic projection approach adopted by the study team for this effort employs an established technique in regional economics known as "economic base analysis." The economic base approach is a "bottom-up" method that has the advantages of focusing directly on specific activities that are likely to drive economic and demographic changes in the future and providing a substantial level of detail about those activities in the future, while at the same time being less data intensive than econometric modeling approaches. Essentially, this approach involves the following five steps:
Overview of Planning Scenarios
The study team developed three alternative planning scenarios for this study, employing the economic base forecasting approach just described. An overview of each of these scenarios is provided below. More specific details about the assumptions for the key sectors of agriculture and tourism and the potential interactions between these sectors in the economic base projection scenarios are provided following this overview.
High Scenario. In the simplest terms, the High Scenario incorporates the study team's views of the most growth in each of the key sectors that could potentially occur over the forecast horizon. It is remotely possible that one or more of the key sectors could grow even more than we have assumed under this case or an unforeseen, new basic economic activity could become established and flourish in the region. It is also likely that due to the interrelationships between these sectors, the growth in aggregate employment and population that drives future water demand will be somewhat moderated. However, the study team felt that the underlying aggressive assumption that each of the key sectors will achieve its highest reasonably likely growth at the same time makes this scenario a useful upper bound for subsequent water planning purposes.

Low Scenario. The Low Scenario embodies the study team's views of the lowest simultaneous growth (or largest contraction) reasonably likely to occur in each of the key sectors over the planning horizon. While even lower economic activity levels in one or more sectors are not impossible, the inverse interrelationship between the agriculture and tourism sectors likely implies that the actual growth that occurs over the planning horizon may be somewhat higher than this projection. Again, the study team felt that the assumption of simultaneous low activity levels in each of the key sectors, though somewhat artificial, made this scenario a supportable lower bound for planning purposes. While the Low Scenario obviously will not impose pressure on regional water resources, this scenario is sometimes used for purposes of determining the financial risk involved with potential water resource enhancements.
Mid Scenario. The Mid Scenario represents the study team's views of the most realistic level of growth likely to occur in each of the key sectors over the planning horizon. As in the other two scenarios, the potential interaction between the agricultural and tourism sectors are acknowledged. Although the actual economic growth experienced in the basin may vary somewhat from this projection because of this interaction, the assumed activity levels represent, in the study team's best judgment, the rate of growth most likely to be experienced in the basin. As such, this scenario is perhaps the most useful for water planning purposes.
Economic Base Scenario Assumptions for Key Sectors - Agriculture
Local interviews and research into both historic agricultural practices and competing environmental and recreational interests provide insight into potential factors that may influence the future of agriculture in the Snake/Salt River basin. The factor that will most likely have the largest potential impact on basin agriculture is the continued demand for seasonal and second home development. Other potential factors that may significantly impact agriculture within the basin include changes in public land grazing policies such as the listing of various cutthroat trout species or the expansion of grizzly bear recovery area on USFS land. The following are summary observations about prospects for Snake/Salt River basin agriculture in the future.
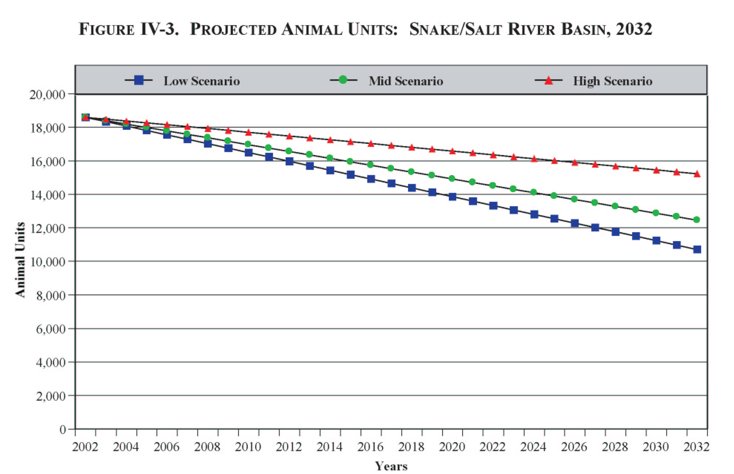
Source: Current livestock authorization levels from interviews with Kemmerer and Pinedale offices, Bureau of Land Management, Bridger-Teton and Caribou-Targhee National Forest personnel and Department of the Interior, 2001. Basin level projections based on historical trends and interviews with local agricultural operators (Resor, Maher).
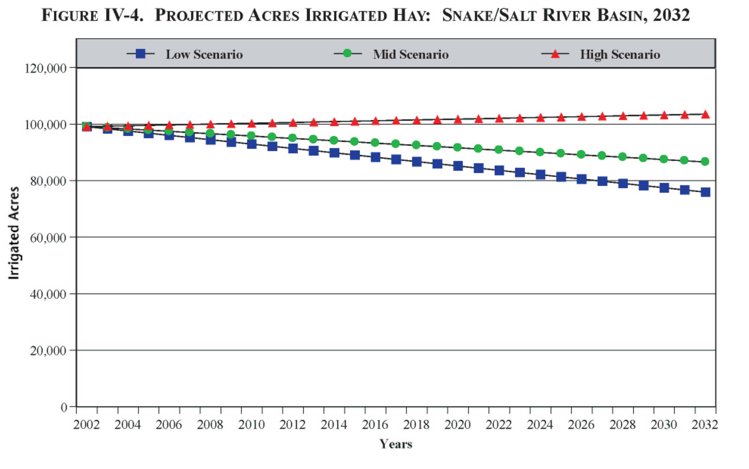
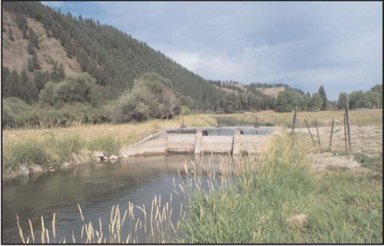
Economic Base Scenario Assumptions for Key Sectors - Tourism
The tourism/recreational sector is the cornerstone of the economy within the Snake/Salt River basin, especially within Teton County. The two primary components of the sector are destination tourists and seasonal residents. Destination tourists are those who plan a trip specifically to visit Grand Teton National Park or some other attraction within the basin. Seasonal residents are those who visit the area for an extended period of time because they have a second home in the area. Visitation within the basin is highly seasonal, with the peak months generally being June through August for summer activities and January through March for winter activities. The following are summary insights into the current recreational trends and the prospects for tourism and visitor related activities in the future, as well as a description of the underlying assumptions for the high, low and mid scenario projections.
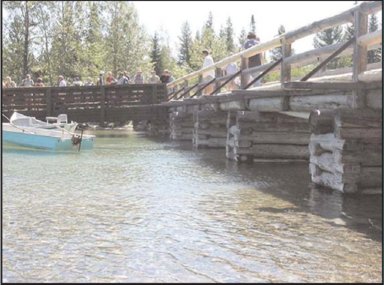
Table IV-6. Number of Visitor Days, Visitor Expenditures and Jobs Supported by
Tourism in the Snake/Salt River Basin, 2032 - High Scenario
| |||||||||||||||||||||||||||||||||||||||||||||||||||||||||||||||||||||||||||||||||||||||||||
Source: Current levels based on Morey and Associates, 1999, 2000; Runyan and Associates, 2001; and Prior and Associates, 2001. Projections based on historical recreational and housing trends in the Basin.
Table IV-7. Number of Visitor Days, Visitor Expenditures and Jobs Supported by
Tourism in the Snake/Salt River Basin, 2032 - Low Scenario
| |||||||||||||||||||||||||||||||||||||||||||||||||||||||||||||||||||||||||||||||||||||||||||
Source: Current levels based on Morey and Associates, 1999, 2000; Runyan and Associates, 2001; and Prior and Associates, 2001. Projections based on historical recreational and housing trends in the basin.
Table IV-8. Number of Visitor Days, Visitor Expenditures and Jobs Supported by
Tourism in the Snake/Salt River Basin, 2032 - Mid Scenario
| |||||||||||||||||||||||||||||||||||||||||||||||||||||||||||||||||||||||||||||||||||||||||||
Source: Current levels based on Morey and Associates, 1999, 2000; Runyan and Associates, 2001; and Prior and Associates, 2001. Projections based on historical recreational and housing trends in the basin.
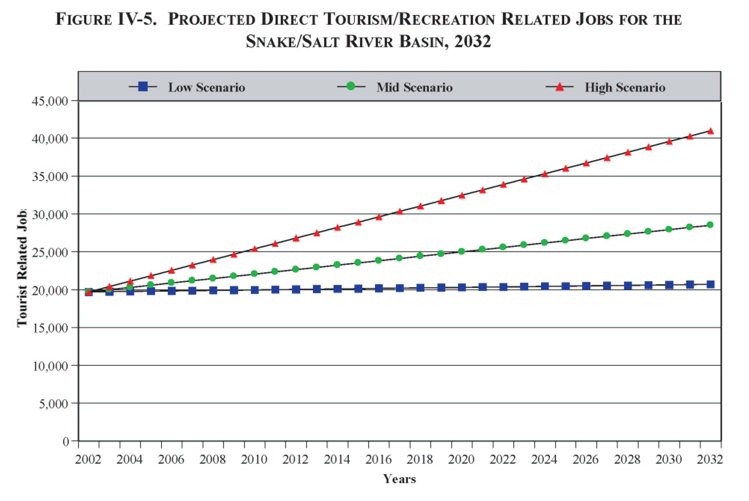
Source: Current levels based on Morey and Associates, 1999, 2000; Runyan and Associates, 2001; and Prior and Associates, 2001. Projections based on historical recreational and housing trends in the basin.
The overall employment projections for the tourism sector described above were distributed across major industrial sectors using monthly Teton County employment data from the Wyoming Department Employment. The seasonal distribution of employment, by sector, is depicted in Figure IV-6.
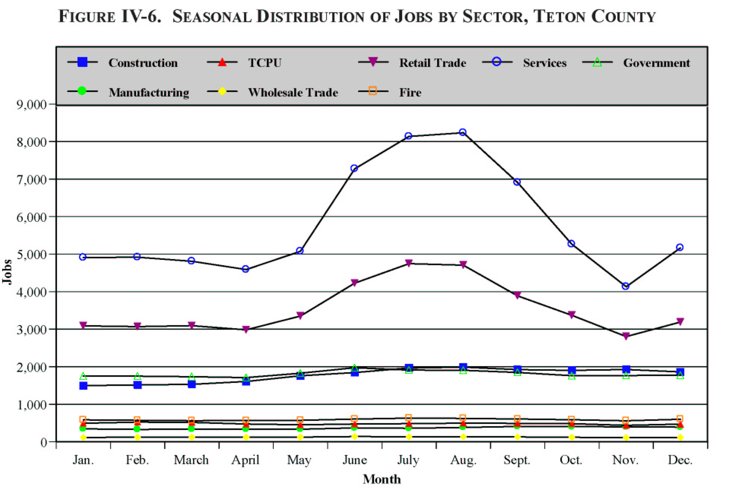
Source: Wyoming Department of Employment
Note: TCPU = Transportation, Communications, & Public Utilities.
Overall Economic and Demographic Projections
The preceding evaluations and assumptions were incorporated into a model of Snake/Salt River basin employment and population in order to develop aggregate estimates of total residents and total jobs in 2032 under each of the three planning scenarios. As previously noted, an inverse relationship exists within the basin between the two key water use sectors (agriculture and tourism) that is well documented. Specifically, growth in the number of visitors implies increased demand for visitor lodging and seasonal residences, which in turn drives up land values and reduces the economic viability of conventional agricultural operations. This implies decreases both in the number of irrigated agricultural acres and commercial livestock production occurring simultaneously with increases in the number of pleasure horses. In fact, such substitution has already been observed in Teton County.
Projected Total Employment in 2032
To fully characterize the economic impact of the growth in employment under each scenario, projected employment changes for the agricultural and tourism sectors were run through an IMPLAN model for the basin. This allowed the study team to estimate the total number of secondary jobs associated with the projected growth in these sectors within the Basin. Results from this analysis indicate that an additional 9,750 secondary jobs would be generated under the High Scenario, 430 secondary jobs under the Low Scenario and 4,020 secondary jobs under the Mid Scenario.
Projected growth in direct and secondary employment for each scenario appears below in Table IV-9. Under the assumptions regarding changes in key economic activities described above, the study team projects that Snake/Salt River basin employment under the High Scenario will more than double, from about 28,200 jobs at present to roughly 76,900 jobs by 2032. This increase would be completely driven by growth in tourism related employment in the Basin, as the number of agricultural jobs would remain essentially constant. Under the Low Scenario, basin wide employment is projected to remain near current levels, increasing by only about 1,800 jobs over the 30-year projections period. Under the Mid Scenario, aggregate employment is projected to increase by roughly 19,600 jobs over the course of the projection period.
Currently, the multiplier, or ratio of total employment to direct basic employment is estimated to be approximately 1.4, indicating that each basic job supports approximately 0.4 additional jobs in local services. Higher multipliers imply relatively larger levels of supporting, indirect basic/local service employment that are characteristic of more thriving, vibrant economies. Accordingly, the study team used increasingly higher multipliers for the Mid and High Scenarios, while leaving the multiplier at the current level under the Low Scenario. Since the actual growth in total employment and corresponding population levels will be subject to the buildout capacity of the area (something that is difficult to project 30 years into the future), the study team employed conservative increases for the multipliers under these scenarios.
Table IV-9. Current and Projected Employment Breakdown in
Snake/Salt River Basin
|
Projected Total Population in 2032
For the high, low, and mid scenarios, projections of total Snake/Salt River basin population were derived from the preceding employment projections. Deriving the population estimates from the projected employment totals for the basin required five steps:
The results of these calculations are shown in Table IV-10 below. Under the High Scenario, the basin's population is projected to more than double, reaching just over 75,000 residents. Under the Low Scenario, population within the basin is projected to experience very little growth over the next 30 years, reaching just over 29,000 residents. Under the Mid Scenario, population within the basin would experience substantial growth over the next 30 years, gaining more than 20,000 additional people to reach a total of almost 47,000 residents.
Table IV-10. Employment and Population Projections for Snake/Salt River Basin
(Numbers Reflect Only Portions of Counties Within Basin)
| ||||||||||||||||||||||||||||||||||||||||||||||||||||||||||||||||||||||||||||||||||||||||||||||||||||||||||||
* Net incommuting assumes 17 percent of Teton County employees come from Teton County Idaho and 2 percent of Teton County residents and 4 percent of Lincoln County residents work in Idaho (Prior and Associates, 2001).
** Number of employed persons is less than number of jobs due to multiple jobholding by individuals. Multiple job factors calculated by dividing State 1998 employment totals by BEA 1998 employment totals.
*** Proportion derived from Census 2000 data
Figure IV-7, below, provides a graphic depiction of the three alternative population projections for the Snake/Salt River basin.
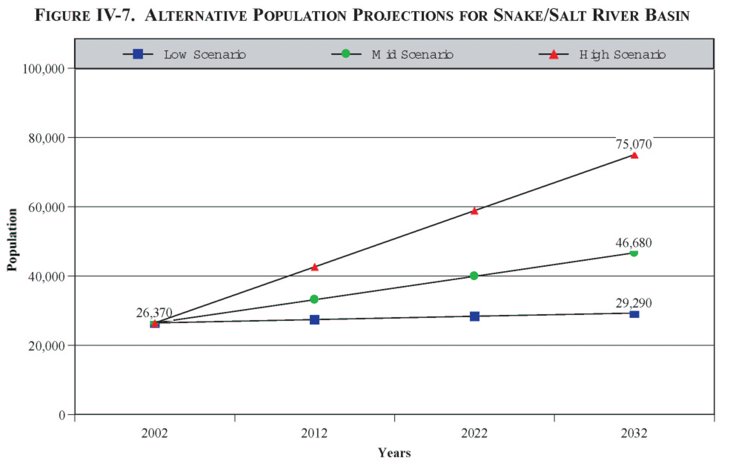
Summary
The study team projected three future scenarios for economic and demographic growth in the Snake/Salt River basin, through the year 2032. All three scenarios employed an economic base modeling approach, in which prospects for the key sectors that either bring money into the region and/or are the source of substantial water use were analyzed in detail. Based upon these analyses, high, low, and middle case alternative forecasts were developed for each key sector. The growth in total employment, and the corresponding population base, was then estimated based upon the key sector projections. Due to the well documented inverse relationship for future development between the agriculture and tourism sectors, the high and low projections presented in the memo are likely more extreme but represent useful bounds for future water planners. It is the study team's judgment that the Mid Scenario is the most realistic and is the most likely scenario to occur.
The three scenarios presented in the memo portray markedly different potential futures for the region. Under the High Scenario, both the number of irrigated acres and commercial livestock within the basin would increase modestly. In contrast, tourism related activity, expenditure and supporting employment would more than double. Under the Low Scenario, both livestock numbers and irrigated acreage would decline sharply due to continued pressure for residential development and changes in public land management policies. The tourism/visitation sector, under this scenario, would remain essentially at current levels. The Mid Scenario projects livestock animal units within the basin to decline by roughly 33 percent, and the number of irrigated acres to decline by roughly 13 percent. Tourism activity, expenditures and employment under this scenario are expected to increase by nearly 40 percent.
Projected Snake/Salt River basin population in 2032 under the High Scenario would reach just over 75,000 residents, compared with almost 47,000 residents under the Mid Scenario and just over 29,000 residents under the Low Scenario, which is similar to year 2002 basin population.
C. FUTURE WATER DEMAND PROJECTIONS
Projected Water Use in Economic Sectors Water Use Factors
This section describes the development of the estimated water use relationships for each of the five key water using economic sectors - agricultural, municipal, rural domestic, industrial and recreational facility - within the basin. Separate estimates of total diversions and consumptive use were calculated for each sector. After a detailed description of the methodology used to develop the water use factor in each sector, the section concludes by presenting a table of all the calculated water use factors for these sectors.
Agricultural Sector
The agricultural sector consists of three primary areas of water use: irrigated crop production, livestock sustenance and dairy water use. It is assumed that all water used by the sector within the basin comes from surface water diversions.
As discussed previously, the majority of the irrigated acreage within the basin is planted to hay, although some small grains (mostly barley) are grown in both Lincoln and Teton Counties. Crop-specific information on monthly consumptive irrigation requirements (CIR) for the period 1971 through 1990 was obtained by the study team. The team then calculated monthly averages for representative "wet," "dry" and "normal" years for the months of April through October.
The mean and maximum of these crop-specific CIR averages was calculated to represent irrigation water use in a "normal" and "high" year. As Table IV-11 below shows, estimated CIR in a normal year averages about 1.3 acre-feet per acre for hay and 0.9 acre-feet per acre for grain across the basin as a whole. During a "high" water use year, these averages climb to 1.5 and 1.4 acre-feet per acre respectively.
Unfortunately, analogous records of total surface water diverted for irrigation were unavailable. Diversion estimates thus had to be constructed by adjusting annual CIR estimates using estimated application and conveyance efficiencies. Estimated application efficiency depends on the relative share of acreage using a gravity or sprinkler irrigation system. The study team assumed application efficiencies of 50 percent for flooded acreage and 70 percent for sprinkler-irrigated acreage.
No conveyance efficiency estimates were readily available, so the 55 percent conveyance efficiency estimated for the central district within the Bear River basin was uniformly applied throughout the Snake/Salt River basin. Resulting annual diversion estimates were converted to an acre-foot per acre basis using the estimated irrigated acreage totals. As Table IV-11 shows, diversions in a "normal" year average about 3.9 acre-feet per acre of hay and 2.3 acre-feet per acre of grain across the basin as a whole. Corresponding diversions during a "high" year are 4.4 and 2.5 acre-feet per acre, respectively.
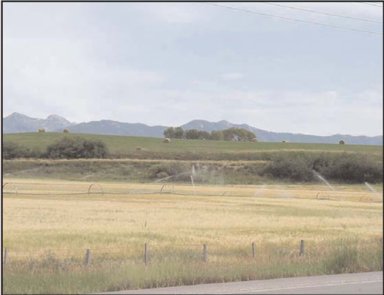
Livestock water use factors in the basin are estimated on a per animal unit basis. Previous estimates have placed daily water requirements at 12 gallons per head for cattle and horses and 2 gallons per head for sheep. Range specialists for the Bridger Teton National Forest estimate a daily requirement of 17.5 gallons for each cow-calf pair. Since a cow-calf pair is the most common definition of an animal unit, it is appropriately converted to yield a livestock water use factor of .02 acre-feet per animal unit per year.
Dairy cattle water use factors in the basin are estimated on a per head basis. Previous studies estimated daily water use factors for dairy cattle at 35 gallons per head and between 22 and 46 gallons per head depending on the season. The study team chose a daily water use factor of 35 gallons per head, which converts to .04 acre-feet per head on an annual basis. It is assumed that all the Star Valley dairies are too small to have significant facility-cleaning water use requirements.
Water use in this sector was analyzed in a simplified fashion on a gallon per day basis due to 1) the large number of diverse water systems within the basin and 2) the fact that very limited information exists on end-user usage for most of these systems. For each municipal and unincorporated water system, the study team collected estimates of year round population, estimated residential equivalent units (includes seasonal and transient residents) and daily water use estimates on both an annual average and peak day basis. By dividing the daily water use estimates by estimates of resident days, it was possible to derive estimates of daily average per capita consumptive use factors for both Teton and northern Lincoln County during a "normal" year.
In order to estimate both a consumptive use factor during a "high" year and diversion factors during "normal" and "high" years for Teton County, the study team obtained aggregate water delivery and wastewater influent monthly averages for the City of Jackson for the recent 7-year period of 1993 through 1999. Corresponding consumptive use totals may be estimated by subtracting influent totals from deliveries. The mean and the maximum of these totals over this 6-year period were calculated to represent current water use in a "normal" and "high" demand year. On average, consumptive use during a "high" demand year was estimated to be 1.6 times that of a "normal" year. In a "normal" year, annual consumptive use is estimated to be 47 percent of total deliveries, and 53 percent of deliveries during the summer months, when an increased share of water use is devoted to outdoor irrigation. During "high" demand years, these percentages climb to 59 percent and 61 percent respectively.
These percentages were applied to Teton County totals because local experts felt that these relationships were reasonably representative of other water systems in Teton County. As Table IV-11 shows, current daily municipal consumptive use in Teton County is estimated to range from 180 gallons per capita during a "normal" year to 290 gallons per capita during a "high" year. Similarly, Teton County estimated municipal diversions range from 380 gallons per capita during a "normal" year to 490 gallons per capita during a "high" year.
In order to calculate diversion and consumptive use factors during a "high" year, water delivery monthly averages for the Town of Alpine for the recent 3-year period of 1999 through 2001 were analyzed. The mean and the maximum of these totals over this period were calculated to represent water use in a "normal" and "high" demand year. On average, water deliveries during a "high" demand year were estimated to be 1.5 times that of a "normal" year. This relationship was assumed to hold for all water systems within Lincoln County. Table IV-11 shows that current daily municipal consumptive use and diversions in Lincoln County is estimated to range from 350 gallons per capita during a "normal" year to 510 gallons per capita during a "high" year.
Rural Domestic Sector
Throughout the basin, the remaining residential water use in the basin consists of domestic use on the individual ranches (and ranchettes) scattered throughout the basin. These ranches pump their water from individual wells located on their property. Very little information exists on water use in this unmetered sector. The study team thus chose an annual average water use proxy of 200 gallons per capita per day and a peak water use proxy of 430 gallons per capita per day for this sector, as water use in this sector is thought to be comparable to rural water systems such as the Skyline Ranch Improvement and Service District. The relationship between water demand during a "normal" and "high" year for Teton County water systems was assumed for this sector. In addition, 100 percent consumptive use is assumed for the rural domestic sector. Note that water use for this sector is accounted for in the aggregate, county-level municipal water use factors described above.
Industrial Sector
Industrial water use in the basin in not substantial. Three primary industrial water users in the basin were identified as part of the Task 2 analysis: Star Valley Cheese Company (SVC), Northern Food and Dairy (NFD) and Water Star Bottling Company (WSB). Although the WSB has closed since the conclusion of Task 2, the town of Afton is recruiting other water bottling companies to take over use of the production facilities. All three plants utilize groundwater supplies.
Current water use for the SVC is estimated to be 140,000 gallons per day, with 120,000 gallons per day discharged from the company's private water treatment plant to the East Side Canal. Current production at the SVC is estimated to be roughly 16 million pounds of cheese per year. Assuming a 5-day workweek, this translates to annual water use factors of 2.3 gallons diverted per pound of cheese produced and 0.3 gallons of consumptive use per pound of cheese produced. This type of industrial water use is assumed to be invariant during normal and high years.
The NFD plant is estimated to use roughly 150,000 gallons per week in the production of various soy-based products. This translates into an industrial water demand of roughly 24 AF per year. Since no information on annual production totals was available, it was not possible to calculate corresponding water use factors. In addition, 100 percent consumptive use is assumed for the NFD plant.
While it was operating, the WSB plant was estimated to use roughly 2.7 million gallons annually. Although production sometimes varied significantly from quarter to quarter, 2001 production was estimated to be 1.4 million gallons of bottled water. This implies a water use factor of 1.9 gallons per gallon of bottled water produced. This type of industrial water use is assumed to be invariant during normal and high years, and consumptive use is assumed to be 100 percent of diversions. The calculated industrial water use factors are presented in Table IV-11.
Recreational Facility Sector
Recreational water use is vitally important to the levels of overall economic activity that occur within the basin. The majority of this use (boating, fishing, etc.) is non-consumptive. At least two important recreational water uses do exist, however, that are both consumptive and critical to existing recreational facilities which in turn are vital for maintaining overall recreation and associated tourism levels: snowmaking at alpine ski areas and golf course irrigation.
Snowmaking
To analyze the water use associated with snowmaking operations, the study team interviewed management representatives of each of the three alpine ski areas within the basin. Each of these three areas has a significantly different scope of snowmaking operations in place, which translates to significantly different water use factors.
The Snow King ski area sits on the edge of the City of Jackson, and the area buys the water used for snowmaking directly from the city. Because Snow King is at a relatively low elevation, snowmaking operations begin earlier, sometimes starting in early to mid-October. Currently, approximately 120 acres at the area receive artificial snow from snowmaking operations. In a typical year, Snow King uses roughly 20 million gallons of water to make snow, but has the capacity to use up to 600 gallons per minute, 24 hours a day if needed. This translates to an annual use of roughly 56 million gallons of water, assuming a 65-day snowmaking operation. This implies water diversion factors of 0.5 acre-feet per acre during a "normal" demand year and 1.4 acre-feet per acre during a "high" demand year.
In contrast to Snow King, Grand Targhee has relied historically on natural snow exclusively and only this year has installed minimal snowmaking operations. Approximately 10 acres at the area will receive artificial snow from snowmaking operations, including portions of the base, Magic Carpet and Tubing Park. Grand Targhee anticipates that roughly 1.25 million gallons of water will be used to make snow this year. Because snowmaking operations are minimal and the area plans to continue to rely largely on natural snow, this total is assumed to be invariant during "normal" and "high" demand years. This implies water diversion factors of 0.8 acre-feet per acre during both types of years.
Jackson Hole Mountain Resort is the largest and best-known ski resort in the basin, and not surprisingly, has the most extensive snowmaking operations. The current acreage base at the area is approximately 265 acres and approximately 60 percent of this acreage can receive artificial snow from snowmaking operations. Jackson Hole Mountain Resort typically uses roughly 80 million gallons in snowmaking operations over the course of 70 days during November, December and January. This implies water diversion factors of 1.5 acre-feet per acre during a "normal" demand year. Information on maximum snowmaking capacity was not available from the area, so the study team assumed the ratio between diversion factors during a "high" demand year and a "normal" demand year to be half that of Snow King, given the higher elevation enjoyed by Jackson Hole Mountain Resort. This assumption implies water diversion factors of 2.2 acre-feet per acre during a "high" demand year.
Distinguishing between diversions and consumptive use for snowmaking operations is difficult, especially given the diversity in the scope of operations that exist within the basin. In previous studies of such operations at ski areas within the Rocky Mountain region, the study team calculated consumptive use to be roughly 20 percent of total diversions. Accordingly, this percentage was applied uniformly to each of the three ski areas in the basin to calculate appropriate consumptive use factors for snowmaking operations. Both diversion and consumptive use factors for each ski area appear in Table IV-11.
Golf Course Irrigation
From roughly May through October, golf is a significant recreational activity within the basin. There are currently five existing courses in the basin, and plans are underway to build another three courses in Teton County and possibly another one in northern Lincoln County. In order to analyze golf course irrigation patterns, the study team interviewed superintendents for each of the existing courses, and obtained information regarding new course development from representatives of the Teton County Planning Department.
The two existing Teton County courses, Teton Pines (TP) and Jackson Hole Golf and Tennis (JHGT) are the largest and most extensively used courses in the basin. Irrigation for these courses may begin as early as mid-April and continue until the end of October. In addition, a more intensive irrigation period occurs during the months of July and August when use is at its peak. TP has approximately 100 acres of turf that is irrigated, irrigates every night, and uses roughly 250,000 gallons per night. Irrigation water use increases to approximately 700,000 gallons per night during the peak use months. In addition, TP has by far the most extensive water hazards of any course in the basin, covering approximately another 65 acres of surface area. By comparison, JHGT has roughly 130 acres of irrigated turf but minimal acreage devoted to water hazards. JHGT typically irrigates every second night and uses approximately 150,000 gallons per night throughout the irrigation season. During the peak months, water usage at JHGT climbs to roughly 750,000 gallons per night. Assuming a conveyance efficiency is similar to that assumed for basin agriculture (55 percent), water diversion factors for a "normal" year of 3.0 and 2.3 acre-feet per acre were calculated for TP and JHGT respectively. Assuming an 80 percent efficiency rate for golf course sprinkler irrigation implies corresponding consumptive use factors of 1.3 and 1.0 acre-feet per acre for these two courses. Similar demand factors for "high" years were calculated assuming that irrigation would occur every night in this instance. Note that the factors for TP remain unchanged since they already irrigate every night.
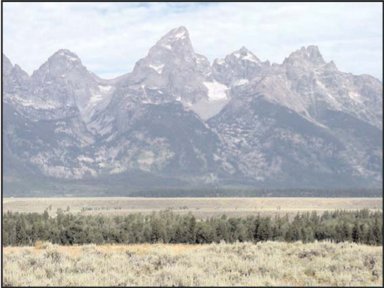
Three new courses are currently at different stages of planning and development that could come on line in Teton County during the 30-year projection period including the Canyon Club, the 4 Lazy F and a course near Teton Village being developed by Snake River Associates. Since the Canyon Club is the farthest along, it serves as the model for the other two courses for purposes of this analysis. Assuming each course covers 120 acres and irrigates in a similar fashion as existing courses (200,000 gallons every other night during the shoulder months and 700,000 gallons every night during peak months) diversion factors of 2.6 and 3.2 acre-feet per acre were calculated for "normal" and "high" demand years for each potential new course. Corresponding consumptive use factors are 1.1 and 1.4 acre-feet per acre for these courses.
The three existing Lincoln County courses, Valli Vu (VV), Star Valley Ranch (SVR) and Star Valley Ranch RV Park (SVRV) are much more modest courses than those in Teton County courses described above. None of these courses have significant water hazards. Irrigation for these courses may begin as early as the beginning of May and continue until the end of September. In addition, a more intensive irrigation period occurs during the months of July and August when use is at its peak. VV has approximately 63 acres of turf that is irrigated, irrigates every other night, and uses roughly 250,000 gallons per night. Irrigation water use increases to approximately 375,000 gallons every night during the peak use months. By comparison, SVR has roughly 100 acres of irrigated turf spread across two courses and 27 holes while SVRV has 80 acres of irrigated turf on its 18-hole course. While SVR follows a similar irrigation pattern as VV (using 700,000 gallons every other night during shoulder months and 1 million gallons every night during peak months) SVRV waters every night throughout the irrigation season, with typical usage of 1 million gallons a night.
According to local experts, only one new course has the potential to come on line in northern Lincoln County during the 30-year projection period. The course is known as the Alpine course and would include only 9 holes over 50 acres. A state of the art irrigation system is already in place, and water usage is estimated at 150,000 gallons every other night during the shoulder months and 275,000 gallons every night during peak months. This implies diversion factors of 2.7 and 3.4 acre-feet per acre for "normal" and "high" demand years at this potential new course. Corresponding consumptive use factors are 1.2 and 1.5 acre-feet per acre. Calculated diversion and consumptive use factors for all courses described above during "normal" and "high" demand years appear in Table IV-11 below.
Projected Annual Water Demands by Scenario
This section presents current and projected annual water demands (both diversions and consumptive use) for the basin under each of three separate scenarios: high, medium and low water use.
Table IV-11. Water Demand Factors by Economic Sector, Annual Diversions and Annual Consumptive Use
| |||||||||||||||||||||||||||||||||||||||||||||||||||||||||||||||||||||||||||||||||||||||||||||||||||||||||||||||||||||||||||||||||||||||||||||||
Water demands are derived by multiplying current or projected demographic or production activity by the water use factors presented previously. Total water diversions and consumptive use are presented and discussed for each sector through three pairs of tables, one pair for each scenario. Patterns of change from current to projected future use by sector.
High Scenario
Under the assumption of a "normal" water year, total basin water diversion requirements are projected to increase by about 11 percent from year 2002 to year 2032 under the High Scenario. In a "high" year, the increase is projected to be around 12 percent. Under "normal" water year conditions, this amounts to an increase of just over 41,000 acre-feet; under "high" demand year conditions, the increase would be about 51,000 acre-feet.
Current and projected water demands under the High Scenario are shown for both consumptive use and diversions in Tables IV-12 and IV-13. Under the High Scenario, total agricultural water demand grows slightly over the projection period. Despite a lack of growth in the sector, agriculture continues to comprise the vast majority of total water demand under the high scenario. The vast majority of agricultural water demand remains in irrigated crop production, with less than 1 percent of total projected agricultural diversions and consumptive use going to direct livestock sustenance and dairy water use.
Under the High Scenario, while municipal water demand in the basin nearly triples over the 30-year projection period, it remains a relatively small sector. The increase is slightly higher in Teton County than Lincoln County because the population increase projected for that county is also slightly higher.
Water demand within the industrial sector is does not change substantially over the projection period under the High Scenario. Industrial diversions and industrial consumptive use are likely to continue to be minor considerations within the basin.
Water demand in the recreational facility sector increases substantially under the High Scenario. Water used in snowmaking is projected to more than double while golf course irrigation water is projected to increase by roughly 60 percent over the projection period. Overall, this sector is expected to remain relatively small.
The share of aggregate water demand met by ground water resources within the basin increases over the projection period under the High Scenario. Groundwater diversions increase from 3 percent to 8 percent while groundwater consumptive use increases from 5 percent to 13 percent. This increase is reflective of the relative increase in the municipal sector combined with the stability exhibited in the agricultural sector under the High Scenario.
Table IV-12. Current and Projected Annual Snake/Salt River Water Demand High Scenario, Annual Diversions in Acre Feet per Year
| |||||||||||||||||||||||||||||||||||||||||||||||||||||||||||||||||||||||||||||||||||||||||||||||||||||||||||||||||||||||||||||||||||||||||||||||||||||||||||
Source: Multiple Interviews
Table IV-13. Current and Projected Annual Snake/Salt River Water Demand High Case Scenario, Annual Consumptive Use in Acre Feet per Year
| |||||||||||||||||||||||||||||||||||||||||||||||||||||||||||||||||||||||||||||||||||||||||||||||||||||||||||||||||||||||||||||||||||||||||||||||||||||||||||
Source: Multiple Interviews
Low Scenario
Total water diversion requirements under the Low Scenario in a "normal" year are projected to decline by 20 percent from 2002 to 2032. However, in any given year during this period, there might be the need for an additional 37,000 acre-feet in a "high" demand, dry year compared with a "normal" year. Current and projected water demands under the Low Scenario are shown for both consumptive use and diversions in Tables IV-14 and IV-15.
Under the Low Scenario, total water demand in the agricultural sector declines over the projection period. Since both irrigation diversions and consumptive use are projected to decline overall agricultural demand declines correspondingly. The decline in livestock water demand directly reflects the increase residential development pressure in the basin as well as potential grazing policy changes on public lands. Under the Low Scenario, the Star Valley dairy industry disappears over the projection period.
In the municipal sector, the 11 percent increase in both diversions and consumptive use is the direct result of the projected increases in basin population levels. Population in thebBasin is projected to grow at a similar rate under the Low Scenario. Under the Low Scenario, two of the three current industrial water users within the basin are assumed to be eliminated.
Water demand in the recreational facility sector remains constant under the Low Scenario as no new ski area expansions or golf course developments are assumed to occur during the projection period. Overall, this sector is expected to remain relatively small.
Table IV-14. Current and Projected Annual Snake/Salt River Water Demand Low Case Scenario, Annual Diversions in Acre Feet per Year
| |||||||||||||||||||||||||||||||||||||||||||||||||||||||||||||||||||||||||||||||||||||||||||||||||||||||||||||||||||||||||||||||||||||||||||||||||||||||||||
Source: Multiple Interviews
Table IV-15. Current and Projected Annual Snake/Salt River Water Demand Low Case Scenario, Annual Consumptive Use in Acre Feet per Year
| |||||||||||||||||||||||||||||||||||||||||||||||||||||||||||||||||||||||||||||||||||||||||||||||||||||||||||||||||||||||||||||||||||||||||||||||||||||||||||
Source: Multiple Interviews
Mid Scenario
Assuming a "normal" water year, total basin water diversion and consumptive use requirements are projected to decline by about 9 percent and 7 percent respectively from year 2002 to year 2032 under the Mid Scenario. In a "high" year, the decline is projected to be similar. The projected difference in aggregate diversions and aggregate consumptive use under "normal" and "high" year water year conditions amounts to roughly 34,000 acre-feet and 10,000 acre-feet respectively. Current and projected water demands under the Low Scenario are shown for both consumptive use and diversions in Tables IV-16 and IV-17.
Despite the projected decline in agricultural demand, agriculture continues to comprise the vast majority of total water demand under the Mid Scenario. The vast majority of agricultural water demand remains in irrigated crop production, with less than 1 percent of total projected consumptive use going to direct livestock sustenance and dairy water use.
While municipal water demand increases, it remains a relatively small sector. Municipal consumptive use is projected to increase over the projection period. As before, the larger increase in Teton County reflects the larger increase in population projected for that county.
Both water diversions and consumptive use in the basin industrial sector is projected to remain unchanged from current levels. Industrial water use will remain a small component of overall basin water use.
Water demand in the recreational facility sector grows substantially under the Mid Scenario as the first phase of the planned ski area expansions and a portion of the planned golf course developments within the basin are projected to be completed. In spite of the fact that both snowmaking and golf course irrigation demands are projected to increase, this sector remains relatively small overall.
The share of total diversions and consumptive use from groundwater sources is projected to increase, which is reflective of the significant increase in the municipal sector combined with the decline exhibited in the agricultural sector under the Mid Scenario.
Table IV-16. Current and Projected Annual Snake/Salt River Water Demand Mid Case Scenario, Annual Diversions in Acre Feet per Year
| |||||||||||||||||||||||||||||||||||||||||||||||||||||||||||||||||||||||||||||||||||||||||||||||||||||||||||||||||||||||||||||||||||||||||||||||||||||||||||
Source: Multiple Interviews
Table IV-17. Current and Projected Annual Snake/Salt River Water Demand Mid Case Scenario, Annual Consumptive Use in Acre Feet per Year
| |||||||||||||||||||||||||||||||||||||||||||||||||||||||||||||||||||||||||||||||||||||||||||||||||||||||||||||||||||||||||||||||||||||||||||||||||||||||||||
Source: Multiple Interviews
Projected Monthly Demands by Scenario
Current and projected monthly water demands have been prepared for the basin under the High, Low and Mid scenarios. Monthly water demands are derived by multiplying current and projected annual water demands for each sector by observed monthly shares of annual water use over the historical period. Total water diversions and consumptive use are presented and discussed for each sector through three tables, one for each scenario.
An analysis of the temporal distribution of water demands throughout the year illustrates the seasonal nature of water demand within the basin. Almost all sectors exhibit a significant difference in demand between the peak summer months and the off-peak winter months. Such distinct seasonal patterns in water demand are characteristic of economies for areas with colder climates similar to the basin. One simplifying assumption is that the temporal distribution of diversions and consumptive use throughout the year are identical.
The distribution of irrigation water demand was calculated from the aggregate CIR information obtained by the study team. As expected, positive demand for irrigation water occurs only from April through October. Livestock water demand is assumed to be twice as high during the months of April through September to reflect both the presence of the spring calf crop and the increased temperatures during those months. Water demand for the basin's dairy industry is assumed to be distributed in a similar fashion.
Municipal water demand in Teton County was based on the average monthly water use observed for the City of Jackson in 1993-99. This seasonal distribution was assumed to extend to all other water systems throughout the county. Municipal water demand in Lincoln County was based on the average monthly water use observed for the Town of Alpine in 1999-2001. The seasonal distribution is similar to that observed for Jackson, and was assumed to extend to all other water system throughout Lincoln County.
Industrial water demand in the Basin was assumed to be constant throughout the year, with the exception of the NFD. Since production varies according to nation supply and demand for soy products, the study team derived a seasonal water use distribution from monthly data on the domestic consumption of soybean products. The distribution exhibited minimal variance, peaking slightly from September through November and reaching a minimum during the summer months.
Data used to determine the seasonal distribution of water demand in the recreational facility sector was obtained through interviews with management of local ski areas and golf courses. Water demand in this sector exhibits a bi-modal seasonal distribution. Snowmaking in the basin begins in early October and may run through mid-January. Roughly half of the basin's snowmaking water use occurs during the month of November. In contrast, the golf course irrigation season may start as early as mid-April and run through the end of October. Lincoln County courses have only a slightly shorter irrigation season. Overall, nearly 60 percent of golf course irrigation water in the basin is used during the peak months of July and August.
High Scenario
The aggregate temporal distribution of water demand in these sectors within the basin under the High Scenario is presented in Table IV-18 below. It is possible to divide the months into three categories of water use: the baseline or off-peak months of September through April; the peak months of June and July; and the shoulder months of May and August.
Table IV-18. Current and Projected Monthly Snake/Salt River Basin Water
Demand High Case Scenario, Estimated Diversions and Consumptive Use in Acre Feet
| |||||||||||||||||||||||||||||||||||||||||||||||||||||||||||||||||||||||||||||||||||||||||||||||||||||||||||||||||||||||||||||||||||||||||||||||
The distribution of percentage increases over the 2002-2032 projection period is exactly inverted, with the largest percentage increases coming the baseline months (roughly 160 percent) and the smallest percentage increases coming during the peak months (roughly 9 percent). This result stems from the fact that the largest water-using sector in the baseline months is the municipal sector (the fastest growing sector) while the primary water-using sector in the peak months is the agricultural sector (the slowest growing sector).
Low Scenario
The aggregate temporal distribution of water demand in the basin under the Low Scenario is presented in Table IV-19 below.
Table IV-19. Current and Projected Monthly Snake/Salt River Basin Water Demand
Low Case Scenario, Estimated Diversions and Consumptive Use in Acre Feet
| |||||||||||||||||||||||||||||||||||||||||||||||||||||||||||||||||||||||||||||||||||||||||||||||||||||||||||||||||||||||||||||||||||||||||||||||
Under the Low Scenario, water demand for the basin increases slightly (between 4 and 6 percent) from October through March but declines from April through September. The sharpest projected decline (roughly 21 percent) comes during the peak summer months. Both the sharp decline projected for the agricultural sector combined with the overall dominance of that sector in terms of water demand determines the pattern of change under the Low Scenario.
Mid Scenario
The aggregate temporal distribution of water demand in the basin under the Mid Scenario is presented in Table IV-20 below.
Table IV-20. Current and Projected Monthly Snake/Salt River Basin Water
Demand Mid Case Scenario, Estimated Diversions and Consumptive Use in Acre Feet
| |||||||||||||||||||||||||||||||||||||||||||||||||||||||||||||||||||||||||||||||||||||||||||||||||||||||||||||||||||||||||||||||||||||||||||||||
The temporal distribution of water demand under the Mid Scenario essentially splits the difference between the patterns exhibited under the other two scenarios. As can be seen in Table IV-20, significant increases (between 48 and 69 percent) are projected for the months of October through April (driven by municipal demand) while slight decreases (roughly 10 percent) are projected for the peak months of May through August (driven by agricultural demand). September exhibits a more modest increase of roughly 11 percent.
Projected Water Use in the Environmental Sector
Environmental water uses are difficult to define, and the development of a completely comprehensive list of these uses is beyond the scope of this project. Accordingly, the study team chose to restrict the definition of environmental uses to include only those uses associated with efforts aimed at restoring, maintaining or improving the environmental services provided by the water resource, such as fish and wildlife habitat.
The study team identified a set of important existing and potential environmental efforts within the basin. These efforts fell into two distinct categories: 1) Instream Flow (ISF) agreements and 2) Wetlands projects. For each effort, the team quantified current water use, and projected future water use for a High, Low and Mid Scenario.
Water Use Factors
Instream Flow Agreements
The first category of environmental water demands is existing or potential ISF agreements. Because these flows may not be diverted for other uses, they must be treated as a separate, incremental water demand within the basin. Both the temporal and spatial aspects of ISF agreements are important. Most ISF agreements specify an average flow level for all months throughout the year that must be met in a specific reach targeted by the agreement. Additionally, the location of the affected reach is critical, since an ISF requirement will affect all potential upstream uses.
An existing (though informal) ISF agreement within the basin requires the maintenance of a minimum flow level for a reach of the Snake River, located just below Jackson Lake. Jackson dam enables controlled releases from Jackson Lake in order to maximize the benefit to agricultural water right holders located downstream in Idaho. The Wyoming Game and Fish Department (WGF) determined that historical releases during the winter months were insufficient for maintaining adequate fish habitat in this reach of the river. Accordingly, the WGF and the Bureau of Reclamation (BOR) agreed to release enough water to maintain a minimum flow of 280 cubic feet per second (cfs) from October to April. In addition, the State of Wyoming can transfer the storage of 33,000 acre-feet of water from Palisades Reservoir to Jackson Lake for use by the WGF.
In addition to this agreement, four separate ISF applications have been filed with the Wyoming State Engineer’s Office (SEO) that affect reaches located within the basin. Specifically, these applications include reaches on the Salt River (221 cfs), the Greys River (204 cfs from July to March and 350 cfs from April to June) and two separate, but closely proximate reaches on Fish Creek (150 cfs each). The approval of any or all of these applications would significantly increase the amount of water committed to environmental uses within the basin.
Wetlands Projects
A second category of environmental water demand within the basin is water dedicated to wetland areas. This water should, in theory, be treated as an incremental water demand because of the environmental services it provides. Maintaining an accurate accounting of such water is difficult, however, because wetlands are often difficult to define, and considerable wetland activity is occurring within the basin.
There is general agreement that fewer wetlands exist within the basin today than 100 years ago due to draining for agricultural uses and residential development. Since the enactment of the Clean Water Act, however, all regulated (naturally occurring) wetlands that are drained and filled must be mitigated. The Army Corps of Engineers keeps a strict count of the basin acreage associated with such mitigation projects. In addition, a significant amount of pond construction occurs on private residential lands within the basin for aesthetic reasons. The water associated with these projects may most accurately be characterized as irrigation since they often utilize the agricultural water right obtained with the land and are frequently accompanied by continued irrigation practices on other portions of the acreage.
Because accurate accounting of wetlands is so difficult, the study team chose a conservative approach for estimating the associated water demand. Only wetlands projects that specifically target wildlife habitat improvement are included in the estimates. While the list of projects presented here is not all-inclusive, it provides a flavor of some existing and potential wetlands projects in the basin.
The first entry in this category is a group of wetlands projects to be undertaken by the Jackson Hole Land Trust (JHLT). These projects aimed at the restoration of habitat for Wyoming Trumpeter Swans and other waterfowl habitat. Pending grant approvals, they plan to fund projects at 13 separate sites in the basin, 11 of which involve either the restoration of existing wetlands or the creation of new wetlands. The majority of the projects are located near Jackson with the remainder located on lands adjacent to the Gros Ventre River.
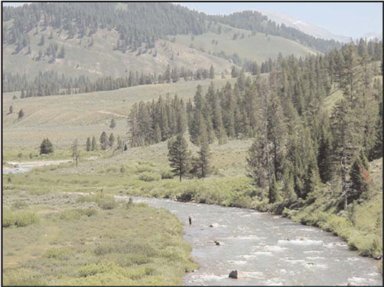
The total affected acreage in these projects is roughly 1,000 acres, including 530 upland acres and 470 wetland acres. Average depth on the affected wetland acres is unknown and probably varies substantially. Accordingly, a proxy of 5 feet was used, an amount equivalent to the average irrigation of pasture in Teton County.
A second set of projects in this category are wetland impoundments within the National Elk Refuge, which is located just north of Jackson and is administered by the United States Fish and Wildlife Service (USFWS). According to its website, therRefuge consists of 25,000 acres, including nearly 1,000 acres of open water and marsh lands. According to the refuge biologist, however, the total open-water surface area within the refuge is roughly 290 acres, including approximately 75 acres of wetlands created from impoundments. These wetland impoundments have an average depth of approximately three feet.
The final wetlands project included in this analysis is a wildlife viewing area created by the WGF at the upper end of Palisades Reservoir in Lincoln County. The project consists of seven separate ponds created through a system of dikes. The surface area of these ponds totals roughly 115 acres, and the total area of the project is estimated to be 300 acres. Total holding capacity of the ponds is estimated to be roughly 215 acre-feet, for an average depth of roughly 1.9 acre-feet per acre. While up to 30 cfs may be diverted for this project, the projects holding capacity is assumed to accurately reflect the environmental water demand associated with the project.
Projected Annual Environmental Water Demands by Scenario: High Scenario
Total annual environmental water demand is projected to grow by almost 400 percent from year 2002 to year 2032 under the High Scenario. This amounts to an increase of just over 450,000 acre-feet in environmental water demand.
This increase is the result of two important assumptions: 1) that all existing instream flow applications are approved and 2) that all the wetlands projects proposed by the JHLT are funded and implemented. The instream flow agreements would account for an additional 440,000 acre-feet of environmental water demand or nearly 97 percent of the total estimated increase. It is acknowledged that the flow rates given in the ISF applications could be changed if a permit is actually granted, which could greatly effect the environmental water demand. Under the High Scenario, it is also assumed that water use currently committed to Snake River minimum flows, NER wetlands and the Palisades wildlife viewing area would remain at current levels. Table IV-22 below presents current and projected environmental water uses under the High, Low and Mid Scenarios.
Table IV-22. Annual Environmental Water Demands in Acre Feet per Year - High, Low and Scenarios
| ||||||||||||||||||||||||||||||||||||||||
Low Scenario
Under the Low Scenario, total annual environmental water demand is projected to decline by roughly 70 percent from year 2002 to year 2032. This amounts to a decrease of just over 85,000 acre-feet in environmental water demand.
The projected decline under the Low Scenario is solely attributable to the change in assumed annual instream flows in the reach of the Snake River near Moran. The current informal agreement between BOR and WGF is assumed to dissolve, and WGF is thus compelled to release the 33,000 acre-feet currently stored in Jackson Lake in order to preserve fish habitat. In addition, the Low Scenario assumes that none of the instream flow applications currently on file will be approved and that the JHLT is unsuccessful in receiving NAWCA funding for its proposed wetlands projects. All other existing environmental uses are assumed to remain at current levels.
Mid Scenario
Under the Mid Scenario, total environmental water demand is projected to increase by 300 percent from year 2002 to year 2032. This amounts to an increase of just over 340,000 acre-feet in environmental water demand. The overall increase results directly from approval of certain ISF applications and half of the proposed JHLT wetlands projects. Under this scenario, however, only the ISF applications on the Salt and Greys River are assumed to be approved. The ISF applications for Fish Creek are assumed to be denied, because average historical flows are less than the requested ISF amount for seven months during the year. Table IV-23 below presents historical mean flow levels together with instream flow requests, on a monthly basis, for each of the affected reaches in the basin.
Table IV-23. Historical Monthly Mean Flows and Requested Minimum Instream
Flows for Affected Reaches in the Snake/Salt River Basin
(Measured in Cubic Feet per Second)
| |||||||||||||||||||||||||||||||||||||||||||||||||||||||||||||||||||||||||||||||||||||||||||||||||||||||||||||||||||||||||||||
Source: Historical data are averages calculated from USGS monthly flow data published online at http://nwis.waterdata.usgs.gov/wy/nwis/monthly. Requested minimum flows are from WGF and from applications on file at the SEO.
According the representatives of the SEO office, it unlikely that applications requesting greater ISF than historical averages will be approved. The approved ISF requirements would, nevertheless, be responsible for an additional 330,000 acre-feet of environmental water demand or nearly 98 percent of the total estimated increase. The water currently committed to Snake River minimum flows, NER wetlands and the Palisades wildlife viewing area is assumed to remain at present levels under the Mid Scenario.
Projected Monthly Environmental Water Demands by Scenario
Current and projected monthly environmental water demands have been prepared for the basin under the High, Low and Mid scenarios. The aggregate distribution of environmental water demand in the basin was calculated using separate assumptions about each of the individual water uses. For example, positive demand for a minimum flow in the Snake River just below Jackson dam occurs only from October through April. Likewise, each of the ISF applications have temporal specifications. As seen above in Table IV-23, while the applications for the Salt River and Fish Creek involve a uniform flow throughout the year, the Greys River application has a slightly higher demand during the months of April through June.
Environmental water demand for both the NER wetlands and the JHLT wetland projects is assumed to be uniformly distributed throughout the year. The distribution of environmental water demand for the Palisades wildlife viewing area is assumed to be perfectly correlated with average historical water levels at the Palisades Reservoir. The aggregate temporal distribution of water demand in these sectors within the basin under the High, Low and Mid Scenarios is presented in Figure IV-8 below.
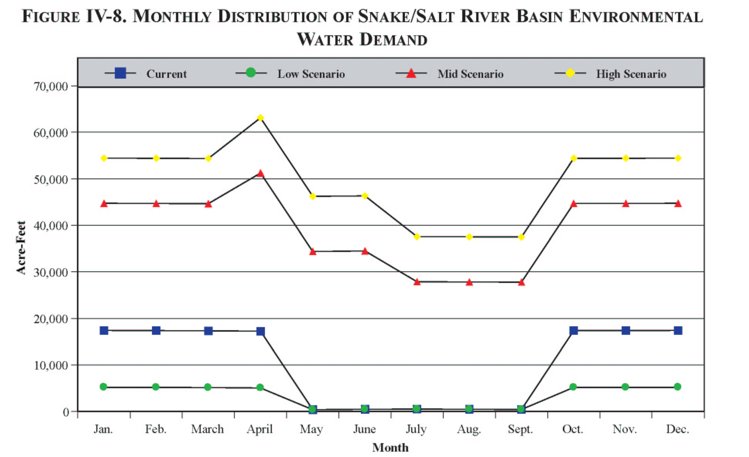
As demonstrated in the above figure, ISF requirements are the most important factor in determining the monthly distribution of environmental water demands. For example, current monthly demands are almost completely defined by the minimum flow requirement below Jackson Lake. During the months of October through April when this requirement is in place, environmental water demand in the basin shifts from less than 1,000 acre-feet to nearly 20,000 acre-feet.
Similarly, the assumption that all ISF applications are approved under the High Scenario serves to dramatically increase water demand in this sector throughout the year. Monthly environmental water demand under the High Scenario ranges between 38,000 and 63,000 acre-feet. Demand is at its low point during the summer months (when there is no minimum flow requirement on the Snake River) and peaks in the month of April when all ISF requirements are at a maximum.
Under the Low Scenario, environmental water demand for the basin remains at current levels from May through September and decreases by roughly 70 percent from October through April. The decline during these months results directly from the assumption that WFG is forced to utilize its water reserves stored in Jackson Lake to maintain fish habitat in the reach of the Snake River near Moran. All other environmental water demands identified here are projected to remain at current levels under the Low Scenario.
Although proportionately smaller, the seasonal distribution of water demand under the Mid Scenario is nearly identical to that projected under the High Scenario. The difference in monthly demands under the two scenarios is roughly 11,000 acre-feet, and is largely determined by the assumption that only two of the four ISF applications will be approved. The assumption that only a portion of the JHLT wetlands projects will be funded under the Mid Scenario also affects this difference, but its impact is much smaller.
Summary
This section has presented the water demand projections developed for the Snake/Salt River basin under three alternative scenarios. The methodology used to derive the quantitative relationships (water use factors) for each water use sector is outlined and discussed. These water use factors, together with projected demographic and economic information, are applied to develop annual water use projections by sector under three alternative scenarios. Observed monthly distributions of annual totals for each sector allowed the study team to derive monthly aggregate water use projections for each scenario.
Among the economic sectors, the largest projected changes in water demand occur in the municipal sector. Total municipal water demand remains small relative to water demand in the agricultural sector. While the agricultural sector experiences the smallest percentage change over the projection period, the sector's relative magnitude allows it to drive projected annual and monthly water use patterns. Although industrial water use is largely eliminated under the Low Scenario, the sector's diminutive size implies a minimal overall impact on water demand in the basin under any scenario. The recreational facility sector is also comparatively small, but exhibits substantial increases in demand under both the High and Mid scenarios.
The second portion of this section presented water demand projections for the environmental sector. Demand in this sector was defined to include only water used in existing and potential efforts aimed at enhancing environmental services such as fish and wildlife habitat. Scenarios were defined for this sector through the study team's assessment of the likelihood of future activity in the basin. The approval or denial of ISF agreements largely drives future water demand in this sector. Wetlands projects undertaken in the basin make a comparatively minor contribution to water use in the environmental sector.
V. FUTURE WATER USE OPPORTUNITIES
A. INTRODUCTION
This section discusses the procedures used to create a list of potential future projects that would utilize the water resources in the Snake/Salt River basin. This list represents the needs and desires of those in the basin, and provides a starting point for additional beneficial uses of water in the future. A long list of potential projects was first developed with input from the Basin Advisory Group (BAG). This list was then reduced and evaluated with respect to various criteria, resulting in a short list of potential projects which can be compared to one another within a given use category.
B. LONG LIST OF FUTURE WATER USE OPPORTUNITIES
The long list of future water use opportunities was created at the BAG meeting held in Moran on August 14, 2002. At this meeting, input was collected from various BAG members as well as others in attendance. Any and all input was welcome, and a wide variety of issues was discussed while adding items to the list, including past studies. The long list put together at that meeting ended up with projects for uses such as irrigation, hydropower, wetlands, water storage, recreation, and others.
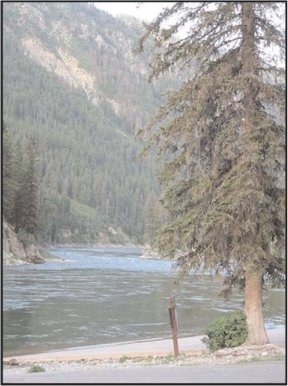
While input during the BAG meeting was exceptional, there were many BAG members who were not in attendance. It was determined that the resulting long list should be distributed to the entire Basin Advisory Group in order to give everyone a chance to comment. The list was distributed via email on August 26, 2002, with a request for each BAG member to review the items and provide any input they wished. Some additional input was received following the email distribution.
C. SHORT LIST OF FUTURE WATER USE OPPORTUNITIES
Following the creation of the long list and collection of BAG member input, the resulting list was reviewed in order to reduce the list to a collection of potential water use projects. Some items on the long list, while they may be worthy of further discussion in other circles, did not warrant further investigation as part of this basin plan. This was generally for items that could only be addressed by specific state agencies, and included reciprocal fishing licenses between Idaho and Wyoming and septic tank management. The item regarding support of local conservation district projects was dropped, as there was not a specific project to be included at this time. Also, projects that appeared to have a low probability of support or feasibility were dropped, which included beaver management, terracing at high elevations, and trans-basin water diversions.
The short list of future water use opportunities consists of the remaining projects from the long list. The short list projects were then reviewed by the basin planning team and evaluated based on the short list criteria.
Short List Criteria:
A list of criteria used to evaluate the short list was created as part of this basin plan. Similar criteria have been used on all of the previous basin plans, although some changes were made to better fit the situation in the Snake/Salt River basin. For example, political acceptance was looked at in addition to public acceptance, and environmental constraints were reviewed due to the large amount of federal land and the constraints placed on those lands through environmental laws. Also, a criteria regarding multiple use was added.
The following criteria were used to evaluate the short list of future water use opportunities. Each item was scored on a scale of 1 to 10, with 1 being not feasible and 10 being very feasible.
Evaluation of each project on the short list using the above described criteria resulted in a final number or score. It must be emphasized that the projects were evaluated with respect to other like projects. For example, an agricultural project regarding irrigation was not compared to an environmental project regarding wetlands. Also, the Short List was broken into sub-basins, as issues that can effect the evaluation of a project in the Snake River basin will be different than those in the Salt River basin. The results of this evaluation are located in Tables V-1 and V-2. Figure V-1 outlines the locations of these future water use opportunities across the basin. It must be mentioned that evaluation of the Short List is very subjective, and evaluation by those with various backgrounds would likely produce a variety of results.
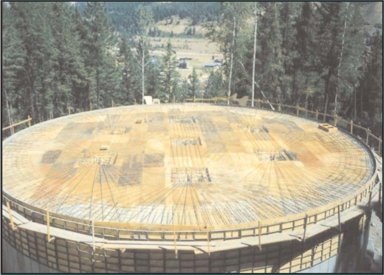
Table V-1. Snake River Sub-Basin Short List Selection Critiera
| |||||||||||||||||||||||||||||||||||||||||||||||||||||||||||||||||||||||||||||||||||||||||||||||||||||||||||||||||||||||||||||||||||||||||||||||||||||||||||||||||||||||||||||||
Table V-2 Salt River Sub-Basin Short List Selection Criteria
| |||||||||||||||||||||||||||||||||||||||||||||||||||||||||||||||||||||||||||||||||||||||||||||||||||||||||||||||||||||||||||||||||||||||||||||||||||||||||||||||||||||||||||||||||||||||||||||||||||||||||||||||||||||||||||||||||||||
D. LEGAL AND INSTITUTIONAL CONSTRAINTS
In recent years, federal and state laws, rules, regulations and policies have effected the business of water development and management. The purpose of this section is to identify and discuss some of these institutional constraints on the development and use of water and review how they relate to issues in the Snake/Salt River basin.
Federal Environmental Laws:
In the late 1960's and early 1970's, Congress passed legislation to protect the environment. Prior to the passage of these laws, most water projects were designed and operated for specific consumptive uses for municipal, agricultural or industrial purposes or to provide flood control or recreation benefits. Any environmental benefits derived from the projects were indirect and incidental to the purposes for which they were designed. While such benefits could be considerable, they were not protected or required by law. With the passage of environmental laws, a variety of environmental protection and mitigation actions became a "standard" consideration in the development of water projects as well as for many other types of projects. These considerations often included minimum streamflow releases and mitigation for impacted wetlands as requirements of federal approvals or permits for a particular project. At the same time, the economic and environmental benefits of recreation, fisheries, wetlands and other habitats were documented and became more apparent to the public and developers alike, which resulted in minimum reservoir pools or streamflows often becoming a planned component of reservoir operations.
Water supply development projects often require "a federal action" that initiate or trigger the federal environmental law reviews and permitting. These actions or where there is a "federal nexus" include, but are not necessarily limited to, the following:
The only water development activity that is not subject to federal environmental laws is drilling a well with non-federal funds on non-federal lands outside the banks of rivers, streams, and wetlands. However, piping the water from such wells across federal lands or rivers, streams, and wetlands could initiate a federal environmental review and a federal permitting or approval action.
Endangered Species Act
The Endangered Species Act of 1973 (ESA) declares the intent of Congress to conserve threatened and endangered species and the ecosystems on which they depend. This law requires all federal agencies, in consultation with the Secretary of Interior, through the U.S. Fish and Wildlife Service (USFWS), or the Secretary of Commerce, through the National Marine and Fishery Service (NMFS) to use their authorities in the furtherance of ESA purposes by carrying out programs for the conservation of species and by taking such actions necessary to insure any action authorized, funded, or carried out by the agency is not likely to jeopardize the continued existence of such threatened or endangered species or result on the destruction or adverse modification of critical habitat of such species as determined by USFWS or NMFS. These agencies will make a biological determination as to whether wildlife and plant species are endangered or threatened based on the best available scientific information.
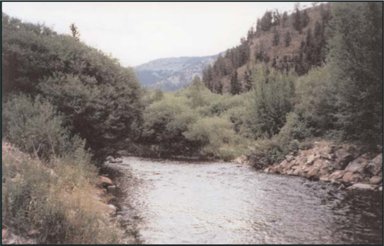
The current list of species maintained by the FWS for areas in or near the Snake/Salt River Basin (Lincoln, Sublette and Teton Counties) within Wyoming includes the:
| • Bald Eagle | Threatened (proposed for de-listing) |
| • Black-Footed Ferret | Experimental, prairie dog towns |
| • Canada Lynx | Threatened |
| • Gray Wolf | Experimental, non-essential population |
| • Grizzly Bear | Threatened |
| • Mountain Plover | Proposed for listing, grasslands |
| • Ute ladies'-tresses | Threatened, possible statewide in habitat below 6,500 feet |
In addition, a separate technical memorandum for this basin plan discusses the listed endangered salmon and steelhead anadromous fish species in the river downstream from Wyoming's border that can potentially affect or limit the use of water within Wyoming. All of these species are covered by the various provisions of ESA and must be considered in the development of most any water related project.
National Environmental Policy Act
NEPA requires all agencies of the Federal government to insure that presently unquantified environmental amenities and values be given appropriate consideration in decision making along with economic and technical considerations. The Act requires that federal agencies consider all reasonably foreseeable environmental consequences of their proposed actions. The conclusions of the environmental review of that action under NEPA can be in the form of (listed in order of increasing complexity, cost and time); 1) a categorical exclusion, where there are no impacts or when an action has been analyzed and documented through other NEPA planning processes, 2) the preparation of an environmental assessment (EA), which sometimes will result in a finding of no significant impact (FONSI) often summarized in a letter from the action agency, or where the documented impacts in an EA cannot be mitigated, 3) the preparation of an environmental impact statement (EIS). The EIS process is used on large, complex and controversial projects or for those projects where significant environmental impacts are identified and documented. Further, NEPA requires federal decision makers to "study, develop, and describe appropriate alternatives to recommended courses of action in any proposal which involves unresolved conflicts concerning alternative uses of available resources." (42 USC 4321 et seq., Sec. 102 (2) E).
Clean Water Act
Section 404 of the Clean Water Act of 1972 (CWA) prohibits discharging dredged or fill materials into waters of the United States without a permit from the U.S. Army Corps of Engineers (COE). The waters of the United States include rivers and streams and initially, as of 1975, wetlands. Specific references to isolated wetlands were addressed in 1984 and there continues to be litigation surrounding the extent of regulation on wetlands, which are most often evaluated on a case-by-case basis. COE policy requires applicants for 404 permits to avoid impacts to waters of the U.S. to the extent practicable, then minimize the remaining impacts, and finally, take measures to mitigate unavoidable impacts.
Section 401 of the CWA requires that any applicant for a federal license or permit to conduct any activity including … construction or operation of facilities, which may result in any discharge into the navigable waters … shall provide the licensing or permitting agency a certification from the State in which the discharge originates that the discharge shall comply with state water quality standards. In Wyoming, the Department of Environmental Quality (DEQ) handles the Section 401 certification program as well as implementing CWA Sections 303(d), 305(b) and 319. Section 303(d) of the Clean Water Act requires the State of Wyoming to identify water bodies that do not meet uses, as designated by stream classifications, and are not expected to meet water quality standards after application of technology-based controls. This aspect of the law is also intended to identify a priority ranking for each water quality limited stream segment and develop total maximum daily loads (TMDL) to restore each water body segment. TMDL is the ability of a water body to assimilate pollution and continue to meet the use designated by the stream classifications. Future water development projects will need to address water quality benefits and impacts.
Fish and Wildlife Coordination Act
FWCA authorizes the Secretary of Agriculture and Commerce to provide assistance to and cooperate with federal and state agencies to protect, rear, stock, and increase the supply of game and fur-bearing animals, as well as to study the effects of domestic sewage, trade wastes, and other polluting substances on wildlife. The Act also directs the Bureau of Fisheries to use impounded waters for fish-culture stations and migratory-bird resting and nesting areas and requires consultation with the Bureau of Fisheries prior to the construction of any new dams to provide for fish migration. In addition, this Act authorizes the preparation of plans to protect wildlife resources, the completion of wildlife surveys on public lands, and the acceptance by the federal agencies of funds or lands for related purposes provided that land donations receive the consent of the State in which they are located.
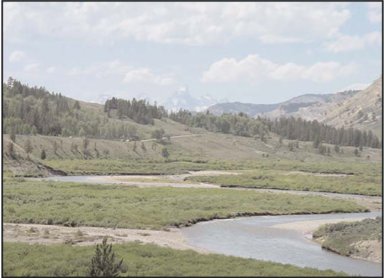
National Historic Preservation Act
Congress established the National Historic Preservation Act of 1966 (NHPA) and created the Advisory Council on Historic Preservation to advise the President and Congress in matters involving historic preservation. The council is authorized to review and comment on activities licensed by the federal government which will have an effect upon properties listed in the National Register of Historic Places or eligible for such listing. Section 106 of the NHPA provides for the involvement of the State Historic Preservation Office (SHPO) in the cultural resource inventory and project reviews administered by the Council under this Act. These reviews provide for the balancing the needs of development against the need to retain significant pieces of the nations past. In Wyoming, SHPO completed over 3,000 project reviews and requests for assistance from consultants preparing the inventories and possible project impacts and mitigation actions. Water related projects would routinely be required to address the provisions of Section 106 of NHPA.
Federal Lands:
There are federal lands throughout the Snake/Salt River Basin. There are very few lands administered by the Bureau of Land Management, however the far majority of the basin land area is in the Bridger-Teton and Targhee National Forests as well as Yellowstone and Grand Teton National Parks. There are also designated wilderness areas within national forests, the National Elk Refuge, and candidates for wild and scenic river designations. The USFS, NPS, and BLM or others agencies managing these federal lands must assure that the requirements of federal law are met before they can issue a special use or other permits authorizing a proposed action on federal lands, such as construction of a water project.
If possible, project proponents should avoid locating their project on national forests and national parks because of the significant encumbrances that may be placed on their investments or projects. It is virtually impossible to locate new water projects within wilderness areas, wildlife refuges, and stream areas with wild and scenic river designations.
Wyoming Environmental Quality Laws:
The Section 401 of the Clean Water Act provides for the state certification of any federally licensed or permitted facility, which may result in a discharge to the water of the state. In Wyoming, this certification process is administered by the Department of Environmental Quality (DEQ).
Those items typically required in the provisions of a Section 401 certifications are outlined below:
A Section 401 certification also outlines those additional permits required prior to the initiation of project construction activities. These additional permits are described below:
1. NPDES - National Pollution Discharge Elimination System Permit.
Typically, the selected construction contractor for the project will prepare and submit a "Notice of Intent" 30 days prior to any surface disturbances taking place, to DEQ. The major requirements of the NPDES (a storm water general permit) pertain to the development and implementation of a water pollution plan along with regular inspection of pollution control facilities in place at the project construction site.
2. Non-Storm Water Discharges.
An individual NPDES discharge permit from the DEQ may be required for point source discharges to surface waters not related to storm water runoff. These can include discharges from gravel crushing and washing operations, an on-stream cofferdam dewatering discharge, vehicle or machinery washing, or other material and equipment processing operations, if they are a part of the project being authorized.
3. SPCC (Spill Prevention, Control, and Countermeasures Permit)
If above ground storage of petroleum products exceeds 1,320 gallons in total or more than 660 gallons in a single tank an SPCC plan may have to be developed for submittal to DEQ as described in the EPA's Oil Pollution Prevention regulations.
Wyoming Water Law:
The priority date for a project is established on the date a completed water right permit application for the project is accepted by the Wyoming State Engineer's Office. In order to determine the water supply a new project may achieve, it is important to evaluate the existing water rights that are "senior" to the proposed project. Before the decision is made to pursue a project at a particular location, the potential water yield of the project should be estimated. The firm yield is the water supply benefits the project proponent could expect under worst case or drought water supply conditions. If the proposed project is located on a stream or river that has many "senior" priority water rights, a new project may not be able to achieve a reliable water supply during the drier months, such as July and August, or during drought years. Under these conditions, often the development of water storage reservoirs may be required to store water when flows are surplus to existing water rights and carry them over through the drier periods.
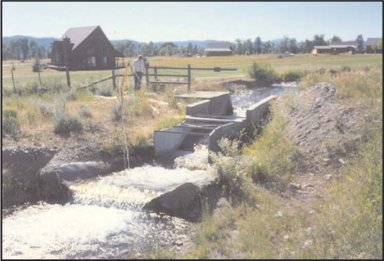
Generally the old "rules of thumb" relating to water yield and project feasibility were as follows:
However, today, all water users are interested in a firm water supply before they are willing to invest in a water project due to the ever escalating permitting, mitigation and project construction costs and the implementation time involved. In fact, many industrial water users are interested in the yield of a potential project under doomsday type of drought conditions, such as assuming that the worst water year of record occurs in consecutive years. These expectations of water users make the priority date of the water rights of new projects located in tight water supply regions relative to existing water rights, a critical factor in the feasibility of proposed water development projects.
Interstate Compacts and Court Decrees:
Prior to issuing any new water right the State Engineer's Office will make sure there is not any affect upon or that the use of water authorized by the permit is within the interstate compact or court decree governing the water allocations of the State of Wyoming. Article III A of the Snake River Compact provides that; "the waters of the Snake River, exclusive of established Wyoming rights (pre July 1, 1949) … are hereby allocated to each State for storage or direct diversion as follows: 4% to Wyoming and 96% to Idaho…" Any new water rights approved by the State Engineer shall be a part of this allocation. To date, it is estimated that less than one-half of this entitlement has been used within the Snake/Salt River Basin of Wyoming.
The protections provided by interstate compacts and court decrees sometimes has caused people to question the necessity for development under the principle of "use it or lose it". Compacts and Decrees provide a reliable and sound legal defense of the state's entitlements and Wyoming would use these defenses in the face of any legal challenge against unused allocations. Further, Article X of the Snake River Compact specifically addresses this issue by stating; "The failure of either State to use the waters … allocated to it under the terms of this compact, shall not constitute a relinquishment … forfeiture or abandonment of the right to such use". However, it is also good business for Wyoming to be a good steward of its compact entitlements through planning for future beneficial water use.
Wyoming Water Development Program:
Planning, constructing, and implementing a water project is costly. Adding the costs to acquire state and federal permits can be overwhelming for many small public and private entities in Wyoming. In 1975, in recognition that water development was becoming more difficult and additional water development was necessary to meet the economic and environmental goals and objectives of the state, the Wyoming Legislature authorized the Wyoming Water Development Program and defined the program in W.S. 41-2-112(a), which states:
"The Wyoming water development program is established to foster, promote, and encourage the optimal development of the state's human, industrial, mineral, agricultural, water and recreation resources. The program shall provide through the commission, procedures and policies for the planning, selection, financing, construction, acquisition and operation of projects and facilities for the conservation, storage, distribution and use of water, necessary in the public interest to develop and preserve Wyoming's water and related land resources. The program shall encourage development of water facilities for irrigation, for reduction of flood damage, for abatement of pollution, for preservation and development of fish and wildlife resources [and] for protection and improvement of public lands and shall help make available the water of this state for all beneficial uses, including but not limited to municipal, domestic, agricultural, industrial, instream flows, hydroelectric power and recreational purposes, conservation of land resources and protection of the health, safety and general welfare of the people of the State of Wyoming."
The task of setting priorities under the above all-encompassing definition falls to the Wyoming Water Development Commission (WWDC), which was also authorized by the Wyoming Legislature. The WWDC is made up of ten (10) Wyoming citizens, appointed by the Governor. The director and staff of the Wyoming Water Development Office administer the Wyoming Water Development Program.
The Wyoming Water Development Commission can invest in water projects as state investments or can provide loans and grants to public entities (municipalities, irrigation districts and special districts) for the construction of projects specific to their water needs. The WWDC has adopted operating criteria to serve as a general framework for the development of program/ project recommendations and generation of information. Individuals and project entities interested in the development of specific water projects should seek information regarding the Wyoming Water Development Program and the possibility of obtaining financial and technical assistance for the development of those projects.
Conclusions:
Water development in the 21st century is often difficult and costly. However, if a project proponent has a need for water, patience, and adequate financial resources, the federal environmental review and permitting processes can be successfully completed and permits obtained for construction of water projects. In the Snake/Salt River basin the extensive amount of federal lands and particularly the national parks and forests act as a practical limitation on extensive water development in the basin. However, carefully sized and smartly located water development projects to meet the needs of the basin citizens are institutionally possible.
The publication of the "Snake/Salt River Basin Plan" should foster discussion among water users and state officials relative to water development and conservation in the Snake/Salt River basin in Wyoming. The plan concludes that Wyoming has water to develop in the basin. The water can be used for future municipal growth, agricultural and recreational demands and environmental benefits. The Wyoming Water Development Program can invest in water projects as state investments or can provide loans and grants to public entities, such as irrigation or conservation districts, for the construction of projects.