Wyoming State Water Plan
Wyoming State Water Plan
Wyoming Water Development Office
6920 Yellowtail Rd
Cheyenne, WY 82002
Phone: 307-777-7626

Wyoming Water Development Office
6920 Yellowtail Rd
Cheyenne, WY 82002
Phone: 307-777-7626


1.0 Executive Summary
The Executive Summary of the Bear River Basin Water Plan is provided under separate cover.
2.0 Introduction
2.1 Basin Planning Process
Wyoming is undertaking a pro-active statewide water planning effort to represent changing conditions. Planning efforts in the late 1960s and early 1970's resulted in the publication of the Wyoming Framework Water Plan. The Framework Water Plan consisted of summaries of current water conditions and planned projections for six of the seven major river basins in Wyoming. The Bear River basin was not included in the Framework Plan. Due to technology constraints in the early 1970's, the data, mapping, and analyses tools used in developing the Framework Plan could not be easily updated to reflect changing conditions or new data.
The 1996 Legislature directed the Wyoming Water Development Commission (WWDC), the State Engineer's Office (SEO), and Wyoming Resources Data System (WRDS) to prepare a recommendation for updating the 1973 Framework Water Plan. The subsequent State Water Planning Process Feasibility Study Report (Feasibility Study), published in October 1998, determined that the planning process should accomplish the following three main objectives:
The Feasibility Study also identified the need for a State Water Planning team. This team is made up of staff members from the WWDC, the SEO, and the Water Resources Data System (WRDS) in the College of Civil and Architectural Engineering at the University of Wyoming. This WWDC is the lead agency and directed the Bear River Basin planning effort.
2.1.1 Local Participation
The Bear River Basin Advisory Group, comprised of citizens for the Bear River Basin, was assembled during the Feasibility Study, and served as the pilot for other basin advisory groups. The first meeting was held in 1997. The group members have interests in agricultural, municipal, industrial, recreational, and environmental water use. During the planning process, they provided the consultants valuable information regarding existing water uses, proposed water development, and current economic conditions. In addition, they provided a valuable sounding board and "reality" check for the assumptions and results of the planning process. Table 1 lists the Bear River Basin Advisory Group members.
Table 1
Bear River Advisory Group Members
| Member | Affiliation |
| Allan Burton | Mayor, City of Cokeville |
| Dennis Cornelison | Uinta County CD |
| Pat Thompson | Wyoming State Parks |
| James Crompton | Bear River Compact Commissioner |
| Will Davis | Mayor, City of Evanston |
| Kathy Davison | Lincoln County Commissioner |
| Eric Esterholdt | Lincoln County CD |
| Phil Orton | Represents Environmental Interests |
| Truman Julian | Wyoming Woolgrowers Association |
| Craig Lowham | Farm Federation |
| Craig Welling | Uinta County Commissioner |
| Gordon L. Park | Bear River Inc. |
| Ralph Stahley | Western Wyoming RC&D |
| Mike Sims | Sims Land and Livestock |
| John Teichert | Bear River Compact Commissioner |
The Feasibility Study identified the need for the services of a facilitator during advisory group meetings, in part to help assure that state planning agencies did not dominate the meetings. In addition, the facilitator was an unbiased mediator who assisted the group in establishing their role and accomplishing their tasks. John Talbot facilitated the initial meetings through July, 1999. At that time, Joe Lord took over as facilitator until the completion of the basin plan in November, 2000. The Bear River Basin advisory group has opted to continue meeting three times a year to discuss water issues, however, a facilitator will no longer be provided.
Basin advisory group meetings are open to the public, and participation was well beyond the designated advisory group. Besides a forum for local water users to provide information to consultants and consultants to present basin planning effort results, basin advisory group meetings presented an excellent opportunity to provide information regarding policies and regulations that effect local water planning. Table 2 presents the topics, and associated speakers, that provided local citizens with a broader perspective on water issues.
Table 2
Bear River Basin Advisory Group Meeting Topics
| Topic | Presenter |
| Water Quality Issues in the Bear River | Craig Thomas, Bear Lake Regional Commission |
| Total Maximum Daily Loads and Water Quality Standards | Jack Smith, Wyoming Department of Environmental Quality (DEQ) |
| Bear River Compact | Sue Lowry, Director for Policy and Administration, SEO |
| Cutthroat Trout | Ron Remmick, Regional Fisheries Supervisor, Wyoming Game and Fish |
| Three State Agreement - PacifiCorp and Scottish Power Merger | Sue Lowry, SEO |
| Wyoming Business Council | Len Woolley, Southwest Regional Director, Wyoming Business Council |
| Local Business Council | Mark Mickelson, South Lincoln Economic Development Corporation |
| Bear River Operations | Jade Henderson, Division IV Superintendent, SEO |
| Bear River Compact and the Three State Agreement with PacifiCorp | Jody Williams, PacifiCorp |
| Abandoned Mine Lands Phosphate Mine Reclamation | Evan Green, Abandoned Mines Lands |
| Wasatch-Cache Forest Management Plan | Steve Ryberg and Charlie Condrat, U.S. Forest Service |
| Instream Flows | John Barnes, SEO |
| Wyoming's Water Conservation Program | Ron Vore, SEO |
| Wyoming Water Law Proposed Statute Changes | Sue Lowry, SEO |
| Data Dissemination and the Water Resources Data System (WRDS) | Dennis Feeney, WRDS |
2.1.2 Data Dissemination
In order to promote the usefulness of the river basin plans, the water resources data, mapping, analysis tools, and documentation collected and developed during the planning process will be made available to water users, decision makers, and citizens of Wyoming. In addition, the plans will be updated regularly to reflect new data and changing economic and regulatory conditions.
WRDS role in the planning process is primarily to help in the management and dissemination of data collected and developed during the basin planning process. The Wyoming State Water Plan Web Site ( http://waterplan.state.wy.us/) was developed by WRDS staff to provide access to river basin planning products developed through the Wyoming Water Planning Process. The site provides access to:
Information is available to all citizens, not just those with Internet access. Water planning process information are published in news releases and newsletters sent to interested water users throughout the state. Any citizen can request hard-copies or digital copies of information developed through the planning process by contacting the WWDC. In addition, basin advisory group meetings are open to the public and notices of meetings are published in local papers.
2.1.3 Basin Plan
The Bear River Basin Planning Report is the result of efforts extending over nearly a two-year period. Technical memoranda were submitted for each major task during this period. The main body of this report summarizes the approach and results of the major tasks and references the detailed technical memoranda contained in appendices. This format has a clear advantage over re-iterating the more technical details in the main body of the report for the following reasons:
The Bear River Basin planning effort met the following four major objectives, which are each summarized in separate subsequent sections:
The Basin Water Use Profile task determined and quantified the current surface and ground water uses within the basin (Section 3).The Basin Water Quality Profile task determined the current surface and ground water quality within the basin (Section 4).
The Available Water Determination task identified surface and ground water available for future basin water development (Section 5).
The Demand Projections and Future Water Use Opportunities task identified likely uses, quantities, and opportunities to meet future water demands in the basin. (Section 6)
The following outlines the major subtasks performed in support of these four objectives and the location of the resulting technical memoranda in the appendices:
The Bear River Basin planning effort took full advantage of information collected or developed by other consultants and local, state, and federal entities. With the exception of irrigated acreage mapping, essentially no field work was performed to develop new data. However, information from many diverse sources was collected, summarized, and analyzed. The resulting technical memorandums, summarized in this report, provide a comprehensive analysis of water use and issues in the Bear River Basin.
Geographic Information Systems (GIS) have become the industry standard for displaying, storing, and managing data. The Bear River Basin planning effort has taken full advantage of available GIS coverages developed by others. In addition, several GIS coverages were developed during the process to assist in the presentation and interpretation of water resource data. Table 3 provides a list of Bear River Basin GIS coverages that can be downloaded from the Water Planning Web Site. Also shown is at least one general use of the coverage. Metadata containing information such as scale, source, and projection, can be downloaded with each coverage. Many of the coverages are presented as figures throughout the report and appendices.
Table 3
Bear River Basin GIS Coverages
| GIS Coverage | Use For Coverage |
| Basin Boundary | Base Map |
| Highways and Major Roads | Base Map |
| Towns | Municipal Use and Base Map |
| Basin Hydrography | Surface Water Model and Base Map |
| Stream Gage Locations | Surface Water Model |
| Irrigated Acreage | Crop Consumptive Use |
| Diversion Locations with Crop Types | Crop Consumptive Use and Surface Water Model |
| Surface Water Rights | Surface Water Model |
| Well Locations and Permit Data | Consumptive Use from Ground Water |
| Reservoir Locations and Storage Rights | Surface Water Model |
| Climate Station Locations | Crop Consumptive Use |
| Surface Water Quality Classifications | Water Quality and Future Development |
| Surficial Geology | Future Ground Water Development |
| Well Coverage from USGS GWSI Database | Current and Future Ground Water Development |
| SEO Well Coverage | Current and Future Ground Water Development |
| Surface Water Quality | Future Development |
| Ground Water Quality | Future Development |
| National Wetlands Inventory | Environmental Use and Future Development |
| Instream Flow Filings | Environmental Use and Future Development |
| Proposed Future Reservoir Sites | Future Development |
| USGS Spring Data | Current and Future Ground Water Development |
2.2 Wyoming Water Law and the Bear River Compact
2.2.1 Wyoming Water Law
Wyoming's water is administered under the Prior Appropriation Doctrine through the State Engineer's Office. Under this doctrine the first water user to put water to beneficial use has the first right to that water, or "first in time is first in right."
A comprehensive summary of Wyoming Water Law is provided as Appendix A. This summary was prepared by James J. Jacobs, Natural Resource Specialist and University of Wyoming Professor; Gordon Fassett, Wyoming State Engineer from 1986 to 2000; and Donald J. Brosz, University of Wyoming Professor Emeritus. The summary describes how water is administered and permitted. Also included in Appendix A is a comprehensive Glossary of Water-related Terms developed by the State Engineer's Office. Many of these terms are used throughout this report and the water law summary.
2.2.2 Bear River Compact
Although Wyoming has the right to manage its water resources, it does not have the right to use all the water originating in Wyoming per agreements made by interstate compact or by court decree. Because Wyoming is a headwater state, it is bound by interstate river Compacts in seven major basins and is also party to two U.S. Supreme Court decrees. These interstate compacts and decrees dictate either the total amount of water Wyoming is allowed to use in a set time period, or the amount of water Wyoming must allow to flow past its state line.
The Bear River Compact is an agreement under Federal Law between Wyoming, Utah, and Idaho which was ratified by congress in 1980. The original Compact was signed by President Eisenhower on March 17, 1958. The Compact was amended in 1978 and signed into law by President Carter on February 8, 1980. The Amended Bear River Compact, 1978, is included as Appendix B. A brief description of the Compact follows.
The original Compact divided the Bear River Basin into three main divisions: The Upper Division, the Central Division, and the Lower Division. The Upper Division includes portions of Wyoming and Utah that are upstream of Pixley Dam, located in Wyoming south of the town of Cokeville. The Central Division includes portions of Wyoming and Idaho, between Pixley Dam and Stewart Dam in Idaho. The Lower Diversion extends from Stewart Dam through Idaho and back into Utah, where the Bear River discharges into the Great Salt Lake. Figure 5, published by the Bear River Commission, shows the three divisions.
Figure 5
Bear River Basin
The original Compact apportioned direct flows of the Bear River and its tributaries between Utah and Wyoming in the Upper Division, and between Wyoming and Idaho in the Central Division. It defined original compact storage in the Upper and Central Divisions to each state as shown in Table 4.
Table 4
Original Compact Storage above Bear Lake
| State | Storage in Acre-Feet |
| Utah | 17,750 |
| Wyoming | 17,750 |
| Idaho | 1,000 |
| Total | 36,500 |
The amended Bear River Compact granted additional storage above Bear Lake, allocated as shown in Table 5. This additional storage, plus both surface and ground water appropriated and applied to beneficial use after January 1, 1976, is limited to an annual depletion of 28,000 acre-feet. The annual depletion is apportioned to the three states as follows: 13,000 acre-feet to Utah, 13,000 acre-feet to Wyoming, and 2,000 acre-feet to Idaho. In addition, the Upper and Central Divisions were allowed additional rights to store water spilled or bypassed from Bear Lake when all other direct flow and storage rights are satisfied. The storage rights were allocated as follows: 47 percent to Utah, 47 percent to Wyoming, and 6 percent to Idaho. The amended Bear River Compact also established a minimum Bear Lake level below which Bear Lake cannot be drawn for power purposes only.
Table 5
Additional Compact Storage above Bear Lake
| State | Storage in Acre-Feet |
| Utah | 35,000 |
| Wyoming | 35,000 |
| Idaho | 4,500 |
| Total | 74,500 |
The Bear River Compact is administered by the Bear River Compact Commission consisting of three representatives from each compact state and one federal representative. They are required to prepare biennial reports presenting the river operations under that compact. They are charged with overseeing the interstate river administration when flow is not adequate to satisfy demands within each state, known as a water emergency. Note that when water is plentiful, no interstate river administration is required.
If a water emergency exists, the responsibility falls on each state to curtail diversions and storage in the proportion dictated in the compact. When this occurs, states administer the river based on their water law. For example, when Wyoming must curtail diversions to meet compact requirements, the water division superintendent would "shut off" diversions to the lowest priority ditch first, then the second lowest, etc. until Wyoming is able to meet their compact requirements.
2.3 Bear River Basin Description
2.3.1 General Description
The Bear River headwaters are in the Uinta Mountains in Utah. It enters Wyoming flowing north through Evanston and into Woodruff Narrows Reservoir. Just downstream of Woodruff Narrows it flows into Utah and then re-enters Wyoming south of Cokeville. Its flow is increased greatly by Smith's Fork before it enters Idaho flowing west near the town of Border. As shown in Figure 5 above, the Bear River heads north through Idaho then loops back south, re-enters Utah, and discharges into the Great Salt Lake. In Wyoming, the basin is bordered by the Wyoming Range between the Bear River and the Green River basins. This range is generally less than 9,000 feet in elevation. Agriculture accounts for the largest water use in the basin. Surface and ground water are used to irrigate over 60,000 acres of crop land.
2.3.2 Climate
The average annual temperature in the agricultural area of the basin in Wyoming is near 40 degrees Fahrenheit and the average annual precipitation is around 11 inches. Greater amounts of precipitation, around 20 inches, fall generally as snow in the higher elevation mountains generating runoff to the Bear River and its tributaries. The agricultural regions of the basin in Wyoming are generally between 6,000 and 7,500 feet above sea level and the temperature allows the typical growing season to extend from mid-May through September. However, because of the arid climate, irrigation water is required to grow most crops.
2.3.3 Geology and Hydrogeology
The Bear River Basin is located in part of Wyoming's "Overthrust Belt". Overthrust geology is characterized by folded and faulted sedimentary rocks, which have eroded to form ridges and valleys. These faults and folds have a strong influence on ground water flow rates and direction. Several mountain ranges make up the Overthrust Belt and divide the Bear River Basin from the Green River Basin to the east and the Great Salt Lake Basin to the west. The State Engineer's Office Water Well Inventory database reports that 1,015 wells are located in the Bear River Basin.
An aquifer is a geologic unit that provides usable water to wells and springs. Most of the areas within the Bear River Basin overlay aquifers. The aquifer that consists of saturated alluvium within approximately 2 miles of the Bear River, generally referred to as an alluvial aquifer, is the most widely developed aquifer in the basin. Aquifers not within the alluvium are generally referred to as bedrock aquifers. Producing wells have been identified in at least 17 different bedrock formations in the Bear River Basin in Wyoming.
2.3.4 Upper Division in Wyoming
As discussed above, the Bear River Basin in Wyoming is divided by the compact into the Upper Division and the Central Division. Much of the information provided in this document is based on these divisions. Figure 6 shows the Upper and Central Division of the Bear River Basin and the outlines the Wyoming border.
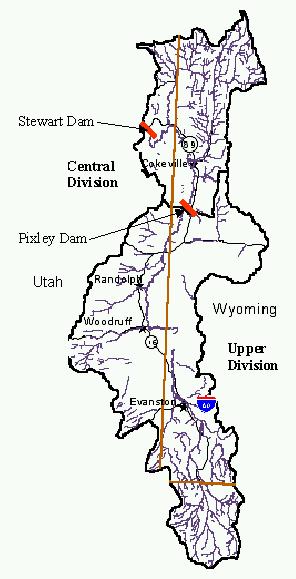
Figure 6
Upper and Central Division Boundaries
The main tributaries in the Upper Division include Mill Creek, Sulphur Creek, and Yellow Creek, however, in the Upper Division interstate regulation applies only to the main stem of the Bear River. Several storage reservoirs supply supplemental water for irrigation and municipal use in Wyoming including Whitney Reservoir, which is on the West Fork of the Bear River Basin in Utah; Sulphur Creek Reservoir; and Woodruff Narrows Reservoir, which releases water for use in both Wyoming and Utah. A relatively small amount of water is exported from the Green River Basin to the Bear River Basin through the Van Tassel Ditch to La Chappelle Creek then stored for downstream use in Ben Reservoir and Broadbent (Heber) Reservoir.
The Upper Division does not regularly fall under compact regulation, in part due to the supplemental water provided through storage. The amount of ground water used in the upper division is minimal, again reflecting the benefits of reservoir storage. Evanston once relied upon ground water to meet their municipal demand, but now primarily uses surface water from the Bear River and Sulphur Creek.
2.3.5 Central Division in Wyoming
The main tributary in the Central Division is Smith's Fork, which is administered as a compact tributary. Pine Creek is within the Smith's Fork drainage but has been defined in a court decree as not being tributary to Smith's Fork, yet still comes under compact regulation. Twin Creek also contributes to flow in the Bear River but is not regulated under the compact.
No significant storage exists in the Central Division. Partly due to this lack of storage, the Central Division goes into a water emergency, as defined by the compact, more frequently than the Upper Division. Twin Creek often falls under state regulation during the irrigation season, since the lowest headgate on the creek has the highest priority water right.
The Central Division uses ground water as a supplemental source for satisfying irrigation requirements. The town of Cokeville supplies their municipal demand with well and spring water from ground water sources.
3.0 Basin Water Use Profile
The basin water use profile provides an inventory of water use and water development projects. It not only provides the necessary understanding of the location, source, and quantity of basin water use, but also provides an understanding of how water is used. Basin water use was determined for the following categories, which when combined define the total water consumed or lost due to human influence in the basin.
The existing water use profile is the basis for the subsequent sections in the report. The current surface water use and operations were used to develop the surface water spreadsheet models that help to identify water in the basin available for future development. The current ground water use and well yields were used to identify aquifers that have potential for future development. Existing water use, when tied to current economic and demographic conditions, were used to estimate the potential water use associated with future growth.
The surface water spreadsheet models were developed to represent dry, normal, and wet hydrologic conditions over a recent historic period. The basin water use profile supported the modeling efforts, therefore, it was necessary to understand changes in water use and basin operations during that period. In each of the water use categories an assessment was made of both existing and historic use for the selected study period.
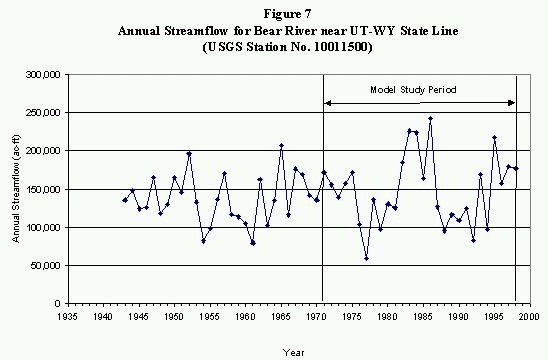
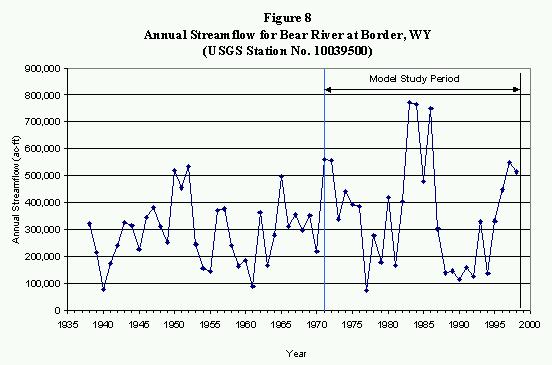
3.1 Study Period
The surface water spreadsheet models were developed to represent dry, normal, and wet hydrologic conditions in the Bear River Basin. As discussed in Appendix C, the period 1971 through 1998 was selected for use in the modeling effort. Long-term USGS streamflow gages in both the Upper and Central Divisions were reviewed to select the study period. Figure 7 shows the long-term streamflow for the USGS Bear River near Utah/Wyoming State Line gage, located where the Bear River first enters Wyoming from the south. Figure 8 shows the long-term streamflow for the USGS Bear River at Border, Wyoming gage, located where the Bear River flows into Idaho. As this figure demonstrates, the 1971 through 1998 period was selected because it is statistically similar to long-term conditions and includes dry, normal, and wet hydrologic years.
3.2 Agricultural Water Use
Crop consumptive use accounts for the vast majority of water use in the Bear River Basin. The following general steps were followed to determine the actual agricultural consumptive use of water:
In addition, livestock consumptive use is included in agricultural water use estimates.
3.2.1 Key Structures
There are over 100 agricultural diversions in the Bear River Basin in Wyoming. Many of the smaller diversions are on non-compact tributaries or do not greatly effect the administration and operations in the basin. Therefore, key structures were identified to document operations, and take forward into the surface water spreadsheet modeling effort.
Key structures were initially identified as river headgate structures typically diverting at least 10 cfs. Local water administrators and users assisted in adding diversion structures to the key list that have regulatory or operational significance within the basin. Appendix D contains a memorandum describing the selection of key structures. Other agricultural diversions within the basin were aggregated into groups, based on the location of their river headgates and irrigated acreage, assuring that 100 percent of agricultural use is represented in the profile. The following identifies the approach to determining the water use for key and aggregated structures:
The following structures were identified as key in the Upper Division. Each of the structures identified divert from the Bear River mainstem or slough.
The following structures were identified as key in the Central Division. Many of these structure divert from tributaries, as noted.
Detailed operating memoranda were developed for each of the key structures in the basin, as shown in Appendix D. They provide the basis for the crop consumptive use analyses and the surface water spreadsheet modeling efforts. Don Shoemaker, Water Commissioner for Division IV, District 4, assisted in the development of the operating memoranda for diversions in the Upper Division. Kevin Wilde, Lead Hydrographer for Division IV, assisted in the development of operating memoranda for diversions in the Central Division. Each memorandum provides the following details:
3.2.2 Irrigated Acreage
Irrigated acreage mapping was developed by States West Water Resources Corporation under a separate contract with the WWDC. The mapping represents areas of irrigated acreage, referred to as irrigated acreage polygons, in the Bear River Basin in 1998. The irrigated acreage was developed using a combination of aerial and satellite photography, as described in Appendix E. Table 6 reports the 1998 irrigated acreage by compact division. Figure 9 shows the irrigated acreage in the basin.
Table 6
Irrigated Acreage in the Bear River Basin, Wyoming
| Location | Irrigated Acreage (acres) |
| Upper Division | 40,400 |
| Central Division | 23,500 |
| Total Bear River Basin | 63,900 |
Wyoming Agricultural Statistics, reported each year by county, were perused to determine how acreage has changed over the study period. County agricultural statistics generally report cash crops only, therefore they are not a good indicator of actual acreage. A large majority of the acreage in the Bear River basin is irrigated meadow that is either used for grazing or hayed for on-farm use, and therefore not reported as a cash crop. However, information from local water users indicates that irrigated lands have been fairly consistent since 1971. Water rights for only about 2,900 additional acres have been permitted in the basin since 1971, representing less than 5 percent of the total acreage. Based on this information, a constant acreage was used over the study period.
The operating memoranda, provided in Appendix D, provide crop types for each of the key structures. In the Upper Division, approximately 99 percent of the irrigated acreage is meadow grass. Only about 1 percent is planted in alfalfa. In the Central Division, about 86 percent is meadow grass, with the remaining planted in alfalfa and small grains.
3.2.3 Supply Source for Irrigated Acreage
Water supply-limited consumptive use is the actual water used by the crop, limited by water availability. To estimate water supply-limited consumptive use, it is necessary to know the amount of water supplied to irrigated acreage. Therefore, an investigation was performed to link irrigated acreage polygons to individual diversion structures through water rights. The surface and ground water rights permitted to serve some or all of the land within each irrigated acreage polygon were determined from the original records on file at the SEO. Because water right permits specify both the diverting surface or ground water structure and the permitted lands, this allowed irrigated acreage to be associated with a supply source. This process is documented in Appendix F.
A total of 82 irrigation diversion structures were identified. There were 558 individual water rights associated with these structures, including original supply, supplemental supply, and additional supply permits. Note that this may not represent all water rights in the basin, only water rights associated with acreage defined as irrigated in 1998. A total of 49 wells were identified as permitted for irrigation or permitted for a combined use including irrigation.
3.2.4 Potential Crop Consumptive Use and Irrigation Water Requirement
Potential crop consumptive use is an estimate of how much water crops can consume if provided with a full supply. Monthly potential crop consumptive use, or crop evapotranspiration, was calculated for key and aggregate structures for the period 1971 through 1988 using the Blaney-Criddle approach developed by the former Soil Conservation Service (now the Natural Resources Conservation Service). This method uses temperature, latitude, acreage, crop types, and crop parameters on a monthly time- step. Historic temperature data from the National Weather Service climate station in Evanston (Evanston 1 E) was used to represent conditions in the Upper Division. Historic temperature data from the climate station in Sage (Sage 4 NNW) was used to represent conditions in the Central Division.
Local crop parameters, developed under a cooperative project sponsored by the Bear River Commission, were used to better represent conditions in the Bear River Basin. The project results were published in the Duty of Water Under the Bear River Compact: Field Verification of Empirical Methods for Estimating Depletion - Research Report 125, January 31,1989, Robert W. Hill, et al. Details of the potential crop consumptive use analysis are provided in Appendix G.
The amount of water the crops need from irrigation, termed irrigation water requirement, is the potential crop consumptive use less the amount of precipitation available to the crop. To be consistent with the consumptive use analyses performed under the Bear River Commission project, 80 percent of rainfall during the irrigation season was estimated to be effective in meeting crop demands. The average annual irrigation water requirements in the Wyoming portion of the Upper and Central Divisions, estimated for the period 1971 through 1998, are shown in Table 7.
Table 7
Average Irrigation Water Requirement (IWR)
1971 through 1998
| Location | IWR (acre-feet) |
| Upper Division | 64,300 |
| Central Division | 32,600 |
| Total Bear River Basin | 96,900 |
3.2.5 Water Supply-limited Consumptive Use
Irrigation water requirement is an estimate of the amount of irrigation water crops would use if they had a full supply. However, in the arid west most farming operations by necessity grow crops with less than a full supply. Water-supply limited consumptive use is the amount of water actually used by the crop. In the Bear River Basin in Wyoming, there are five measurable sources of agricultural supply:
The methodologies used to estimate water supply-limited consumptive use for the basin are discussed in detail in Appendix G. It is important to note that not all the water diverted at the river headgate is available to satisfy crop needs. Diversions for agricultural use experience both conveyance losses and application losses, and these losses return to the river as surface runoff or deep percolation. Appendix H discusses the development of efficiencies and return flow patterns for estimating water available at the crop, and for use in the surface water spreadsheet models.
Table 8 shows the average annual irrigation water requirement, supply-limited consumptive use, and percent shortage by division. The supply-limited consumptive use includes consumptive use of both surface and ground water sources.
Table 8 Average Annual Crop Consumptive Use Estimates 1971 through 1998
| Location | Irrigation Water Requirement (acre-feet) | Supply-Limited CU (acre-feet) | Percent Shortage |
|---|---|---|---|
| Upper Division | 64,300 | 62,600 | 2.6 % |
| Central Division | 32,600 | 31,600 | 3.1 % |
| Total Bear River Basin | 96,900 | 94,200 | 2.8 % |
Figures 10 and 11 show the annual irrigation water requirement, consumptive use of surface water, and consumptive use of ground water in the Upper and Central Division for 1971 through 1998.
Figure 10
Upper Division Annual Crop Requirements and Use - 1971 through 1998
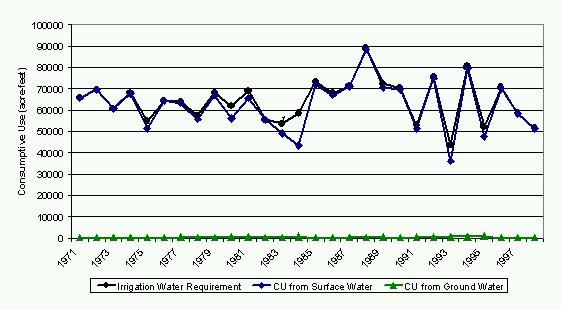
Figure 11
Central Division Annual Crop Requirements and Use - 1971 through
1998
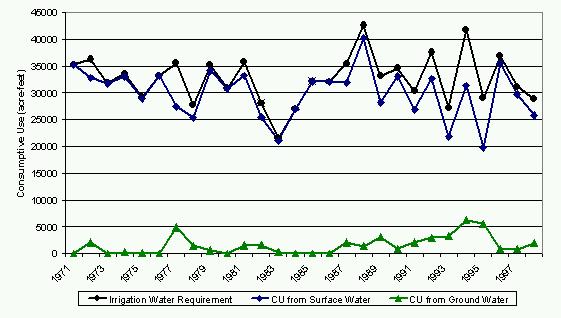
Figure 12 shows the average annual supply-limited crop consumptive use for the Upper and Central Division from 1971 through 1998. Note that this annual consumptive occurs during the irrigation season, generally from the beginning of May through September.
Figure 12
Average Annual Supply-Limited Consumptive
Use by Division 1971 through
1998
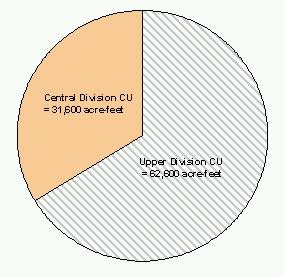
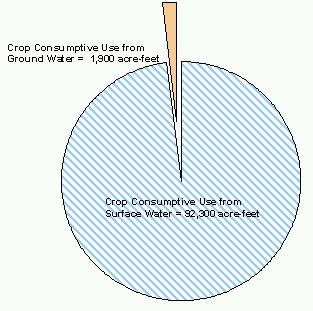
Figure 13 shows Wyoming's average annual crop consumptive use by supply for 1971 through 1998 for the Bear River Basin.
Figure 13
Average Annual Supply-Limited Consumptive
Use by Source 1971 through
1998
3.2.6 Summary of Supplemental Agricultural Water Sources
Reservoir Supplies
As shown by the small shortages in Table 8, the Bear River Basin in Wyoming generally has a reliable source of water for irrigation. There are three relatively large reservoirs in the Upper Division that allow demand to be satisfied except in the driest years. Whitney, Sulphur Creek, and Woodruff Narrows Reservoirs provide supplemental water primarily for irrigation, although Sulphur Creek Reservoir was enlarged in 1982 providing storage for the City of Evanston.
A summary of the permitted storage in the Bear River Basin in Wyoming is included in Appendix I. Also included are technical operating memorandum for Whitney, Sulphur Creek, Woodruff Narrows, Broadbent, and Ben Reservoirs. They provide the basis for the modeling of reservoirs in the surface water spreadsheets. The following information is included in the reservoir operating memorandums:
Ground Water Supplies
As shown in Figure 11, supplemental irrigation wells in the Central Division help to satisfy irrigation water requirements when surface water is not available. The large majority of irrigation wells are developed in the alluvial aquifer system. The increased use of ground water for irrigation in the Central Division reflects the fact that there is no significant storage available for supplemental supply. The water rights investigation showed approximately 1,500 acres permitted to use ground water as the original supply for irrigation and approximately 6,200 acres permitted to use ground water as an additional supply for irrigation.
The consumptive use of ground water for agriculture is estimated to be approximately 1,900 acre-feet per year. Most of the ground water is applied to the crops through sprinkler irrigation techniques, which are generally able to efficiently use 80 percent of the water. Therefore, the amount of ground water withdrawn for agricultural use is estimated to be approximately 2,400 acre-feet per year.
3.2.7 Livestock Consumptive Use
Livestock consumptive use was determined based on the number of livestock, estimated yearly by county. There is a significant amount of both cattle and sheep within the Bear River Basin. Various sources have estimated daily livestock consumptive use. The U.S. Environmental Protection Agency estimates from the Manual of Individual and Non-Public Water Supply Systems (1991) in gallons per day per head were adopted and are shown in Table 9.
Table 9
Average Daily Consumptive Use by Livestock
| Livestock Type | Daily Water Use (gal/head) |
|---|---|
| Cattle | 12 |
| Sheep | 2 |
Cattle and sheep population estimates have been relatively constant throughout the 1971 through 1998 study period. As noted, the number of livestock are reported by county. It was estimated that approximately 25 percent of the livestock in both Uinta and Lincoln Counties are within the Bear River Basin. The remaining 75 percent of livestock are within the Green River and Snake River Basins. Table 10 shows the estimated number of livestock and associated consumptive use.
Table 10
Average Annual Livestock Consumptive Use - 1971 through 1998
| Location | Number of Livestock | Consumptive Use (acre-feet) | |||
|---|---|---|---|---|---|
| Cattle | Sheep | Cattle | Sheep | Total | |
| Upper Division | 18,000 | 17,500 | 242 | 40 | 282 |
| Central Division | 7,000 | 3,000 | 94 | 7 | 101 |
| Total | 25,000 | 20,500 | 336 | 47 | 383 |
3.3 Municipal and Domestic Use
Currently, around 15,100 people live in the Bear River Basin in Wyoming. More than 80 percent of the population lives within the boundaries of the City of Evanston or the Town of Cokeville. Table 11 shows an estimate of the current population by county and city service area.
Table 11
Approximate Current Populations
| Location | Lincoln County | Uinta County | Total |
|---|---|---|---|
| Evanston Service Area | 12,200 | 12,200 | |
| Cokeville Service Area | 500 | 500 | |
| Unincorporated Area | 400 | 2,000 | 2,400 |
| Total Basin | 900 | 14,200 | 15,100 |
Municipal technical operating memoranda were developed for Evanston and Cokeville, and are included in Appendix J. They provide the basis for the estimate of municipal consumptive use and for the modeling of cities in the surface water spreadsheets. The following information is included in the municipal operating memoranda:
3.3.1 Evanston Municipal Consumptive Use
Evanston currently relies primarily on treated surface water. However, the city owns and maintains several ground water wells that, prior to 1990, were the primary source of municipal water. In 1988, Evanston began construction on a surface water reservoir, diversion and pipeline project that would allow them to meet normal demands with surface water from the Bear River. The project, completed in 1990, included:
The city's current annual withdrawal of surface water is approximately 4,300 acre-feet. The highest monthly demands coincide with warmer months when lawn irrigation is added to indoor use. The actual consumptive use of diverted municipal water for Evanston is approximately 1,000 acre-feet per year. The non-consumed water either returns to the Bear River as lawn irrigation return flows, or is discharged from the wastewater treatment plant into the Yellow Creek tributary of the Bear River.
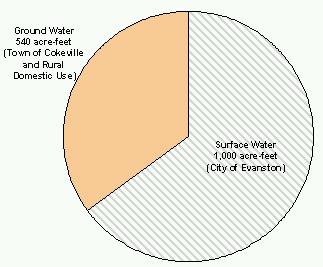
3.3.2 Cokeville Municipal Consumptive Use
Cokeville relies on ground water from two municipal wells located about 2.2 miles east of town in the Smith's Fork/Spring Creek drainage. These wells pump water from the Cretaceous Thomas Fork Formation, which can be categorized as a bedrock aquifer. Water is disinfected at the well head and pumped to town without further treatment. The disinfected water can either be delivered directly to users or stored for peak demand use.
The town's current annual withdrawal of ground water is approximately 810 acre-feet. The highest monthly demands coincide with warmer months when lawn irrigation is added to indoor use. The actual consumptive use of diverted municipal water for Cokeville is approximately 40 acre-feet. The non-consumed water either returns to the Bear River as lawn irrigation return flows, or is discharged from the wastewater treatment plant directly to the Bear River.
3.3.3 Rural Domestic Consumptive Use
Rural domestic water use is primarily from individual wells, mostly developed in the alluvial aquifer system. The estimated withdrawal for rural domestic water use is 180 gallons per capita day. Because many rural users are on septic systems, it is assumed that none of the water withdrawn for domestic use is available as returns. Therefore, rural domestic consumptive use is equivalent to rural pumping. Based on the unincorporated population in the Bear River Basin, shown in Table 11, approximately 500 acre-feet per year is both withdrawn from wells and consumed. This use is distributed throughout the Bear River Basin in Wyoming.
3.3.4 Total Municipal and Domestic Consumptive Use
Figure 14 shows the total municipal and domestic consumptive use in the Bear River Basin for the Upper and Central Divisions in Wyoming. Figure 15 shows the water use by source. The population and associated water use in the Bear River Basin in Wyoming has generally increased by about 4 percent annually during the 1971 through 1999 study period selected for the modeling effort.
Figure 14
Total Current Municipal and Domestic Water Use by Division
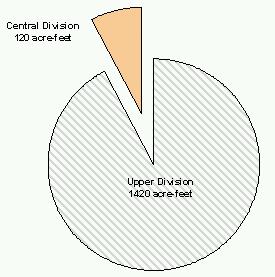
Figure 15
Total Basin Current Municipal and Domestic Use by Source
3.4 Industrial Use
Industrial water use in the Bear River Basin in Wyoming represents only a small proportion of overall basin water use. There are some "light" industrial uses within the City of Evanston that are supplied water by the city. Their use has been included in the municipal use described above. Currently, the only substantial self-supplied industrial water use in the Bear River Basin is for purposes of natural gas processing. Two energy firms, Chevron and BP Amoco, account for essentially all self-supplied industrial water use. A detailed description of the industrial use in the basin in provided in Appendix K.
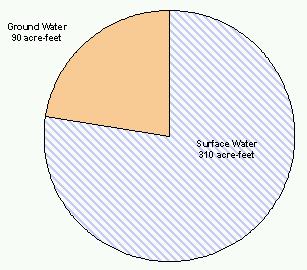
Natural gas production within the Bear River Basin is divided into two units; the Painter Resource Unit and the Whitney Canyon/Carter Creek area. Chevron and BP Amoco have gas-processing facilities in both units. The Chevron gas plant in the Whitney Canyon/Carter Creek field uses a water intensive process. They pump surface water through a pipeline from the stilling basin below Woodruff Narrows Reservoir. The total water use at that plant is approximately 310 acre-feet per year.
The remaining water demands for natural gas processing are entirely supplied from groundwater wells, and generally use less intensive water processes. The average annual ground water use for gas processing is approximately 90 acre-feet per year. These wells are outside the Bear River alluvium and likely pump from a bedrock aquifer formation. Industrial water use for gas processing has been relatively constant since the mid-1980s when the fields began producing. Figure 16 shows the total industrial water use in the basin by source.
Figure 16
Total Basin Current Industrial Water Use by Source
3.5 Environmental Use
Environmental water use generally includes the following:
Instream flows and reservoir releases are considered non-consumptive. Minimum reservoir pools are generally charged with a percent of the reservoir evaporation losses. Creation and maintenance of wildlife habitat, depending on the type of vegetation and amount of ponds created, consumes water at a rate equal to or greater than irrigated acreage. A detailed analysis of environmental use in the Bear River Basin is included in Appendix L.
3.5.1 Instream Flows
In 1986, the State of Wyoming passed legislation defining instream flow as a beneficial use of water, and stipulated how instream flow water rights would be filed, evaluated, and ultimately regulated. The legislation is codified within Wyoming Statutes at S41-3-1001 to 1014. This allows for instream flow water rights to be filed or granted on unappropriated water originating as natural flow or from storage in existing or new reservoirs. For natural sources, the flow amount is defined as the minimum needed to "maintain or improve existing fisheries". For storage water, the flow amount is defined as the minimum needed to "establish or maintain new or existing fisheries".
The Wyoming Game and Fish Commission has indicated that instream flow filings are insurance policies that protect wildlife from the impacts of unknown future upstream development. The main goal for instream flow rights in the Bear River Basin is to help preserve and manage habitat for the Bonneville Cutthroat Trout, which is proposed for listing under the Endangered Species Act. The Game and Fish Commission has indicated that the habitats in the central Bear River Basin and its tributaries are better headwater habitats for the Bonneville Cutthroat Trout than other areas of the basin.
There are currently 17 instream flow filings in the Bear River Basin in Wyoming. Although none were permitted at the time of this study, there was no significant opposition to the filings at the public hearing. The filing are all in the Central Division on tributaries to Smith's Fork or on Raymond Creek. The current filings are above the irrigation diversion on the respective tributaries. Figure 17 shows the location of the instream flow segments.
3.5.2 Minimum Reservoir Conservation Pools and Bypass Requirements
In general, conservation pools are intended to provide the minimum volume of water necessary to maintain the existing aquatic life in the reservoir. Because on-stream reservoirs disrupt the natural flow in a stream, minimum bypass requirements are often dictated during the permitting process to provide the minimum flow downstream required to maintain existing fisheries. Table 12 shows the conservation pools and minimum releases for Sulphur Creek and Woodruff Narrows Reservoirs.
Table 12
Minimum Reservoir Pools and Releases
| Reservoir | Conservative Pool (acre-feet) |
Minimum Release (cfs) |
|---|---|---|
| Sulphur Creek Reservoir | 4,180 | 9 |
| Woodruff Narrows Reservoir | 4,000* | 10 |
| *Temporary storage account of 4,000 acre-feet was set up to accommodate an agreement between the Reservoir Company and the Utah Department of Fish and Game to supply the 10 cfs winter minimum release for fishery purposes. | ||
3.5.3 Wildlife Habitat
There is one wildlife refuge in the Bear River Basin in Wyoming that is currently in the land acquisition phase. The Cokeville Meadows National Wildlife Refuge (formerly referred to as the Bear River Valley Refuge) is located in Wyoming upstream of the Town of Cokeville. The area is approximately 16 miles long. The refuge will be maintained for aquatic fowl production.
A memorandum of understanding was signed by the U.S. Fish and Wildlife Service and the Wyoming State Engineer in October 1990. This memorandum is intended to assure that the wildlife refuge operates under Wyoming Water Law and protects downstream water user interests. The Cokeville Meadows National Wildlife Refuge is currently purchasing lands from willing sellers. The purchased lands, and remaining private lands within the designated refuge area, continue to irrigate crops. The consumptive use associated with this area is included in the agricultural consumptive use estimates. The memorandum of understanding dictates that future operations cannot deplete water in excess of historic practices without prior approval from the Wyoming State Engineer.
3.6 Recreational Use
Recreational uses of water within the basin are significant from an economic standpoint as well as from a "quality of life" standpoint. While consumption of water is usually not involved, the existence of a sufficient water supply for a quality experience is important. Recreation water use in the Bear River Basin in Wyoming includes:
Figure 18 shows the location of water based recreation sites in the Bear River Basin. A detailed summary of recreation use in the basin in provided in Appendix M.
3.6.1 Boating
Although boating on the Bear River and its tributaries is relatively limited, the Bear River Basin reservoirs are a popular destination for boaters. Both Sulphur Creek and Woodruff Narrows Reservoirs offer boating opportunities, however, it is difficult to quantify the use because neither reservoir requires boating permits.
A quality boating experience requires sufficient reservoir water levels. In recent years, the water levels have remained adequate year-round in Sulphur Creek Reservoir. Spring and early summer water levels in Woodruff Narrows Reservoir are sufficient for boating, and may extend throughout the year.
3.6.2 Fishing
Fishing is a significant water-based recreational activity in the basin, pursued by residents and visitors. As in boating, fishing is a non-consumptive use of water. However, the environmental importance of fisheries elevates its importance relative to river regulation and minimum instream flows, as discussed above.
The Wyoming Game & Fish Department classifies trout streams under five designations (WGF, rev. 1991). This river classification is unique to Wyoming Game & Fish Department and is not the same river classification used by Water Quality Division for classifying water quality. The Wyoming Game & Fish trout stream classification is as follows:
In the Bear River Basin there exist no waters currently classified as Class 1 or Class 2. However, the Bear River Basin is considered by many to provide good to fair trout fishing opportunities in its reservoirs, lakes, streams, and rivers. The Wyoming Game and Fish Department estimates that there are typically 9400 angler days on the streams within the basin and 7400 angler days on the lakes and reservoirs within the basin (primarily Sulphur Creek Reservoir, Woodruff Narrows Reservoir, and Lake Alice).
3.6.3 Waterfowl Hunting
The harvest of migratory waterfowl is a recreational pursuit affected by the presence or absence of water. Wetlands and open water are needed for breeding, nesting, rearing, feeding and isolation from land-based predators. In the Bear River Basin, waterfowl hunting is pursued where sufficient local or migratory populations are available. Hunter- days and harvest numbers for the 1999 duck hunting season and goose hunting season, provided by the Wyoming Game and Fish, are shown in Tables 13 and 14.
Table 13
1999 Estimated Number of Duck Hunters
| Management Area | No. Hunters | No. Hunter Days | Harvest |
| Upper Bear River(Upper Division) | 130 | 1,427 | 875 |
| Lower Bear River(Central Division) | 98 | 519 | 1,132 |
| Basin Total | 228 | 1,946 | 2,007 |
Table 14
1999 Estimated Number of Goose Hunters
| Management Area | No. Hunters | No. Hunter Days | Harvest |
| Upper Bear River(Upper Division) | 85 | 767 | 138 |
| Lower Bear River(Central Division) | 83 | 384 | 135 |
| Basin Total | 168 | 1,151 | 273 |
3.6.4 Swimming
Swimming is generally undertaken incidental to other activities. While some lakes and reservoirs are suitable for swimming and water-skiing (i.e. Sulphur Creek Reservoir and Woodruff Narrows Reservoir), many are too cold for comfort, or have bottom strata not conducive to swimming. Swimming has become increasingly popular at Bear River State Park, particularly near the bridge structure at the south end of the park.
3.7 Reservoir Evaporation
End of month reservoir levels are not generally available for the smaller reservoirs in the basin. Nor is this information available for Whitney Reservoir, Ben and Broadbent Reservoirs, or Woodruff Narrows Reservoir. Some reservoir level information is available for Sulphur Creek, but not on a continuous basis. In addition, elevation/area/capacity information is not available for most of the storage in the basin. Therefore, a conservative estimate of reservoir evaporation was made using the following general procedure:
The storage summary memorandum, presented in Appendix I, determined total permitted storage in the basin as shown in Table 15. The corresponding estimated surface area for this storage is 1,650 acres. Essentially all the storage is the Upper Division.
Table 15
Current Storage in the Bear River Basin
| Storage Description | Storage Volume (acre-feet) |
|---|---|
| Pre-Compact Developed Storage (Pre-1955) | 3,284.43 |
| Original Compact Storage (1955-1976) | 13,183.00 |
| Total | 16,467.43 |
The total average annual evaporation rate at Green River Wyoming is 3.2 feet per year. Therefore, total basin losses due to evaporation is estimated to be 5,280 acre-feet per year. As discussed in Appendix I, about 13,000 acre-feet of storage has been constructed since 1976, therefore evaporation amounts are considerably less during the early years of the study period.
3.8 Total Basin Water Use
The total basin water consumed in Wyoming due to human influence include the categories discussed above as follows:
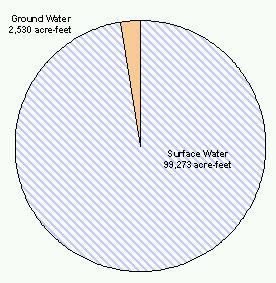
The current average annual total basin consumptive use is estimated to be 101,803 acre- feet per year. Figure 19 shows the average annual basin consumptive use by division.
Figure 19
Average Annual Basin Consumptive Use by Division
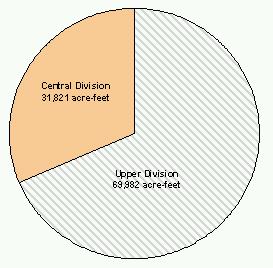
Figure 20 shows the average annual basin consumptive use by type.
Figure 20
Average Annual Basin Consumptive Use by Type
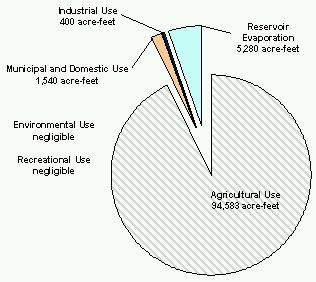
Figure 21 shows the average annual basin consumptive use by supply source.
Figure 21
Annual Basin Consumptive Use by Source
4.0 Basin Water Quality Profile
The basin water quality profile provides an inventory of current water quality issues and trends in the basin. Similar to the existing water use profile, surface and ground water quality was assessed in preparation for subsequent sections in the report. Current surface water quality issues serve as a basis for determining whether available surface water is of sufficient quality for future development and use. Current ground water quality is used as an indicator of whether additional ground water can be used to meet future demands.
4.1 Surface Water Quality
Water quality issues within the Bear River basin are monitored by a number of organizations and committees. One of these organizations, the Bear River Basin Water Quality Task Force has been instrumental in the coordination of water quality work within the tri-state (Idaho, Utah, and Wyoming) basin. The Task Force coordinates water quality planning issues with the appropriate regulatory agencies for each state. The primary regulatory agency that manages water quality issues within Wyoming is the Water Quality Division (WQD) of the Wyoming Department of Environmental Quality (DEQ). The WQD developed water quality standard which are documented in Chapter 1, Wyoming Water Quality Rules and Regulations. Chapter 1 is available on the WQD WEB Site at http://soswy.state.wy.us/rules/search.htm. The surface water quality standards are divided based on four surface water classifications:
Figure 22 shows the current stream classifications for the Bear River Basin. Detailed information regarding state, interstate, and federal water quality standards and monitoring are documented in the surface water quality memorandum attached as Appendix N.
When assessing water quality, it is important that there is a historic record of measurement taken at the same location, representing a range of flow regimes. The USGS has five surface water quality monitoring stations located within the Wyoming portion of the Bear River Basin that have significant historical water quality records. These stations, shown in Table 16 and located on Figure 22, monitor Class 2 stream segments.
Table 16
USGS Surface Water Quality Stations
| Gage ID | Stream Name | Period of Record |
|---|---|---|
| 10020100 | Bear River above Reservoir near Woodruff | 1985-Present |
| 10027000 | Twin Creek at Sage | 1975-1981 and 1989-Present |
| 10035000 | Smith's Fork at Cokeville | 1983-1988, 1989-1992 and 1993-Present |
| 10038000 | Bear River below Smith's Fork | 1992-Present |
| 10039500 | Bear River at Border | 1965-1989 |
Although levels of potassium, nitrogen, and sediment are of specific concern to downstream interests at Bear Lake, only sporadic measurements are available in the Bear River Basin in Wyoming. Therefore, it is difficult to determine if water flowing from Wyoming is contributing to the levels downstream. However, Total Dissolved Solids (TDS), a measure of the total amount of dissolved salts in water, is easily measured and is frequently used as an indicator of overall water quality. TDS has been measured over a relatively long period of time with some consistency at the five USGS water quality stations shown in Table 16. TDS measurements at the gaged locations were analyzed to determine:
Table 17 shows the Wyoming Water Quality Rules and Regulations TDS standards for domestic, agricultural, and livestock use.
Table 17
TDS Standards
| Pollutant | Domestic | Agricultural | Livestock |
| Total Dissolved Solids | 500 mg/L | 2000 mg/L | 5000 mg/L |
4.1.1 Compliance with Standards
Measurements at the five USGS gages were reviewed to determine if they were in compliance with the TDS standards. The following summarizes the review:
Surface water in the Bear River and Smith's Fork is of sufficient quality for domestic use. Surface water in Twin Creek is of sufficient quality for livestock and agricultural use, which is the primary use on Twin Creek. Because Twin Creek had the highest concentration of TDS in the basin, the other measured water quality parameters on Twin Creek (dissolved manganese and total nitrogen) were also reviewed. This review showed that both dissolved manganese and total nitrogen are within the acceptable range set by the Safe Drinking Water Act.
4.1.2 Relationship between TDS and Streamflow
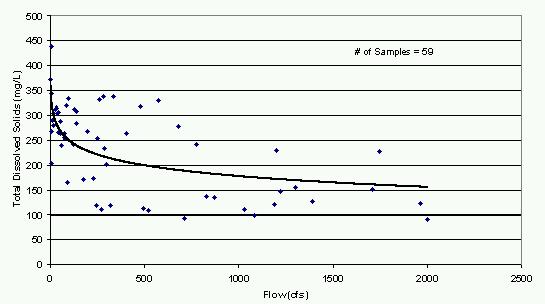
Figure 23 shows the relationship between TDS and Streamflow at the USGS gage above Woodruff Narrows Reservoir. As shown, TDS decreases with an increase in flow. This expected trend can be attributed to the source of water during different flow regimes. In the late spring and early summer, much of the flow is direct runoff from snow melt. In the late summer and non-irrigation months, a greater percent of the total flow is from agricultural and municipal return flows. Note that agricultural return flows are lagged over a four month period and these return flows are generally higher in TDS due to both human influence and naturally occurring constituents in the soil. Each of the five USGS gage sites show this general trend. As expected, the measurements also show that TDS is higher during dry years.
Figure 23
USGS Gage - Bear River above Reservoir, near Woodruff, UT
4.1.3 Variation in TDS from Upstream to Downstream Gages
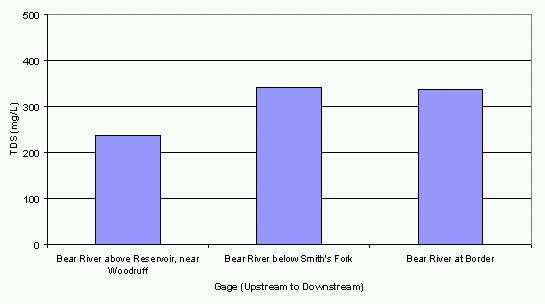
Figure 24 shows the average TDS for the available data from the Bear River above (Woodruff Narrows) Reservoir downstream to the Bear River below Smith's Fork and the Bear River at Border. As shown, the TDS increases from upstream to downstream, reflecting the use, return, and reuse of the limited resource. Twin Creek enters the Bear River between Woodruff Narrows Reservoir and Smith's Fork, which also may contribute to the increase in TDS in that reach. The reach from the Bear River below Smith's Fork to Border has little development, reflected in the TDS concentrations which remain relatively constant between the two gages.
Figure 24
Average Total Dissolved Solids along
Bear River from Upstream
to Downstream
4.1.4 Variation in TDS Over Time
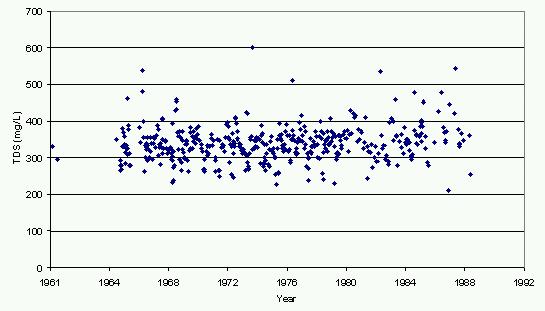
Figure 25 shows the amount of TDS measured at the Bear River at Border gage from 1961 through 1989. The TDS has been relatively constant over the available period. The other four gages also show that TDS has not increased over the period of records.
Figure 25
TDS at Bear River at Border, WY - 1961 through 1989
4.1.5 Total Maximum Daily Loads / 303(d) List
Total Maximum Daily Loads (TMDLs) are the amounts of pollutants a waterbody can receive and still maintain its designated uses. TMDLs are required to be established for each pollutant that is contributing to the impairment of a waterbody. Development of TMDLs must consider both point source and non-point source pollution and additionally must account for natural background conditions.
Section 303(d) of the Clean Water Act requires States to:
Bridger Creek is currently the only stream segment in the basin that is on the 303(d) list. The impairment on Bridger Creek was indicated as physical degradation due to non- point source pollution causing potential impairment of aquatic life use support, and was listed as a low priority for developing TMDLs. Two stream segments within the Bear River Basin were delisted from the 1998 303(d) list; Yellow Creek below the Evanston Waste Water Treatment Plant, and the Bear River below the Cokeville Waste Water Treatment. These waterbodies were delisted due to the implementation of ammonia, fecal coliform and total residual chlorine TMDLs for Yellow Creek, and the implementation of fecal coliform and total residual chlorine TMDLs for the Bear River.
Wyoming DEQ is working closely with their counterparts in Utah and Idaho to establish appropriate TMDL standards in the basin. At the time of this report, the process is still on-going.
4.1.6 Surface Water Quality Summary
The following summarizes the surface water quality in the Bear River Basin:
4.2 Ground Water Quality
Ground water quality data were obtained from the U.S. Geological Survey's Water Quality database, as discussed in Appendix O. A GIS coverage was developed from this database that provides a spatial reference for over 24 water quality parameters from 57 wells and 49 springs. Because of limited data for most parameters, only Total Dissolved Solids (TDS) is discussed in more detail.
As discussed in the Surface Water Quality Section, TDS is a measure of the dissolved solid mineral content and is a general indicator of the suitability of water for various uses. The U.S. EPA and the Wyoming Ground Water Standard for TDS in public water systems is 500 mg/L. The Wyoming Ground Water Standard for agricultural use is 2000 mg/L and for livestock use is 5000 mg/L. Table 18 lists the U.S. Environmental Protection Agency (EPA) recommended guidelines for TDS in irrigation water and its effects on crops.
Table 18
EPA Recommended Guidelines for TDS in Irrigation Water
| TDS Concentration (mg/L) | Guidelines |
| <500 | Water for which no detrimental affects are usually noticed. |
| 500 - 1000 | Water that can have detrimental affects on sensitive crops. |
| 1000 - 2000 | Water that can have adverse affects on many crops; requires careful management practices. |
| 2000 - 5000 | Water that can be used for tolerant plants on permeable soils with careful management practices. |
Figure 26 shows the location of wells with TDS measurements, and the corresponding TDS values, from the USGS database. As shown, most of the wells are in the alluvial aquifer. With the exception of the Twin Creek area, most of the TDS measurements are from the alluvial aquifer. Some TDS amounts were obtained from water conductivity measurements. TDS concentrations from thirty-three alluvial wells ranged from 190 to 1,030 mg/L as follows:
TDS concentrations from 59 bedrock aquifer wells and springs range from 54 to 5,403 mg/L as follows:
Because these measurements represent 17 different bedrock formations, any generalization concerning specific bedrock aquifer quality is speculative. Measurements in individual formations are discussed in the memorandum attached as Appendix O.
Figure 26 highlights the TDS concentrations from wells and springs. This figure shows that TDS concentrations increase from south to north in the alluvial aquifer. This is likely a result of high TDS bedrock spring discharge in the Twin Creek Area and increased agricultural and municipal return flows. As shown, measured TDS in the alluvial aquifer rarely exceeds the 1,000 mg/L standard for agricultural use.
4.2.1 Ground Water Quality Summary
Unlike continuous surface water quality gages, ground water quality measurements in the Bear River Basin have generally not been taken at the same location over time. Therefore, it is difficult to make assessments regarding trends in water quality. In addition, the number of measurements from individual bedrock formations are limited, and it is recognized that each formation is unique. However, generally conclusions can be made regarding the alluvial aquifer ground water quality:
5.0 Available Water Determination
Water supply planning requires consideration of many factors, including hydrology, water quality, physical facilities, and legal and institutional requirements. Surface water spreadsheet models were developed to:
Existing mapping and previous ground water studies and planning documents were reviewed and summarized into a discussion on the potential for additional ground water development. Existing well locations and yields were important in projecting future ground water development opportunities.
5.1 Surface Water Spreadsheet Models
The Bear River Spreadsheet Model is a complex system of spreadsheets which incorporate diversions, reservoirs, streamflow gaging stations, and historic legal and institutional constraints. Individual spreadsheet models were developed which reflect each of three hydrologic conditions: dry, normal, and wet year water supply. Each model relies on historical data from the 1971 to 1998 study period to estimate the hydrologic conditions.
Although the models do not explicitly account for water rights or compact allocations, historic operations based on these constraints are represented by the models. The individual models were used to identify water that could be put to future use in the Bear River Basin based on physical and legal availability. The development of the models relied on the following information, discussed in previous sections:
The models were developed in Microsoft Excel 2000 with a user-friendly menu-driven approach that will allow the State of Wyoming to easily update and maintain the model and to make initial assessments of water development projects proposed in the future. Figure 27 shows the Bear River Basin Planning Model initial screen. This interface directs the user to the individual spreadsheet for each hydrologic condition. Appendix P provides a detailed memorandum on the spreadsheet development and use.
Figure 27
Bear River Planning Model Initial Screen
5.1.1 Surface Water Spreadsheet Model Development
To mathematically represent the Bear River system, the river system was divided into twelve reaches based primarily on the location of USGS streamflow gaging stations. These reaches are shown in Figure 28, which is a screen captured directly from the spreadsheet models.
Other key locations, such as reservoirs or confluences with major tributaries, were also used to determine the extent of reaches. Each reach was then sub-divided by identifying a series of individual nodes representing locations where diversions occur, tributaries converge, or other significant water resources features are located.
Figure 28
Bear River Spreadsheet Model River Reaches
At each node, a water budget, or mass balance, computation is completed to determine the amount of water that flows downstream out of the node using the following mathematical equation:
River flows from upstream reaches
Return flows from upstream diversions
Reach gains from ground water or ungaged tributaries
Outflows are:
River flows to downstream reaches
Headgate diversions
Evaporation (at reservoir nodes)
Reservoir releases (at reservoir nodes)
Reach losses or seepage to ground water
Change in Storage is zero except at reservoir nodes.
Total flow into the node and diversions or other losses from the node are calculated. At non-storage nodes, the difference between all inflows and outflows is the amount of flow available to the next node downstream. For storage nodes, an additional loss calculation for evaporation and the change in storage are evaluated. Mass balance calculations are repeated for all nodes in a reach, with the outflow of the last node being the inflow to the top node in the next reach.
5.1.2 Input Worksheets
The spreadsheet models represent 100 percent of the surface water use on the Bear River mainstem in Wyoming, either as explicit key structures or aggregate structures described in Section 3.2.1. In addition, water use from Smith's Fork, and Sulphur Creek are also modeled. Sulphur Creek, and Woodruff Narrows Reservoirs are represented in the model. Other Bear River tributaries, not administered under the Bear River Compact, are not specifically modeled, but are represented by gaged and ungaged streamflows.
Specific inputs used by the model to calculate the basin water balance include:
Because the Bear River Compact accounting requires total diversions within the Upper and Central Divisions, diversions in the Utah portions of the Upper Division and diversions in the Idaho portion of the Central Division were represented in the modeling effort as aggregate structures. Specific details regarding the inputs to the spreadsheet model are included in Appendix P.
5.1.3 Results Worksheets
Results of the surface water spreadsheet models are provided in tabular form. The "Outflow Calculations: By Node" table summarizes the net flow for each node. The nodes are grouped by reach and a comparison of simulated flows with historic gaged flows are provided at USGS streamflow locations.
The "Summary of Diversion Calculation: By Node" table summarizes the computed diversion at each node. In addition, the "Comparison of Estimated vs. Historic Diversions" table presents comparison results and indicates any shortages occurring to target diversion volumes.
An effort was made to incorporate sufficient detail in the spreadsheet models to determine whether water emergency conditions exist as defined in the Bear River Compact for either the Upper or Central Divisions. The Water Commissioners worksheets for both divisions were computerized and all appropriate flows and diversions were tabulated. These tables determine whether an emergency condition exists; however, no attempt was made in the model to restrict diversions based on this determination. Figure 29 shows the "Bear River Commission Water Allocation: Central Division" table from the wet year spreadsheet model.
Figure 29
Bear River Spreadsheet Model Water Allocation Table
The results were reviewed, and compared to historic trends and known operations. This was to assure that the models provide a basis for assessing available water during dry, normal, and wet hydrologic conditions. The procedures and results are detailed in the "Surface Water Calibration" memorandum provided in Appendix P. This review determined that the Bear River Basin Spreadsheet Model can be used to reasonably estimate water availability in various reaches of the river during dry, normal and wet conditions on a monthly basis.
5.2 Surface Water Availability
An effort was made to incorporate sufficient detail in the spreadsheet models to determine whether water emergency conditions exist as defined in the Bear River Compact for either the Upper or Central Divisions. In addition, output tables were developed that would help facilitate the assessment of available water. The following general procedures were followed to assess surface water availability:
A detailed discussion on available water and compact and administration constraints to development of that water is provided in the "Task 3D Available Surface Water Determination" memorandum provided in Appendix P.
5.2.1 Upper Division Available Flows
Table 19 shows the water availability for the Upper Division. The table presents the following information for dry, normal, and wet year hydrologic conditions:
Table 19
Bear River Basin Water Availability - Upper Division
| Jan | Feb | Mar | Apr | May | Jun | Jul | Aug | Sep | Oct | Nov | Dec | |
|---|---|---|---|---|---|---|---|---|---|---|---|---|
| 1. Flow below Pixley Dam (AF) | ||||||||||||
| Dry | 1,972 | 1,665 | 3,744 | 3,934 | 1,693 | 7,601 | 6,842 | 2,572 | 1,492 | 1,735 | 2,255 | 1,959 |
| Normal | 4,745 | 4,836 | 11,520 | 18,627 | 40,023 | 38,213 | 25,526 | 9,038 | 5,950 | 6,162 | 5,932 | 5,260 |
| Wet | 6,098 | 7,736 | 20,226 | 32,192 | 83,950 | 92,935 | 40,990 | 20,293 | 18,027 | 15,040 | 13,319 | 8,975 |
| 2. Total Divertiable Flow (AF) | ||||||||||||
| Dry | - | - | - | - | 56,919 | 83,905 | 33,057 | 12,208 | 7,619 | - | - | - |
| Normal | - | - | - | - | 95,910 | 140,578 | 76,958 | 23,128 | 19,250 | - | - | - |
| Wet | - | - | - | - | 144,576 | 213,983 | 90,951 | 35,618 | 28,889 | - | - | - |
| 3. Min. Compact Flow Required (AF) | 0 | 0 | 0 | 0 | 76,861 | 74,381 | 76,861 | 76,861 | 74,381 | 0 | 0 | 0 |
| (cfs) | 0 | 0 | 0 | 0 | 1,250 | 1,250 | 1,250 | 1,250 | 1,250 | 0 | 0 | 0 |
| 4. Available Flow for WY (AF) | ||||||||||||
| Dry | 1,972 | 1,665 | 3,744 | 3,934 | 0 | 9,524 | 0 | 0 | 0 | 1,735 | 2,255 | 1,959 |
| Normal | 4,745 | 4,836 | 11,520 | 18,627 | 19,049 | 66,197 | 97 | 0 | 0 | 6,162 | 5,932 | 5,260 |
| Wet | 6,098 | 7,736 | 20,226 | 32,192 | 67,715 | 139,602 | 14,090 | 0 | 0 | 15,040 | 13,319 | 8,975 |
| 5. Preferable Reaches | 7,8,3,4,5 | 7,8,3,4,5 | 7,8,3,4,5 | 7,8,3,4,5 | 4,5,6,7 | 4,5,6,7 | 4,5,6,7 | none | none | 7,8,3,4,5 | 7,8,3,4,5 | 7,8,3,4,5 |
Notes:
| ||||||||||||
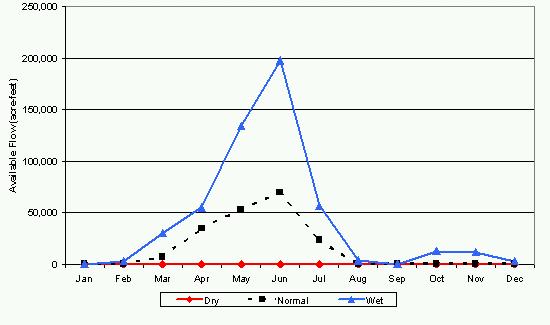
Figure 30 shows the total available monthly flow in the Upper Division for dry, normal, and wet hydrologic years.
Figure 30
Upper Division Available Monthly Streamflow during Dry, Normal, and Wet
Hydrologic Years
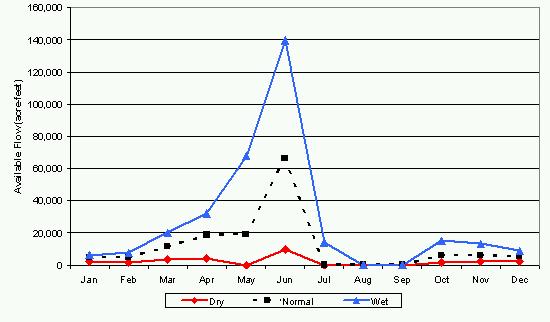
The following summarizes the Upper Division available flows:
5.2.2 Central Division Available Flows
Table 20 shows the water availability for the Central Division. The table presents similar information to the Upper Division table for dry, normal, and wet year hydrologic conditions as follows:
Table 20
Bear River Basin Water Availability - Central Division
| Jan | Feb | Mar | Apr | May | Jun | Jul | Aug | Sep | Oct | Nov | Dec | |
|---|---|---|---|---|---|---|---|---|---|---|---|---|
| 1. Flow at WY/ID Border (AF) | ||||||||||||
| Dry | 8,348 | 7,587 | 12,348 | 13,549 | 18,140 | 22,467 | 14,131 | 6,274 | 5,638 | 6,792 | 8,400 | 8,060 |
| Normal | 14,320 | 14,374 | 28,460 | 55,596 | 89,113 | 91,543 | 50,541 | 19,337 | 13,898 | 17,291 | 16,919 | 15,260 |
| Wet | 18,950 | 22,400 | 51,690 | 75,760 | 156,070 | 218,602 | 81,847 | 37,510 | 32,103 | 34,320 | 32,543 | 24,390 |
| 2. Flow below Stewart Dam (AF) | ||||||||||||
| Dry | 581 | 644 | 624 | 451 | 490 | 666 | 663 | 796 | 706 | 721 | 407 | 309 |
| Normal | 299 | 291 | 485 | 378 | 646 | 2,506 | 1,004 | 691 | 949 | 659 | 513 | 422 |
| Wet | 188 | 201 | 495 | 430 | 11,587 | 20,122 | 13,762 | 640 | 742 | 511 | 384 | 314 |
| 3. Total Divertiable Flow (AF) | ||||||||||||
| Dry | - | - | - | - | 35,843 | 43,034 | 29,962 | 15,945 | 10,623 | - | - | - |
| Normal | - | - | - | - | 106,795 | 121,001 | 77,046 | 36,155 | 24,631 | - | - | - |
| Wet | - | - | - | - | 197,323 | 257,533 | 110,055 | 57,043 | 43,434 | - | - | - |
| 4. Min. Compact Flow Required (AF) | 21,521 | 19,438 | 21,521 | 20,827 | 53,495 | 51,769 | 53,495 | 53,495 | 51,769 | 21,521 | 20,827 | 21,521 |
| (cfs) | 350 | 350 | 350 | 350 | 870 | 870 | 870 | 870 | 870 | 350 | 350 | 350 |
| 4. Available Flow for WY (AF) | ||||||||||||
| Dry | 0 | 0 | 0 | 0 | 0 | 0 | 0 | 0 | 0 | 0 | 0 | 0 |
| Normal | 0 | 0 | 6,939 | 34,769 | 53,300 | 69,232 | 23,551 | 0 | 0 | 0 | 0 | 0 |
| Wet | 0 | 2,962 | 30,169 | 54,933 | 134,549 | 197,775 | 56,560 | 3,548 | 0 | 12,799 | 11,716 | 2,889 |
| 6. Preferable Reaches | none | 9,11,12 | 9,11,12 | 9,11,12 | 9,11,12 | 9,11,12 | 9,11,12 | 9,11,12 | none | 9,11,12 | 9,11,12 | 9,11,12 |
Notes:
| ||||||||||||
Figure 31 shows the total available monthly flow in the Central Division for dry, normal, and wet hydrologic years.
Figure 31
Central Division Available Monthly Streamflow
during
Dry, Normal, and Wet Hydrologic Years
The following summarizes the Central Division available flows:
5.2.3 Use of the Bear River Spreadsheet Model
Direct Diversion Assessment
The spreadsheet modeling effort shows that there is not a reliable year-round source of water for a new diversion in most years. The model can be used to identify the shortages for a proposed water use that may be supplemented by purchase of existing storage shares or ground water. In addition, the model can be used to determine the increased available flow due to retirement of existing diversions.
Storage Assessment
Based on the results of the spreadsheet modeling effort, new surface water uses will likely require storage. There is essentially no available water for diversion during dry years. In addition, storage is required for normal and wet years if future water use is to occur in other than the high runoff months.
There are limitations and restrictions to additional storage outlined in the Bear River Compact. These have been summarized in Section 2.2.1 and discussed in detail in the storage memorandum included in Appendix I. Although these restrictions are difficult to assess basin-wide, the spreadsheet model can be used to screen new storage projects and determine if they meet the Compact requirements for additional storage.
5.3 Ground Water Availability
The ground water resources technical memorandum, attached as Appendix O, provides an analysis of the geology and associated aquifer systems in the Bear River Basin. The following general approach was used to identify the potential for future ground water development in the Bear River Basin in Wyoming:
Existing reports, identified in Appendix O, were helpful in understanding the hydrogeology in the basin, however, the primary source of data used to analyze ground water development potential came from the USGS Ground Water Site Inventory (GWSI) database and the Wyoming State Engineer's Water Well Inventory database. Information stored in these databases include:
5.3.1 Data Compilation and Use
Information stored in both databases pertain to specific geographic points, i.e. well locations. Therefore, their usefulness as a tool for understanding ground water issues was greatly enhanced by placing them into a GIS format. GIS point coverages were created from both the GWSI database and the State database showing the location of the wells and springs. The attributes from the respective database are assigned to each point in the GIS coverages, and maps were generated as analysis tools.
Because data are limited, the GIS coverages are useful tools with which to base general conclusions concerning the ground water resources in the basin. Planners can use the tool to identify the aquifers that have been developed in the vicinity of proposed new developments. Qualified hydrogeologists can use the coverage to extrapolate the data and come to more educated conclusions concerning site specific aquifer potential. Note that site specific investigations will still need to be done to come to more definite conclusions concerning a specific area's ground water development potential.
5.3.2 Well Yield
Well yield is important to consider when planning the number of wells for development. Well yield can be defined as the maximum rate at which a well can pump without lowering the water in the well below the pump intake. The maximum amount a well can produce is a function of well construction; aquifer characteristics; and the location, number, and pumping amounts of nearby wells. Well yield is also a function of how long the well is pumped. Since these data are scarce, reported well yield data were used as a subjective measure of the physical well potential from various aquifers. Reported well yields are either permitted amounts; instantaneous measurements by the pump installer (a function of the pump size); or actual long-term test data. Reported well yields are used as a measure of well yield considering the following qualifying assumptions:
Figure 32 shows the database coverage of reported well yield ranges in the basin. Based on the available information, it appears that
5.3.3 Long-term Aquifer Yield
The physical ability of an aquifer to produce water is a function of the same aquifer properties that are important in determining well yield. In addition, long-term aquifer yield is a function of the amount of recharge that occurs. If pumping exceeds recharge, aquifer dewatering (lowering water table) will result and yields will diminish. Recharge includes:
Any reduction in these inflows will eventually reduce the long-term yield and development potential of ground water in the basin.
Alluvial Aquifer Yield
The Bear River alluvial aquifer is defined as the aquifer that consists of saturated stream alluvium generally within 2 miles of the Bear River. Wells in the alluvial aquifer can sustain high well yields because aquifer drawdown is minimized by recharge from Bear River surface water. Because of this, long-term well yield is probably not constrained by declining aquifer water levels. Additional aquifer development is possible as long as water from the Bear River is available for recharge. The amount of additional development that can occur is dependent on assuring that existing water rights and interstate compacts are satisfied. Therefore, the quantity of water in the alluvial aquifer available for development is equal to the amount of surface water available to augment surface water depletions due to that development. In other words, the available surface water identified in Section 5.2 is the total that can be consumed from river withdrawals and alluvial aquifer wells combined.
Bedrock Aquifer Yields
Aquifers that are not within the stream alluvium are generally referred to as bedrock aquifers. Producing wells have been identified in at least 17 different bedrock formations. Limited recharge and relatively low permeability are the primary reasons why most bedrock aquifers have low well yields and low long-term aquifer yields. Bedrock aquifer recharge generally consists of effective precipitation and seepage between aquifers. These amounts are usually low. Therefore, additional bedrock development could exceed these inflows and cause unacceptable water level declines or reduced spring yields. As discussed in Appendix O, it is conservatively estimated that around 14,000 acre-feet per year can likely be removed from bedrock aquifers without causing a decrease in overall aquifer storage.
Like alluvial aquifers, the ground water development potential for bedrock aquifers is also constrained by depletions to the surface water system caused by pumping. Additional withdrawals could reduce spring discharges to unacceptable levels. Bedrock pumping also reduces the amount of subsurface recharge to the alluvial aquifer, which discharges into the Bear River. Bedrock well depletions take longer to occur the further away (distance and depth) the well is from the surface water system. However, the amount of additional development that can occur is also dependent on assuring that existing water rights and interstate compacts are satisfied.
5.3.4 Ground Water Availability Summary
Current ground water withdrawal estimates indicate that, on average, less than 3,000 acre-feet per year of ground water is currently used in the Bear River Basin. The majority of this use is from the alluvial aquifer. Future development of this aquifer could provide additional water to meet increased demands, however there are limitations and restrictions to additional depletions outlined in the Bear River Compact. These restrictions consider withdrawals from the alluvial aquifer similar to river withdrawals.
It is estimated that additional development in the bedrock aquifers up to 14,000 acre-feet per year would be sustainable. Well development in the bedrock aquifers needs to be studied in greater detail to determine the impact on Bear River flows and the extent to which compact restrictions may apply.
6.0 Demand Projections and Future Water Use Opportunities
6.1 Historic and Current Economic and Demographic Conditions
The starting point for the development of water demand projections requires an understanding of the current economic and demographic conditions in the basin. The identification of historic changes and trends in the basin, plus the evaluation of the most important sectors from an economic and water use standpoint, helped define the emphasis for future economic and demographic scenarios. A detailed analysis of historic and current economic conditions is described in the "Historic and Current Economic and Demographic Conditions " memorandum included in Appendix Q.
6.1.1 Historic Population Growth
Since 1960, the combined population of Evanston and Cokeville has increased at an average annual rate of about four percent. This long-term average, however, masks considerable fluctuation during this 40-year period. As shown in Figure 33, the population of the two communities actually declined during the 1960s, but grew rapidly during the decades of the 1970s and 1980s. The 1990s have been characterized by comparatively slow, but steady, growth, with the combined population of Evanston and Cokeville increasing at an average annual rate of less than one percent over the past ten years. In general, the rates of population growth in Evanston and Cokeville closely correspond to the rates of population growth for Uinta and Lincoln Counties as a whole, also shown in Figure 33, over the past four decades.
Figure 33
Population of Evanston and Cokeville and the Remainder of Lincoln and Uinta
Counties, 1960 to 2000
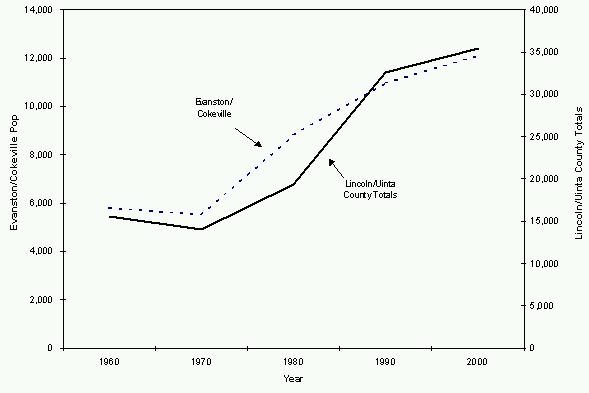
6.1.2 Historic and Current Employment
It is estimated that there are currently 20,000 full and part-time jobs located in Uinta and Lincoln Counties. Approximately 10,000 of these jobs are located within the Bear River Basin portions of the two counties, with approximately 9,500 jobs located in the Uinta County part of the Basin (principally in and around Evanston) and about 500 jobs located in the Lincoln County portion.
Uinta County employment grew rapidly from the late 1970s through the mid-1980s during the period of intense oil and gas development activity, now known locally as "The Boom." After experiencing a slight decline in total employment during the late 1980s, Uinta County jobs have grown steadily at about the same rate as the State as a whole during the 1990s. In general, Lincoln County employment growth during the past three decades has been slower than either Uinta County or the State as a whole. An exception was the brief period of power plant construction during the mid-1980s; county employment fell back shortly thereafter to levels comparable to the pre-construction period.
Figure 34 shows the shares of total employment in Lincoln County, Uinta County, the State of Wyoming, and the U.S. for major industry divisions. The following conclusions can be drawn from this figure and information gathered for the basin:
Figure 34
Composition of 1998 Employment by Sector
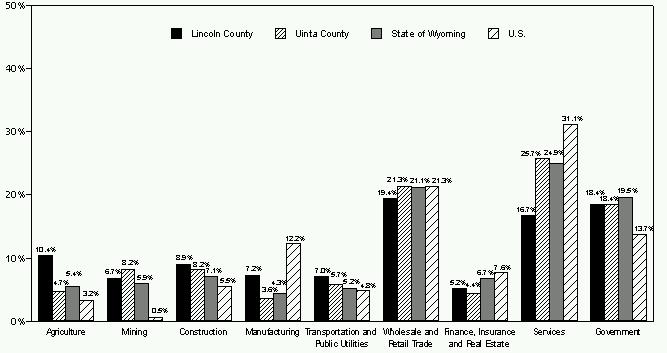
6.2 Future Economic and Demographic Scenarios
An economic base analysis was used to project future growth in the Bear River Basin, as described in the "Future Economic and Demographic Scenarios" memorandum included in Appendix Q. This "bottom up" method has the advantages of focusing directly on specific activities that are likely to drive economic and demographic changes in the future. This approach involved the following five steps:
Two planning scenarios were developed using the economic base approach. The planning horizon was 30 years, therefore growth was estimated through the year 2030. The High Case Scenario incorporates the most growth in each of the key sectors that is reasonably likely to occur over the forecast horizon. This scenario incorporates the aggressive assumption that each of the key sectors will achieve its highest likely growth at the same time, providing an upper bound for water planning purposes.
The Low Case Scenario incorporates the lowest growth reasonably likely to occur in each of the key sectors. This provides the lower bound for planning purposes. Although this scenario will not impose pressure on regional water resources, it can be used to determine the financial risk involved with potential water resource enhancements.
Based on the analysis of historic and current employment, four key sectors were identified that are the most likely to continue to be important to future economic growth in the Bear River Basin as follows:
6.2.1 Agriculture Sector
Agriculture sector projections were based on historic trends and assumptions about 1) future BLM grazing policies and 2) whether the Cokeville Meadows Wildlife Refuge will be fully implemented by the end of the projection time horizon.
Crop production in the Bear River Basin consists mainly of hay (irrigated meadow and alfalfa) used for supplemental livestock feed. The vast majority of hay grown within the basin in consumed by basin livestock during the winter months. Since livestock are the most important cash crop of the basin agricultural sector, the analysis of the agricultural sector is based largely on livestock inventory. In order to standardize the analysis in terms of livestock forage levels, livestock inventories are converted to "Animal Units." This is equal to the sum of cattle inventories divided by two and sheep inventories divided by five.
High Case Scenario
The High Case Scenario for agricultural production reflects the assumptions that the BLM will continue historical grazing policies and that the Cokeville Meadows Wildlife Refuge will remain largely unimplemented. Under this scenario, cattle production continues to increase and sheep production continues to decline by about one percent annually. By the end of the planning horizon, there are projected to be 31,000 cattle animal units and 10,000 sheep animal units within the Bear River Basin. Under this scenario, irrigated acreage would increase slightly to about 69,000 acres in the year 2030. The number of ranches and total farm jobs would remain at approximately current levels, assuming increased labor efficiency.
Low Case Scenario
The Low Scenario for agricultural production reflects changes in the two assumptions. The first is that the BLM will expand its "no-conversion of sheep to cattle" grazing policy to other allotments in the basin, producing a decline in grazing capacity on public lands. This would reduce the projected animal units by 4,000. The second is that the Cokeville Meadows Wildlife Refuge will be fully implemented, reducing the basin animal units by approximately 4,000 at the end of the planning horizon. Therefore, the total projected cattle animal units at the end of the planning horizon would be about 24,000. Under this scenario, irrigated acreage would decrease slightly to about 61,000 acres in the year 2030. The basin would lose a total of 50 farm jobs by the year 2030.
6.2.2 Energy Sector
Energy sector projections were based upon local insights into the life cycle of the Bear River Basin oil and gas fields, USDOE Energy Information Administration (EIA) long range projections of energy supply and statistical analyses to project first Wyoming production, then basin production. Essentially, the low and high scenarios reflect differing assumptions regarding: a) national and regional total gas and oil production, and b) the proportion of Wyoming gas production, and Rocky Mountain Region oil production, that will be supplied by operations within the Basin.
High Case Scenario
The High Case Scenario for natural gas production reflects EIA High Technology Case projections for natural gas production in the Rocky Mountain Region, with a slower decline in the Basin proportion of total Wyoming gas production due to renewed exploration and enhanced recovery techniques. Under this scenario basin production and associated processing will be approximately 15 percent more than current production. Oil production reflects EIA High Technology Case projections for natural gas production in the lower 48 states. Under this scenario, basin production and processing decreases by approximately 50 percent from current production.
Low Case Scenario
The Low Case Scenario for natural gas and oil production reflects EIA Reference Case projections for natural gas production in the Rocky Mountain Region, plus information regarding existing oil and gas fields in the basin. Under this scenario basin gas production and processing will cease by 2027. Basin oil production and processing will cease by 2026.
6.2.3 Tourism Sector
Tourism sector projections were based upon 1) increases in traffic counts projected by the Wyoming Department of Transportation at the Evanston East traffic counter station, and 2) projected population growth for the Davis, Morgan, Salt Lake and Weber Counties in the Wasatch Front region of Utah. Note that water related recreational uses are expected to increase significantly in the next 30 years, which will contribute to tourism in the basin. Projected increases in recreational uses are detailed in the "Future Recreational Demands" memorandum included in Appendix Q.
High Case Scenario
The High Case Scenario for tourism reflects, in part, the assumption that basin visitation will increase in proportion with projected increases in I-80 traffic in the Evanston area. Estimated tourist related employment in Evanston would be more than two times current levels, reflecting an average annual growth of 2.9 percent.
Low Case Scenario
The Low Case Scenario for tourism reflects the assumption that growth in the basin will occur at the same rate as growth in the population of the Wasatch Front region in Utah, the primary source of non-highway visitors. Estimated tourist related employment in Evanston would rise by slightly more that 60 percent, reflecting an average annual growth of 1.6 percent.
6.2.4 Manufacturing Sector
The high scenario for the manufacturing sector is based on the historic trend in manufacturing job growth in the Evanston area. The low manufacturing sector scenario reflects, in part, an anticipated slowdown in growth in manufacturing employment in the nearby Wasatch Front and reflects the close economic ties between Evanston and the Utah economic centers and the fact that Evanston is a potential alternative for firms looking to be near, but not in the midst of, the Salt Lake City Metropolitan Area.
High Case Scenario
The High Case Scenario for manufacturing, light industrial, and business service activities, is projected to increase at an average annual growth rate of six percent per year. Total employment in these activities will rise from a current level of about 650 jobs to over 3,000 jobs by 2030.
Low Case Scenario
The Low Case Scenario for manufacturing, light industrial, and business service activities, is projected to increase at an average annual growth rate of two percent per year. Total employment in these activities will rise from a current level of about 650 jobs to over 1,200 jobs by 2030.
6.2.5 Overall Economic and Demographic Projections
The future economic projections were incorporated into a model of Bear River Basin employment and population in order to develop aggregated estimates of total residents and total jobs in 2030 under the Economic Base High Scenario and Economic Base Low Scenario. Table 21 shows the current and projected employment breakdown, by sector, in the Bear River Basin.
Table 21
Current and Projected Employment Breakdown
| Current Employment Bear River Area Only |
2030 -- High Scenario Bear River Area Only |
2030 -- Low Scenario Bear River Area Only | Uinta Co | Lincoln Co | Uinta Co | Lincoln Co | Uinta Co | Lincoln Co |
|---|---|---|---|---|---|---|
| Basic Employment | ||||||
| Agriculture | 260 | 265 | 260 | 265 | 245 | 230 |
| Tourism/Visitor Related | 640 | 50 | 1,500 | 130 | 1,040 | 100 |
| Energy Related | 900 | 0 | 900 | 0 | 0 | 0 |
| Other Industry (Manuf./Bus. Services) | 650 | 0 | 3,700 | 100 | 1,170 | 0 |
| Highway/Railroad Construction and Services | 100 | 0 | 100 | 0 | 100 | 0 |
| State/Federal Government | 500 | 0 | 500 | 0 | 500 | 0 |
| Net Outcommuting | 800 | NA | 1,500 | NA | 1,200 | NA |
| Subtotal | 3,850 | 315 | 8,460 | 495 | 4,255 | 330 |
| Indirect Basic/Local Service Employment | ||||||
| Subtotal | 5,650 | 185 | 11,000 | 300 | 5,530 | 200 |
| Total Employment | 9,500 | 500 | 19,460 | 795 | 9,785 | 530 |
| Total Employment/Direct Basic Ratio* | 2.5 | 1.6 | 2.3 | 1.6 | 2.3 | 1.6 |
The two scenarios portray markedly different potential futures for the region. Under the high case scenario, activity and employment in the energy producing sector would remain relatively stable, agricultural production and irrigated acreage would increase modestly, and there would be substantial growth in tourism related employment and, especially, in new manufacturing and commercial activities targeted toward customers outside the region. Under the low case, there would be modest declines in agriculture due to public land grazing availability and implementation of the Cokeville Meadows Wildlife Refuge, energy activity would essentially cease by 2030, and growth in tourism and manufacturing/commercial activity would essentially be just sufficient to offset the loss of jobs in the energy sector.
Projected Bear River Basin population in 2030 under the high case would exceed 29,000 residents, compared a little more than 15,000 residents under the low case, which is similar to year 2000 basin population.
6.3 Future Water Demand Projections
Water demands are derived by multiplying current or projected demographic or economic activity by the water use factors for each activity. These water use factors are based on existing water use estimates, described in Section 3.0. Total water diversions and consumptive use are presented and discussed for each sector for both High Case and Low Case scenarios. A detailed analysis is discussed in the "Future Demand Projections" memorandum included in Appendix Q.
6.3.1 High Case Scenario Projected Water Use
Total basin water diversion requirements are projected to increase by about seven percent from year 2000 to year 2030 under the High Case Scenario. Under normal water year conditions, this amounts to about 21,400 acre-feet; under dry hydrologic conditions (high demand year) the increase would be about 29,000 acre-feet. Table 22 shows the current and projected water diversion demand for the High Case Scenario. Table 23 shows the corresponding consumptive use under the High Case Scenario.
Table 22
Current and Projected Annual Bear River Water Diversion Demand in Acre-Feet
High Case Scenario
| Current Demands | 2030 High Scenario Demands | |||
|---|---|---|---|---|
| Normal Demand Year | High Demand Year | Normal Demand Year | High Demand Year | |
| Demand by Type of Use | ||||
| Agriculture Irrigation Livestock Agriculture Subtotal |
294,668 528 295,196 |
419,185 528 419,713 |
311,577 611 312,188 |
443,239 611 443,850 |
| Municipal Evanston Residential Commercial Institutional Subtotal Cokeville Municipal Subtotal | 2,087 638 1,067 3,792 653 4,446 |
2,286 705 1,386 4,377 653 5,030 |
4,228 1,310 2,162 7,700 664 8,364 |
4,631 1,447 2,807 8,886 664 9,550 |
| Rural Domestic | 500 | 500 | 959 | 959 |
| Industrial | 459 | 680 | 494 | 731 |
| Total Demand | 300,601 | 425,923 | 322,005 | 455,091 |
| Demand by Source of Supply | ||||
| Surface Water | 293,454 | 416,212 | 314,042 | 444,416 |
| Ground Water | 7,147 | 9,710 | 7,963 | 10,675 |
| Total Demand | 300,601 | 425,923 | 322,005 | 455,091 |
| * Note that High Demand Year corresponds to Dry Hydrologic Conditions | ||||
Table 23
Current and Projected Annual Bear River Water Consumptive Use in Acre-Feet
High Case Scenario
| Current Demands | 2030 High Scenario Demands | |||
|---|---|---|---|---|
| Normal Demand Year | High Demand Year | Normal Demand Year | High Demand Year | |
| Demand by Type of Use | ||||
| Agriculture Irrigation Livestock Agriculture Subtotal |
94,528 528 95,056 |
136,251 528 136,779 |
99,953 611 100,564 |
144,070 611 144,681 |
| Municipal Evanston Residential Commercial Institutional Subtotal Cokeville Municipal Subtotal | 1,262 387 655 2,304 505 2,809 |
1,468 455 976 2,899 507 3,406 |
2,557 794 1,3264 4,678 513 5,192 |
2,973 935 1,977 5,885 516 6,400 |
| Rural Domestic | 500 | 500 | 959 | 959 |
| Industrial | 459 | 680 | 494 | 731 |
| Total Demand | 98,825 | 141,365 | 107,209 | 152,772 |
| Demand by Source of Supply | ||||
| Surface Water | 95,829 | 137,460 | 103,629 | 148,229 |
| Ground Water | 2,996 | 3,906 | 3,580 | 4,543 |
| Total Demand | 98,825 | 141,365 | 107,209 | 152,772 |
| * Note that High Demand Year corresponds to Dry Hydrologic Conditions | ||||
The following summarizes uses for the High Case Scenario:
6.3.2 Low Case Scenario Projected Water Use
Total water diversion requirements under the low case scenario are projected to be slightly lower in 2030 than they were in 2000. However, in any given year from 2000 to 2030, there might be the need for 120,000 more acre-feet in a high demand, dry year compared with a normal year. Table 24 shows the current and projected water diversion demand for the Low Case Scenario. Table 25 shows the corresponding consumptive use under the Low Case Scenario.
Table 24
Current and Projected Annual Bear River Water Diversion Demand in Acre-Feet
Low Case Scenario
| Current Demands | 2030 Low Scenario Demands | |||
|---|---|---|---|---|
| Normal Demand Year | High Demand Year | Normal Demand Year | High Demand Year | |
| Demand by Type of Use | ||||
| Agriculture Irrigation Livestock Agriculture Subtotal |
294,668 528 295,196 |
419,185 528 419,713 |
277,139 487 277,627 |
394,249 487 394,736 |
| Municipal Evanston |
0 | 0 | 15,305 | 21,434 |
| Municipal Evanston Residential Commercial Institutional Subtotal Cokeville Municipal Subtotal | 2,087 638 1,067 3,792 653 4,446 |
2,286 705 1,386 4,377 653 5,030 |
2,126 659 1,087 3,872 471 4,342 |
2,329 728 1,412 4,468 471 4,938 |
| Rural Domestic | 500 | 500 | 504 | 504 |
| Industrial | 459 | 680 | 0 | 0 |
| Total Demand | 300,601 | 425,923 | 297,779 | 421,614 |
| Demand by Source of Supply | ||||
| Surface Water | 293,454 | 416,212 | 291,261 | 412,753 |
| Ground Water | 7,147 | 9,710 | 6,518 | 8,860 |
| Total Demand | 300,601 | 425,923 | 297,779 | 421,614 |
| * Note that High Demand Year corresponds to Dry Hydrologic Conditions | ||||
Table 25
Current and Projected Annual Bear River Water Consumptive Use in Acre-Feet
Low Case Scenario
| Current Demands | 2030 Low Scenario Demands | |||
|---|---|---|---|---|
| Normal Demand Year | High Demand Year | Normal Demand Year | High Demand Year | |
| Demand by Type of Use | ||||
| Agriculture Irrigation Livestock Agriculture Subtotal |
94,528 528 95,056 |
136,251 528 136,779 |
88,905 487 89,393 |
128,146 487 128,634 |
| Municipal Evanston |
0 | 0 | 4,862 | 6,780 |
| Municipal Evanston Residential Commercial Institutional Subtotal Cokeville Municipal Subtotal | 1,262 387 655 2,304 505 2,809 |
1,468 455 976 2,899 507 3,406 |
1,286 399 667 2,352 364 2,716 |
1,495 470 994 2,959 365 3,324 |
| Rural Domestic | 500 | 500 | 504 | 504 |
| Industrial | 459 | 680 | 0 | 0 |
| Total Demand | 98,825 | 141,365 | 97,475 | 139,242 |
| Demand by Source of Supply | ||||
| Surface Water | 95,829 | 137,460 | 94,829 | 135,809 |
| Ground Water | 2,996 | 3,906 | 2,646 | 3,433 |
| Total Demand | 98,825 | 141,365 | 97,475 | 139,242 |
| * Note that High Demand Year corresponds to Dry Hydrologic Conditions | ||||
The following summarizes uses for the Low Case Scenario:
6.4 Comparison of Projected Demand to Available Surface Water Supplies
Available surface water, defined in Section 5.2, was compared to High Case Scenario projected demands for normal and dry hydrologic years. The geographic allocation of future monthly water demands reflects the following:
6.4.1 Diversion Demands versus Available Surface Supply in Normal Years
Table 26 shows the projected monthly increase in required surface water supply to meet increased demands under the High Case Scenario for normal hydrologic year conditions in the Upper and Central divisions. These are compared to the available surface water, defined in Section 5.2, to show surpluses and shortages.
Table 26
Projected Increase in Diversion Demands versus Available Supply
Normal Year Conditions (all values in acre-feet)
| Upper Division | |||||
| Projected Demand Growth by Month | Available Surface Supply | Surplus/(Shortage) | |||
|---|---|---|---|---|---|
| Agriculture | Other | Total | |||
| Jan | 2 | 156 | 158 | 4,745 | 4,587 |
| Feb | 2 | 150 | 152 | 4,836 | 4,684 |
| Mar | 2 | 152 | 155 | 11,520 | 11,365 |
| Apr | 38 | 145 | 183 | 18,627 | 18,444 |
| May | 813 | 237 | 1,050 | 19,049 | 17,999 |
| Jun | 2,725 | 491 | 3,217 | 66,197 | 62,980 |
| Jul | 3,210 | 698 | 3,908 | 97 | (3,811) |
| Aug | 1,457 | 803 | 2,260 | 0 | (2,260) |
| Sep | 405 | 551 | 956 | 0 | (956) |
| Oct | 42 | 269 | 311 | 6,162 | 5,851 |
| Nov | 2 | 141 | 143 | 5,932 | 5,789 |
| Dec | 2 | 143 | 145 | 5,260 | 5,115 |
| Total | 8,702 | 3,936 | 12,637 | 142,425 | 129,788 |
| Central Division | |||||
| Projected Demand Growth by Month | Available Surface Supply | Surplus/(Shortage) | |||
| Agriculture | Other | Total | |||
| Jan | 2 | 0 | 2 | 0 | (2) |
| Feb | 2 | 0 | 2 | 0 | (2) |
| Mar | 2 | 0 | 2 | 6,939 | 6,937 |
| Apr | 10 | 0 | 10 | 34,769 | 34,759 |
| May | 610 | 0 | 610 | 53,300 | 52,690 |
| Jun | 2,804 | 0 | 2,804 | 69,232 | 66,428 |
| Jul | 3,008 | 0 | 3,008 | 23,551 | 20,543 |
| Aug | 1,575 | 0 | 1,575 | 0 | (1,575) |
| Sep | 319 | 0 | 319 | 0 | (319) |
| Oct | 22 | 0 | 22 | 0 | (22) |
| Nov | 3 | 0 | 3 | 0 | (3) |
| Dec | 2 | 0 | 2 | 0 | (2) |
| Total | 8,359 | 0 | 8,359 | 187,791 | 179,432 |
During a normal year, the growth in demands are dominated by the agricultural sector in both the Upper and Central divisions, however, growth in demand for non-agricultural purposes will be an important factor only in the Upper Division. During the summer growing season agricultural demands constitute between 64 and 84 percent of total demand growth in the Upper Division. In the Central Division, agricultural demand growth constitutes 100 percent of the total increase in monthly demands through 2030. This difference is due mainly to the growth in municipal water demand projected for the Evanston area over the next 30 years. Therefore, while agricultural demands follow roughly the same monthly distribution in both divisions, the monthly distribution of total demand growth between the divisions varies due to the influence of the non-agricultural sector.
The monthly distribution of available, uncommitted surface water supplies for a normal year is similar for both the Upper and Central divisions. Available supplies begin building with the spring runoff and peak in the month of June. In each division, available supplies stabilize throughout the fall and winter seasons. The main difference is that in the Upper Division some surface water supplies remain available nine months of the year, while in the Central Division supplies are available only during the spring runoff period.
Table 26 also shows the difference in the growth of demands and the uncommitted surface water supplies on a monthly basis under normal conditions. In the Upper Division, shortages are projected to only occur during the peak irrigation periods. During the remaining months, uncommitted surface supplies are more than adequate to meet the projected growth in demand. In the Central Division, while monthly shortages are projected to occur from August through February, only August shortages are significant. From March through July, it is estimated that more than enough surface water will be available to meet the projected growth in demand.
6.4.2 Diversion Demands versus Available Surface Supply in Dry Years
Table 27 shows the projected monthly increase in required surface water supply to meet increased demands under the High Case Scenario for dry hydrologic year conditions in the Upper and Central divisions. These are compared to the available surface water, defined in Section 5.2, to show surpluses and shortages.
Table 27
Projected Increase in Diversion Demands versus Available Supply
Dry Year Conditions (all values in acre-feet)
| Upper Division | |||||
| Projected Demand Growth by Month | Available Surface Supply | Surplus/(Shortage) | |||
|---|---|---|---|---|---|
| Agriculture | Other | Total | |||
| Jan | 2 | 180 | 183 | 1,972 | 1,789 |
| Feb | 2 | 173 | 176 | 1,665 | 1,489 |
| Mar | 2 | 176 | 178 | 3,744 | 3,566 |
| Apr | 51 | 168 | 219 | 3,934 | 3,715 |
| May | 1,128 | 274 | 1,403 | 0 | (1,403) |
| Jun | 3,789 | 568 | 4,356 | 9,524 | 5,168 |
| Jul | 4,463 | 806 | 5,269 | 0 | (5,269) |
| Aug | 2,025 | 927 | 2,952 | 0 | (2,952) |
| Sep | 561 | 636 | 1,197 | 0 | (1,197) |
| Oct | 58 | 311 | 369 | 1,735 | 1,336 |
| Nov | 2 | 163 | 165 | 2,255 | 2,090 |
| Dec | 2 | 165 | 168 | 1,959 | 1,791 |
| Total | 12,088 | 4,547 | 16,635 | 26,788 | 10,153 |
| Central Division | |||||
| Projected Demand Growth by Month | Available Surface Supply | Surplus/(Shortage) | |||
| Agriculture | Other | Total | |||
| Jan | 2 | 0 | 2 | 0 | (2) |
| Feb | 2 | 0 | 2 | 0 | (2) |
| Mar | 2 | 0 | 2 | 0 | (2) |
| Apr | 12 | 0 | 12 | 0 | (12) |
| May | 847 | 0 | 847 | 0 | (847) |
| Jun | 3,899 | 0 | 3,899 | 0 | (3,899) |
| Jul | 4,183 | 0 | 4,183 | 0 | (4,183) |
| Aug | 2,189 | 0 | 2,189 | 0 | (2,189) |
| Sep | 441 | 0 | 441 | 0 | (441) |
| Oct | 30 | 0 | 30 | 0 | (30) |
| Nov | 3 | 0 | 3 | 0 | (3) |
| Dec | 2 | 0 | 2 | 0 | (2) |
| Total | 11,612 | 0 | 11,612 | 0 | (11,612) |
The distribution of demand growth during dry years has many of the same characteristics as normal years. The main difference is that in a dry year, the growth in demand for the agricultural sector increases to a much greater extent than in the non-agricultural sector. Demand growth in a dry year for the agricultural sector in both the Upper and Central divisions increased by 40 percent over what they were in a normal year. In contrast, the Upper Division non-agricultural growth in demand increased by only 16 percent. Overall demand growth in dry years is approximately 35 percent greater than under normal year climate and hydrologic conditions.
Annual uncommitted surface supplies declined dramatically in both divisions for dry year conditions versus normal year conditions. For the Upper Division, annual available supplies shrank to 19 percent of what they were under normal conditions. The largest monthly percentage declines comes during the months of May through September, when agricultural usage is at its highest. During this period, available supplies go to zero for all months except June, which declines to 14 percent of what was available in a normal year. For the Central Division, available supplies during dry year conditions go to zero during all months of the year.
The significant decline in available surface water supplies has important consequences for the monthly surplus/shortage totals projected for each division. Whereas under normal year conditions both the Upper and Central Divisions experienced very few months with significant projected shortages, under dry year conditions, both divisions experience significant projected shortages during the summer irrigation season. It should be noted that sequential dry years would aggravate these shortages considerably.
6.4.3 Supplemental Supplies
Projected future water supply demands will require supplemental water from storage or from ground water, since there is essentially no available water for diversion during dry years. Storage or supplemental ground water is required for normal and wet years if future water use is to occur in other than the high runoff months.
It is estimated that supplemental storage, limited by Bear River Compact restrictions, is feasible in the Bear River Basin. In addition, increased ground water development could be a viable source for meeting the projected demands.
6.5 Future Water Use Opportunities
6.5.1 Economic Development Opportunities
Wyoming's approach to basin planning includes the identification and prioritization of future water use opportunities. Specifically, it was the intent of the planning process to generate a "long-list" of opportunities to be presented to the BAG. Based on the comments from the BAG and others, a "short-list" would then be generated reflecting the more attractive and feasible opportunities for further consideration as an outcome to the plan.
This process involved extensive interviews with representatives from government, larger industrial entities, agriculture, energy, and tourism. These interviews did not result in the identification of any extraordinary economic plans or opportunities beyond the growth scenarios previous discussed in Section 6.2.
These findings were presented to the BAG for their comment and concurrence. The BAG expressed consensus relative to the economic planning scenarios presented herein. In addition, members of the public and the BAG were unable to identify additional specific economic opportunities impacting water use. No short-list, therefore, is included in the Bear River Basin Plan. As opportunity(s) are identified in the future, the spreadsheet modeling software created as part of the planning effort will be a valuable tool in ascertaining the feasibility and/or impacts of individual projects.
6.5.2 Storage Opportunities
As indicated above, projected future water supply demands will require supplemental water from storage or from ground water, since there is essentially no available water for diversion during dry years. Storage potential is discussed as follows:
Bear River Compact Storage Limitations
The original 1958 Bear River Compact acknowledged the right of each member state to store water in existing water storage reservoirs constructed upstream of Stewart Dam prior to February 4, 1955. In the case of Wyoming, the compact indicates that Wyoming's pre-compact (pre-1955) storage rights total 2,150 acre-feet. It is interesting to note that Wyoming's actual developed pre-compact permitted storage totals 3284.43 acre-feet. This information is summarized in Appendix I.
The Bear River Compact also granted additional storage rights above Stewart Dam, of 35,500 acre feet in a given water year, to be split evenly between Wyoming and Utah (17,750 acre-feet each). These storage allocations are subordinate to direct flow and fill during the non-irrigation season. Between 1959 and 1976, the State of Wyoming permitted storage reservoirs totaling 17,759.56 acre-feet. (See Appendix I) The 1978 Amended Bear River Compact granted further storage entitlements in the amount of 70,000 acre-feet above Stewart Dam. Again, this storage entitlement was split evenly between Wyoming and Utah. These storage rights are also subordinate to direct flow and diversion rights. In addition, these reservoirs cannot be filled when the water surface elevation of Bear Lake is below 5911.00 feet.
Bear River Compact Storage Availability
In the event that the water surface elevation of Bear Lake drops below 5911 feet, compact restrictions on storage go into effect as indicated above. These restrictions, however, do not impact storage rights granted under the original 1958 compact. Hence, Wyoming is entitled to fill the following storage under the 1958 Compact.
Pre-1976 Permitted Volume:	                        13,183
Additional Woodruff Narrows Allocation:      	           250
                                                        13,433 acre-feet
Note that the Needle Rock Reservoir on Yellow Creek was permitted, but never
constructed. In addition, Keith Putnam elected not to construct a reservoir on Rabbit
Creek and has been granted the right to transfer his compact depletion to other lands.
Both of these pre-1976 allocations totaling 163.5 acre-feet are available for re-allocation.
An application is still pending for the Ferney Glade Reservoir on the Smiths Fork which
was filed on 8-1-1960 for 5201 acre-feet of storage. The 4,100 acre-feet allocated to
Smith's Fork was primarily intended for this project. No development has occurred on
the Thomas Fork in Wyoming. Therefore, Wyoming's remaining 1958 Compact
allocations are as follows:
			Smiths Fork		        4,100
			Thomas Fork			   55
			Putnam Allocation		   63
                   Needle Rock Allocation	        100.5
  		                                       4318.5 acre-feet
As indicated above, the pre-compact (pre-1955) storage developed in Wyoming totals
3284.43 acre-feet. This, combined with the 13,433 acre-feet of storage developed under
the 1958 compact, totals 16,717.43 acre-feet of storage that can be filled in Wyoming
even when the Bear Lake level drops below 5911 feet in elevation. It is worth noting that
Wyoming temporarily assigned additional 1958 compact allocations to other reservoirs
(Woodruff Narrows, Broadbent, and Sulphur Creek) in the basin when Bear Lake levels
dropped below 5911 feet in the early 1990's.
Available Physical Supply (Direct Diversion vs. Storage Potential)
There are essentially 8 dry years in the 28 year study period, during which a new direct diversion project would not receive any water (about 3 out of every 10 years there are no divertible flows). As previously shown in Tables 19 and 20, there are virtually no available flows in either division during dry year periods, in any months. To guarantee a firm yield beyond existing allocations during these dry year periods, additional storage reservoirs would be required.
Based on the normal year hydrology, the best development plan would be the construction of storage up to the yield available during these years - 150,000 and 190,000 acre-feet in either the Upper or Central Divisions respectively. There would be the need to carry over some storage to guard against dry year yields (zero) and to take into account evaporation and seepage losses from the reservoir(s). The firm yield, therefore, would be on the order of 75,000 acre-feet in the Upper Division and 95,000 acre-feet in the Central Division. It should be noted that storage facilities this large would exceed Wyoming's compact allocation.
A review of the wet years shows much higher available flows, but they occur only in three years out of 28 years or about 11 percent of the time. Planning and constructing facilities on these occurrences would result in an oversized reservoir and would not significantly increase the firm yield of a water supply, even though there is up to 500,000 acre-feet available during these wet periods years.
Alternative Reservoir Sites
There have been several previous studies directed toward the feasibility and capacity of various reservoir sites within the Bear River Basin. In 1958, Banner & Associates studied potential sites on Twin Creek, Upper Bear River (East & West Forks), Mill Creek (13 sites), Yellow Creek (2 sites), and Smith's Fork (3 sites) under contract to the Wyoming Natural Resources Board. Forsgren Perkins Engineering completed a detailed study of the West Fork site in 1985 for the WWDC. GBR Consultants completed as study of the Smiths Fork (Teichert-Bagley) site for the WWDC that same year. These sites and their potential capacities are shown schematically on Figure 35.
The potential for future reservoir construction was presented to the BAG on several occasions for discussion. The consensus of the BAG was to not pursue or list storage as a short-list option at this time. This feeling was, in part, due to economic concerns (cost vs. benefit) and environmental permitting concerns. Nonetheless, storage is a viable option in the future as the need and/or economic desirability of storage changes.
Smiths Fork Reservoir Sites
Near the completion of the planning study, water users from the Cokeville area approached the Wyoming Water Development Commission to initiate discussions relative to developing storage on Smith's Fork. Based on the modeling efforts, Smith's Fork has excellent storage potential from a hydrologic standpoint. As indicated above, there is a permit pending for the Ferney Glade Reservoir on Smith's Fork which was filed in 1960 for 5201 acre-feet. A larger reservoir would likely require the partnership and participation of downstream states, and perhaps an amendment to the Bear River Compact.
6.5.3 Conservation Opportunities
The state of Wyoming is supportive of water conservation as an environmentally responsible policy. In many cases, water conservation offers an economic benefit to water users. In the case of municipalities, for example, reduced water consumption translates into reduced treatment and operational costs. The same can be true of industrial water users.
In the case of irrigation, one would expect agricultural users to benefit through increased overall water availability due to conservation measures. However, in the Bear River Basin, as in many basins in the west, this is not necessarily the case. Current land application practices in the Upper Division almost exclusively involve flood irrigation. As a result of this inefficient practice the Bear River is recharged, with up to 50% of the return flows re-entering the streams later in the irrigation season when divertible flows would normally be much less. This essentially in-ground storage actually benefits water users late in the irrigation season. Irrigation conservation may be more economically attractive in the Central Division where Water Emergency conditions typically occur earlier in the season.
There are various voluntary conservation and preservation programs in place that could benefit water users in the basin. These programs include:
7.0 Continued Planning Process
Wyoming's Water Planning Process is not intended to provide a directive for the implementation of future water development, but rather to provide the basic information needed to address water issues that arise in the future. One of the most important products of the planning process is the collection, storage in a useable format, and understanding of basic water resource and water use data in the Bear River Basin.
7.1 Use of the Bear River Basin Water Planning Products
This report and the supporting data used in the development of this report are intended to be used as a reference for citizens of the State of Wyoming and agency personnel to understand the current state of water use and development in the Bear River Basin. This report and the planning products generated can provide assistance in establishing purpose and need for future water development or changes of use. The supporting data and models will be easily accessible for more detailed analysis of the feasibility of specific projects.
The Bear River Basin planning effort has created an informed group of citizens interested in water issues. The members of the basin advisory group have chosen to continue to meet three times a year to discuss water issues. The Bear River Basin Water Plan Report will provide the framework for discussions and planning efforts related to current water use, projected water use, compact issues, and other regulatory issues in the Basin.
7.2 Future Water Planning
Previous Wyoming water planning documents provided useful snapshots in time, but were often outdated within a few years. The advance of computer and Internet technology will help assure that the Statewide Water Planning Process will remain current and accessible to the citizens of Wyoming. The WWDC intends to update each basin water plan on a regular schedule, approximately every five years.
As indicated in Section 6.2, there are currently no specific water-related projects identified for implementation. Economic or legal changes may results in project needs not presently anticipated. The planning process products will allow for cost-effective and timely evaluation of those projects.