Wyoming State Water Plan
Wyoming State Water Plan
Wyoming Water Development Office
6920 Yellowtail Rd
Cheyenne, WY 82002
Phone: 307-777-7626

Wyoming Water Development Office
6920 Yellowtail Rd
Cheyenne, WY 82002
Phone: 307-777-7626


TECHNICAL MEMORANDUM
| SUBJECT: | Task 4. Snake/Salt River Basin Water Demand Projections Memo 2: Future Economic and Demographic Scenarios |
| PREPARED BY: | Edward Harvey and Marc Carey BBC Research & Consulting |
| DATE: | October 17, 2002 |
This memorandum describes economic and demographic projections for the Snake/Salt River Basin (Basin) under three alternative scenarios. The study team's economic and demographic projections for the Basin are addressed as follows:
Information summarized in this memorandum was gathered from publicly available secondary sources and from personal and telephone interviews conducted by BBC Research & Consulting (BBC) from May through August 2002. References are listed at the end of this memorandum.
This memorandum is one of three that comprise the water demand projections for the Basin. An overview of economic and demographic conditions in the Basin, and more specific description of current conditions in key economic and water use sectors, was provided in Memo 1. The third memorandum describes the future water demand projections, based upon the economic and demographic projections detailed in this memorandum.
Approach
There are numerous approaches to developing economic and demographic projections for a regional economy, ranging from simple statistical extrapolation to sophisticated econometric modeling. The projection approaches vary in terms of complexity, the amount of information they convey, and the amount of data they require. The following paragraphs provide a description of existing economic and demographic projections for the Snake/Salt River Basin area and the study team's assessment of the appropriateness of those projections for the purposes of this study. This section concludes with an overview of the forecasting approach adopted by the study team, and reviewed by the Wyoming Water Development Commission, and an overview of the three planning scenarios that drive the subsequent projections.
Review of Existing Projections
The study team reviewed a number of existing economic and demographic projections for potential suitability for use in this study. These projections come from various sources, including:
Necessary characteristics for purposes of projecting Snake/Salt River Basin water demands include: a time horizon similar to (or longer than) the 30- year planning horizon for this study, recognition of basin-specific economic and demographic characteristics and sufficiently detailed results to allow projection of specific types of water demand (such as agricultural use). The study team found that although each of the existing projections has merit for its intended uses, none was ideally suited in isolation to the purposes of this study.
Exhibit 1, below, provides a summary of the review of each existing economic and demographic projection.
Exhibit 1. Alternative Economic and Demographic Forecasting Techniques Potentially Applicable to the Snake/Salt River Basin
| Source of Projection | Geographic Detail | Future Period | Variables Projected | Means of Application | Issues |
| Bureau of the Census | State of Wyoming | 2025 | Population | Trend applied to State, Adjusted to reach national total | Not sufficiently Basin-specific |
| Wyoming State DAI | State of Wyoming; counties | 2009 | Population, Employment, Income | National model step down to state to counties | Forecast period not long enough |
| Teton County Water Supply Master Plan | Teton County | 2020 | Population and Households Only | Traffic Analysis Zones | Population and Households only; Not full basin |
| Private AGS | County and block level | 2012 | Many Demographic/ economic variables | Combination of local and national data | Forcast period not long enough |
| Woods & Poole | State of Wyoming; counties | 2025 | Many demographic/ economic variable | National model step down to economic areas to counties | Not sufficiently Basin-specific |
| REMI | State of Wyoming; counties | 2032 | Population, Employment, Income | Interaction of County/State economies with national economy | Not sufficiently Basic-specific |
| DRI - WEFA | State of Wyoming; counties | 2027 | Population, Employment, Income | Manufacturing trends, county built up to state totals | No agriculture information |
Source: BBC Research & Consulting.
Economic Base Methodology
The economic and demographic projection approach adopted by the study team for this effort employs an established technique in regional economics known as "economic base analysis." The economic base approach is a "bottom-up" method that has the advantages of focusing directly on specific activities that are likely to drive economic and demographic changes in the future and providing a substantial level of detail about those activities in the future, while at the same time being less data intensive than econometric modeling approaches. Essentially, this approach involves the following five steps:
Overview of Planning Scenarios
The study team developed three alternative planning scenarios for this study, employing the economic base forecasting approach just described. An overview of each of these scenarios is provided below. More specific details about the assumptions for the key sectors of agriculture and tourism and the potential interactions between these sectors in the economic base projection scenarios are provided following this overview.
High Scenario. In the simplest terms, the High Scenario incorporates the study team's views of the most growth in each of the key sectors that could potentially occur over the forecast horizon. It is remotely possible that one or more of the key sectors could grow even more than we have assumed under this case or an unforeseen, new basic economic activity could become established and flourish in the region. It is also likely that due to the interrelationships between these sectors, the growth in aggregate employment and population that drives future water demand will be somewhat moderated. However, the study team felt that the underlying aggressive assumption that each of the key sectors will achieve its highest reasonably likely growth at the same time makes this scenario a useful upper bound for subsequent water planning purposes.
Low Scenario. The Low Scenario embodies the study team's views of the lowest simultaneous growth (or largest contraction) reasonably likely to occur in each of the key sectors over the planning horizon. While even lower economic activity levels in one or more sectors are not impossible, the inverse interrelationship between the agriculture and tourism sectors likely implies that the actual growth that occurs over the planning horizon may be somewhat higher than this projection. Again, the study team felt that the assumption of simultaneous low activity levels in each of the key sectors, though somewhat artificial, made this scenario a supportable lower bound for planning purposes. While the Low Scenario obviously will not impose pressure on regional water resources, this scenario is sometimes used for purposes of determining the financial risk involved with potential water resource enhancements.
Mid Scenario. The Mid Scenario represents the study team's views of the most realistic level of growth likely to occur in each of the key sectors over the planning horizon. As in the other two scenarios, the potential interaction between the agricultural and tourism sectors are acknowledged. Although the actual economic growth experienced in the Basin may vary somewhat from this projection because of this interaction, the assumed activity levels represent, in the study team's best judgment, the rate of growth most likely to be experienced in the Basin. As such, this scenario is perhaps the most useful for water planning purposes.
Economic Base Scenario Assumptions for Key Sectors - Agriculture
Local interviews and research into both historic agricultural practices and competing environmental and recreational interests provide insight into potential factors that may influence the future of agriculture in the Snake/Salt River Basin. The factor that will most likely have the largest potential impact on Basin agriculture is the continued demand for seasonal and second home development. Other potential factors that may significantly impact agriculture within the Basin include changes in public land grazing policies such as the listing of various cutthroat trout species or the expansion of grizzly bear recovery area on USFS land (Broyles, Grows). The following are summary observations about prospects for Snake/Salt River Basin agriculture in the future.
As discussed in the first technical memorandum, while livestock in Teton County is almost exclusively cattle, there are a large number of sheep still being grazed in northern Lincoln County, especially on the land bordering the Greys river (Kennington). Public land grazing authorizations in the Basin may underestimate actual livestock numbers as large ranching operations exist, especially in Teton County, which utilize private grazing resources almost exclusively (Resor). As the numbers of traditional livestock (cattle and sheep) continue to decline, horses used for pleasure riding are becoming increasingly abundant, especially in Teton County. These horses are found both on individual ranchettes and as part of the burgeoning commercial riding sector that has developed in order to meet recreational demand (Resor, Maher).
The production of feed for local livestock is still the primary driving force behind irrigated agriculture within the Basin. Numbers of livestock and irrigated acres are not as closely correlated, however, as they are in other parts of the State. In normal years, northern Lincoln County produces more hay than can be consumed by local livestock. This surplus is either consumed by "tourist cattle" (cattle imported from Utah to graze during the summer months) or is exported outside the County, to Teton County or Idaho (Brown, Kennington). In contrast, Teton County imports hay with much of the supply coming from northern Lincoln County (Resor).
Escalating land values in Teton County have also created an affordable housing crunch for local workers. A recent study found the median values of homes sold to be just over $300,000 in Teton County while the average annual wage for workers in the county was about $27,000 in 2000 (Prior and Associates, 2001). Because of the lack of affordable housing, many Teton County residents are purchasing homes in eastern Idaho or northern Lincoln County and commuting to Jackson for work (Prior and Associates, 2001). In response to this problem, Teton County has recently undertaken an effort to update an affordable housing program that was originally developed in the mid-1990s (Teton County, May 2002).
In addition, Forest Service representatives have raised several environmental issues during interviews that could potentially affect future stocking levels in the portions of the Bridger Teton (BTNF) and Caribou Targhee (CTNF) national forests within the Basin. Of primary concern is the potential listing of threatened or endangered species, including the Yellowstone, Bonneville and Colorado Cutthroat trout species. The listing of any or all of these species would affect all grazing allotments within the BTNF, and could restrict the length of the grazing season on public lands. Similar listings in western portions of the CTNF have produced reductions in stocking levels of between 25 and 30 percent (Broyles, Grows).
Another issue raised during interviews is the potential expansion of grizzly bear recovery area within the BTNF portion of the Basin. Currently, no expansion of the recovery area is planned and officials disagree on the impact that such an expansion would have on future stocking levels (Broyles, Grows). The issue of an expanding wolf population on BTNF lands has also been discussed (Broyles).
Since livestock are the most important cash crop of the Basin agricultural sector, BBC's analysis of agricultural sector water use is based on the Basin specific public land grazing authorizations and information from interviews with local ranchers presented in Exhibit 7 in Technical Memo 1. In order to standardize the analysis in terms of livestock forage levels, county level livestock inventories were converted to "Animal Units." Animal unit estimates were calculated by dividing estimated cattle inventories by two, sheep inventories by five, and estimated horse inventories divided by 1.2. Using trend analysis on various historical data series stretching as far back as 1975, total animal units were then projected from the last year of historical data (2001) to the end of the planning horizon (2032).
The Snake/Salt river basin is somewhat different from other Wyoming Basins in that a variety of agencies have management responsibilities for public lands within the Basin. Accordingly, BBC used trends derived from agency specific historic stocking levels to project animal units within the Basin. A key assumption is that future changes in livestock inventories on lands managed by a particular agency will follow the same time-trend as historical inventories. Historical county level data from the Wyoming Agricultural Statistics Service (WASS) were also used to project livestock inventories in Lincoln County.
Interviews with key local agricultural personnel indicated only a loose correlation between stocking levels and irrigated hay acreage. In Teton County, for example, producers continue to import hay as an increasing amount of land is removed from production and converted to residential development. Lincoln County agricultural experts also note that, because of export markets and tourist cattle, irrigated acreage is not directly determined by local livestock levels (Kennington). Two key assumptions for BBC's analysis are: 1) irrigated land in Teton County is removed from production at roughly the same rate that residential development occurs; and 2) producers in Lincoln County are able to meet the resulting excess demand for hay in Teton County. The resulting trends are then applied to GIS-estimated, 2001 irrigated acreage levels for the Basin (Sunrise Engineering) to project changes in irrigated hay acreage over the planning horizon under each planning scenario.
Data collected by the study team indicate that some small grains, primarily barley, are grown in both Teton and Lincoln Counties (Sunrise Engineering). In Teton County, grain acreage is minimal. For the sake of simplicity, this grain is assumed to be exported to Idaho for livestock feed, and the acreage is held constant throughout the projections period. A larger amount of acreage along the Salt River is planted to grains, with the resulting production split between feed for local livestock and dairy cattle (Kennington).
In Lincoln County, historical trends from the WASS are applied, reflecting the most optimistic observed rate of change (about a 1 percent annual rate of increase for cattle and a 1 percent annual rate of decline for sheep). Horses in northern Lincoln County are projected to grow at about 1.3 percent annually, a rate proportionate to half the rate of recent residential development in that portion of the county (Prior and Associates, 2001). Long-term BTNF authorization trends were also applied to authorized stocking levels in Sublette County.
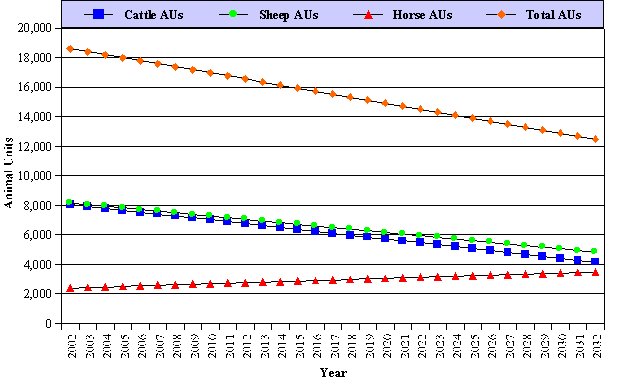
Projected animal units under this scenario are depicted in Exhibit 2. By the end of the planning horizon, BBC projects roughly 5,800 cattle animal units, 5,700 sheep animal units and 3,800 horse animal units within the Snake/Salt river basin.
Exhibit 2. Projected Animal Units: Snake/Salt River Basin Counties,
2032 - High Scenario
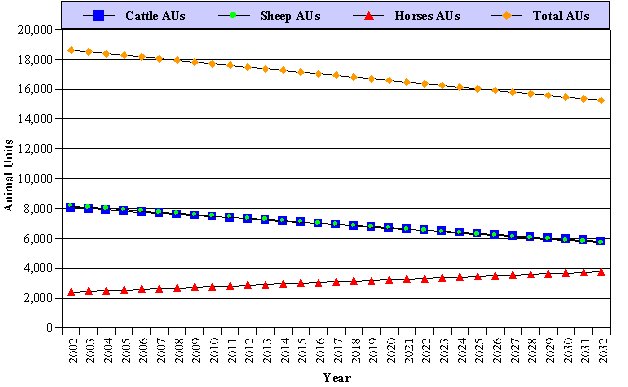
Source: Current livestock authorization levels from interviews with Kemmerer and Pinedale offices, Bureau of Land Management, Bridger-Teton and Caribou-Targhee National Forest personnel and Department of the Interior, 2001. Basin level projections made by BBC based on historical trends and interviews with local agricultural operators (Resor, Maher).
Under this scenario, BBC projects a total of about 15,200 animal units will be grazed in the Basin at the end of the planning horizon. Basin-level projections for the High Scenario, the Low Scenario and the Mid Scenario (discussed later) are depicted in Exhibit 3.
Exhibit 3. Projected Animal Units: Snake/Salt River Basin, 2032
Source: Current livestock authorization levels from interviews with Kemmerer and Pinedale offices, Bureau of Land Management, Bridger-Teton and Caribou-Targhee National Forest personnel and Department of the Interior, 2001. Basin level projections made by BBC based on historical trends and interviews with local agricultural operators (Resor, Maher).
Under the High Scenario, irrigated acreage will slightly increase from current levels for the duration of the thirty-year projection period (See Exhibit 4). Specifically under the High Scenario, BBC projects a total of about 103,000 irrigated acres within the Basin in the year 2032. This includes roughly 89,000 irrigated hay acres and 14,000 irrigated acres planted to small grains. Under this scenario, it is assumed that irrigated acres in Teton County will remain at current levels and that the estimated 10 percent of irrigable land currently vacant within the Lincoln County portion of the Basin will come back into hay production. Grain production along the Salt River is expected to change in proportion to a weighted average of projected livestock and dairy cattle in Lincoln County under this scenario.
Exhibit 4. Projected Acres Irrigated Hay: Snake/Salt River Basin, 2032
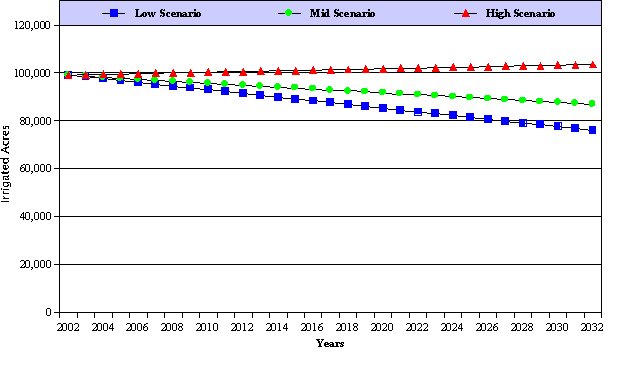
Source: Current irrigated acreage levels from Sunrise Engineering. Projections made by BBC based on historic trends and interviews with local agricultural representatives (Brown, Resor, Kennington)
The High Scenario for the Star Valley dairy industry assumes that the number of dairy cattle will remain at current levels over the course of the projection period. This optimistic outlook reflects the enactment of the national dairy market loss payment program (DMLP) as part of the 2002 farm bill, and the assumption that this income support program (or something similar) will be in place over the course of the projection period. According to dairy experts, this program is designed to encourage production and help smaller producers (those with 150 head or less), such those in Star Valley, survive (Wolf).
Historical BTNF trends are applied in Lincoln County under this scenario, with the additional assumption that the rate of decline for cattle will double due to increased development pressures. Sheep are not similarly affected since they are typically grazed along the Greys river, an area that is not expected to experience the same residential development pressures (Kennington, Brown). Horses in northern Lincoln County are projected to grow at about 1.3 percent annually, a rate proportionate to half the recent residential development in that portion of the county (Prior and Associates, 2001). Long-term BTNF trends were also applied to authorized animal units in Sublette County.
Projected animal units under this scenario are depicted in Exhibit 5. Under this scenario, BBC projects a total of about 10,700 animal units will be grazed in the Basin at the end of the planning horizon. Specifically, BBC projects roughly 2,700 cattle animal units, 4,700 sheep animal units and 3,300 horse animal units within the Snake/Salt river basin.
Exhibit 5. Projected Animal Units: Snake/Salt River Basin Counties, 2032 - Low Scenario
Source: Current livestock authorization levels from interviews with Kemmerer and Pinedale offices, Bureau of Land Management, Bridger-Teton and Caribou-Targhee National Forest personnel and Department of the Interior, 2001. Basin level projections made by BBC based on historical trends and interviews with local agricultural operators (Resor, Maher).
Under the Low Scenario, irrigated acreage will decrease by roughly 23 percent from current levels for the duration of the thirty-year projection period (See Exhibit 4). Specifically under the Low Scenario, BBC projects a total of about 76,000 irrigated acres within the Basin in the year 2032. This includes roughly 68,000 irrigated hay acres and 8,000 irrigated acres planted to small grains. Under this scenario, it is assumed that irrigated hay acres in Teton County will decline at .5 percent annually, a rate somewhat less than is projected for residential development in Teton County (Prior and Associates, 2001). This rate assumes that many of the newly developed ranchettes will continue to irrigate a portion of their land. Hay acreage in Lincoln County is projected to decline at a similar rate, proportionate to projected local livestock declines. Grain production along the Salt River is expected to decline in proportion to a weighted average of projected livestock and dairy cattle in Lincoln County.
The Low Scenario assumes that the Star Valley dairy industry will be eliminated over the course of the projection period. This pessimistic outlook reflects the assumption that the USDA will move away from income support programs for small dairy operators over the course of the projection period. The economic reality is that without these types of programs, smaller dairy producers will have a difficult time competing. This scenario assumes that the Star Valley cheese factory will either relocate or obtain milk supplies from larger Idaho producers.
Historical BTNF trends are also applied in Lincoln County, reflecting the fact that the majority of grazing in this part of the Basin takes place on BTNF lands. Horses in northern Lincoln County are projected to grow at about 1.3 percent annually, a rate proportionate to recent residential development in that portion of the county (Prior and Associates, 2001). Long-term BTNF trends were also applied to authorized animal units in Sublette County.
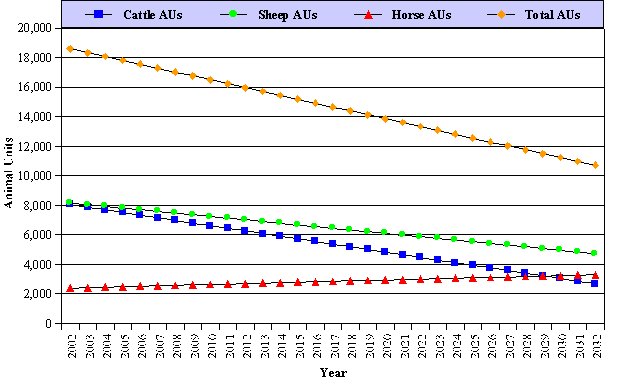
Projected animal units under this scenario are depicted in Exhibit 6. Under this scenario, BBC projects a total of about 12,500 animal units will be grazed in the Basin at the end of the planning horizon. Specifically, BBC projects roughly 4,200 cattle animal units, 4,800 sheep animal units and 3,500 horse animal units within the Snake/Salt River Basin.
Exhibit 6. Projected Animal Units: Snake/Salt River Basin Counties, 2032 - Mid Scenario
Source: Current livestock authorization levels from interviews with Kemmerer and Pinedale offices, Bureau of Land Management, Bridger-Teton and Caribou-Targhee National Forest personnel and Department of the Interior, 2001. Basin level projections made by BBC based on historical trends and interviews with local agricultural operators (Resor, Maher).
Under the Mid Scenario irrigated hay acreage will decrease by about 13 percent from current levels over the duration of the thirty-year projection period (See Exhibit 4 above). Specifically under the Mid Scenario, BBC projects a total of nearly 87,000 irrigated acres within the Basin in the year 2032. This includes roughly 74,000 irrigated hay acres and 13,000 irrigated acres planted to small grains. Under this scenario, it is assumed that irrigated acres in Teton County will decrease by roughly .15 percent annually, reflecting a more conservative assumption for future residential development than under the low scenario. It is also assumed that many of the newly developed ranchettes will continue to irrigate a portion of their land. Hay production is expected to decline at about a .4 percent annual rate, reflecting the assumptions that 1) an estimated 10 percent of the irrigated land projected under the low scenario within the Lincoln County portion of the Basin will come back into production, and 2) Lincoln County hay producers will meet the excess hay demand created by Teton County irrigated acre reductions. Grain production along the Salt River is expected to decline in proportion to a weighted average of projected livestock and dairy cattle in Lincoln County.
The Mid Scenario for the Star Valley dairy industry assumes that the number of dairy cattle will continue to decline at historical rates (about 1 percent annually) over the course of the projection period. This outlook reflects the study team's assessment that while the industry is unlikely to be completely eliminated, local producers will continue to consolidate, and an increasing portion of the milk supplied to the Star Valley cheese factory will come from out of state (Brown).
Economic Base Scenario Assumptions for Key Sectors - Tourism
The tourism/recreational sector is the cornerstone of the economy within the Snake/Salt river basin, especially within Teton County. The two primary components of the sector are destination tourists and seasonal residents. Destination tourists are those who plan a trip specifically to visit Grand Teton National Park or some other attraction within the Basin. Seasonal residents are those who visit the area for an extended period of time because they have a second home in the area. Visitation within the Basin is highly seasonal, with the peak months generally being June through August for summer activities and January through March for winter activities. In order to gain insight into the recreational trends that affect the tourist industry within the Basin, BBC interviewed a variety of local commercial outfitters and recreational representatives from public land management agencies and representatives of local ski resorts and other resort attractions. The following are summary insights into the current recreational trends and the prospects for tourism and visitor related activities in the future, as well as a description of the underlying assumptions for the high, low and mid scenario projections.
Summer Peak Season. Areas within the Snake/Salt river basin that are available for recreational use include lands managed by the NPS, the USFS and the BLM. In general, recreation activity levels within GTNP are the most tightly controlled, especially water-based recreation. Two companies have outfitting contracts on Jackson Lake and some 14 companies have river contracts with the NPS (McMahill). All commercial guides operate under a strict quota system in terms of numbers of boats and launches (Myer). A large amount of private use also occurs on water bodies within the Park. Recreational activity on rivers within the BTNF (including the Snake River Canyon, the Greys River, the Hoback River and many small tributaries) is becoming more restricted, although in general, it is less heavily regulated than in GTNP (Turner). Over the last four years, the unregulated stretch of the Snake River between Wilson Bridge and South Park Bridge has become very popular among floaters. Although this stretch was not used much historically because of low scenic value, the fact that it has recently seen an expansion in use indicates that a significant, unmet recreational demand existed, signaling room for future growth.
Winter Peak Season. The primary winter attractions within the Basin are the three alpine ski areas of Jackson Hole, Snow King and Grand Targhee. Each area has recently diversified operations to include snow tube parks in the winter, and a host of summer activities such as scenic chairlift rides, alpine slides and mountain biking. Jackson Hole and Snow King have extensive snowmaking operations, and Grand Targhee is just installing its first snowmaking operation in 2002. Each of the three areas has significant expansions planned during the projections period, including both skiable terrain and snowmaking operations. Winter recreational activity, such as backcountry skiing and snowmobiling is also rapidly increasing on Forest Service lands, although accurate visitor counts are problematic. Snowmobiling within the boundaries of GTNP is currently under review as part of an EIS process.
Shoulder Seasons: In general, the shoulder visitation seasons within the Basin are the months of May, September and October. As both the summer and winter peak seasons experience increased congestion, these months have seen a rapid increase in visitation and recreational activity.
Exhibit 7. Number of Visitor Days, Visitor Expenditures and Jobs Supported by Tourism in the Snake/Salt River Basin, 2032 - High Scenario
| Number Visitor Days (Thousands) | Total Visitor Expenditures (Millions) | Total Supporting Jobs | |
| Seasonal Residents | 3,991 | $460 | 12,223 |
| Summer | 2,385 | $266 | 7,066 |
| Winter | 410 | $49 | 1,301 |
| Other | 1,196 | $145 | 3,856 |
| Destination Tourist | 10,890 | $1,082 | 28,769 |
| Summer | 6,296 | $576 | 15,310 |
| Winter | 1,196 | $129 | 3,415 |
| Other | 3,399 | $378 | 10,044 |
| Grand Total Tourist | 14,882 | $1,541 | 40,992 |
| Summer | 8,681 | $841 | 22,376 |
| Winter | 1,606 | $177 | 4,716 |
| Other | 4,595 | $523 | 13,900 |
Source: Current levels based on Morey and Associates, 1999, 2000; Runyan and Associates, 2001; and Prior and Associates, 2001. Projections made by BBC based on historical recreational and housing trends in the Basin.
Exhibit 7 shows that under this scenario, the number of visitor days for destination tourists and seasonal residents would increase to roughly 15 million by 2032. Total annual visitor expenditures would increase to $1.5 billion and the total number of tourist sector jobs would rise to nearly 41,000 full time equivalents over the same time horizon. Estimated tourist related employment in the Basin would be more than two times current employment levels, reflecting an average annual growth rate of 2.4 percent.
Exhibit 8. Number of Visitor Days, Visitor Expenditures and Jobs Supported by Tourism in the Snake/Salt River Basin, 2032 - Low Scenario
| Number of Visitor Days (Thousands) | Total Visitor Expenditures (Millions) | Total Supporting Jobs | |
| Seasonal Residents | 2,366 | $272 | 7,235 |
| Summer | 1,460 | $163 | 4,326 |
| Winter | 227 | $27 | 720 |
| Other | 679 | $82 | 2,189 |
| Destination Tourist | 5,133 | $506 | 13,460 |
| Summer | 3,169 | $290 | 7,706 |
| Winter | 493 | $53 | 1,407 |
| Other | 1,471 | $164 | 4,348 |
| Grand Teton Tourist | 7,499 | $778 | 20,695 |
| Summer | 4,629 | $452 | 12,031 |
| Winter | 720 | $80 | 2,127 |
| Other | 2,150 | $246 | 6,537 |
Source: Current levels based on Morey and Associates, 1999, 2000; Runyan and Associates, 2001; and Prior and Associates, 2001. Projections made by BBC based on historical recreational and housing trends in the Basin.
As depicted in Exhibit 8, under this scenario, the total number of visitor days for destination tourists and seasonal residents in the Basin would increase to roughly 7.5 million by 2032. Total annual visitor expenditures would increase to $778 million and the total number of tourist related jobs in the Basin would rise to roughly 20,700 full time equivalents over the same time horizon. Estimated tourist related employment in the Basin would rise by only 5 percent, reflecting an average annual growth rate of less than 1 percent.
Exhibit 9. Number of Visitor Days, Visitor Expenditures and Jobs Supported by Tourism in the Snake/Salt River Basin, 2032 - Mid Scenario
| Number of Visitor Days (Thousands) | Total Visitor Expenditures (Millions) | Total Supporting Jobs | |
| Seasonal Residents | 3,083 | $355 | 9,441 |
| Summer | 1,850 | $206 | 5,479 |
| Winter | 312 | $37 | 990 |
| Other | 922 | $112 | 2,972 |
| Destination Tourist | 7,224 | $717 | 19,069 |
| Summer | 4,208 | $385 | 10,233 |
| Winter | 770 | $83 | 2,199 |
| Other | 2,246 | $250 | 6,638 |
| Grand Teton Tourist | 10,307 | $1,072 | 28,510 |
| Summer | 6,058 | $591 | 15,712 |
| Winter | 1,082 | $120 | 3,189 |
| Other | 3,168 | $361 | 9,610 |
Source: Current levels based on Morey and Associates, 1999, 2000; Runyan and Associates, 2001; and Prior and Associates, 2001. Projections made by BBC based on historical recreational and housing trends in the Basin.
Exhibit 9 demonstrates that, under the Mid Scenario, the total number of visitor days for destination tourists and seasonal residents in the Basin would increase to roughly 10.3 million by 2032. Total annual visitor expenditures would increase to $1.1 billion and the total number of tourist related jobs in the Basin would rise to roughly 28,500 full time equivalents over the projection period. Estimated tourist related employment in the Basin would rise by 47 percent, reflecting an average annual growth rate of 1.2 percent.
Exhibit 10. Projected Direct Tourism/Recreation Related Jobs for the Snake/Salt River Basin, 2032
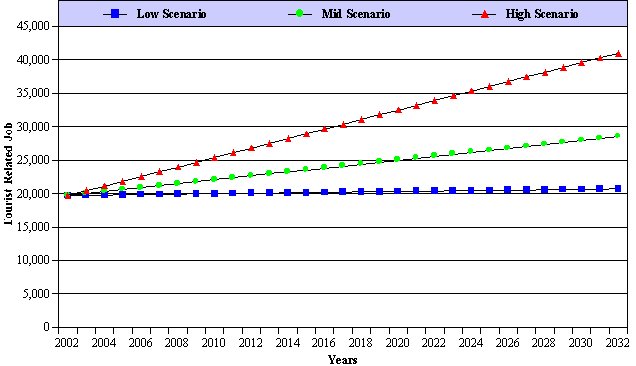
Source: Current levels based on Morey and Associates, 1999, 2000; Runyan and Associates, 2001; and Prior and Associates, 2001. Projections made by BBC based on historical recreational and housing trends in the Basin.
The overall employment projections for the tourism sector described above were distributed across major industrial sectors using monthly Teton County employment data from the Wyoming Department Employment. The seasonal distribution of employment, by sector, is depicted in Exhibit 11.
Exhibit 11. Seasonal Distribution of Jobs by Sector, Teton County
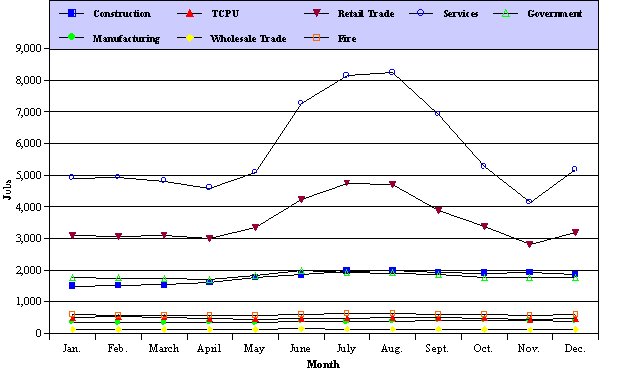
Source: Wyoming Department of Employment
Tourist related jobs were identified as incremental jobs that exist during the peak and shoulder tourism seasons from May through October. Approximately 60 percent of these incremental jobs are within the services sector, 30 percent within the retail trade sector and the remaining 10 percent are distributed between the construction, real estate and government sectors.
Overall Economic and Demographic Projections
The preceding evaluations and assumptions were incorporated into a model of Snake/Salt River Basin employment and population in order to develop aggregate estimates of total residents and total jobs in 2032 under each of the three planning scenarios. As previously noted, an inverse relationship exists within the Basin between the two key water use sectors (agriculture and tourism) that is well documented (Prior and Associates, 2001; Department of the Interior, 2001). Specifically, growth in the number of visitors implies increased demand for visitor lodging and seasonal residences, which in turn drives up land values and reduces the economic viability of conventional agricultural operations. This implies decreases both in the number of irrigated agricultural acres and commercial livestock production occurring simultaneously with increases in the number of pleasure horses. In fact, such substitution has already been observed in Teton County (Resor). This inverse relationship implies the unconventional result that future levels of economic development within the Basin may be inversely proportional to future water use levels.
To simplify the analysis, the study team chose to develop projection scenarios using the more conventional (though somewhat artificial in this case) assumption that economic development for the basic sectors within the Basin is positively correlated. The primary result of this assumption is that the High and Low Scenarios represent more extreme estimates of growth (or contraction) than may actually occur. While "true" High and Low scenarios are likely to be closer to the Mid Scenario, the more extreme projections presented here are useful in that they are simpler in concept while providing clear upper and lower bounds for future water use planning purposes. Given this important caveat, the following text describes the development of overall economic and demographic projections for the Snake/Salt River Basin in 2032 under the High, Low and Mid Scenarios.
Projected Total Employment in 2032
To fully characterize the economic impact of the growth in employment under each scenario, projected employment changes for the agricultural and tourism sectors were run through an IMPLAN model for the Basin. This allowed the study team to estimate the total number of secondary jobs associated with the projected growth in these sectors within the Basin. Results from this analysis indicate that an additional 9,750 secondary jobs would be generated under the High Scenario, 430 secondary jobs under the Low Scenario and 4,020 secondary jobs under the Mid Scenario.
Projected growth in direct and secondary employment for each scenario appears below in Exhibit 12. Under the assumptions regarding changes in key economic activities described above, the study team projects that Snake/Salt River Basin employment under the High Scenario will more than double, from about 28,200 jobs at present to roughly 76,900 jobs by 2032. This increase would be completely driven by growth in tourism related employment in the Basin, as the number of agricultural jobs would remain essentially constant. Under the Low Scenario, Basin wide employment is projected to remain near current levels, increasing by only about 1,800 jobs over the 30-year projections period. Under the Mid Scenario, aggregate employment is projected to increase by roughly 19,600 jobs over the course of the projection period.
Currently, the multiplier, or ratio of total employment to direct basic employment is estimated to be approximately 1.4, indicating that each basic job supports approximately 0.4 additional jobs in local services. Higher multipliers imply relatively larger levels of supporting, indirect basic/local service employment that are characteristic of more thriving, vibrant economies. Accordingly, the study team used increasingly higher multipliers for the Mid and High Scenarios, while leaving the multiplier at the current level under the Low Scenario. Since the actual growth in total employment and corresponding population levels will be subject to the buildout capacity of the area (something that is difficult to project 30 years into the future), the study team employed conservative increases for the multipliers under these scenarios.
Exhibit 12. Current and Projected Employment Breakdown in Snake/Salt River Basin
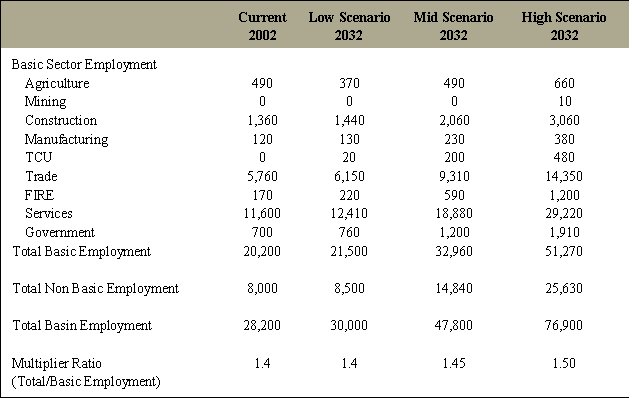
Source: BBC estimate.
Projected Total Population in 2030
For the high, low, and mid scenarios, projections of total Snake/Salt River Basin population were derived from the preceding employment projections. Deriving the population estimates from the projected employment totals for the Basin required five steps:
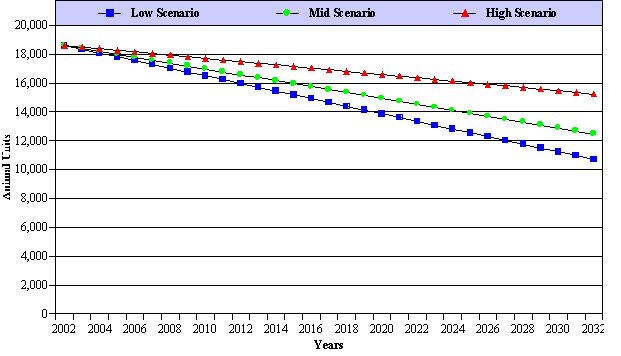
The results of these calculations are shown in Exhibit 13 below. Under the High Scenario, the Basin's population is projected to more than double, reaching just over 75,000 residents. Under the Low Scenario, population within the Basin is projected to experience very little growth over the next 30 years, reaching just over 29,000 residents. Under the Mid Scenario, population within the Basin would experience substantial growth over the next 30 years, gaining more than 20,000 additional people to reach a total of almost 47,000 residents.
Exhibit 13. Employment and Population Projections for Snake/Salt Rive Basin (Numbers Reflect Only Portions of Counties Within Basin)
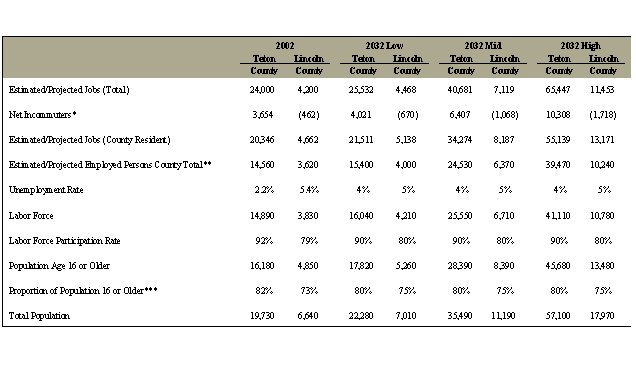
* Net incommuting assumes 17 percent of Teton County employees come from Teton County Idaho and 2 percent of Teton County residents and 4 percent of Lincoln County residents work in Idaho (Prior and Associates, 2001).
** Number of employed persons is less than number of jobs due to multiple jobholding by individuals. Multiple job factors calculated by dividing State 1998 employment totals by BEA 1998 employment totals.
*** Proportion derived from Census 2000 data
Source: BBC estimate.
Exhibit 14, below, provides a graphic depiction of the three alternative population projections for the Snake/Salt River Basin.
Exhibit 14. Alternative Population Projections for Snake/Salt River Basin
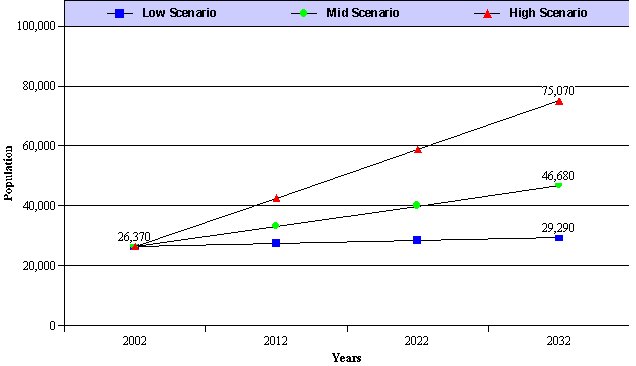
Source: BBC estimate.
Summary
The study team projected three future scenarios for economic and demographic growth in the Snake/Salt River Basin, through the year 2032. All three scenarios employed an economic base modeling approach, in which prospects for the key sectors that either bring money into the region and/or are the source of substantial water use were analyzed in detail. Based upon these analyses, high, low, and middle case alternative forecasts were developed for each key sector. The growth in total employment, and the corresponding population base, was then estimated based upon the key sector projections. Due to the well documented inverse relationship for future development between the agriculture and tourism sectors, the high and low projections presented in the memo are likely more extreme but represent useful bounds for future water planners. It is the study team's judgment that the Mid Scenario is the most realistic and is the most likely scenario to occur.
The three scenarios presented in the memo portray markedly different potential futures for the region. Under the High Scenario, both the number of irrigated acres and commercial livestock within the Basin would increase modestly. In contrast, tourism related activity, expenditure and supporting employment would more than double. Under the Low Scenario, both livestock numbers and irrigated acreage would decline sharply due to continued pressure for residential development and changes in public land management policies. The tourism/visitation sector, under this scenario, would remain essentially at current levels. The Mid Scenario projects livestock animal units within the Basin to decline by roughly 33 percent, and the number of irrigated acres to decline by roughly 13 percent. Tourism activity, expenditures and employment under this scenario are expected to increase by nearly 40 percent.
Projected Snake/Salt River Basin population in 2032 under the High Scenario would reach just over 75,000 residents, compared with almost 47,000 residents under the Mid Scenario and just over 29,000 residents under the Low Scenario, which is similar to year 2002 Basin population.
References
Interview with Bill Collins, Teton County Planning Director, October 2001.
Interview with Levi Broyles, Vegetation Management Program Facilitator, Bridger-Teton National Forest, June 2002.
Interview with Walt Grows, Rangeland Management Specialist, Caribou-Targhee National Forrest, June 2002.
Interview with Jody Kennington, Lincoln County Executive Director, Farm Service Agency, USDA, June 2002.
Interview with Doug Powell, Natural Resource Specialist, Pinedale Field Office, Bureau of Land Management, June 2002.
Interview with Michelle Easeley, Natural Resource Specialist, Kemmerer Field Office, Bureau of Land Management, June 2002.
Interview with Alan Gray, Forage Agronomist, Director of Powell Research and Extension Center, University of Wyoming, July 2002.
Interview with Gurn Brown, retired Agricultural Extension Specialist, Lincoln County, July 2002.
Interview with Bill Resor, Owner, Snake River Ranches, BAG Member, July 2002.
Interview with Jim Maher, Teton County Brand Inspector, July 2002.
Interview with Chad Madson, Owner, Yellowstone Horses, October 2002.
Interview with Alan Rosenbaum, Manager, Pinto Ranch, October 2002.
Interview with Jim Sullivan, General Manager, Snow King Ski Area, August 2002.
Interview with Larry Williamson, General Manager, Grand Targhee Ski Area, August 2002.
Interview with Jerry Blann, General Manager, Jackson Hole Mountain Resort, August 2002.
Interview with Bob O'Neil, Director of Guest Activities, Grand Teton Lodge Company, August 2002.
Interview with John King, General Manager, Signal Mountain Lodge, August 2002.
Interview with John Turner, Owner, Triangle X Ranch, August 2002.
Interview with Dick Barker, Owner, Barker Ewing Float Trips, August 2002.
Interview with Susan Marsh, Recreation Staff Officer, Bridger-Teton National Forest, August 2002.
Interview with Wendy Koelfgen, Clerk, Chief Rangers Office, GTNP, August 2002.
Interview with Kim McMahill, Concession's Specialist, Concessionaires Office, GTNP, August 2002.
Interview with Marty Myer, River Ranger, GTNP, August 2002.
Interview with Chris Wolf, Assistant Professor, Department of Agricultural Economics, Michigan State University, August 2002.
Economic Research Service, United States Department of Agriculture, Livestock Baseline Projections, February 2002. http://www.ers.usda.gov/briefing/baseline/.Economic Research Service, United States Department of Agriculture, Monthly data on "disappearance" of crushed soybean products for domestic consumption, 2002. Data published online at: http://www.ers.usda.gov/briefing/soybeansoilcrops/Data/table1.xls.
Grand Teton National Park, Concessionaire’s Office, unpublished data, 2002.
Grand Teton National Park, Visitor Use Statistics, published on the web at URL: http://www2.nature.nps.gov/stats/.
National Agricultural Statistics Service, Published Online Estimates Database, http://www.usda.gov/nass/ [new link 10/2009 HERE].
Nelson Engineering, unpublished data, 2002.
Pochop, Larry, Travis Teegarden, Greg Kerr, Ronald Delaney, and Victor Hasfurther, Consumptive Use and Consumptive Irrigation Requirements in Wyoming, University of Wyoming Cooperative Extension Service and Wyoming Water Research Center, WWRC Publication #92-06, 1992.
Sunrise Engineering, unpublished data, 2002.
U.S. Department of Agriculture, Census of Agriculture, 1997. http://www.nass.usda.gov/census/.
U.S. Department of Commerce, Bureau of Census, 2000 Census of Population and Housing. http://factfinder.census.gov/home/saff/main.html?_lang=en.
U.S. Department of Commerce, Bureau of Economic Analysis, Regional Economic Information System, 2001. http://www.bea.doc.gov/bea/regional/reis/ [new link 10/2009 HERE]
U.S. Department of Commerce, Bureau of Economic Analysis, Employment by Industry for Lincoln and Teton Counties, 2000. Published online at http://eadiv.state.wy.us/i&e/i&e.asp.
U.S. Geologic Survey, Estimated Water Use at Dairy Farms in Gooding, Jerome and Twin alls Counties, Idaho, 1990-93. Factsheet from National Water Quality Assessment Program, published online at http://wwwidaho.wr.usgs.gov/nawqa/factsheet/MAUPIN.111.html.
Venn, Brian, Hydraulic Impacts Due to Conversion from Flood to Sprinkler Irrigation Practices, unpublished Masters Thesis, University of Wyoming, 2002.
Wyoming Agricultural Statistics, 2001, Wyoming Agricultural Statistics Service. http://www.nass.usda.gov/wy/ [new link 10/2009 HERE].
Wyoming Department of Administration and Information, Division of Economic Analysis, Profiles of General Housing Characteristics by County and Place, published online at http://eadiv.state.wy.us/housing/HU_2000.htm.
Wyoming Department of Health, Vital Statistics, various years. http://wdhfs.state.wy.us/vital_records/99DATA/menu.pdf [new link 10/2009 HERE].
Personal Interviews/Written Communications Completed in Year 2002
Barker, Dick, Barker Ewing Float Trips, August 2002.
Blann, Jerry, Jackson Hole Mountain Resort.
Brown, Gurn, retired Agricultural Extension Specialist.
Broyles, Levi, Bridger-Teton National Forest.
Collins, Bill, Teton County Planning Department.
Dana, Frank, Starr Valley Cheese Factory.
Erickson, Ryan, Sunrise Engineering.
Gray, Alan, University of Wyoming.
Grows, Walt, Caribou Targhee National Forest.
Easeley, Michelle, Bureau of Land Management.
Kennington, Jody, Lincoln County Farm Service Agency.
King, John, Signal Mountain Lodge.
Koelfgen, Wendy, Grand Teton National Park.
Madson, Chad, Yellowstone Horses.
Maher, Jim, Teton County.
Marsh, Susan, Bridger-Teton National Forest.
McMahill, Kim, Grand Teton National Park.
Myer, Marty, Grand Teton National Park.
Norton, Bob, Nelson Engineering.
O'Neil, Bob, Grand Teton Lodge Company.
Powell, Doug, Bureau of Land Management.
Resor, Bill, Snake River Ranches.
Rosenbaum, Alan, Pinto Ranch.
Sullivan, Jim, Snow King Ski Area.
Turner, John, Triangle X Ranch.
Williamson, Larry, Grand Targhee Ski Area.
Wolf, Chris, Michigan State University.
Published Data Sources
Bureau of Economic Analysis, Full and Part-Time Employment by Industry, Teton County, Wyoming. Published on the web page for the Division of Economic Analysis at the Wyoming Department of Information and Administration at URL: http://eadiv.state.wy.us/i&e/i&e.asp.
Grazing Use and Open Space Study, Grand Teton National Park and Teton County Wyoming, Review Draft of Report submitted to Congress by United States Department of the Interior, National Park Service, Grand Teton National Park, February 2001.
Housing Needs Assessment, Teton County Wyoming, prepared for Teton County Housing Authority by Prior and Associates, August, 2001.
Land and Resource Management Plan, Bridger-Teton National Forest United States Forest Service.
Lincoln and Teton County IMPLAN coefficients.
Report on the Economic Impact of the Travel Industry in Wyoming, 1999, 2000 Morey and Associates/ Department of Economics, University of Wyoming
Revised Forest Plan, Caribou-Targhee National Forest, Intermountain Region R-4, United States Forest Service, April 1997.
The Economic Impact of Travel on Wyoming, 1997-2001 State Estimates, Prepared for the State Office of Travel and Tourism, Dean Runyan Associates, December 2001.
Teton County Wyoming, Affordable Housing Support Study, Draft, May 2002.
Wyoming Department of Employment , Wyoming Covered Employment, Total Payroll, Annual and Weekly Wages by Region and County 1997 and 1998, Published on the web at URL: http://wydoe.state.wy.us/.
Wyoming Department of Employment, Employing Units, Employment, Total Wages, Average Weekly Wage & Annual Wages for Teton County by Division 1998, Published on the web at URL: http://wydoe.state.wy.us/.