Wyoming State Water Plan
Wyoming State Water Plan
Wyoming Water Development Office
6920 Yellowtail Rd
Cheyenne, WY 82002
Phone: 307-777-7626

Wyoming Water Development Office
6920 Yellowtail Rd
Cheyenne, WY 82002
Phone: 307-777-7626


IV. DEMAND PROJECTIONS
A. HISTORIC & CURRENT ECONOMIC AND DEMOGRAPHIC CONDITIONS
Demographic Overview
At present, nearly 26,000 people reside in just over 10,000 households within the Wyoming portions of the Snake and Salt River basins. Roughly 44 percent of the population of the basin lives within the boundaries of the City of Jackson or the Towns of Afton, Alpine and Thayne, the four principal population centers within the basin. These municipalities also account for 45 percent of basin households.
The City of Jackson comprises 52 percent of the total population and 34 percent of the total households within Teton County, while the three towns in northern Lincoln County constitute 39 percent of the total population and 30 percent of total households in Lincoln County. The remainder of the basin's population lives within unincorporated areas of Lincoln, Sublette and Teton counties. A breakdown of the current population of the basin is provided in Table IV-1.
Table IV-1. Estimated 2000 Population, Households and Related Political
Jurisdictions in the Basin
| ||||||||||||||||||||||||||||||||||||||||||||||||||||||||||||||||||
Source: Wyoming Department of Administration and Information, Division of Economic Analysis. Profile of General Housing Characteristics by County and Place, 2000. Census Tracts from 2000 Census of Population and Housing, Census 2000, Bureau of the Census.
Historic Population Growth
Changes in census tract definitions from decade to decade and the imprecise relationship of census-defined geography to the watershed make it difficult, if not impossible, to precisely quantify historic population totals for the unincorporated portions of the basin. However, population changes in the four principal communities that comprise a good portion of the basin's population can be readily tracked over time from the decennial censuses.
Since 1950, the combined population of Alpine, Afton and Jackson has increased at an average annual rate of about 3 percent. This long-term average, however, masks considerable fluctuation during this 50-year period. As shown in Figure IV-1, the population of the three communities remained almost constant during the 1950's and 1960's before growing rapidly in the 1970's. While the 1980's were characterized by slow but steady growth, population during the 1990's increased dramatically, with the combined population of Alpine, Afton and Jackson increasing at an average annual rate of 6 percent over the past ten years. In general, the rates of population growth in these communities closely correspond to the rates of population growth for Lincoln and Teton Counties as a whole over the past five decades.
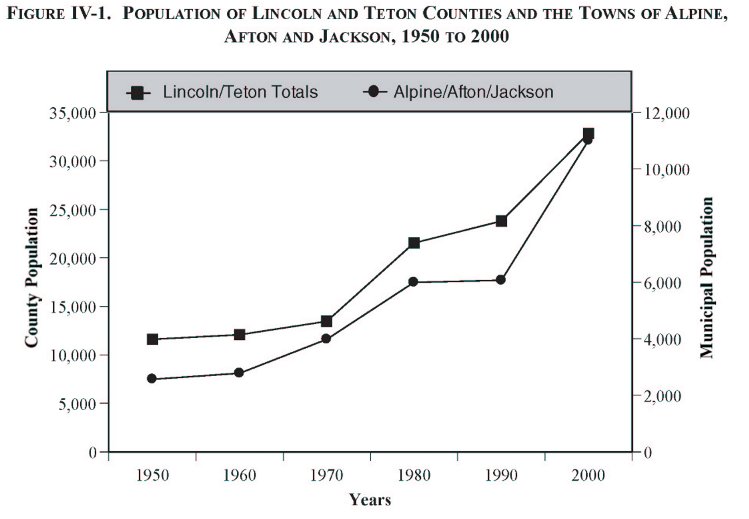
Source: Wyoming Department of Administration and Information, Economic Analysis Division.
Economic Overview
Based upon the extrapolation of 2000 data from the Bureau of Economic Analysis Regional Economic Information Systems (BEA-REIS) to the year 2002, the study team estimates that there are currently over 28,200 full and part-time jobs located in Lincoln and Teton Counties. The study team estimates that approximately 4,200 of these jobs are located within the basin portion of Lincoln County and about 24,000 jobs are located in Teton County.
Historic Employment Growth
Figure IV-2 depicts historical employment growth for Lincoln and Teton Counties (graphed against the left axis) and the State of Wyoming (graphed against the right axis) from 1970 through 2000. Over the past three decades, Teton County employment has grown at a rapid and increasing rate. Especially during the decade of the 1990’s, employment growth has outpaced the rate of growth for the State of Wyoming as a whole. This rapid growth refelcts the continued development of the tourism industry in Teton County. In general, Lincoln County employment growth during the past three decades has been much slower than either Teton County or the State of Wyoming as a whole. An exception was the brief period of power plant construction during the mid-1980’s; growth in county employment fell back shortly thereafter to rates comparable to the pre-construction period.
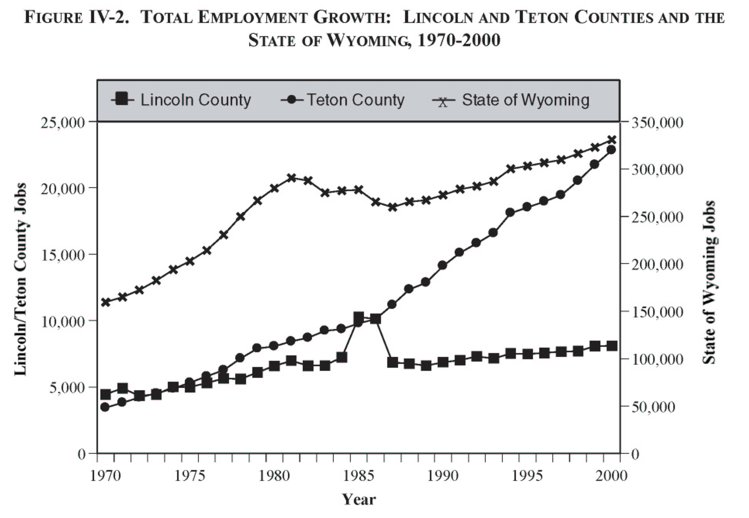
Source: Department of Commerce, Bureau of Economic Analysis, Regional Economic Information Systems, 2000.
Key Economic and Water Use Sectors
Current conditions in two key sectors in the basin are described in the following section. Agriculture, while no longer one of the largest sources of employment or income in the basin, still accounts for the largest amount of water use. Tourism and visitor related activities are a large and increasingly important component of the local economic base. Prospects for these sectors, and specific scenarios incorporating varying assumptions about each sector, provide the cornerstone to the economic, demographic and water demand projections for the basin.
Agriculture
In order to understand current agricultural activity in the basin and the factors affecting local agriculture in the future, relevant personnel from a variety of federal and state land management and agricultural agencies were interviewed. Representatives of several livestock operations currently operating within the basin were also interviewed. Current and historic livestock and hay production data for the basin counties published by Wyoming Agricultural Statistics Service was gathered and analyzed. In addition, information on current and historic stocking levels for livestock grazing allotments within the basin from the United States Forest Service (USFS), the Bureau of Land Management (BLM) and the National Park Service (NPS) was obtained. The following is an abbreviated summary of current agricultural conditions in the basin.
• Livestock. Livestock production (cattle and sheep) is the primary money-making, agricultural enterprise in the basin. Ranchers typically have permits tied to their operation that allow them to graze their livestock on a particular allotment of public (primarily Forest Service) land throughout the basin during the summer months. Cattle are grazed on public lands from roughly early June to mid-October, while sheep are grazed from early July through mid-September. The largest share of these allotments are Forest Service lands, divided between the Bridger-Teton National Forest (BTNF) and the Caribou Targhee National Forest (CTNF). BLM allotments are relatively small, and occur almost exclusively in the Salt River portion of the basin. In Teton County there are several large ranches where cattle are grazed exclusively on private lands.
In addition, horses used for pleasure riding on either small private ranchettes or in commercial riding operations are becoming more abundant in Teton County. Although it is difficult to estimate exact numbers, a conservative estimate of 1,000 such horses in Teton County is reasonable. According to the local brand inspector, there are at least 10-12 operations in Teton County with over 100 head, and roughly 1,000 Teton County horses have received lifetime brand inspections.
The horse population within the basin is highly seasonal. During the summer months, two large horse operations (one in northern Lincoln County) lease roughly 1,400 horses to Teton County dude ranches and outfitters. During the rest of the year, these horses return to their home pastures, and may be leased to hunters during the fall hunting season.
Table IV-2 presents estimates of existing stocking levels on public and private lands within the basin. The majority of cattle (76 percent) and sheep (97 percent) are grazed on land that is administered by the USFS. While the USFS authorizes a much larger number of sheep than cattle (all in Lincoln County), BLM and NPS allotments are exclusively devoted to cattle. Note that the cattle and sheep totals on private land in Teton County are estimated using anecdotal evidence from interviews, calibrated to Wyoming Agricultural Statistical Service (WASS) totals. Estimating similar totals for Lincoln County was problematic since only the northern portion of the county lies within the basin. Local agricultural officials, however, confirmed that county public land authorizations provided reasonable livestock estimates. Horse totals on private lands in both Lincoln and Teton Counties represent year round averages based on estimated seasonal totals. No corresponding information was available for Sublette County portions of the basin.
Table IV-2. Current Estimated Livestock Levels within the Snake/Salt River Basin
| |||||||||||||||||||||||||||||||||||||||||||||||||||||||||||||||||||
Sources: Kemmerer and Pinedale Offices, Bureau of Land Management, 2001 livestock data; Bridger-Teton and Caribou Targhee Forests, United States Forest Service, 2001 livestock data; and Park Service Grazing Use Report and personal interviews.
• Crops. Crop production in the basin consists mainly of hay (both irrigated meadow and alfalfa) used for supplemental livestock feed. The vast majority of hay grown within the basin is consumed by basin livestock (either own-farm or sold to neighbors) as supplemental feed during the winter months. There is some alfalfa and grain grown along the Salt River, but especially in Teton County, the majority of hay acreage is irrigated meadow. Roughly 85 percent of hay fields in each county have been irrigated historically, with the percentage being a bit higher in Teton County. Irrigated production in the basin occurs along the Salt and Snake Rivers, with significant supplemental acreage along the Hoback and Teton Rivers in Teton County. Irrigated acreage levels have been stable through time, and sources have confirmed that almost all irrigable land in the basin is in fact irrigated during years with normal precipitation levels.
Table IV-3 presents irrigated acreage estimates, by crop, for rivers within the basin and demonstrates the significant difference in crop types between the Lincoln and Teton County portions of the basin. The largest acreage along the Salt River in Lincoln County is planted to alfalfa and grains, with roughly 56 percent in alfalfa. In contrast, all the acreage along the Snake and Hoback Rivers in Teton County is irrigated pasture and mountain meadow hay. The land along the Teton River near Alta is somewhat of an exception, with roughly 40 percent of acreage planted to alfalfa and 30 percent apiece planted to irrigated pasture and small grains.
Table IV-3. 2002 Estimates of Irrigated Acreage within the Snake/Salt
River Basins
|
• Dairy. A small but entrenched dairy industry exists in the Star Valley portion of Lincoln County near Afton. The industry consists of roughly three to five larger operations (150 head) and roughly thirty smaller operations (50 head). The majority of production from these operations supplies the Star Valley Cheese Company, although some is sold outside the basin. Most operations grow their own hay for supplemental feed, and transport it directly to the confined dairy cows. While production has remained relatively constant over the past thirty years, the number of operators has declined dramatically from roughly 300 in 1970 to current levels.
• Employment. The number of ranches in the basin counties, reflected by farm proprietor employment levels, has remained around 600 over the last 30 years. The total number of farm jobs in these counties, despite a short term increase during the early 1980's has gradually declined over this time period, from about 1,050 to its current level near 850, reflecting a slight increase in labor productivity, probably due to technological innovation. Current agricultural related employment specifically within the basin is estimated to be the sum of Teton County agricultural employment and one-half of Lincoln county agricultural employment, or roughly 400 farm proprietor jobs and 500 total farm jobs within the basin.
Tourism and Visitor Related Activity
The tourist economy within the basin is vibrant and growing, with over 2.5 million visitors per year. Peak tourist season is still the summer, but winter use is noticeably on the rise, and the shoulder seasons are getting shorter and shorter. In order to gain local insight into tourism and visitor related activity in the basin, interviews were conducted with representatives of the Teton County Planning Department, planners for Grand Teton National Park, Recreation Specialists for the Bridger-Teton National Forest, and a variety of recreation service providers in the area. Extensive secondary data on recreational activities and associated visitor days were collected from both the USFS and the NPS.
The following is a brief summary of current tourism and visitor related activity in the basin.
• Visitor Types. The basin, and Teton County in particular, has historically served as a popular destination for tourists and outdoor recreation enthusiasts alike. The basin includes Grand Teton National Park (GTNP) and serves as the primary access point for Yellowstone National Park (YNP), two of the most heavily visited parks nationwide. Extensive recreation opportunities are available, not only within park boundaries, but also on the surrounding lands of BTNF and CTNF. In the winter, the area boasts of world-class alpine skiing opportunities at Jackson Hole, Grand Targhee and Snow King resorts as well as a host of other recreational opportunities. The primary locale for visitor lodging and other services in the basin is the City of Jackson. Jackson is the largest population center within the basin, and lies directly on Highway 191 north, which many visitors take to get to the two national parks.
Besides destination tourists, a second important component of visitation to the area comes from seasonal residents with second homes in the basin. The last decade saw an increase of roughly 3,200 housing units in Teton County, including nearly 700 new seasonal homes. This change represented an increase of 45 percent in both total and seasonal housing units within Teton County. As housing values in Teton County climb, northern Lincoln County is also seeing a marked increase in residential growth, especially for second homes. Over the past decade, roughly 550 new housing units, including 100 seasonal housing units, were developed in northern Lincoln County. These additional units represented an increase of 29 percent and 48 percent respectively over the existing housing base.
• Recreation Activities. In addition to park visitation in the summer and alpine skiing in the winter, the basin offers extensive, year around recreational opportunities, both within the boundaries of GTNP and on the surrounding lands of BTNF and CTNF. Participation is obviously seasonal, and although the summer months still constitute the peak tourist season, participation in winter recreational activities such as snowmobiling and backcountry skiing continues to grow in BTNF.
Table IV-4 presents a monthly summary of recreational visitation days by activity, with private outfitters and concessionaires associated with GTNP. While these numbers likely represent only a small portion of recreational activity within the basin, they provide some insight into the relative popularity of activities and the distribution of participation over the summer months. The summer season extends from May through October, with the peak participation months being July and August. The most popular activities include rafting on the Snake River, ferry rides on Jackson Lake, and guided horseback rides through the surrounding countryside. Peak rafting season is in July and August, while peak fishing season occurs during August and September, when the river water clears and fish are more visible. From May through September, roughly 75 percent of the participation comes from water-based activities. In contrast, during October, nearly 90 percent of participation is in land-based activities.
Table IV-4. Summer Recreational Visitor Days, by Activity, Private Outfitters and
GTNP Concessionaires, 2001
|
Source: Grand Teton National Park, Concessionaire's Office, 2002.
• Expenditures and Employment. Daily tourist/visitor expenditure patterns were used to estimate current spending levels in the basin for both destination tourists and seasonal residents. Estimates based on this information represent a current annual total of $507 million in destination tourist expenditures and $234 million in expenditures by seasonal residents. Total expenditures in the tourist/visitor sector are estimated to support nearly 20,000 local jobs (See Table IV-5 below). These include multiple jobs per individual and are by place of work, reflecting commuters from Lincoln County and Teton County, Idaho driving in the area.
Table IV-5. Number of Visitor Days, Visitor Expenditures and Jobs Supported by
Tourism Snake/Salt River Basins, 2000/2001
| |||||||||||||||||||||||||||||||||||||||||||||||||||||||||||||||||||||||||||||||||||||||||||
Sources: Morey and Associates, 1999, 2000. Prior and Associates, 2001.
Summary
At present, there are approximately 26,000 residents living in the Wyoming portions of the basin. The population of basin counties grew rapidly during the 1970's, slowed considerably during the 1980s and has resumed comparatively rapid growth during the 1990s. About 28,000 jobs are located within the basin, many of which are part-time. Employment is highly seasonal, especially in Teton County. Most jobs in the basin are held by residents in the northern Lincoln and Teton Counties, although some jobs in the basin are filled by residents of nearby Teton County Idaho. The most important sector of the basin's economic base is tourism and visitor related activity. Agriculture is not as large a factor in the local economy as it was in the past and continues to steadily decline, but remains an important sector from the standpoint of basin water use.
B. FUTURE ECONOMIC AND DEMOGRAPHIC SCENARIOS
Approach
There are numerous approaches to developing economic and demographic projections for a regional economy, ranging from simple statistical extrapolation to sophisticated econometric modeling. The projection approaches vary in terms of complexity, the amount of information they convey, and the amount of data they require. The following paragraphs provide a description of existing economic and demographic projections for the Snake/Salt River basin area and the study team's assessment of the appropriateness of those projections for the purposes of this study. This section concludes with an overview of the forecasting approach adopted by the study team, and reviewed by the Wyoming Water Development Commission, and an overview of the three planning scenarios that drive the subsequent projections.
Economic Base Methodology
The economic and demographic projection approach adopted by the study team for this effort employs an established technique in regional economics known as "economic base analysis." The economic base approach is a "bottom-up" method that has the advantages of focusing directly on specific activities that are likely to drive economic and demographic changes in the future and providing a substantial level of detail about those activities in the future, while at the same time being less data intensive than econometric modeling approaches. Essentially, this approach involves the following five steps:
Overview of Planning Scenarios
The study team developed three alternative planning scenarios for this study, employing the economic base forecasting approach just described. An overview of each of these scenarios is provided below. More specific details about the assumptions for the key sectors of agriculture and tourism and the potential interactions between these sectors in the economic base projection scenarios are provided following this overview.
High Scenario. In the simplest terms, the High Scenario incorporates the study team's views of the most growth in each of the key sectors that could potentially occur over the forecast horizon. It is remotely possible that one or more of the key sectors could grow even more than we have assumed under this case or an unforeseen, new basic economic activity could become established and flourish in the region. It is also likely that due to the interrelationships between these sectors, the growth in aggregate employment and population that drives future water demand will be somewhat moderated. However, the study team felt that the underlying aggressive assumption that each of the key sectors will achieve its highest reasonably likely growth at the same time makes this scenario a useful upper bound for subsequent water planning purposes.

Low Scenario. The Low Scenario embodies the study team's views of the lowest simultaneous growth (or largest contraction) reasonably likely to occur in each of the key sectors over the planning horizon. While even lower economic activity levels in one or more sectors are not impossible, the inverse interrelationship between the agriculture and tourism sectors likely implies that the actual growth that occurs over the planning horizon may be somewhat higher than this projection. Again, the study team felt that the assumption of simultaneous low activity levels in each of the key sectors, though somewhat artificial, made this scenario a supportable lower bound for planning purposes. While the Low Scenario obviously will not impose pressure on regional water resources, this scenario is sometimes used for purposes of determining the financial risk involved with potential water resource enhancements.
Mid Scenario. The Mid Scenario represents the study team's views of the most realistic level of growth likely to occur in each of the key sectors over the planning horizon. As in the other two scenarios, the potential interaction between the agricultural and tourism sectors are acknowledged. Although the actual economic growth experienced in the basin may vary somewhat from this projection because of this interaction, the assumed activity levels represent, in the study team's best judgment, the rate of growth most likely to be experienced in the basin. As such, this scenario is perhaps the most useful for water planning purposes.
Economic Base Scenario Assumptions for Key Sectors - Agriculture
Local interviews and research into both historic agricultural practices and competing environmental and recreational interests provide insight into potential factors that may influence the future of agriculture in the Snake/Salt River basin. The factor that will most likely have the largest potential impact on basin agriculture is the continued demand for seasonal and second home development. Other potential factors that may significantly impact agriculture within the basin include changes in public land grazing policies such as the listing of various cutthroat trout species or the expansion of grizzly bear recovery area on USFS land. The following are summary observations about prospects for Snake/Salt River basin agriculture in the future.
Source: Current livestock authorization levels from interviews with Kemmerer and Pinedale offices, Bureau of Land Management, Bridger-Teton and Caribou-Targhee National Forest personnel and Department of the Interior, 2001. Basin level projections based on historical trends and interviews with local agricultural operators (Resor, Maher).
Economic Base Scenario Assumptions for Key Sectors - Tourism
The tourism/recreational sector is the cornerstone of the economy within the Snake/Salt River basin, especially within Teton County. The two primary components of the sector are destination tourists and seasonal residents. Destination tourists are those who plan a trip specifically to visit Grand Teton National Park or some other attraction within the basin. Seasonal residents are those who visit the area for an extended period of time because they have a second home in the area. Visitation within the basin is highly seasonal, with the peak months generally being June through August for summer activities and January through March for winter activities. The following are summary insights into the current recreational trends and the prospects for tourism and visitor related activities in the future, as well as a description of the underlying assumptions for the high, low and mid scenario projections.
Table IV-6. Number of Visitor Days, Visitor Expenditures and Jobs Supported by
Tourism in the Snake/Salt River Basin, 2032 - High Scenario
| |||||||||||||||||||||||||||||||||||||||||||||||||||||||||||||||||||||||||||||||||||||||||||
Source: Current levels based on Morey and Associates, 1999, 2000; Runyan and Associates, 2001; and Prior and Associates, 2001. Projections based on historical recreational and housing trends in the Basin.
Table IV-7. Number of Visitor Days, Visitor Expenditures and Jobs Supported by
Tourism in the Snake/Salt River Basin, 2032 - Low Scenario
| |||||||||||||||||||||||||||||||||||||||||||||||||||||||||||||||||||||||||||||||||||||||||||
Source: Current levels based on Morey and Associates, 1999, 2000; Runyan and Associates, 2001; and Prior and Associates, 2001. Projections based on historical recreational and housing trends in the basin.
Table IV-8. Number of Visitor Days, Visitor Expenditures and Jobs Supported by
Tourism in the Snake/Salt River Basin, 2032 - Mid Scenario
| |||||||||||||||||||||||||||||||||||||||||||||||||||||||||||||||||||||||||||||||||||||||||||
Source: Current levels based on Morey and Associates, 1999, 2000; Runyan and Associates, 2001; and Prior and Associates, 2001. Projections based on historical recreational and housing trends in the basin.
Source: Current levels based on Morey and Associates, 1999, 2000; Runyan and Associates, 2001; and Prior and Associates, 2001. Projections based on historical recreational and housing trends in the basin.
The overall employment projections for the tourism sector described above were distributed across major industrial sectors using monthly Teton County employment data from the Wyoming Department Employment. The seasonal distribution of employment, by sector, is depicted in Figure IV-6.
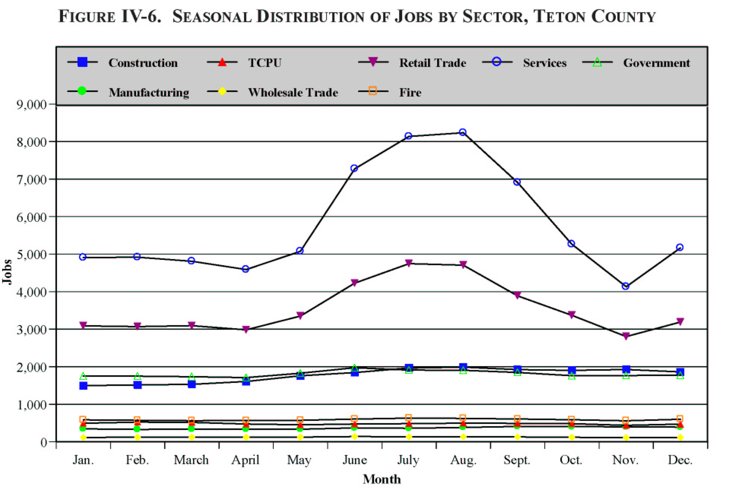
Source: Wyoming Department of Employment
Note: TCPU = Transportation, Communications, & Public Utilities.
Overall Economic and Demographic Projections
The preceding evaluations and assumptions were incorporated into a model of Snake/Salt River basin employment and population in order to develop aggregate estimates of total residents and total jobs in 2032 under each of the three planning scenarios. As previously noted, an inverse relationship exists within the basin between the two key water use sectors (agriculture and tourism) that is well documented. Specifically, growth in the number of visitors implies increased demand for visitor lodging and seasonal residences, which in turn drives up land values and reduces the economic viability of conventional agricultural operations. This implies decreases both in the number of irrigated agricultural acres and commercial livestock production occurring simultaneously with increases in the number of pleasure horses. In fact, such substitution has already been observed in Teton County.
Projected Total Employment in 2032
To fully characterize the economic impact of the growth in employment under each scenario, projected employment changes for the agricultural and tourism sectors were run through an IMPLAN model for the basin. This allowed the study team to estimate the total number of secondary jobs associated with the projected growth in these sectors within the Basin. Results from this analysis indicate that an additional 9,750 secondary jobs would be generated under the High Scenario, 430 secondary jobs under the Low Scenario and 4,020 secondary jobs under the Mid Scenario.
Projected growth in direct and secondary employment for each scenario appears below in Table IV-9. Under the assumptions regarding changes in key economic activities described above, the study team projects that Snake/Salt River basin employment under the High Scenario will more than double, from about 28,200 jobs at present to roughly 76,900 jobs by 2032. This increase would be completely driven by growth in tourism related employment in the Basin, as the number of agricultural jobs would remain essentially constant. Under the Low Scenario, basin wide employment is projected to remain near current levels, increasing by only about 1,800 jobs over the 30-year projections period. Under the Mid Scenario, aggregate employment is projected to increase by roughly 19,600 jobs over the course of the projection period.
Currently, the multiplier, or ratio of total employment to direct basic employment is estimated to be approximately 1.4, indicating that each basic job supports approximately 0.4 additional jobs in local services. Higher multipliers imply relatively larger levels of supporting, indirect basic/local service employment that are characteristic of more thriving, vibrant economies. Accordingly, the study team used increasingly higher multipliers for the Mid and High Scenarios, while leaving the multiplier at the current level under the Low Scenario. Since the actual growth in total employment and corresponding population levels will be subject to the buildout capacity of the area (something that is difficult to project 30 years into the future), the study team employed conservative increases for the multipliers under these scenarios.
Table IV-9. Current and Projected Employment Breakdown in
Snake/Salt River Basin
|
Projected Total Population in 2032
For the high, low, and mid scenarios, projections of total Snake/Salt River basin population were derived from the preceding employment projections. Deriving the population estimates from the projected employment totals for the basin required five steps:
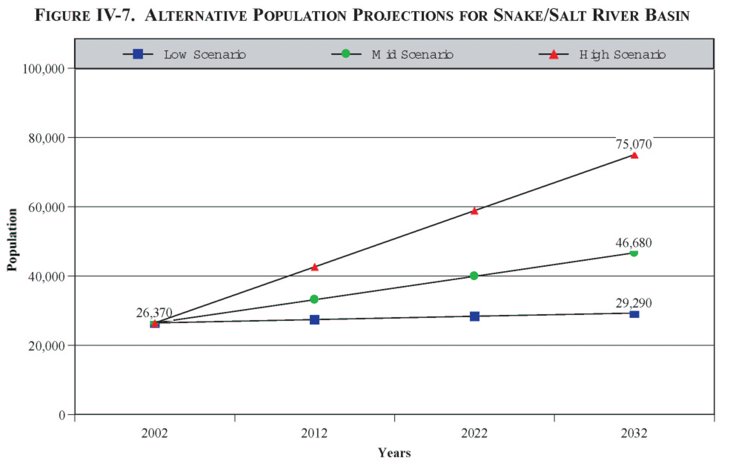
The results of these calculations are shown in Table IV-10 below. Under the High Scenario, the basin's population is projected to more than double, reaching just over 75,000 residents. Under the Low Scenario, population within the basin is projected to experience very little growth over the next 30 years, reaching just over 29,000 residents. Under the Mid Scenario, population within the basin would experience substantial growth over the next 30 years, gaining more than 20,000 additional people to reach a total of almost 47,000 residents.
Table IV-10. Employment and Population Projections for Snake/Salt River Basin
(Numbers Reflect Only Portions of Counties Within Basin)
| ||||||||||||||||||||||||||||||||||||||||||||||||||||||||||||||||||||||||||||||||||||||||||||||||||||||||||||
* Net incommuting assumes 17 percent of Teton County employees come from Teton County Idaho and 2 percent of Teton County residents and 4 percent of Lincoln County residents work in Idaho (Prior and Associates, 2001).
** Number of employed persons is less than number of jobs due to multiple jobholding by individuals. Multiple job factors calculated by dividing State 1998 employment totals by BEA 1998 employment totals.
*** Proportion derived from Census 2000 data
Figure IV-7, below, provides a graphic depiction of the three alternative population projections for the Snake/Salt River basin.
Summary
The study team projected three future scenarios for economic and demographic growth in the Snake/Salt River basin, through the year 2032. All three scenarios employed an economic base modeling approach, in which prospects for the key sectors that either bring money into the region and/or are the source of substantial water use were analyzed in detail. Based upon these analyses, high, low, and middle case alternative forecasts were developed for each key sector. The growth in total employment, and the corresponding population base, was then estimated based upon the key sector projections. Due to the well documented inverse relationship for future development between the agriculture and tourism sectors, the high and low projections presented in the memo are likely more extreme but represent useful bounds for future water planners. It is the study team's judgment that the Mid Scenario is the most realistic and is the most likely scenario to occur.
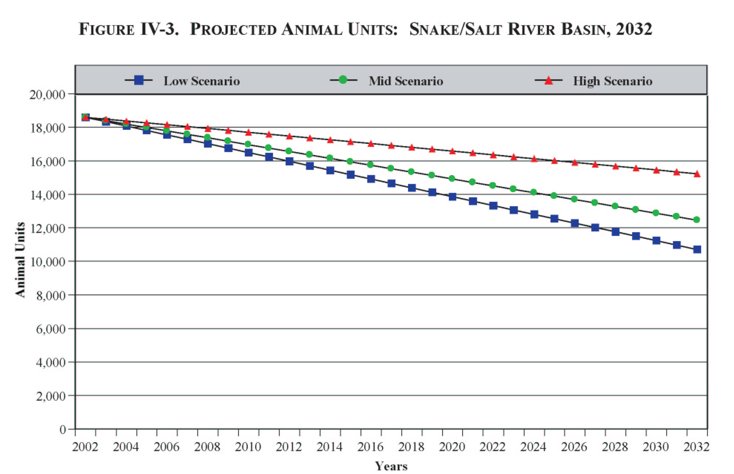
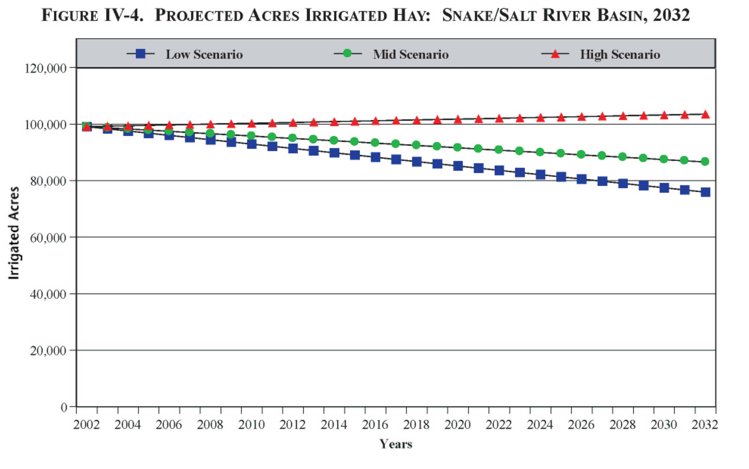
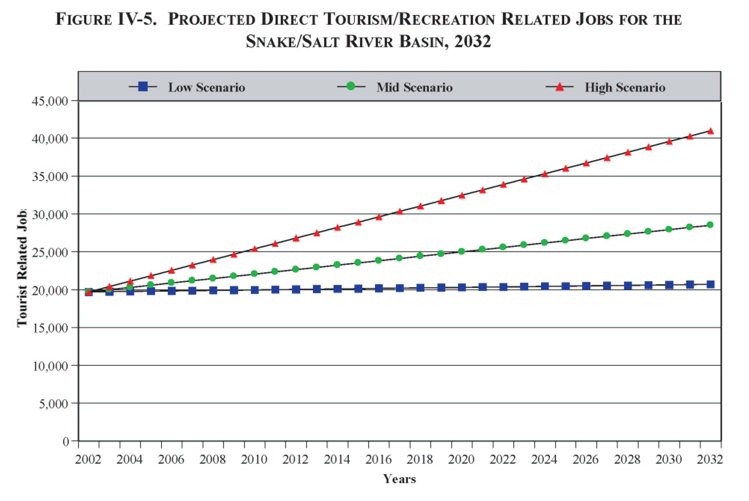
The three scenarios presented in the memo portray markedly different potential futures for the region. Under the High Scenario, both the number of irrigated acres and commercial livestock within the basin would increase modestly. In contrast, tourism related activity, expenditure and supporting employment would more than double. Under the Low Scenario, both livestock numbers and irrigated acreage would decline sharply due to continued pressure for residential development and changes in public land management policies. The tourism/visitation sector, under this scenario, would remain essentially at current levels. The Mid Scenario projects livestock animal units within the basin to decline by roughly 33 percent, and the number of irrigated acres to decline by roughly 13 percent. Tourism activity, expenditures and employment under this scenario are expected to increase by nearly 40 percent.
Projected Snake/Salt River basin population in 2032 under the High Scenario would reach just over 75,000 residents, compared with almost 47,000 residents under the Mid Scenario and just over 29,000 residents under the Low Scenario, which is similar to year 2002 basin population.
C. FUTURE WATER DEMAND PROJECTIONS
Projected Water Use in Economic Sectors Water Use Factors
This section describes the development of the estimated water use relationships for each of the five key water using economic sectors - agricultural, municipal, rural domestic, industrial and recreational facility - within the basin. Separate estimates of total diversions and consumptive use were calculated for each sector. After a detailed description of the methodology used to develop the water use factor in each sector, the section concludes by presenting a table of all the calculated water use factors for these sectors.
Agricultural Sector
The agricultural sector consists of three primary areas of water use: irrigated crop production, livestock sustenance and dairy water use. It is assumed that all water used by the sector within the basin comes from surface water diversions.
As discussed previously, the majority of the irrigated acreage within the basin is planted to hay, although some small grains (mostly barley) are grown in both Lincoln and Teton Counties. Crop-specific information on monthly consumptive irrigation requirements (CIR) for the period 1971 through 1990 was obtained by the study team. The team then calculated monthly averages for representative "wet," "dry" and "normal" years for the months of April through October.
The mean and maximum of these crop-specific CIR averages was calculated to represent irrigation water use in a "normal" and "high" year. As Table IV-11 below shows, estimated CIR in a normal year averages about 1.3 acre-feet per acre for hay and 0.9 acre-feet per acre for grain across the basin as a whole. During a "high" water use year, these averages climb to 1.5 and 1.4 acre-feet per acre respectively.
Unfortunately, analogous records of total surface water diverted for irrigation were unavailable. Diversion estimates thus had to be constructed by adjusting annual CIR estimates using estimated application and conveyance efficiencies. Estimated application efficiency depends on the relative share of acreage using a gravity or sprinkler irrigation system. The study team assumed application efficiencies of 50 percent for flooded acreage and 70 percent for sprinkler-irrigated acreage.
No conveyance efficiency estimates were readily available, so the 55 percent conveyance efficiency estimated for the central district within the Bear River basin was uniformly applied throughout the Snake/Salt River basin. Resulting annual diversion estimates were converted to an acre-foot per acre basis using the estimated irrigated acreage totals. As Table IV-11 shows, diversions in a "normal" year average about 3.9 acre-feet per acre of hay and 2.3 acre-feet per acre of grain across the basin as a whole. Corresponding diversions during a "high" year are 4.4 and 2.5 acre-feet per acre, respectively.
Livestock water use factors in the basin are estimated on a per animal unit basis. Previous estimates have placed daily water requirements at 12 gallons per head for cattle and horses and 2 gallons per head for sheep. Range specialists for the Bridger Teton National Forest estimate a daily requirement of 17.5 gallons for each cow-calf pair. Since a cow-calf pair is the most common definition of an animal unit, it is appropriately converted to yield a livestock water use factor of .02 acre-feet per animal unit per year.
Dairy cattle water use factors in the basin are estimated on a per head basis. Previous studies estimated daily water use factors for dairy cattle at 35 gallons per head and between 22 and 46 gallons per head depending on the season. The study team chose a daily water use factor of 35 gallons per head, which converts to .04 acre-feet per head on an annual basis. It is assumed that all the Star Valley dairies are too small to have significant facility-cleaning water use requirements.
Water use in this sector was analyzed in a simplified fashion on a gallon per day basis due to 1) the large number of diverse water systems within the basin and 2) the fact that very limited information exists on end-user usage for most of these systems. For each municipal and unincorporated water system, the study team collected estimates of year round population, estimated residential equivalent units (includes seasonal and transient residents) and daily water use estimates on both an annual average and peak day basis. By dividing the daily water use estimates by estimates of resident days, it was possible to derive estimates of daily average per capita consumptive use factors for both Teton and northern Lincoln County during a "normal" year.
In order to estimate both a consumptive use factor during a "high" year and diversion factors during "normal" and "high" years for Teton County, the study team obtained aggregate water delivery and wastewater influent monthly averages for the City of Jackson for the recent 7-year period of 1993 through 1999. Corresponding consumptive use totals may be estimated by subtracting influent totals from deliveries. The mean and the maximum of these totals over this 6-year period were calculated to represent current water use in a "normal" and "high" demand year. On average, consumptive use during a "high" demand year was estimated to be 1.6 times that of a "normal" year. In a "normal" year, annual consumptive use is estimated to be 47 percent of total deliveries, and 53 percent of deliveries during the summer months, when an increased share of water use is devoted to outdoor irrigation. During "high" demand years, these percentages climb to 59 percent and 61 percent respectively.
These percentages were applied to Teton County totals because local experts felt that these relationships were reasonably representative of other water systems in Teton County. As Table IV-11 shows, current daily municipal consumptive use in Teton County is estimated to range from 180 gallons per capita during a "normal" year to 290 gallons per capita during a "high" year. Similarly, Teton County estimated municipal diversions range from 380 gallons per capita during a "normal" year to 490 gallons per capita during a "high" year.
In order to calculate diversion and consumptive use factors during a "high" year, water delivery monthly averages for the Town of Alpine for the recent 3-year period of 1999 through 2001 were analyzed. The mean and the maximum of these totals over this period were calculated to represent water use in a "normal" and "high" demand year. On average, water deliveries during a "high" demand year were estimated to be 1.5 times that of a "normal" year. This relationship was assumed to hold for all water systems within Lincoln County. Table IV-11 shows that current daily municipal consumptive use and diversions in Lincoln County is estimated to range from 350 gallons per capita during a "normal" year to 510 gallons per capita during a "high" year.
Rural Domestic Sector
Throughout the basin, the remaining residential water use in the basin consists of domestic use on the individual ranches (and ranchettes) scattered throughout the basin. These ranches pump their water from individual wells located on their property. Very little information exists on water use in this unmetered sector. The study team thus chose an annual average water use proxy of 200 gallons per capita per day and a peak water use proxy of 430 gallons per capita per day for this sector, as water use in this sector is thought to be comparable to rural water systems such as the Skyline Ranch Improvement and Service District. The relationship between water demand during a "normal" and "high" year for Teton County water systems was assumed for this sector. In addition, 100 percent consumptive use is assumed for the rural domestic sector. Note that water use for this sector is accounted for in the aggregate, county-level municipal water use factors described above.
Industrial Sector
Industrial water use in the basin in not substantial. Three primary industrial water users in the basin were identified as part of the Task 2 analysis: Star Valley Cheese Company (SVC), Northern Food and Dairy (NFD) and Water Star Bottling Company (WSB). Although the WSB has closed since the conclusion of Task 2, the town of Afton is recruiting other water bottling companies to take over use of the production facilities. All three plants utilize groundwater supplies.
Current water use for the SVC is estimated to be 140,000 gallons per day, with 120,000 gallons per day discharged from the company's private water treatment plant to the East Side Canal. Current production at the SVC is estimated to be roughly 16 million pounds of cheese per year. Assuming a 5-day workweek, this translates to annual water use factors of 2.3 gallons diverted per pound of cheese produced and 0.3 gallons of consumptive use per pound of cheese produced. This type of industrial water use is assumed to be invariant during normal and high years.
The NFD plant is estimated to use roughly 150,000 gallons per week in the production of various soy-based products. This translates into an industrial water demand of roughly 24 AF per year. Since no information on annual production totals was available, it was not possible to calculate corresponding water use factors. In addition, 100 percent consumptive use is assumed for the NFD plant.
While it was operating, the WSB plant was estimated to use roughly 2.7 million gallons annually. Although production sometimes varied significantly from quarter to quarter, 2001 production was estimated to be 1.4 million gallons of bottled water. This implies a water use factor of 1.9 gallons per gallon of bottled water produced. This type of industrial water use is assumed to be invariant during normal and high years, and consumptive use is assumed to be 100 percent of diversions. The calculated industrial water use factors are presented in Table IV-11.
Recreational Facility Sector
Recreational water use is vitally important to the levels of overall economic activity that occur within the basin. The majority of this use (boating, fishing, etc.) is non-consumptive. At least two important recreational water uses do exist, however, that are both consumptive and critical to existing recreational facilities which in turn are vital for maintaining overall recreation and associated tourism levels: snowmaking at alpine ski areas and golf course irrigation.
Snowmaking
To analyze the water use associated with snowmaking operations, the study team interviewed management representatives of each of the three alpine ski areas within the basin. Each of these three areas has a significantly different scope of snowmaking operations in place, which translates to significantly different water use factors.
The Snow King ski area sits on the edge of the City of Jackson, and the area buys the water used for snowmaking directly from the city. Because Snow King is at a relatively low elevation, snowmaking operations begin earlier, sometimes starting in early to mid-October. Currently, approximately 120 acres at the area receive artificial snow from snowmaking operations. In a typical year, Snow King uses roughly 20 million gallons of water to make snow, but has the capacity to use up to 600 gallons per minute, 24 hours a day if needed. This translates to an annual use of roughly 56 million gallons of water, assuming a 65-day snowmaking operation. This implies water diversion factors of 0.5 acre-feet per acre during a "normal" demand year and 1.4 acre-feet per acre during a "high" demand year.
In contrast to Snow King, Grand Targhee has relied historically on natural snow exclusively and only this year has installed minimal snowmaking operations. Approximately 10 acres at the area will receive artificial snow from snowmaking operations, including portions of the base, Magic Carpet and Tubing Park. Grand Targhee anticipates that roughly 1.25 million gallons of water will be used to make snow this year. Because snowmaking operations are minimal and the area plans to continue to rely largely on natural snow, this total is assumed to be invariant during "normal" and "high" demand years. This implies water diversion factors of 0.8 acre-feet per acre during both types of years.
Jackson Hole Mountain Resort is the largest and best-known ski resort in the basin, and not surprisingly, has the most extensive snowmaking operations. The current acreage base at the area is approximately 265 acres and approximately 60 percent of this acreage can receive artificial snow from snowmaking operations. Jackson Hole Mountain Resort typically uses roughly 80 million gallons in snowmaking operations over the course of 70 days during November, December and January. This implies water diversion factors of 1.5 acre-feet per acre during a "normal" demand year. Information on maximum snowmaking capacity was not available from the area, so the study team assumed the ratio between diversion factors during a "high" demand year and a "normal" demand year to be half that of Snow King, given the higher elevation enjoyed by Jackson Hole Mountain Resort. This assumption implies water diversion factors of 2.2 acre-feet per acre during a "high" demand year.
Distinguishing between diversions and consumptive use for snowmaking operations is difficult, especially given the diversity in the scope of operations that exist within the basin. In previous studies of such operations at ski areas within the Rocky Mountain region, the study team calculated consumptive use to be roughly 20 percent of total diversions. Accordingly, this percentage was applied uniformly to each of the three ski areas in the basin to calculate appropriate consumptive use factors for snowmaking operations. Both diversion and consumptive use factors for each ski area appear in Table IV-11.
Golf Course Irrigation
From roughly May through October, golf is a significant recreational activity within the basin. There are currently five existing courses in the basin, and plans are underway to build another three courses in Teton County and possibly another one in northern Lincoln County. In order to analyze golf course irrigation patterns, the study team interviewed superintendents for each of the existing courses, and obtained information regarding new course development from representatives of the Teton County Planning Department.
The two existing Teton County courses, Teton Pines (TP) and Jackson Hole Golf and Tennis (JHGT) are the largest and most extensively used courses in the basin. Irrigation for these courses may begin as early as mid-April and continue until the end of October. In addition, a more intensive irrigation period occurs during the months of July and August when use is at its peak. TP has approximately 100 acres of turf that is irrigated, irrigates every night, and uses roughly 250,000 gallons per night. Irrigation water use increases to approximately 700,000 gallons per night during the peak use months. In addition, TP has by far the most extensive water hazards of any course in the basin, covering approximately another 65 acres of surface area. By comparison, JHGT has roughly 130 acres of irrigated turf but minimal acreage devoted to water hazards. JHGT typically irrigates every second night and uses approximately 150,000 gallons per night throughout the irrigation season. During the peak months, water usage at JHGT climbs to roughly 750,000 gallons per night. Assuming a conveyance efficiency is similar to that assumed for basin agriculture (55 percent), water diversion factors for a "normal" year of 3.0 and 2.3 acre-feet per acre were calculated for TP and JHGT respectively. Assuming an 80 percent efficiency rate for golf course sprinkler irrigation implies corresponding consumptive use factors of 1.3 and 1.0 acre-feet per acre for these two courses. Similar demand factors for "high" years were calculated assuming that irrigation would occur every night in this instance. Note that the factors for TP remain unchanged since they already irrigate every night.
Three new courses are currently at different stages of planning and development that could come on line in Teton County during the 30-year projection period including the Canyon Club, the 4 Lazy F and a course near Teton Village being developed by Snake River Associates. Since the Canyon Club is the farthest along, it serves as the model for the other two courses for purposes of this analysis. Assuming each course covers 120 acres and irrigates in a similar fashion as existing courses (200,000 gallons every other night during the shoulder months and 700,000 gallons every night during peak months) diversion factors of 2.6 and 3.2 acre-feet per acre were calculated for "normal" and "high" demand years for each potential new course. Corresponding consumptive use factors are 1.1 and 1.4 acre-feet per acre for these courses.
The three existing Lincoln County courses, Valli Vu (VV), Star Valley Ranch (SVR) and Star Valley Ranch RV Park (SVRV) are much more modest courses than those in Teton County courses described above. None of these courses have significant water hazards. Irrigation for these courses may begin as early as the beginning of May and continue until the end of September. In addition, a more intensive irrigation period occurs during the months of July and August when use is at its peak. VV has approximately 63 acres of turf that is irrigated, irrigates every other night, and uses roughly 250,000 gallons per night. Irrigation water use increases to approximately 375,000 gallons every night during the peak use months. By comparison, SVR has roughly 100 acres of irrigated turf spread across two courses and 27 holes while SVRV has 80 acres of irrigated turf on its 18-hole course. While SVR follows a similar irrigation pattern as VV (using 700,000 gallons every other night during shoulder months and 1 million gallons every night during peak months) SVRV waters every night throughout the irrigation season, with typical usage of 1 million gallons a night.
According to local experts, only one new course has the potential to come on line in northern Lincoln County during the 30-year projection period. The course is known as the Alpine course and would include only 9 holes over 50 acres. A state of the art irrigation system is already in place, and water usage is estimated at 150,000 gallons every other night during the shoulder months and 275,000 gallons every night during peak months. This implies diversion factors of 2.7 and 3.4 acre-feet per acre for "normal" and "high" demand years at this potential new course. Corresponding consumptive use factors are 1.2 and 1.5 acre-feet per acre. Calculated diversion and consumptive use factors for all courses described above during "normal" and "high" demand years appear in Table IV-11 below.
Projected Annual Water Demands by Scenario
This section presents current and projected annual water demands (both diversions and consumptive use) for the basin under each of three separate scenarios: high, medium and low water use.
Table IV-11. Water Demand Factors by Economic Sector, Annual Diversions and Annual Consumptive Use
| |||||||||||||||||||||||||||||||||||||||||||||||||||||||||||||||||||||||||||||||||||||||||||||||||||||||||||||||||||||||||||||||||||||||||||||||
Water demands are derived by multiplying current or projected demographic or production activity by the water use factors presented previously. Total water diversions and consumptive use are presented and discussed for each sector through three pairs of tables, one pair for each scenario. Patterns of change from current to projected future use by sector.
High Scenario
Under the assumption of a "normal" water year, total basin water diversion requirements are projected to increase by about 11 percent from year 2002 to year 2032 under the High Scenario. In a "high" year, the increase is projected to be around 12 percent. Under "normal" water year conditions, this amounts to an increase of just over 41,000 acre-feet; under "high" demand year conditions, the increase would be about 51,000 acre-feet.
Current and projected water demands under the High Scenario are shown for both consumptive use and diversions in Tables IV-12 and IV-13. Under the High Scenario, total agricultural water demand grows slightly over the projection period. Despite a lack of growth in the sector, agriculture continues to comprise the vast majority of total water demand under the high scenario. The vast majority of agricultural water demand remains in irrigated crop production, with less than 1 percent of total projected agricultural diversions and consumptive use going to direct livestock sustenance and dairy water use.
Under the High Scenario, while municipal water demand in the basin nearly triples over the 30-year projection period, it remains a relatively small sector. The increase is slightly higher in Teton County than Lincoln County because the population increase projected for that county is also slightly higher.
Water demand within the industrial sector is does not change substantially over the projection period under the High Scenario. Industrial diversions and industrial consumptive use are likely to continue to be minor considerations within the basin.
Water demand in the recreational facility sector increases substantially under the High Scenario. Water used in snowmaking is projected to more than double while golf course irrigation water is projected to increase by roughly 60 percent over the projection period. Overall, this sector is expected to remain relatively small.
The share of aggregate water demand met by ground water resources within the basin increases over the projection period under the High Scenario. Groundwater diversions increase from 3 percent to 8 percent while groundwater consumptive use increases from 5 percent to 13 percent. This increase is reflective of the relative increase in the municipal sector combined with the stability exhibited in the agricultural sector under the High Scenario.
Table IV-12. Current and Projected Annual Snake/Salt River Water Demand High Scenario, Annual Diversions in Acre Feet per Year
| |||||||||||||||||||||||||||||||||||||||||||||||||||||||||||||||||||||||||||||||||||||||||||||||||||||||||||||||||||||||||||||||||||||||||||||||||||||||||||
Source: Multiple Interviews
Table IV-13. Current and Projected Annual Snake/Salt River Water Demand High Case Scenario, Annual Consumptive Use in Acre Feet per Year
| |||||||||||||||||||||||||||||||||||||||||||||||||||||||||||||||||||||||||||||||||||||||||||||||||||||||||||||||||||||||||||||||||||||||||||||||||||||||||||
Source: Multiple Interviews
Low Scenario
Total water diversion requirements under the Low Scenario in a "normal" year are projected to decline by 20 percent from 2002 to 2032. However, in any given year during this period, there might be the need for an additional 37,000 acre-feet in a "high" demand, dry year compared with a "normal" year. Current and projected water demands under the Low Scenario are shown for both consumptive use and diversions in Tables IV-14 and IV-15.
Under the Low Scenario, total water demand in the agricultural sector declines over the projection period. Since both irrigation diversions and consumptive use are projected to decline overall agricultural demand declines correspondingly. The decline in livestock water demand directly reflects the increase residential development pressure in the basin as well as potential grazing policy changes on public lands. Under the Low Scenario, the Star Valley dairy industry disappears over the projection period.
In the municipal sector, the 11 percent increase in both diversions and consumptive use is the direct result of the projected increases in basin population levels. Population in thebBasin is projected to grow at a similar rate under the Low Scenario. Under the Low Scenario, two of the three current industrial water users within the basin are assumed to be eliminated.
Water demand in the recreational facility sector remains constant under the Low Scenario as no new ski area expansions or golf course developments are assumed to occur during the projection period. Overall, this sector is expected to remain relatively small.
Table IV-14. Current and Projected Annual Snake/Salt River Water Demand Low Case Scenario, Annual Diversions in Acre Feet per Year
| |||||||||||||||||||||||||||||||||||||||||||||||||||||||||||||||||||||||||||||||||||||||||||||||||||||||||||||||||||||||||||||||||||||||||||||||||||||||||||
Source: Multiple Interviews
Table IV-15. Current and Projected Annual Snake/Salt River Water Demand Low Case Scenario, Annual Consumptive Use in Acre Feet per Year
| |||||||||||||||||||||||||||||||||||||||||||||||||||||||||||||||||||||||||||||||||||||||||||||||||||||||||||||||||||||||||||||||||||||||||||||||||||||||||||
Source: Multiple Interviews
Mid Scenario
Assuming a "normal" water year, total basin water diversion and consumptive use requirements are projected to decline by about 9 percent and 7 percent respectively from year 2002 to year 2032 under the Mid Scenario. In a "high" year, the decline is projected to be similar. The projected difference in aggregate diversions and aggregate consumptive use under "normal" and "high" year water year conditions amounts to roughly 34,000 acre-feet and 10,000 acre-feet respectively. Current and projected water demands under the Low Scenario are shown for both consumptive use and diversions in Tables IV-16 and IV-17.
Despite the projected decline in agricultural demand, agriculture continues to comprise the vast majority of total water demand under the Mid Scenario. The vast majority of agricultural water demand remains in irrigated crop production, with less than 1 percent of total projected consumptive use going to direct livestock sustenance and dairy water use.
While municipal water demand increases, it remains a relatively small sector. Municipal consumptive use is projected to increase over the projection period. As before, the larger increase in Teton County reflects the larger increase in population projected for that county.
Both water diversions and consumptive use in the basin industrial sector is projected to remain unchanged from current levels. Industrial water use will remain a small component of overall basin water use.
Water demand in the recreational facility sector grows substantially under the Mid Scenario as the first phase of the planned ski area expansions and a portion of the planned golf course developments within the basin are projected to be completed. In spite of the fact that both snowmaking and golf course irrigation demands are projected to increase, this sector remains relatively small overall.
The share of total diversions and consumptive use from groundwater sources is projected to increase, which is reflective of the significant increase in the municipal sector combined with the decline exhibited in the agricultural sector under the Mid Scenario.
Table IV-16. Current and Projected Annual Snake/Salt River Water Demand Mid Case Scenario, Annual Diversions in Acre Feet per Year
| |||||||||||||||||||||||||||||||||||||||||||||||||||||||||||||||||||||||||||||||||||||||||||||||||||||||||||||||||||||||||||||||||||||||||||||||||||||||||||
Source: Multiple Interviews
Table IV-17. Current and Projected Annual Snake/Salt River Water Demand Mid Case Scenario, Annual Consumptive Use in Acre Feet per Year
| |||||||||||||||||||||||||||||||||||||||||||||||||||||||||||||||||||||||||||||||||||||||||||||||||||||||||||||||||||||||||||||||||||||||||||||||||||||||||||
Source: Multiple Interviews
Projected Monthly Demands by Scenario
Current and projected monthly water demands have been prepared for the basin under the High, Low and Mid scenarios. Monthly water demands are derived by multiplying current and projected annual water demands for each sector by observed monthly shares of annual water use over the historical period. Total water diversions and consumptive use are presented and discussed for each sector through three tables, one for each scenario.
An analysis of the temporal distribution of water demands throughout the year illustrates the seasonal nature of water demand within the basin. Almost all sectors exhibit a significant difference in demand between the peak summer months and the off-peak winter months. Such distinct seasonal patterns in water demand are characteristic of economies for areas with colder climates similar to the basin. One simplifying assumption is that the temporal distribution of diversions and consumptive use throughout the year are identical.
The distribution of irrigation water demand was calculated from the aggregate CIR information obtained by the study team. As expected, positive demand for irrigation water occurs only from April through October. Livestock water demand is assumed to be twice as high during the months of April through September to reflect both the presence of the spring calf crop and the increased temperatures during those months. Water demand for the basin's dairy industry is assumed to be distributed in a similar fashion.
Municipal water demand in Teton County was based on the average monthly water use observed for the City of Jackson in 1993-99. This seasonal distribution was assumed to extend to all other water systems throughout the county. Municipal water demand in Lincoln County was based on the average monthly water use observed for the Town of Alpine in 1999-2001. The seasonal distribution is similar to that observed for Jackson, and was assumed to extend to all other water system throughout Lincoln County.
Industrial water demand in the Basin was assumed to be constant throughout the year, with the exception of the NFD. Since production varies according to nation supply and demand for soy products, the study team derived a seasonal water use distribution from monthly data on the domestic consumption of soybean products. The distribution exhibited minimal variance, peaking slightly from September through November and reaching a minimum during the summer months.
Data used to determine the seasonal distribution of water demand in the recreational facility sector was obtained through interviews with management of local ski areas and golf courses. Water demand in this sector exhibits a bi-modal seasonal distribution. Snowmaking in the basin begins in early October and may run through mid-January. Roughly half of the basin's snowmaking water use occurs during the month of November. In contrast, the golf course irrigation season may start as early as mid-April and run through the end of October. Lincoln County courses have only a slightly shorter irrigation season. Overall, nearly 60 percent of golf course irrigation water in the basin is used during the peak months of July and August.
High Scenario
The aggregate temporal distribution of water demand in these sectors within the basin under the High Scenario is presented in Table IV-18 below. It is possible to divide the months into three categories of water use: the baseline or off-peak months of September through April; the peak months of June and July; and the shoulder months of May and August.
Table IV-18. Current and Projected Monthly Snake/Salt River Basin Water
Demand High Case Scenario, Estimated Diversions and Consumptive Use in Acre Feet
| |||||||||||||||||||||||||||||||||||||||||||||||||||||||||||||||||||||||||||||||||||||||||||||||||||||||||||||||||||||||||||||||||||||||||||||||
The distribution of percentage increases over the 2002-2032 projection period is exactly inverted, with the largest percentage increases coming the baseline months (roughly 160 percent) and the smallest percentage increases coming during the peak months (roughly 9 percent). This result stems from the fact that the largest water-using sector in the baseline months is the municipal sector (the fastest growing sector) while the primary water-using sector in the peak months is the agricultural sector (the slowest growing sector).
Low Scenario
The aggregate temporal distribution of water demand in the basin under the Low Scenario is presented in Table IV-19 below.
Table IV-19. Current and Projected Monthly Snake/Salt River Basin Water Demand
Low Case Scenario, Estimated Diversions and Consumptive Use in Acre Feet
| |||||||||||||||||||||||||||||||||||||||||||||||||||||||||||||||||||||||||||||||||||||||||||||||||||||||||||||||||||||||||||||||||||||||||||||||
Under the Low Scenario, water demand for the basin increases slightly (between 4 and 6 percent) from October through March but declines from April through September. The sharpest projected decline (roughly 21 percent) comes during the peak summer months. Both the sharp decline projected for the agricultural sector combined with the overall dominance of that sector in terms of water demand determines the pattern of change under the Low Scenario.
Mid Scenario
The aggregate temporal distribution of water demand in the basin under the Mid Scenario is presented in Table IV-20 below.
Table IV-20. Current and Projected Monthly Snake/Salt River Basin Water
Demand Mid Case Scenario, Estimated Diversions and Consumptive Use in Acre Feet
| |||||||||||||||||||||||||||||||||||||||||||||||||||||||||||||||||||||||||||||||||||||||||||||||||||||||||||||||||||||||||||||||||||||||||||||||
The temporal distribution of water demand under the Mid Scenario essentially splits the difference between the patterns exhibited under the other two scenarios. As can be seen in Table IV-20, significant increases (between 48 and 69 percent) are projected for the months of October through April (driven by municipal demand) while slight decreases (roughly 10 percent) are projected for the peak months of May through August (driven by agricultural demand). September exhibits a more modest increase of roughly 11 percent.
Projected Water Use in the Environmental Sector
Environmental water uses are difficult to define, and the development of a completely comprehensive list of these uses is beyond the scope of this project. Accordingly, the study team chose to restrict the definition of environmental uses to include only those uses associated with efforts aimed at restoring, maintaining or improving the environmental services provided by the water resource, such as fish and wildlife habitat.
The study team identified a set of important existing and potential environmental efforts within the basin. These efforts fell into two distinct categories: 1) Instream Flow (ISF) agreements and 2) Wetlands projects. For each effort, the team quantified current water use, and projected future water use for a High, Low and Mid Scenario.
Water Use Factors
Instream Flow Agreements
The first category of environmental water demands is existing or potential ISF agreements. Because these flows may not be diverted for other uses, they must be treated as a separate, incremental water demand within the basin. Both the temporal and spatial aspects of ISF agreements are important. Most ISF agreements specify an average flow level for all months throughout the year that must be met in a specific reach targeted by the agreement. Additionally, the location of the affected reach is critical, since an ISF requirement will affect all potential upstream uses.
An existing (though informal) ISF agreement within the basin requires the maintenance of a minimum flow level for a reach of the Snake River, located just below Jackson Lake. Jackson dam enables controlled releases from Jackson Lake in order to maximize the benefit to agricultural water right holders located downstream in Idaho. The Wyoming Game and Fish Department (WGF) determined that historical releases during the winter months were insufficient for maintaining adequate fish habitat in this reach of the river. Accordingly, the WGF and the Bureau of Reclamation (BOR) agreed to release enough water to maintain a minimum flow of 280 cubic feet per second (cfs) from October to April. In addition, the State of Wyoming can transfer the storage of 33,000 acre-feet of water from Palisades Reservoir to Jackson Lake for use by the WGF.
In addition to this agreement, four separate ISF applications have been filed with the Wyoming State Engineer’s Office (SEO) that affect reaches located within the basin. Specifically, these applications include reaches on the Salt River (221 cfs), the Greys River (204 cfs from July to March and 350 cfs from April to June) and two separate, but closely proximate reaches on Fish Creek (150 cfs each). The approval of any or all of these applications would significantly increase the amount of water committed to environmental uses within the basin.
Wetlands Projects
A second category of environmental water demand within the basin is water dedicated to wetland areas. This water should, in theory, be treated as an incremental water demand because of the environmental services it provides. Maintaining an accurate accounting of such water is difficult, however, because wetlands are often difficult to define, and considerable wetland activity is occurring within the basin.
There is general agreement that fewer wetlands exist within the basin today than 100 years ago due to draining for agricultural uses and residential development. Since the enactment of the Clean Water Act, however, all regulated (naturally occurring) wetlands that are drained and filled must be mitigated. The Army Corps of Engineers keeps a strict count of the basin acreage associated with such mitigation projects. In addition, a significant amount of pond construction occurs on private residential lands within the basin for aesthetic reasons. The water associated with these projects may most accurately be characterized as irrigation since they often utilize the agricultural water right obtained with the land and are frequently accompanied by continued irrigation practices on other portions of the acreage.
Because accurate accounting of wetlands is so difficult, the study team chose a conservative approach for estimating the associated water demand. Only wetlands projects that specifically target wildlife habitat improvement are included in the estimates. While the list of projects presented here is not all-inclusive, it provides a flavor of some existing and potential wetlands projects in the basin.
The first entry in this category is a group of wetlands projects to be undertaken by the Jackson Hole Land Trust (JHLT). These projects aimed at the restoration of habitat for Wyoming Trumpeter Swans and other waterfowl habitat. Pending grant approvals, they plan to fund projects at 13 separate sites in the basin, 11 of which involve either the restoration of existing wetlands or the creation of new wetlands. The majority of the projects are located near Jackson with the remainder located on lands adjacent to the Gros Ventre River.
The total affected acreage in these projects is roughly 1,000 acres, including 530 upland acres and 470 wetland acres. Average depth on the affected wetland acres is unknown and probably varies substantially. Accordingly, a proxy of 5 feet was used, an amount equivalent to the average irrigation of pasture in Teton County.
A second set of projects in this category are wetland impoundments within the National Elk Refuge, which is located just north of Jackson and is administered by the United States Fish and Wildlife Service (USFWS). According to its website, therRefuge consists of 25,000 acres, including nearly 1,000 acres of open water and marsh lands. According to the refuge biologist, however, the total open-water surface area within the refuge is roughly 290 acres, including approximately 75 acres of wetlands created from impoundments. These wetland impoundments have an average depth of approximately three feet.
The final wetlands project included in this analysis is a wildlife viewing area created by the WGF at the upper end of Palisades Reservoir in Lincoln County. The project consists of seven separate ponds created through a system of dikes. The surface area of these ponds totals roughly 115 acres, and the total area of the project is estimated to be 300 acres. Total holding capacity of the ponds is estimated to be roughly 215 acre-feet, for an average depth of roughly 1.9 acre-feet per acre. While up to 30 cfs may be diverted for this project, the projects holding capacity is assumed to accurately reflect the environmental water demand associated with the project.
Projected Annual Environmental Water Demands by Scenario: High Scenario
Total annual environmental water demand is projected to grow by almost 400 percent from year 2002 to year 2032 under the High Scenario. This amounts to an increase of just over 450,000 acre-feet in environmental water demand.
This increase is the result of two important assumptions: 1) that all existing instream flow applications are approved and 2) that all the wetlands projects proposed by the JHLT are funded and implemented. The instream flow agreements would account for an additional 440,000 acre-feet of environmental water demand or nearly 97 percent of the total estimated increase. It is acknowledged that the flow rates given in the ISF applications could be changed if a permit is actually granted, which could greatly effect the environmental water demand. Under the High Scenario, it is also assumed that water use currently committed to Snake River minimum flows, NER wetlands and the Palisades wildlife viewing area would remain at current levels. Table IV-22 below presents current and projected environmental water uses under the High, Low and Mid Scenarios.
Table IV-22. Annual Environmental Water Demands in Acre Feet per Year - High, Low and Scenarios
| ||||||||||||||||||||||||||||||||||||||||
Low Scenario
Under the Low Scenario, total annual environmental water demand is projected to decline by roughly 70 percent from year 2002 to year 2032. This amounts to a decrease of just over 85,000 acre-feet in environmental water demand.
The projected decline under the Low Scenario is solely attributable to the change in assumed annual instream flows in the reach of the Snake River near Moran. The current informal agreement between BOR and WGF is assumed to dissolve, and WGF is thus compelled to release the 33,000 acre-feet currently stored in Jackson Lake in order to preserve fish habitat. In addition, the Low Scenario assumes that none of the instream flow applications currently on file will be approved and that the JHLT is unsuccessful in receiving NAWCA funding for its proposed wetlands projects. All other existing environmental uses are assumed to remain at current levels.
Mid Scenario
Under the Mid Scenario, total environmental water demand is projected to increase by 300 percent from year 2002 to year 2032. This amounts to an increase of just over 340,000 acre-feet in environmental water demand. The overall increase results directly from approval of certain ISF applications and half of the proposed JHLT wetlands projects. Under this scenario, however, only the ISF applications on the Salt and Greys River are assumed to be approved. The ISF applications for Fish Creek are assumed to be denied, because average historical flows are less than the requested ISF amount for seven months during the year. Table IV-23 below presents historical mean flow levels together with instream flow requests, on a monthly basis, for each of the affected reaches in the basin.
Table IV-23. Historical Monthly Mean Flows and Requested Minimum Instream
Flows for Affected Reaches in the Snake/Salt River Basin
(Measured in Cubic Feet per Second)
| |||||||||||||||||||||||||||||||||||||||||||||||||||||||||||||||||||||||||||||||||||||||||||||||||||||||||||||||||||||||||||||
Source: Historical data are averages calculated from USGS monthly flow data published online at http://nwis.waterdata.usgs.gov/wy/nwis/monthly. Requested minimum flows are from WGF and from applications on file at the SEO.
According the representatives of the SEO office, it unlikely that applications requesting greater ISF than historical averages will be approved. The approved ISF requirements would, nevertheless, be responsible for an additional 330,000 acre-feet of environmental water demand or nearly 98 percent of the total estimated increase. The water currently committed to Snake River minimum flows, NER wetlands and the Palisades wildlife viewing area is assumed to remain at present levels under the Mid Scenario.
Projected Monthly Environmental Water Demands by Scenario
Current and projected monthly environmental water demands have been prepared for the basin under the High, Low and Mid scenarios. The aggregate distribution of environmental water demand in the basin was calculated using separate assumptions about each of the individual water uses. For example, positive demand for a minimum flow in the Snake River just below Jackson dam occurs only from October through April. Likewise, each of the ISF applications have temporal specifications. As seen above in Table IV-23, while the applications for the Salt River and Fish Creek involve a uniform flow throughout the year, the Greys River application has a slightly higher demand during the months of April through June.
Environmental water demand for both the NER wetlands and the JHLT wetland projects is assumed to be uniformly distributed throughout the year. The distribution of environmental water demand for the Palisades wildlife viewing area is assumed to be perfectly correlated with average historical water levels at the Palisades Reservoir. The aggregate temporal distribution of water demand in these sectors within the basin under the High, Low and Mid Scenarios is presented in Figure IV-8 below.
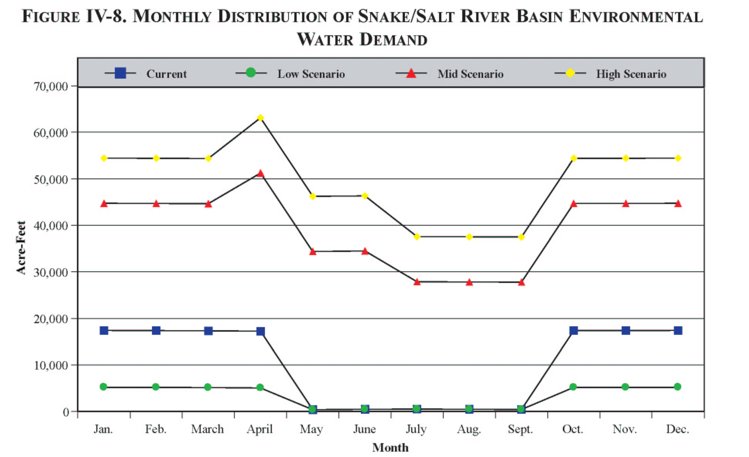
As demonstrated in the above figure, ISF requirements are the most important factor in determining the monthly distribution of environmental water demands. For example, current monthly demands are almost completely defined by the minimum flow requirement below Jackson Lake. During the months of October through April when this requirement is in place, environmental water demand in the basin shifts from less than 1,000 acre-feet to nearly 20,000 acre-feet.
Similarly, the assumption that all ISF applications are approved under the High Scenario serves to dramatically increase water demand in this sector throughout the year. Monthly environmental water demand under the High Scenario ranges between 38,000 and 63,000 acre-feet. Demand is at its low point during the summer months (when there is no minimum flow requirement on the Snake River) and peaks in the month of April when all ISF requirements are at a maximum.
Under the Low Scenario, environmental water demand for the basin remains at current levels from May through September and decreases by roughly 70 percent from October through April. The decline during these months results directly from the assumption that WFG is forced to utilize its water reserves stored in Jackson Lake to maintain fish habitat in the reach of the Snake River near Moran. All other environmental water demands identified here are projected to remain at current levels under the Low Scenario.
Although proportionately smaller, the seasonal distribution of water demand under the Mid Scenario is nearly identical to that projected under the High Scenario. The difference in monthly demands under the two scenarios is roughly 11,000 acre-feet, and is largely determined by the assumption that only two of the four ISF applications will be approved. The assumption that only a portion of the JHLT wetlands projects will be funded under the Mid Scenario also affects this difference, but its impact is much smaller.
Summary
This section has presented the water demand projections developed for the Snake/Salt River basin under three alternative scenarios. The methodology used to derive the quantitative relationships (water use factors) for each water use sector is outlined and discussed. These water use factors, together with projected demographic and economic information, are applied to develop annual water use projections by sector under three alternative scenarios. Observed monthly distributions of annual totals for each sector allowed the study team to derive monthly aggregate water use projections for each scenario.
Among the economic sectors, the largest projected changes in water demand occur in the municipal sector. Total municipal water demand remains small relative to water demand in the agricultural sector. While the agricultural sector experiences the smallest percentage change over the projection period, the sector's relative magnitude allows it to drive projected annual and monthly water use patterns. Although industrial water use is largely eliminated under the Low Scenario, the sector's diminutive size implies a minimal overall impact on water demand in the basin under any scenario. The recreational facility sector is also comparatively small, but exhibits substantial increases in demand under both the High and Mid scenarios.
The second portion of this section presented water demand projections for the environmental sector. Demand in this sector was defined to include only water used in existing and potential efforts aimed at enhancing environmental services such as fish and wildlife habitat. Scenarios were defined for this sector through the study team's assessment of the likelihood of future activity in the basin. The approval or denial of ISF agreements largely drives future water demand in this sector. Wetlands projects undertaken in the basin make a comparatively minor contribution to water use in the environmental sector.