Wyoming State Water Plan
Wyoming State Water Plan
Wyoming Water Development Office
6920 Yellowtail Rd
Cheyenne, WY 82002
Phone: 307-777-7626

Wyoming Water Development Office
6920 Yellowtail Rd
Cheyenne, WY 82002
Phone: 307-777-7626


| SUBJECT: |
Appendix A Irrigation Diversion Operation and Description TONGUE RIVER |
| PREPARED BY: | HKM Engineering Inc. |
| DATE: | March 2002 |
TONGUE RIVER
HIGH LINE DITCH DIVERSION
INTERSTATE (PENNOYER) DITCH DIVERSION
OZ & K & HANOVER DITCH DIVERSION
SOUTH SIDE DITCH DIVERSION
TONGUE RIVER NO.1 DITCH DIVERSION
YORK DITCH DIVERSION
TONGUE RIVER DRAINAGE
INTRODUCTION
BACKGROUND
The Tongue River flows out of the northeastern end of the Big Horn Mountains in Wyoming. It gathers the North and South forks in the higher elevations, then drops through a canyon to the foothills and the river valley below, collecting flows of Columbus Creek, Wolf Creek, and Goose Creek before it meanders into Montana to the north.
CHARACTERISTICS
The limestone in the mountain and canyon, where the Tongue gathers its North and South forks, gives way to clay loams, sands, and gravels of old channels. Particularly downstream of Ranchester, the Tongue begins to meander on the landscape and broaden out. Downstream of the Tongue.s confluence with Goose Creek, it widens to 200 yards in places, requiring much ingenuity and investment from anyone who wishes to make a lasting diversion dam.
Though many of the Tongue.s tributaries are stopped at headgates (such as the Alliance Ditch on the Big Goose and Colorado Colony Ditch on the Little Goose), irrigation return flows help to ensure that users downstream on those tributaries receive their allocation. These return flows also keep the Tongue flowing in the driest of water years.
USAGE
The Tongue.s diversions are used primarily for agricultural irrigation, but are also used to supply stock, municipal, and industrial uses.
Regulation
Water commissioners are typically not called to put the main stem of the Tongue and its diversions under regulation.
Agriculture
Agricultural irrigation practices are detailed in the individual ditch memoranda that follow.
The typical irrigation season runs from April 15-May 1 (depending on whether the spring runoff is delayed by colder weather) to early October (depending on when the first snows fall and the ground freezes). Post-season irrigation is not practiced in the Big Goose drainage as a rule because reservoirs are shut off on the first of October.
Double Appropriation
Irrigation water rights with priority dates of March 1, 1945 or earlier are entitled to an additional 1cfs per 70 acres under Wyoming.s surplus water statutes. Whenever the supply in a stream exceeds the amount required to satisfy all existing appropriations established prior to March 1, 1985, the stream is said to be in an excess flow condition and water right holders with priorities between March 2, 1945 and March 1, 1985 may use an additional 1 cfs for each 70 acres irrigated.
On the Tongue River, this practice is limited primarily by the condition of ditches. Most of the ditches are not capable of carrying all of the water an irrigator could use.
Permitted Uses
Permits granted for water appropriation are granted for specific uses. The following pages contain tables of permits and their associated uses. The following table provides a key to those uses:
| Code | Use |
|---|---|
| Chem | Chemical |
| Com | Commercial |
| Cul | Culinary |
| D | Domestic |
| Drl | Drilling |
| Eng | Steam Engines |
| Fire | Fire Protection |
| Fish | Fish Propogation |
| F.C. | Flood Control |
| I | Irrigation |
| Ind | Industrial |
| I.F. | Instream Flow |
| Mech | Mechanical |
| Mfg | Manufacturing |
| Mil | Milling |
| Min | Mining |
| Misc | Miscellaneous |
| Mun | Municipal |
| Oil | Oil Refining or Production |
| P.C. | Pollution Control |
| Power | Power Development |
| R.R. | Railroad |
| Rec | Recreational |
| Ref | Refining |
| Res. Supply | Supply Facility for a Reservoir |
| S | Stock |
| T | Transportation |
WATER RIGHTS
Two water rights summary tables are provided for each diversion serving irrigation referenced here. The first, included in the body of the diversion synopsis, refers to the rights on record with the State Engineer.s Office and is derived from that office.s Tabulation of Adjudicated Surface Water Rights of the State of Wyoming, Water Division Number Two (Oct. 1999).
Because this rights summary is pulled directly from the SEO Tab, the rights cited follow the SEO.s priority order:
| Hierarchy | Format of right | Example |
|---|---|---|
| 1 | Day, Month, Year | 05-15-1884 |
| 2 | Month and Year | 05-00-1884 |
| 3 | Specified Season and Year | Spring 1884 |
| 4 | Year Only | 1884 |
| 5 | Before Year | Before 1884 |
Board orders or court orders may also establish a specific priority.
Irrigated Lands Water Rights Database
The second table, which follows the diversion synopsis, is taken from the irrigated lands water rights database developed for the basin plan. It can be used as a reference with the following caveats: It only lists water rights associated with the irrigated lands polygons mapped by HKM. The table does not include nonirrigation rights devoted to reservoir supply, municipal, fish propagation, etc. The rights on this table are associated only with those irrigated lands identified through the course of this study, both actively irrigated and currently idle.
| Column Heading Key | ||
| PerNo | Permit Number | "Terr" denotes a territorial right. |
| PerSfx | Permit Suffix | D = direct flow |
| E = enlargement | ||
| R = reservoir | ||
| Facility Name | Parantheses denote the former means of conveyance for the water right. | |
| Unit | Flow or volume | CFS = cubic feet per second |
| AF = acre-feet | ||
| GPM = gallons per minute | ||
| SupTyp | Supply Type | OS = original supply |
| SS = supplement supply, for lands having an original supply from another source. | ||
| Sec = secondary supply, for water stored in a reservoir | ||
| Status | Status of adjudication | Adj = adjudicated |
| Una = unadjudicated | ||
| Source | Source water | Parantheses denote the permit number of the related storage right. |
KEY DIVERSIONS
| Diversion: | HIGH LINE DITCH DIVERSION | |||||||||||||||||||||||||||||||||||||||||||||||||||||||||||||||||||
| Date | 12 Sep. 2000 | |||||||||||||||||||||||||||||||||||||||||||||||||||||||||||||||||||
| Note: | As one of the ditches that diverts from the main stem of the Tongue, the High Line Ditch typically does not fall under regulation by the State Engineer.s Office. Nevertheless, irrigators note the presence of a stream gage on the ditch. | 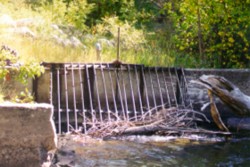
High Line Ditch headgate. | ||||||||||||||||||||||||||||||||||||||||||||||||||||||||||||||||||
| Diversion Description: | Headgate consists of a single, 2.6 x 3.4-foot steel gate in a steel frame operated with a Waterman-type screw, mounted in a concrete headwall, guarded by a large trash rack. | |||||||||||||||||||||||||||||||||||||||||||||||||||||||||||||||||||
| Diversion Location: | The High Line Ditch diversion is located on the main stem of the Tongue
River, adjacent to the Town of Ranchester.s municipal intake at the
mouth of the Tongue River Canyon. | |||||||||||||||||||||||||||||||||||||||||||||||||||||||||||||||||||
| ||||||||||||||||||||||||||||||||||||||||||||||||||||||||||||||||||||
| Conveyance Description: | Approx. 60 mi. long, approx. 2 miles of which are in underground pipe just downstream of the headgate, the remainder of which is open channel canal. | |||||||||||||||||||||||||||||||||||||||||||||||||||||||||||||||||||
| Direct Flow Water Rights: | The summary of direct flow rights follows: | |||||||||||||||||||||||||||||||||||||||||||||||||||||||||||||||||||
Note: Permit No. 167 contains original and supplementary supply sources. | ||||||||||||||||||||||||||||||||||||||||||||||||||||||||||||||||||||
| Associated Storage Rights: | None | |||||||||||||||||||||||||||||||||||||||||||||||||||||||||||||||||||
| Irrigation Practices: | Irrigators tend to use approx. 30 percent hand lines and sideroll sprinklers, 30 percent pivots, and 40 percent ditch-flood irrigation (or .contour flood.) to deliver water to their crops. | |||||||||||||||||||||||||||||||||||||||||||||||||||||||||||||||||||
| Return Flows: | Estimated percentage of total diversion developing into return flows (surface flow only): | |||||||||||||||||||||||||||||||||||||||||||||||||||||||||||||||||||
| ||||||||||||||||||||||||||||||||||||||||||||||||||||||||||||||||||||
| A good estimate of subsurface return flows to the Tongue was not available. | ||||||||||||||||||||||||||||||||||||||||||||||||||||||||||||||||||||
| Losses: | Approx. 15-30 percent by the end of the ditch. The length of the ditch and its path through a variety of substrates running from clay to rock increase the potential for of losses. | |||||||||||||||||||||||||||||||||||||||||||||||||||||||||||||||||||
| References: | Pat Boyd, Water Commissioner, State Engineer.s Office, interview, 12 Sept. 2000 | |||||||||||||||||||||||||||||||||||||||||||||||||||||||||||||||||||
| Greg Benzel, Padlock Ranch Manager, Padlock Ranch, interview, 29 Jan. 2001 | ||||||||||||||||||||||||||||||||||||||||||||||||||||||||||||||||||||
| Don Luse, Padlock Ranch Resource Manager, Padlock Ranch, interview, 29 Jan. 2001 | ||||||||||||||||||||||||||||||||||||||||||||||||||||||||||||||||||||
Irrigated Lands Water Rights Database
| PerNo | PerSfx | Facility Name | Priority | Acres | Amount | Unit | SupTyp | Status | Source |
|---|---|---|---|---|---|---|---|---|---|
| Terr | D | Hepp No. 1 (Highline) | May 2, 1884 | 50 | 0.71 | CFS | OS | Adj | Piney Creek |
| Terr | D | Hepp No. 1 (Highline) | May 2, 1884 | 50 | 0.71 | CFS | OS | Adj | Piney Creek |
| 6675 | D | Highline | May 4, 1905 | 20 | 0.29 | CFS | OS | Una | Piney Creek |
| 6676 | D | Highline | May 4, 1905 | 86 | 1.23 | CFS | OS | Adj | Piney Creek |
| 3154 | E | Enl. Highline | Jan. 3, 1911 | 128 | 1.83 | CFS | OS | Adj | Piney Creek |
| 3154 | E | Enl. Highline | Jan. 3, 1911 | 128 | 1.83 | CFS | OS | Adj | Piney Creek |
| 20325 | D | Highline (Shatt Pipeline) | Jan. 23, 1950 | 3.3 | SS | Adj | Clear Creek | ||
| 20325 | D | Highline (Shatt Pipeline) | Jan. 23, 1950 | 246.4 | 3.52 | CFS | OS | Adj | Clear Creek |
| 20325 | D | Highline (Shatt Pipeline) | Jan. 23, 1950 | 246.4 | 3.52 | CFS | OS | Adj | Clear Creek |
| 20325 | D | Highline (Shatt Pipeline) | Jan. 23, 1950 | 246.4 | 3.52 | CFS | OS | Adj | Clear Creek |
| 5528 | E | Enl. Highline | Feb. 26, 1951 | 41.5 | SS | Una | Jeffers Draw #2 | ||
| 5529 | E | Enl. Highline | Feb. 26, 1951 | 28.4 | SS | Una | Jeffers Draw #3 |
| Name Source District Data |
High Line Ditch Diversion Tongue River 5 Total monthly flow in AF | ||||||||||||
| Water Year | Oct | Nov | Dec | Jan | Feb | Mar | Apr | May | Jun | Jul | Aug | Sep | Total |
|---|---|---|---|---|---|---|---|---|---|---|---|---|---|
| 1970 | 490.00 | 0.00 | 0.00 | 0.00 | 0.00 | 0.00 | 0.00 | 0.00 | 367.00 | 1230.00 | 1130.00 | 797.00 | 4014.00 |
| 1971 | 353.00 | 0.00 | 0.00 | 0.00 | 0.00 | 0.00 | 0.00 | 125.00 | 974.00 | 1380.00 | 1350.00 | 1100.00 | 5282.00 |
| 1972 | 727.00 | 0.00 | 0.00 | 0.00 | 0.00 | 0.00 | 0.00 | 440.00 | 1290.00 | 884.00 | 1090.00 | 1300.00 | 5731.00 |
| 1973 | 266.00 | 0.00 | 0.00 | 0.00 | 0.00 | 0.00 | 0.00 | 74.00 | 1200.00 | 1240.00 | 1330.00 | 671.00 | 4781.00 |
| 1974 | 0.00 | 0.00 | 0.00 | 0.00 | 0.00 | 0.00 | 0.00 | 141.00 | 1290.00 | 1440.00 | 1300.00 | 1100.00 | 5271.00 |
| 1975 | 830.00 | 0.00 | 0.00 | 0.00 | 0.00 | 0.00 | 0.00 | 45.00 | 673.00 | 946.00 | 1260.00 | 1070.00 | 4824.00 |
| 1976 | 480.00 | 0.00 | 0.00 | 0.00 | 0.00 | 0.00 | 0.00 | 446.00 | 1120.00 | 894.00 | 726.00 | 624.00 | 4290.00 |
| 1977 | 96.00 | 0.00 | 0.00 | 0.00 | 0.00 | 0.00 | 0.00 | 1370.00 | 1260.00 | 1230.00 | 1100.00 | 998.00 | 6054.00 |
| 1978 | 83.00 | 0.00 | 0.00 | 0.00 | 0.00 | 0.00 | 0.00 | 0.00 | 392.00 | 1440.00 | 1240.00 | 774.00 | 3929.00 |
| 1979 | 73.00 | 0.00 | 0.00 | 0.00 | 0.00 | 0.00 | 0.00 | 260.00 | 1620.00 | 1420.00 | 1250.00 | 1000.00 | 5623.00 |
| 1980 | 381.00 | 0.00 | 0.00 | 0.00 | 0.00 | 0.00 | 0.00 | 929.00 | 1170.00 | 1470.00 | 1450.00 | 891.00 | 6291.00 |
| 1981 | 373.00 | 0.00 | 0.00 | 0.00 | 0.00 | 0.00 | 511.00 | 845.00 | 238.00 | 1320.00 | 1280.00 | 1230.00 | 5797.00 |
| 1982 | 93.00 | 0.00 | 0.00 | 0.00 | 0.00 | 0.00 | 0.00 | 0.00 | 706.00 | 1070.00 | 1520.00 | 741.00 | 4130.00 |
| 1983 | 197.00 | 18.00 | 0.00 | 0.00 | 0.00 | 0.00 | 0.00 | 723.00 | 1560.00 | 1650.00 | 1700.00 | 1120.00 | 6968.00 |
| 1984 | 393.00 | 0.00 | 0.00 | 0.00 | 0.00 | 0.00 | 0.00 | 149.00 | 1580.00 | 1700.00 | 1540.00 | 1330.00 | 6692.00 |
| 1985 | 430.00 | 83.00 | 0.00 | 0.00 | 0.00 | 0.00 | 0.00 | 1410.00 | 1680.00 | 1710.00 | 1280.00 | 1070.00 | 7663.00 |
| 1986 | 42.00 | 0.00 | 0.00 | 0.00 | 0.00 | 0.00 | 0.00 | 633.00 | 1080.00 | 1390.00 | 1230.00 | 308.00 | 4683.00 |
| 1987 | 0.00 | 0.00 | 0.00 | 0.00 | 0.00 | 0.00 | 0.00 | 1560.00 | 1540.00 | 1280.00 | 1420.00 | 1090.00 | 6890.00 |
| 1988 | 119.00 | 0.00 | 0.00 | 0.00 | 0.00 | 0.00 | 0.00 | 1060.00 | 1490.00 | 1530.00 | 1520.00 | 1020.00 | 6739.00 |
| 1989 | 149.00 | 0.00 | 0.00 | 0.00 | 0.00 | 0.40 | 0.00 | 48.00 | 1270.00 | 1500.00 | 1320.00 | 1030.00 | 5317.40 |
| 1990 | 507.00 | 8.70 | 0.00 | 0.00 | 0.00 | 0.00 | 0.00 | 194.00 | 1300.00 | 1630.00 | 1350.00 | 674.00 | 5663.70 |
| 1991 | 42.00 | 0.00 | 0.00 | 0.00 | 0.00 | 0.00 | 0.00 | 27.00 | 1420.00 | 1360.00 | 1560.00 | 630.00 | 5039.00 |
| 1992 | 124.00 | 0.00 | 0.00 | 0.00 | 0.00 | 0.00 | 0.00 | 1240.00 | 869.00 | 173.00 | 1400.00 | 250.00 | 4056.00 |
| 1993 | 68.00 | 0.00 | 0.00 | 0.00 | 0.00 | 0.00 | 0.00 | 574.00 | 1180.00 | 1020.00 | 1230.00 | 745.00 | 4817.00 |
| 1994 | 59.00 | 0.00 | 0.00 | 0.00 | 0.00 | 0.00 | 0.00 | 772.00 | 1460.00 | 1060.00 | 1220.00 | 959.00 | 5330.00 |
| 1995 | 62.00 | 2.10 | 0.00 | 0.00 | 0.00 | 0.00 | 0.00 | 226.00 | 1050.00 | 1680.00 | 1620.00 | 710.00 | 5350.10 |
| 1996 | 60.00 | 5.80 | 0.00 | 0.00 | 0.00 | 0.00 | 0.00 | 387.00 | 1810.00 | 1900.00 | 1690.00 | 1010.00 | 6862.80 |
| 1997 | 84.00 | 0.00 | 0.00 | 0.00 | 0.00 | 0.00 | 0.00 | 702.00 | 1040.00 | 1200.00 | 950.00 | 722.00 | 4698.00 |
| 1998 | 0.00 | 0.00 | 0.00 | 0.00 | 0.00 | 0.00 | 0.00 | 1670.00 | 1400.00 | 1390.00 | 1110.00 | 847.00 | 6417.00 |
| 1999 | 112.00 | 4.90 | 0.00 | 0.00 | 0.00 | 0.00 | 1.40 | 771.00 | 861.00 | 1070.00 | 1240.00 | 932.00 | 4992.30 |
| Mean | 223.10 | 4.08 | 0.00 | 0.00 | 0.00 | 0.01 | 17.08 | 560.70 | 1163.00 | 1306.90 | 1313.53 | 891.43 | 5479.84 |
| Max | 830.00 | 83.00 | 0.00 | 0.00 | 0.00 | 0.40 | 511.00 | 1670.00 | 1810.00 | 1900.00 | 1700.00 | 1330.00 | 7663.00 |
| Min | 0.00 | 0.00 | 0.00 | 0.00 | 0.00 | 0.00 | 0.00 | 0.00 | 238.00 | 173.00 | 726.00 | 250.00 | 3929.00 |
| Name Source District Data |
High Line Ditch Diversion Tongue River 5 First & Last Dates, Max. Days | ||
| Water Year | First Date of Measurement | Last Date of Measurement | Maximum Days Missing |
|---|---|---|---|
| 1970 | 22-Jun | 11-Oct | 0 |
| 1971 | 26-May | 26-Oct | 0 |
| 1972 | 22-May | 07-Oct | 0 |
| 1973 | 29-May | 26-Sep | 0 |
| 1974 | 26-May | 30-Oct | 0 |
| 1975 | 30-May | 14-Oct | 0 |
| 1976 | 13-May | 05-Oct | 0 |
| 1977 | 01-May | Not Available | |
| 1978 | Not Available | Not Available | |
| 1979 | Not Available | 12-Oct | |
| 1980 | 03-May | 28-Oct | 0 |
| 1981 | 14-Apr | 23-Oct | 0 |
| 1982 | 04-Jun | 04-Nov | 0 |
| 1983 | 05-May | 22-Oct | 0 |
| 1984 | 29-May | 10-Nov | 0 |
| 1985 | 02-May | 22-Oct | 0 |
| 1986 | 19-May | 16-Sep | 0 |
| 1987 | 05-May | 20-Oct | 0 |
| 1988 | 01-May | 06-Oct | 0 |
| 1989 | 06-Mar | 06-Nov | 0 |
| 1990 | 26-May | 12-Oct | 0 |
| 1991 | 30-May | 25-Oct | 0 |
| 1992 | 05-May | 15-Oct | 0 |
| 1993 | 17-May | 13-Oct | 0 |
| 1994 | 12-May | 07-Nov | 0 |
| 1995 | 23-May | 06-Nov | 0 |
| 1996 | 24-May | 08-Oct | 0 |
| 1997 | 19-May | 24-Sep | 0 |
| 1998 | 04-May | 24-Nov | 0 |
| 1999 | 07-Apr | 30-Sep | 0 |
| Avg. | 13-May | 18-Oct | 0 |
| Earliest | 06-Mar | 16-Sep | 0 |
| Latest | 22-Jun | 24-Nov | 0 |
KEY DIVERSIONS
| Diversion: | INTERSTATE(PENNOYER)DITCH DIVERSION | |||||||||||||||||||||||||||||||||||||||||||||||||||||||||||||||||||||||||
| Date | 12 Sep. 2000 | |||||||||||||||||||||||||||||||||||||||||||||||||||||||||||||||||||||||||
| Diversion Description: | Headgate consists of two, 3 x 4.3-foot wood-and-steel gates in steel slides operated with a Waterman-type screw, mounted in a concrete headwall. The structure adjoins a long concrete dam that is raised with 2 x 10-inch boards to push more water through the ditch during critical times. Irrigators also lodge straw bales in the 36-inch?diameter pipe that serves as a high-water bypass when necessary to divert more water. | 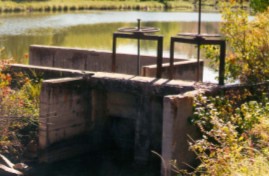
Interstate Ditch headgate. | ||||||||||||||||||||||||||||||||||||||||||||||||||||||||||||||||||||||||
| Diversion Location: | The Interstate Ditch diversion is located on the main stem of the Tongue and is the last diversion from the Tongue before it leaves the state. | |||||||||||||||||||||||||||||||||||||||||||||||||||||||||||||||||||||||||
| ||||||||||||||||||||||||||||||||||||||||||||||||||||||||||||||||||||||||||
| Conveyance Description: | Open channel canal, approx. 9 miles long. | |||||||||||||||||||||||||||||||||||||||||||||||||||||||||||||||||||||||||
| Direct Flow Water Rights: | The summary of direct flow rights follows: | |||||||||||||||||||||||||||||||||||||||||||||||||||||||||||||||||||||||||
Note: The Tongue River and the Interstate Ditch are typically never under regulation. They .take whatever we can get and as much as we can get,. as one irrigator explained. The size of the ditch governs the diversion, allowing for approximately 120 percent of the total rights to be diverted. | ||||||||||||||||||||||||||||||||||||||||||||||||||||||||||||||||||||||||||
| ||||||||||||||||||||||||||||||||||||||||||||||||||||||||||||||||||||||||||
| Associated Storage Rights: | None | |||||||||||||||||||||||||||||||||||||||||||||||||||||||||||||||||||||||||
| Agricultural Practices: | Irrigators plant approx. 25 percent grass, 65 percent alfalfa, and 10 percent oats or barley. | |||||||||||||||||||||||||||||||||||||||||||||||||||||||||||||||||||||||||
| In contrast, 50 years ago, much more of the water and land were devoted to corn for dairy feed. The last dairy in the area closed approx. 20 years ago. | ||||||||||||||||||||||||||||||||||||||||||||||||||||||||||||||||||||||||||
| Irrigation Practices: | Irrigators tend to distribute their allocations with 50 percent sprinkler (14 siderolls and two pivots) and 50 percent ditch-flood irrigation practices. | |||||||||||||||||||||||||||||||||||||||||||||||||||||||||||||||||||||||||
| Return Flows: | Estimated percentage of total diversion developing into return flows: | |||||||||||||||||||||||||||||||||||||||||||||||||||||||||||||||||||||||||
| ||||||||||||||||||||||||||||||||||||||||||||||||||||||||||||||||||||||||||
| Losses: | Approx. 35 percent by the end of the ditch. | |||||||||||||||||||||||||||||||||||||||||||||||||||||||||||||||||||||||||
| References: | Pat Boyd, Water Commissioner, State Engineer.s Office, interview, 12 Sept. 2000 | |||||||||||||||||||||||||||||||||||||||||||||||||||||||||||||||||||||||||
| Chuck Larson, local rancher, interview, 29 Jan. 2001 | ||||||||||||||||||||||||||||||||||||||||||||||||||||||||||||||||||||||||||
Irrigated Lands Water Rights Database
| PerNo | PerSfx | Facility Name | Priority | Acres | Amount | Unit | SupTyp | Status | Source |
|---|---|---|---|---|---|---|---|---|---|
| 2016 | E | Enl. Interstate or Pennoyer | April 25, 1907 | 15 | 0.21 | CFS | OS | Adj | Tongue River |
| 1724 | E | Enl. Interstate or Pennoyer | June 3, 1907 | 388 | 4.48 | CFS | OS | Adj | Tongue River |
| 1724 | E | Enl. Interstate or Pennoyer | June 3, 1907 | 388 | 5.53 | CFS | OS | Adj | Tongue River |
| 5555 | E | Enl. Interstate | April 23, 1951 | 12 | 0.17 | CFS | OS | Adj | Tongue River |
| 5555 | E | Enl. Interstate | April 23, 1951 | 35 | 0 | SS | Adj | Tongue River | |
| 5765 | E | Enl. Interstate | Oct. 20, 1954 | 25 | 0 | SS | Adj | Tongue River | |
| 5767 | E | Enl. Interstate | Oct. 20, 1954 | 25 | 0 | SS | Una | Tongue River | |
| 5798 | E | Enl. Interstate | April 27, 1955 | 56 | 0.8 | CFS | OS | Adj | Tongue River |
| 5798 | E | Enl. Interstate | April 27, 1955 | 91.8 | 0 | SS | Adj | Tongue River | |
| 6226 | E | Enl. Interstate or Pennoyer | March 5, 1963 | 50 | 0 | SS | Adj | Tongue River | |
| 6226 | E | Enl. Interstate or Pennoyer | March 5, 1963 | 69 | 0.99 | CFS | OS | Adj | Tongue River |
| 6206 | E | O'Connor Sprinkler System Enlargement of Interstate or Pennoyer | May 20, 1963 | 41 | 0.58 | CFS | OS | Adj | Tongue River |
| Name Source District Data |
Interstate (Pennoyer) Ditch Diversion Tongue River 5 Total monthly flow in AF | ||||||||||||
| Water Year | Oct | Nov | Dec | Jan | Feb | Mar | Apr | May | Jun | Jul | Aug | Sep | Total |
|---|---|---|---|---|---|---|---|---|---|---|---|---|---|
| 1970 | |||||||||||||
| 1971 | |||||||||||||
| 1972 | |||||||||||||
| 1973 | |||||||||||||
| 1974 | 1466.78 | 1048.24 | 2515.02 | ||||||||||
| 1975 | |||||||||||||
| 1976 | |||||||||||||
| 1977 | |||||||||||||
| 1978 | |||||||||||||
| 1979 | |||||||||||||
| 1980 | |||||||||||||
| 1981 | |||||||||||||
| 1982 | |||||||||||||
| 1983 | |||||||||||||
| 1984 | |||||||||||||
| 1985 | |||||||||||||
| 1986 | |||||||||||||
| 1987 | |||||||||||||
| 1988 | |||||||||||||
| 1989 | |||||||||||||
| 1990 | |||||||||||||
| 1991 | |||||||||||||
| 1992 | |||||||||||||
| 1993 | |||||||||||||
| 1994 | |||||||||||||
| 1995 | |||||||||||||
| 1996 | |||||||||||||
| 1997 | |||||||||||||
| 1998 | |||||||||||||
| 1999 | |||||||||||||
| Mean | 1466.78 | 1048.24 | 2515.02 | ||||||||||
| Max | 1466.78 | 1048.24 | 2515.02 | ||||||||||
| Min | 1466.78 | 1048.24 | 2515.02 | ||||||||||
| Name Source District Data |
Interstate (Pennoyer) Ditch Diversion Tongue River 5 First & Last Dates, Max. Days | ||
| Water Year | First Date of Measurement | Last Date of Measurement | Maximum Days Missing |
|---|---|---|---|
| 1970 | |||
| 1971 | |||
| 1972 | |||
| 1973 | |||
| 1974 | 01-Jul | 31-Aug | 0 |
| 1975 | |||
| 1976 | |||
| 1977 | |||
| 1978 | |||
| 1979 | |||
| 1980 | |||
| 1981 | |||
| 1982 | |||
| 1983 | |||
| 1984 | |||
| 1985 | |||
| 1986 | |||
| 1987 | |||
| 1988 | |||
| 1989 | |||
| 1990 | |||
| 1991 | |||
| 1992 | |||
| 1993 | |||
| 1994 | |||
| 1995 | |||
| 1996 | |||
| 1997 | |||
| 1998 | |||
| 1999 | |||
| Avg. | 01-Jul | 31-Aug | 0 |
| Earliest | 01-Jul | 31-Aug | 0 |
| Latest | 01-Jul | 31-Aug | 0 |
KEY DIVERSIONS
| Diversion: | OZ & K & HANOVER DITCH DIVERSION | |||||||||||||||||||||||||||||||||||||||||||||||||||||||||||||||||||||||||
| Date | 9/12/2000 | |||||||||||||||||||||||||||||||||||||||||||||||||||||||||||||||||||||||||
| Note: | OZ & K Ditch has a bottleneck at a 3-foot-diameter, 70-foot-long flume. It also suffers from maintenance problems, increasing the ditch loss. Fortunately, the ditch crosses primarily clay loams, reduce the seepage losses. | 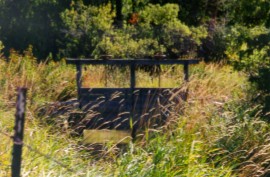 OZ&K & Hanover ditch headgate | ||||||||||||||||||||||||||||||||||||||||||||||||||||||||||||||||||||||||
| Diversion Description: | Headgate consists of two, 5 x 4-foot wood-and-steel gates in steel sliders operated with Waterman-type screws, mounted in a concrete headwall with a bypass gate upstream. | |||||||||||||||||||||||||||||||||||||||||||||||||||||||||||||||||||||||||
| Diversion Location: | The OZ & K diversion is located on the main stem of the Tongue, just outside of Dayton. | |||||||||||||||||||||||||||||||||||||||||||||||||||||||||||||||||||||||||
| ||||||||||||||||||||||||||||||||||||||||||||||||||||||||||||||||||||||||||
| Conveyance Description: | Open channel canal, approx. 10 mi. long. | |||||||||||||||||||||||||||||||||||||||||||||||||||||||||||||||||||||||||
| Direct Flow Water Rights: | The summary of direct flow rights follows: | |||||||||||||||||||||||||||||||||||||||||||||||||||||||||||||||||||||||||
Note: The Hanover Ditch diverts from the OZ & K Ditch. The rights listed above represent a compendium of the rights for the two ditches. | ||||||||||||||||||||||||||||||||||||||||||||||||||||||||||||||||||||||||||
| Associated Storage Rights: | None | |||||||||||||||||||||||||||||||||||||||||||||||||||||||||||||||||||||||||
| Agricultural Practices: | Irrigators tend to work 30 percent alfalfa and 70 percent grass hay. | |||||||||||||||||||||||||||||||||||||||||||||||||||||||||||||||||||||||||
| Irrigation Practices: | Irrigators tend to use approx. 20 percent sprinklers and 80 percent ditch- flood irrigation to serve their crops. | |||||||||||||||||||||||||||||||||||||||||||||||||||||||||||||||||||||||||
| Return Flows: | Irrigators were not able to estimate the return flows for the OZ&K Ditch. | |||||||||||||||||||||||||||||||||||||||||||||||||||||||||||||||||||||||||
| Losses: | Approx. 25 percent by the end of the ditch. | |||||||||||||||||||||||||||||||||||||||||||||||||||||||||||||||||||||||||
| References: | Pat Boyd, Water Commissioner, State Engineer.s Office, interview, 12 Sept. 2000 | |||||||||||||||||||||||||||||||||||||||||||||||||||||||||||||||||||||||||
| Greg Benzel, Padlock Ranch ranch manager, Padlock Ranch, interview, 29 Jan. 2001 | ||||||||||||||||||||||||||||||||||||||||||||||||||||||||||||||||||||||||||
| Don Luse, Padlock Ranch resource manager, Padlock Ranch, interview, 29 Jan. 2001 | ||||||||||||||||||||||||||||||||||||||||||||||||||||||||||||||||||||||||||
Irrigated Lands Water Rights Database
| PerNo | PerSfx | Facility Name | Priority | Acres | Amount | Unit | SupTyp | Status | Source |
|---|---|---|---|---|---|---|---|---|---|
| Terr | D | OZ&K | April 30, 1883 | 1046.5 | 14.95 | CFS | OS | Adj | Tongue River |
| Terr | D | OZ&K 2nd App | June 20, 1888 | 200 | 3.05 | CFS | OS | Adj | Tongue River |
| 90 | D | Hanover (OZ&K, Ranchester Water Works System) | July 6, 1891 | 580 | 21.14 | CFS | OS | Adj | Tongue River |
| 90 | D | Hanover (OZ&K, Ranchester Water Works System) | July 6, 1891 | 580 | 21.14 | CFS | OS | Adj | Tongue River |
| 249 | E | Hanover thru OZ&K | April 24, 1897 | 140 | 2 | CFS | OS | Adj | Tongue River |
| 1838 | E | Enl. OZ&K & Hanover | June 4, 1906 | 256 | 3.64 | CFS | OS | Adj | Tongue River |
| 2993 | E | Enl. OZ&K & Hanover | July 13, 1914 | 224 | 3.2 | CFS | OS | Adj | Tongue River |
| Name Source District Data |
OZ & K & Hanover Ditch Diversion Tongue River 5 Total monthly flow in AF | ||||||||||||
| Water Year | Oct | Nov | Dec | Jan | Feb | Mar | Apr | May | Jun | Jul | Aug | Sep | Total |
|---|---|---|---|---|---|---|---|---|---|---|---|---|---|
| 1970 | |||||||||||||
| 1971 | |||||||||||||
| 1972 | |||||||||||||
| 1973 | |||||||||||||
| 1974 | 157.29 | 1003.70 | 1886.28 | 0.00 | 3047.27 | ||||||||
| 1975 | |||||||||||||
| 1976 | |||||||||||||
| 1977 | |||||||||||||
| 1978 | |||||||||||||
| 1979 | |||||||||||||
| 1980 | |||||||||||||
| 1981 | |||||||||||||
| 1982 | |||||||||||||
| 1983 | |||||||||||||
| 1984 | 1137.74 | 1530.03 | 1678.02 | 1071.07 | 5416.86 | ||||||||
| 1985 | |||||||||||||
| 1986 | |||||||||||||
| 1987 | |||||||||||||
| 1988 | |||||||||||||
| 1989 | |||||||||||||
| 1990 | |||||||||||||
| 1991 | |||||||||||||
| 1992 | |||||||||||||
| 1993 | |||||||||||||
| 1994 | |||||||||||||
| 1995 | |||||||||||||
| 1996 | |||||||||||||
| 1997 | |||||||||||||
| 1999 | |||||||||||||
| 1999 | |||||||||||||
| Mean | 647.52 | 1266.87 | 1782.15 | 535.54 | 4232.07 | ||||||||
| Max | 1137.74 | 1530.03 | 1886.28 | 1071.07 | 5416.86 | ||||||||
| Min | 157.29 | 1003.70 | 1678.02 | 0.00 | 3047.27 | ||||||||
| Name Source District Data |
OZ & K & Hanover Ditch Diversion Tongue River 5 First & Last Dates, Max. Days | ||
| Water Year | First Date of Measurement | Last Date of Measurement | Maximum Days Missing |
|---|---|---|---|
| 1970 | |||
| 1971 | |||
| 1972 | |||
| 1973 | |||
| 1974 | 26-Jun | 31-Aug | 0 |
| 1975 | |||
| 1976 | |||
| 1977 | |||
| 1978 | |||
| 1979 | |||
| 1980 | |||
| 1981 | |||
| 1982 | |||
| 1983 | |||
| 1984 | 11-Jun | 18-Sep | 36 |
| 1985 | |||
| 1986 | |||
| 1987 | |||
| 1988 | |||
| 1989 | |||
| 1990 | |||
| 1991 | |||
| 1992 | |||
| 1993 | |||
| 1994 | |||
| 1995 | |||
| 1996 | |||
| 1997 | |||
| 1998 | |||
| 1999 | |||
| Avg. | 18-Jun | 09-Sep | 18 |
| Earliest | 11-Jun | 31-Aug | 0 |
| Latest | 26-Jun | 18-Sep | 36 |
KEY DIVERSIONS
| Diversion: | SOUTH SIDE DITCH DIVERSION | |||||||||||||||||||||||||||||||||||||||||||||||||||||||||||||||||||
| Date | 9/12/2000 | |||||||||||||||||||||||||||||||||||||||||||||||||||||||||||||||||||
| Diversion Description: | Headgate consists of a single, 5.4 x 2.1-foot wooden gate in steel slides operated with a Waterman-type screw, mounted in a concrete headwall. | 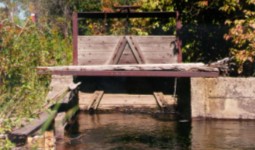
South Side Ditch headgate | ||||||||||||||||||||||||||||||||||||||||||||||||||||||||||||||||||
| Diversion Location: | The South Side Ditch diversion is located on the main stem of the Tongue. | |||||||||||||||||||||||||||||||||||||||||||||||||||||||||||||||||||
| ||||||||||||||||||||||||||||||||||||||||||||||||||||||||||||||||||||
| Conveyance Description: | Open channel canal, approx. 10.6 mi. long. | |||||||||||||||||||||||||||||||||||||||||||||||||||||||||||||||||||
| Direct Flow Water Rights: | The summary of direct flow rights follows: | |||||||||||||||||||||||||||||||||||||||||||||||||||||||||||||||||||
| ||||||||||||||||||||||||||||||||||||||||||||||||||||||||||||||||||||
| Associated Storage Rights: | None | |||||||||||||||||||||||||||||||||||||||||||||||||||||||||||||||||||
| Agricultural Practices: | Irrigators plant approx. 70 percent grass and 30 percent alfalfa. | |||||||||||||||||||||||||||||||||||||||||||||||||||||||||||||||||||
| Irrigation Practices: | Irrigators tend to distribute their allocations with 10 percent sprinkler (hand lines and siderolls) and 90 percent ditch-flood irrigation practices. | |||||||||||||||||||||||||||||||||||||||||||||||||||||||||||||||||||
| Return Flows: | An estimation of the return flows to the Tongue River is not available. | |||||||||||||||||||||||||||||||||||||||||||||||||||||||||||||||||||
| Losses: | Approx. 40 percent by end | |||||||||||||||||||||||||||||||||||||||||||||||||||||||||||||||||||
| References: | Pat Boyd, Water Commissioner, State Engineer.s Office, interview, 12 Sept. 2000 | |||||||||||||||||||||||||||||||||||||||||||||||||||||||||||||||||||
| Greg Benzel, Padlock Ranch ranch manager, Padlock Ranch, interview, 29 Jan. 2001 | ||||||||||||||||||||||||||||||||||||||||||||||||||||||||||||||||||||
| Don Luse, Padlock Ranch resource manager, Padlock Ranch, interview, 29 Jan. 2001 | ||||||||||||||||||||||||||||||||||||||||||||||||||||||||||||||||||||
Irrigated Lands Water Rights Database
| PerNo | PerSfx | Facility Name | Priority | Acres | Amount | Unit | SupTyp | Status | Source |
|---|---|---|---|---|---|---|---|---|---|
| Terr | D | South Side Tongue River | June 20, 1884 | 105 | 1.5 | CFS | OS | Adj | Tongue River |
| Terr | D | Huntington (South Side Tongue River) | Oct. 1, 1884 | 300 | 4.3 | CFS | OS | Adj | Tongue River |
| Terr | D | South Side Tongue River 2nd App | June 20, 1891 | 60 | 0.85 | CFS | OS | Adj | Tongue River |
| 14 | E | Enl. South Side Tongue River | Jan. 26, 1892 | 285 | 4.07 | CFS | OS | Adj | Tongue River |
| 39 | E | Enl. South Side Tongue River | June 2, 1893 | 208 | 2.97 | CFS | OS | Adj | Tongue River |
| 219 | E | Enl. South Side Tongue River (Dayton Mill) | July 30, 1896 | 355 | 5.07 | CFS | OS | Adj | Tongue River |
| 1098 | E | Enl. South Side Tongue River & Dayton | July 30, 1903 | 215 | 3.07 | CFS | OS | Adj | Tongue River |
| 1184 | E | Enl. South Side Tongue River & Dayton | March 4, 1904 | 10 | 0.13 | CFS | OS | Adj | Tongue River |
| 3031 | E | Enl South Side Tongue River & Dayton | Sep. 8, 1914 | 25 | 0.36 | CFS | OS | Adj | Tongue River |
| 6489 | E | Enl. South Side Tongue River | Oct. 9, 1973 | 9 | 0.13 | CFS | OS | Adj | Tongue River |
| 6489 | E | Enl. South Side Tongue River | Oct. 9, 1973 | 4 | 0 | SS | Adj | Tongue River | |
| 301086 | D | White Enl. South Side | March 13, 2000 | 0 | 0 | OS | Una | Tongue River |
| Name Source District Data |
South Side Ditch Diversion Tongue River 5 Total monthly flow in AF | ||||||||||||
| Water Year | Oct | Nov | Dec | Jan | Feb | Mar | Apr | May | Jun | Jul | Aug | Sep | Total |
|---|---|---|---|---|---|---|---|---|---|---|---|---|---|
| 1970 | |||||||||||||
| 1971 | |||||||||||||
| 1972 | |||||||||||||
| 1973 | |||||||||||||
| 1974 | 76.52 | 1104.10 | 1429.29 | 0.00 | 2609.91 | ||||||||
| 1975 | |||||||||||||
| 1976 | |||||||||||||
| 1977 | |||||||||||||
| 1978 | |||||||||||||
| 1979 | |||||||||||||
| 1980 | |||||||||||||
| 1981 | |||||||||||||
| 1982 | |||||||||||||
| 1983 | |||||||||||||
| 1984 | 0.00 | 476.03 | 980.50 | 546.78 | 2003.31 | ||||||||
| 1985 | |||||||||||||
| 1986 | |||||||||||||
| 1987 | |||||||||||||
| 1988 | |||||||||||||
| 1989 | |||||||||||||
| 1990 | |||||||||||||
| 1991 | |||||||||||||
| 1992 | |||||||||||||
| 1993 | |||||||||||||
| 1994 | |||||||||||||
| 1995 | |||||||||||||
| 1996 | |||||||||||||
| 1997 | |||||||||||||
| 1999 | |||||||||||||
| 1999 | |||||||||||||
| Mean | 38.26 | 790.07 | 1204.90 | 273.39 | 2306.61 | ||||||||
| Max | 76.52 | 1104.10 | 1429.29 | 546.78 | 2609.91 | ||||||||
| Min | 0.00 | 476.03 | 980.50 | 0.00 | 2003.31 | ||||||||
| Name Source District Data |
South Side Ditch Diversion Tongue River 5 First & Last Dates, Max. Days | ||
| Water Year | First Date of Measurement | Last Date of Measurement | Maximum Days Missing |
|---|---|---|---|
| 1970 | |||
| 1971 | |||
| 1972 | |||
| 1973 | |||
| 1974 | 26-Jun | 31-Aug | 0 |
| 1975 | |||
| 1976 | |||
| 1977 | |||
| 1978 | |||
| 1979 | |||
| 1980 | |||
| 1981 | |||
| 1982 | |||
| 1983 | |||
| 1984 | 17-Jul | 18-Sep | 27 |
| 1985 | |||
| 1986 | |||
| 1987 | |||
| 1988 | |||
| 1989 | |||
| 1990 | |||
| 1991 | |||
| 1992 | |||
| 1993 | |||
| 1994 | |||
| 1995 | |||
| 1996 | |||
| 1997 | |||
| 1998 | |||
| 1999 | |||
| Avg. | 06-Jul | 09-Sep | 14 |
| Earliest | 26-Jun | 31-Aug | 0 |
| Latest | 17-Jul | 18-Sep | 27 |
KEY DIVERSIONS
| Diversion: | TONGUE RIVER NO. 1 DITCH DIVERSION | |||||||||||||||||||||||||||||||
| Date | 9/12/2000 | |||||||||||||||||||||||||||||||
| Diversion Description: | Headgate consists of a single, 4.6 x 5.1-foot wooden gate in steel slides mounted in a concrete throat operated with a Waterman-type screw. | 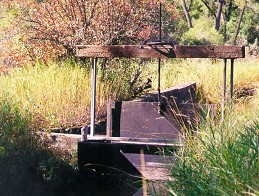 Tongue River No. 1 headgate | ||||||||||||||||||||||||||||||
| Diversion Location: | The Tongue River No. 1 Ditch diversion is located on the main stem of the Tongue. | |||||||||||||||||||||||||||||||
| ||||||||||||||||||||||||||||||||
| Conveyance Description: | Open channel canal, approx. 2.9 mi. long. | |||||||||||||||||||||||||||||||
| Direct Flow Water Rights: | The summary of direct flow rights follows: | |||||||||||||||||||||||||||||||
| ||||||||||||||||||||||||||||||||
| Associated Storage Rights: | None | |||||||||||||||||||||||||||||||
| Agricultural Practices: | Irrigators plant approx. 70 percent grass and 30 percent alfalfa. | |||||||||||||||||||||||||||||||
| Irrigation Practices: | Irrigators tend to distribute their allocations with 10 percent sprinkler (hand lines and siderolls) and 90 percent ditch-flood irrigation practices. | |||||||||||||||||||||||||||||||
| Return Flows: | A good estimation of the return flows to the Tongue River could not be obtained. | |||||||||||||||||||||||||||||||
| Losses: | Unknown | |||||||||||||||||||||||||||||||
| References: | Pat Boyd, Water Commissioner, State Engineer.s Office, interview, 12 Sept. 2000 | |||||||||||||||||||||||||||||||
Irrigated Lands Water Rights Database
| PerNo | PerSfx | Facility Name | Priority | Acres | Amount | Unit | SupTyp | Status | Source |
|---|---|---|---|---|---|---|---|---|---|
| Terr | D | Tongue River No.1 | June 20, 1882 | 495 | 7.02 | CFS | OS | Adj | Tongue River |
| Terr | D | Thorn Bros. Enl Tongue River No. 1 | Sep. 21, 1884 | 35 | 0.5 | CFS | OS | Adj | Tongue River |
| Name Source District Data |
Tongue River No. 1 Ditch Diversion Tongue River 5 Total monthly flow in AF | ||||||||||||
| Water Year | Oct | Nov | Dec | Jan | Feb | Mar | Apr | May | Jun | Jul | Aug | Sep | Total |
|---|---|---|---|---|---|---|---|---|---|---|---|---|---|
| 1970 | |||||||||||||
| 1971 | |||||||||||||
| 1972 | |||||||||||||
| 1973 | |||||||||||||
| 1974 | |||||||||||||
| 1975 | |||||||||||||
| 1976 | |||||||||||||
| 1977 | |||||||||||||
| 1978 | |||||||||||||
| 1979 | |||||||||||||
| 1980 | |||||||||||||
| 1981 | |||||||||||||
| 1982 | |||||||||||||
| 1983 | |||||||||||||
| 1984 | 793.39 | 1155.37 | 1109.09 | 591.74 | 3649.59 | ||||||||
| 1985 | |||||||||||||
| 1986 | |||||||||||||
| 1987 | |||||||||||||
| 1988 | |||||||||||||
| 1989 | |||||||||||||
| 1990 | |||||||||||||
| 1991 | |||||||||||||
| 1992 | |||||||||||||
| 1993 | |||||||||||||
| 1994 | |||||||||||||
| 1995 | |||||||||||||
| 1996 | |||||||||||||
| 1997 | |||||||||||||
| 1999 | |||||||||||||
| 1999 | |||||||||||||
| Mean | 793.39 | 1155.37 | 1109.09 | 591.74 | 3649.59 | ||||||||
| Max | 793.39 | 1155.37 | 1109.09 | 591.74 | 3649.59 | ||||||||
| Min | 793.39 | 1155.37 | 1109.09 | 591.74 | 3649.59 | ||||||||
| Name Source District Data |
Tongue River No. 1 Ditch Diversion Tongue River 5 First & Last Dates, Max. Days | ||
| Water Year | First Date of Measurement | Last Date of Measurement | Maximum Days Missing |
|---|---|---|---|
| 1970 | |||
| 1971 | |||
| 1972 | |||
| 1973 | |||
| 1974 | |||
| 1975 | |||
| 1976 | |||
| 1977 | |||
| 1978 | |||
| 1979 | |||
| 1980 | |||
| 1981 | |||
| 1982 | |||
| 1983 | |||
| 1984 | 11-Jun | 18-Sep | 36 |
| 1985 | |||
| 1986 | |||
| 1987 | |||
| 1988 | |||
| 1989 | |||
| 1990 | |||
| 1991 | |||
| 1992 | |||
| 1993 | |||
| 1994 | |||
| 1995 | |||
| 1996 | |||
| 1997 | |||
| 1998 | |||
| 1999 | |||
| Avg. | 11-Jun | 18-Sep | 36 |
| Earliest | 11-Jun | 18-Sep | 36 |
| Latest | 11-Jun | 18-Sep | 36 |
KEY DIVERSIONS
| Diversion: | YORK DITCH DIVERSION | ||||||||||||||||||||||||||||||||||||||||||||||||||||||||||||
| Date | 12 Sep. 2000 | ||||||||||||||||||||||||||||||||||||||||||||||||||||||||||||
| Diversion Description: | Headgate consists of a single, 6.0 x 2.6-foot steel radial gate mounted in a concrete headwall. The gate is no longer operational from its appearance, and is wired open. The gate is also placed higher than the adjacent river often reaches, reducing the amount of water that can be diverted into the York Ditch. | ||||||||||||||||||||||||||||||||||||||||||||||||||||||||||||
| Diversion Location: | The York Ditch diversion is located on the main stem of the Tongue. | ||||||||||||||||||||||||||||||||||||||||||||||||||||||||||||
| |||||||||||||||||||||||||||||||||||||||||||||||||||||||||||||
| Conveyance Description: | Open channel canal, approx. 7.2 mi. long. | ||||||||||||||||||||||||||||||||||||||||||||||||||||||||||||
| Direct Flow Water Rights: | The summary of direct flow rights follows: | ||||||||||||||||||||||||||||||||||||||||||||||||||||||||||||
| |||||||||||||||||||||||||||||||||||||||||||||||||||||||||||||
| Associated Storage Rights: | None | ||||||||||||||||||||||||||||||||||||||||||||||||||||||||||||
| Agricultural Practices: | Irrigators plant approx. 70 percent grass and 30 percent alfalfa. | ||||||||||||||||||||||||||||||||||||||||||||||||||||||||||||
| Irrigation Practices: | Irrigators tend to distribute their allocations with 10 percent sprinkler (hand lines and siderolls) and 90 percent ditch-flood irrigation practices. | ||||||||||||||||||||||||||||||||||||||||||||||||||||||||||||
| Return Flows: | Estimations of the return flows to the Tongue River were not available. | ||||||||||||||||||||||||||||||||||||||||||||||||||||||||||||
| Losses: | Unknown | ||||||||||||||||||||||||||||||||||||||||||||||||||||||||||||
| References: | Pat Boyd, Water Commissioner, State Engineer.s Office, interview, 12 Sept. 2000 | ||||||||||||||||||||||||||||||||||||||||||||||||||||||||||||
Irrigated Lands Water Rights Database
| PerNo | PerSfx | Facility Name | Priority | Acres | Amount | Unit | SupTyp | Status | Source |
|---|---|---|---|---|---|---|---|---|---|
| 388 | D | York (11 diversion points) | Jan. 16, 1893 | 740 | 10.56 | CFS | OS | Adj | Tongue River |
| 4396 | E | Enl. York | Nov. 30, 1923 | 532.2 | 0 | SS | Adj | Tongue River | |
| 4467 | E | Enl. York | April 10, 1925 | 78.1 | 1.11 | CFS | OS | Adj | Tongue River |
| Name Source District Data |
York Ditch Diversion Tongue River 5 Total monthly flow in AF | ||||||||||||
| Water Year | Oct | Nov | Dec | Jan | Feb | Mar | Apr | May | Jun | Jul | Aug | Sep | Total |
|---|---|---|---|---|---|---|---|---|---|---|---|---|---|
| 1970 | |||||||||||||
| 1971 | |||||||||||||
| 1972 | |||||||||||||
| 1973 | |||||||||||||
| 1974 | 63.31 | 421.21 | 589.41 | 0.00 | 1073.93 | ||||||||
| 1975 | |||||||||||||
| 1976 | |||||||||||||
| 1977 | |||||||||||||
| 1978 | |||||||||||||
| 1979 | |||||||||||||
| 1980 | |||||||||||||
| 1981 | |||||||||||||
| 1982 | |||||||||||||
| 1983 | |||||||||||||
| 1984 | 0.00 | 267.77 | 573.22 | 357.02 | 1198.01 | ||||||||
| 1985 | |||||||||||||
| 1986 | |||||||||||||
| 1987 | |||||||||||||
| 1988 | |||||||||||||
| 1989 | |||||||||||||
| 1990 | |||||||||||||
| 1991 | |||||||||||||
| 1992 | |||||||||||||
| 1993 | |||||||||||||
| 1994 | |||||||||||||
| 1995 | |||||||||||||
| 1996 | |||||||||||||
| 1997 | |||||||||||||
| 1999 | |||||||||||||
| 1999 | |||||||||||||
| Mean | 31.66 | 344.49 | 581.32 | 178.51 | 1135.97 | ||||||||
| Max | 63.31 | 421.21 | 589.41 | 357.02 | 1198.01 | ||||||||
| Min | 0.00 | 267.77 | 573.22 | 0.00 | 1073.93 | ||||||||
| Name Source District Data |
OZ & K & Hanover Ditch Diversion Tongue River 5 First & Last Dates, Max. Days | ||
| Water Year | First Date of Measurement | Last Date of Measurement | Maximum Days Missing |
|---|---|---|---|
| 1970 | |||
| 1971 | |||
| 1972 | |||
| 1973 | |||
| 1974 | 26-Jun | 31-Aug | 0 |
| 1975 | |||
| 1976 | |||
| 1977 | |||
| 1978 | |||
| 1979 | |||
| 1980 | |||
| 1981 | |||
| 1982 | |||
| 1983 | |||
| 1984 | 17-Jul | 18-Sep | 27 |
| 1985 | |||
| 1986 | |||
| 1987 | |||
| 1988 | |||
| 1989 | |||
| 1990 | |||
| 1991 | |||
| 1992 | |||
| 1993 | |||
| 1994 | |||
| 1995 | |||
| 1996 | |||
| 1997 | |||
| 1998 | |||
| 1999 | |||
| Avg. | 06-Jul | 09-Sep | 14 |
| Earliest | 26-Jun | 31-Aug | 0 |
| Latest | 17-Jul | 18-Sep | 27 |