Wyoming State Water Plan
Wyoming State Water Plan
Wyoming Water Development Office
6920 Yellowtail Rd
Cheyenne, WY 82002
Phone: 307-777-7626

Wyoming Water Development Office
6920 Yellowtail Rd
Cheyenne, WY 82002
Phone: 307-777-7626


| SUBJECT: |
Appendix A Irrigation Diversion Operation and Description ROCK CREEK |
| PREPARED BY: | HKM Engineering Inc. |
| DATE: | March 2002 |
ROCK CREEK
HALLIE DITCH DIVERSION
LAKE DESMET (M&M) DITCH DIVERSION
MOWRY BASIN DITCH DIVERSION
PRINCE ALBERT DITCH DIVERSION
ROCK CREEK DRAINAGE
INTRODUCTION
BACKGROUND
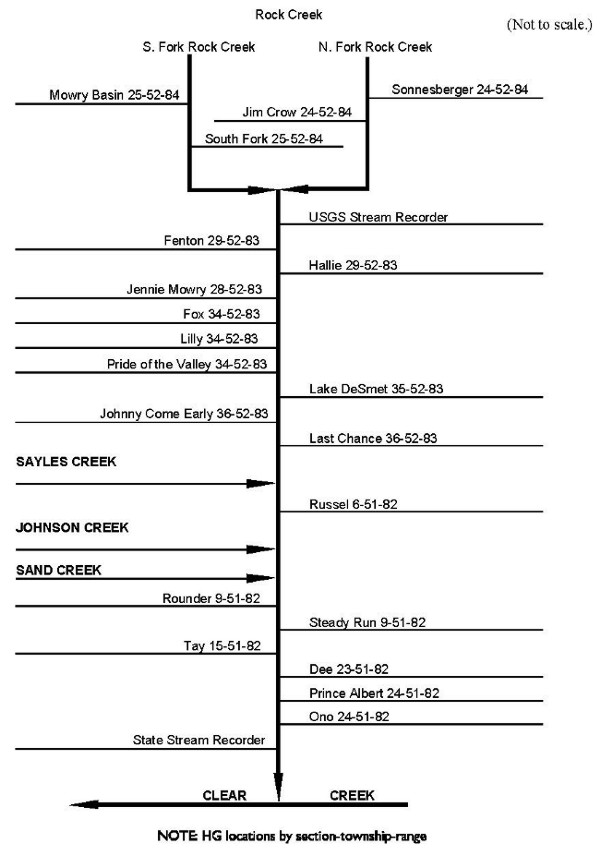
Rock Creek flows out of the east slope of the Bighorn Mountains, beginning on hydrographers. maps as the north and south forks of Rock Creek. Three other, smaller tributaries (Sayles, Johnson, and Sand creeks) join it before it terminates in Clear Creek, which in turn flows into the Powder River. The Powder River crosses the Montana state line north of Spotted Horse, Wyoming.
CHARACTERISTICS
Rock Creek travels steep slopes in its course, much of which are characterized by mountainous seams and the subsurface ducts. As a result, water commissioners estimate that losses (or .shrinkage.) to releases from Willow Park and Cloud Peak reservoirs at 60 percent in a dry year to 40 percent in a wet year. (This reservoir water, used extensively in Rock Creek, is transferred to the North Fork of Rock Creek through the Rock Creek & Piney Ditch Co. Canal.)
USAGE
Rock Creek.s diversions are entirely devoted to agricultural irrigation.
Regulation
Water commissioners estimate that regulation is imposed on Rock Creek drainage diversions with the following timing:
| Wet Year | Average Year | Dry Year |
|---|---|---|
| mid-August | mid-July | mid-June |
Even under regulation, Johnson Creek flows 1-2 cfs.
Agriculture
Growers in the Rock Creek drainage tend to devote approximately 60 percent of their lands to alfalfa, 40 percent to grass hay. They have the following irrigation practices:
Percentage of lands served by irrigation type:
| Flood | Gated Pipe | Sprinklers |
| 25 | 60 | 15 |
The typical irrigation season runs from April 15-May 1 (depending on whether the spring runoff is delayed by colder weather) to early/mid October (depending on when the first snows fall and the ground freezes). Approximately 10 percent of the irrigators using Rock Creek water (the biggest users) practice post-season irrigation, though they usually do not use their entire right to do so.
Double Appropriation
Irrigation water rights with priority dates of March 1, 1945 or earlier are entitled to an additional 1cfs per 70 acres under Wyoming.s surplus water statutes. Whenever the supply in a stream exceeds to amount required to satisfy all existing appropriations established prior to March 1, 1985, the stream is said to be in an excess flow condition and water right holders with priorities between March 2, 1945 and March 1, 1985 may use an additional 1 cfs for each 70 acres irrigated.
In Rock Creek, this practice is limited primarily by the condition of ditches. Many of the ditches are not capable of carrying all of the water an irrigator could use.
| % of appropriation | % of ditches in drainage capable of flow |
|---|---|
| 200 | 20 |
| 150 | 60 |
| 100-150 | 90 |
| 0-100 | 90 |
Permitted Uses
Permits granted for water appropriation are granted for specific uses. The following pages contain tables of permits and their associated uses. The following table provides a key to those uses:
| Code | Use |
|---|---|
| Chem | Chemical |
| Com | Commercial |
| Cul | Culinary |
| D | Domestic |
| Drl | Drilling |
| Eng | Steam Engines |
| Fire | Fire Protection |
| Fish | Fish Propogation |
| F.C. | Flood Control |
| I | Irrigation |
| Ind | Industrial |
| I.F. | Instream Flow |
| Mech | Mechanical |
| Mfg | Manufacturing |
| Mil | Milling |
| Min | Mining |
| Misc | Miscellaneous |
| Mun | Municipal |
| Oil | Oil Refining or Production |
| P.C. | Pollution Control |
| Power | Power Development |
| R.R. | Railroad |
| Rec | Recreational |
| Ref | Refining |
| Res. Supply | Supply Facility for a Reservoir |
| S | Stock |
| T | Transportation |
WATER RIGHTS
Two water rights summary tables are provided for each diversion serving irrigation referenced here. The first, included in the body of the diversion synopsis, refers to the rights on record with the State Engineer.s Office and is derived from that office.s Tabulation of Adjudicated Surface Water Rights of the State of Wyoming, Water Division Number Two (Oct. 1999).
Because this rights summary is pulled directly from the SEO Tab, the rights cited follow the SEO.s priority order:
| Hierarchy | Format of right | Example |
|---|---|---|
| 1 | Day, Month, Year | 05-15-1884 |
| 2 | Month and Year | 05-00-1884 |
| 3 | Specified Season and Year | Spring 1884 |
| 4 | Year Only | 1884 |
| 5 | Before Year | Before 1884 |
Board orders or court orders may also establish a specific priority.
Irrigated Lands Water Rights Database
The second table, which follows the diversion synopsis, is taken from the irrigated lands water rights database developed for the basin plan. It can be used as a reference with the following caveats: It only lists water rights associated with the irrigated lands polygons mapped by HKM. The table does not include nonirrigation rights devoted to reservoir supply, municipal, fish propagation, etc. The rights on this table are associated only with those irrigated lands identified through the course of this study, both actively irrigated and currently idle.
| Column Heading Key | ||
| PerNo | Permit Number | "Terr" denotes a territorial right. |
| PerSfx | Permit Suffix | D = direct flow |
| E = enlargement | ||
| R = reservoir | ||
| Facility Name | Parantheses denote the former means of conveyance for the water right. | |
| Unit | Flow or volume | CFS = cubic feet per second |
| AF = acre-feet | ||
| GPM = gallons per minute | ||
| SupTyp | Supply Type | OS = original supply |
| SS = supplement supply, for lands having an original supply from another source. | ||
| Sec = secondary supply, for water stored in a reservoir | ||
| Status | Status of adjudication | Adj = adjudicated |
| Una = unadjudicated | ||
| Source | Source water | Parantheses denote the permit number of the related storage right. |
Schematic of Rock Creek stream and diversions:
KEY DIVERSIONS
| Diversion: | HALLIE DITCH DIVERSION | 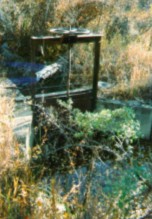 Hallie Ditch headgate | ||||||||||||||||||||||||||||||||||||||||||||||||
| Date | 18 Oct. 2000 | |||||||||||||||||||||||||||||||||||||||||||||||||
| Diversion Description: | Headgate consists of a single, 4.5 x 4.8-foot steel gate in steel slides operated with a Waterman-type screw, mounted in a concrete headwall. The headgate is in good condition. | |||||||||||||||||||||||||||||||||||||||||||||||||
| Diversion Location: | The Hallie Ditch diversion is located on the main stem of Rock Creek, between the confluences of the South and North forks and the of Rock and Sayles creeks. | |||||||||||||||||||||||||||||||||||||||||||||||||
|
 Hallie Ditch flume | |||||||||||||||||||||||||||||||||||||||||||||||||
| Conveyance Description: | Open channel canal, approximately 6.1 mi. long. | |||||||||||||||||||||||||||||||||||||||||||||||||
| Direct Flow Water Rights: | The summary for direct flow rights follows: | |||||||||||||||||||||||||||||||||||||||||||||||||
Irrigators on the Hallie Ditch take advantage of the Double Appropriation Doctrine. | ||||||||||||||||||||||||||||||||||||||||||||||||||
| Associated Storage Rights: | Irrigators on Hallie Ditch use stored water from Willow and Cloud Peak reservoirs. | |||||||||||||||||||||||||||||||||||||||||||||||||
| Irrigation Practices: | See introduction to Rock Creek drainage above | |||||||||||||||||||||||||||||||||||||||||||||||||
| Return Flows: | Estimated percentage of total diversion developing into return flows: | |||||||||||||||||||||||||||||||||||||||||||||||||
| ||||||||||||||||||||||||||||||||||||||||||||||||||
| Losses: | 25 percent by the end of the ditch | |||||||||||||||||||||||||||||||||||||||||||||||||
| References: | Carmine LoGuidice, water commissioner, State Engineer.s Office, interview, 18 Oct. 2000 | |||||||||||||||||||||||||||||||||||||||||||||||||
Irrigated Lands Water Rights Database
| PerNo | PerSfx | Facility Name | Priority | Acres | Amount | Unit | SupTyp | Status | Source |
|---|---|---|---|---|---|---|---|---|---|
| Terr | D | Hallie | April 10, 1886 | 1320.3 | 18.84 | CFS | OS | Adj | Rock Creek |
| 659 | E | Enl. Hallie | May 4, 1901 | 320 | 4.57 | CFS | OS | Adj | Rock Creek |
| 2531 | E | Enl. Kempton (Hallie) | Aug. 21, 1911 | 24 | 0.34 | CFS | OS | Adj | Rock Creek |
| Name Source District Data |
Hallie Ditch Diversion Rock Creek 3 Total monthly flow in AF | ||||||||||||
| Water Year | Oct | Nov | Dec | Jan | Feb | Mar | Apr | May | Jun | Jul | Aug | Sep | Total |
|---|---|---|---|---|---|---|---|---|---|---|---|---|---|
| 1970 | |||||||||||||
| 1971 | 0.00 | 228.69 | 799.02 | 562.95 | 547.54 | 388.40 | 2526.60 | ||||||
| 1972 | 0.00 | 261.64 | 1104.34 | 642.94 | 615.55 | 635.90 | 3260.37 | ||||||
| 1973 | 0.00 | 258.39 | 1324.16 | 421.47 | 737.04 | 487.34 | 3228.40 | ||||||
| 1974 | 20.89 | 924.14 | 1143.71 | 611.48 | 407.03 | 237.26 | 3344.51 | ||||||
| 1975 | 0.00 | 0.00 | 0.00 | 422.24 | 436.76 | 448.54 | 1307.54 | ||||||
| 1976 | |||||||||||||
| 1977 | 0.00 | 604.40 | 1026.85 | 532.26 | 0.00 | 0.00 | 2163.51 | ||||||
| 1978 | 0.00 | 0.00 | 0.00 | 511.14 | 498.15 | 439.62 | 1448.91 | ||||||
| 1979 | |||||||||||||
| 1980 | 0.00 | 193.00 | 633.00 | 255.00 | 552.00 | 0.00 | 1633.00 | ||||||
| 1981 | 0.00 | 333.00 | 720.00 | 372.00 | 349.00 | 232.00 | 2006.00 | ||||||
| 1982 | 0.00 | 34.40 | 750.00 | 810.00 | 260.00 | 400.00 | 2254.40 | ||||||
| 1983 | 0.00 | 0.00 | 846.00 | 567.00 | 507.00 | 225.00 | 2145.00 | ||||||
| 1984 | 0.00 | 0.00 | 400.00 | 846.00 | 248.00 | 401.00 | 1895.00 | ||||||
| 1985 | 0.00 | 287.00 | 821.00 | 345.00 | 404.00 | 351.00 | 2208.00 | ||||||
| 1986 | 122.00 | 689.00 | 803.00 | 800.00 | 246.00 | 414.00 | 3074.00 | ||||||
| 1987 | 0.00 | 541.47 | 611.48 | 473.86 | 473.00 | 542.00 | 2641.81 | ||||||
| 1988 | 0.00 | 0.00 | 541.50 | 240.60 | 159.60 | 114.70 | 1056.40 | ||||||
| 1989 | 0.00 | 683.10 | 612.40 | 492.90 | 528.80 | 238.20 | 2555.40 | ||||||
| 1990 | 0.00 | 32.91 | 951.25 | 531.74 | 335.03 | 253.83 | 2104.76 | ||||||
| 1991 | 0.00 | 55.70 | 605.70 | 563.90 | 355.70 | 192.50 | 1773.50 | ||||||
| 1992 | 0.00 | 597.80 | 787.90 | 467.90 | 422.00 | 266.50 | 2542.10 | ||||||
| 1993 | 0.00 | 0.00 | 246.90 | 289.00 | 444.70 | 455.60 | 1436.20 | ||||||
| 1994 | 3.80 | 365.40 | 538.90 | 378.50 | 320.70 | 163.40 | 1770.70 | ||||||
| 1995 | 48.20 | 86.30 | 433.00 | 436.30 | 299.40 | 311.60 | 1614.80 | ||||||
| 1996 | 0.00 | 312.80 | 926.90 | 475.10 | 287.30 | 418.00 | 2420.10 | ||||||
| 1997 | 0.00 | 464.90 | 422.80 | 130.00 | 77.70 | 49.30 | 1144.70 | ||||||
| 1998 | 0.00 | 437.30 | 959.90 | 712.50 | 739.00 | 390.90 | 3239.60 | ||||||
| 1999 | 0.00 | 34.10 | 268.10 | 398.90 | 466.70 | 372.20 | 1540.00 | ||||||
| Mean | 7.22 | 275.02 | 676.96 | 492.25 | 396.95 | 312.18 | 2160.57 | ||||||
| Max | 122.00 | 924.14 | 1324.16 | 846.00 | 739.00 | 635.90 | 3344.51 | ||||||
| Min | 0.00 | 0.00 | 0.00 | 130.00 | 0.00 | 0.00 | 1056.40 | ||||||
| Name Source District Data |
Hallie Ditch Diversion Rock Creek 3 First & Last Dates, Max. Days | ||
| Water Year | First Date of Measurement | Last Date of Measurement | Maximum Days Missing |
|---|---|---|---|
| 1970 | |||
| 1971 | 24-May | 30-Sep | 0 |
| 1972 | 10-May | 30-Sep | 0 |
| 1973 | 22-May | 30-Sep | 0 |
| 1974 | 28-Apr | 30-Sep | 0 |
| 1975 | 07-Jul | 30-Sep | 0 |
| 1976 | |||
| 1977 | 17-May | 31-Jul | 27 |
| 1978 | 11-Jul | 30-Sep | 0 |
| 1979 | |||
| 1980 | 11-May | 29-Aug | 0 |
| 1981 | 01-May | 30-Sep | 0 |
| 1982 | 24-May | 30-Sep | 0 |
| 1983 | 01-Jun | 30-Sep | 0 |
| 1984 | 11-Jun | 30-Sep | 0 |
| 1985 | 23-May | 30-Sep | 0 |
| 1986 | 09-Apr | 25-Sep | 0 |
| 1987 | 14-May | 30-Sep | 44 |
| 1988 | 06-Jun | 30-Sep | 0 |
| 1989 | 10-May | 30-Sep | 0 |
| 1990 | 31-May | 30-Sep | 0 |
| 1991 | 29-May | 30-Sep | 0 |
| 1992 | 05-May | 30-Sep | 0 |
| 1993 | 14-Jun | 30-Sep | 0 |
| 1994 | 30-Apr | 30-Sep | 0 |
| 1995 | 19-Apr | 30-Sep | 0 |
| 1996 | 01-May | 30-Sep | 0 |
| 1997 | 16-May | 30-Sep | 0 |
| 1998 | 05-May | 30-Sep | 0 |
| 1999 | 26-May | 30-Sep | 0 |
| Avg. | 19-May | 26-Sep | 3 |
| Earliest | 09-Apr | 31-Jul | 0 |
| Latest | 11-Jul | 30-Sep | 44 |
KEY DIVERSIONS
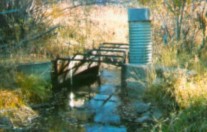
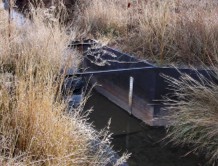
| Diversion: | LAKE DESMET (M&M) DITCH DIVERSION | 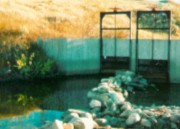 Lake DeSmet Ditch headgate | ||||||||||||||||||||||||||||||||||||||||||||||||||||||||||||||||||
| Date | 18 Oct. 2000 | |||||||||||||||||||||||||||||||||||||||||||||||||||||||||||||||||||
| Diversion Description: | Headgate consists of two, 5.5 x 4.5-foot steel gates in steel slides operated with Waterman-type screws, mounted in a concrete headwall. The structure adjoins a rock dam. The diversion is in excellent condition. | |||||||||||||||||||||||||||||||||||||||||||||||||||||||||||||||||||
| Diversion Location: | The Lake DeSmet Ditch diversion is located on the main stem of Rock Creek, between the confluence of the South and North forks and the confluence of Rock and Sayles creeks. | 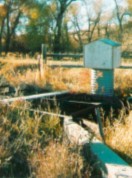 Lake DeSmet Ditch flume | ||||||||||||||||||||||||||||||||||||||||||||||||||||||||||||||||||
| ||||||||||||||||||||||||||||||||||||||||||||||||||||||||||||||||||||
| Conveyance Description: | Open channel canal, approximately 9.2 mi. long, with approximately 400 feet in a siphon. | |||||||||||||||||||||||||||||||||||||||||||||||||||||||||||||||||||
| Direct Flow Water Rights: | The summary for direct flow rights follows: | |||||||||||||||||||||||||||||||||||||||||||||||||||||||||||||||||||
Much of the water carried by this ditch is actually from South Piney Creek. The maximum appropriation carried by the Lake DeSmet Ditch is approximately 58 percent (54 cfs). The condition of the ditch precludes larger flows. | ||||||||||||||||||||||||||||||||||||||||||||||||||||||||||||||||||||
| Associated Storage Rights: | Irrigators on Lake DeSmet Ditch use stored water from Willow and Cloud Peak reservoirs. | |||||||||||||||||||||||||||||||||||||||||||||||||||||||||||||||||||
| Irrigation Practices: | See introduction to Rock Creek drainage above | |||||||||||||||||||||||||||||||||||||||||||||||||||||||||||||||||||
| Return Flows: | Estimated percentage of total diversion developing into return flows: | |||||||||||||||||||||||||||||||||||||||||||||||||||||||||||||||||||
| ||||||||||||||||||||||||||||||||||||||||||||||||||||||||||||||||||||
| Losses: | Approximately 5 percent by the end of the ditch | |||||||||||||||||||||||||||||||||||||||||||||||||||||||||||||||||||
| References: | Carmine LoGuidice, water commissioner, State Engineer.s Office, interview, 18 Oct. 2000 | |||||||||||||||||||||||||||||||||||||||||||||||||||||||||||||||||||
Irrigated Lands Water Rights Database
| PerNo | PerSfx | Facility Name | Priority | Acres | Amount | Unit | SupTyp | Status | Source |
|---|---|---|---|---|---|---|---|---|---|
| Terr | D | Lake DeSmet | Oct. 31, 1884 | 5038.7 | 71.98 | CFS | OS | Adj | Rock Creek |
| 815 | E | Enl. Lake DeSmet | April 19, 1902 | 359 | 5.12 | CFS | OS | Adj | Rock Creek |
| Name Source District Data |
Lake DeSmet (M&M) Ditch Diversion Rock Creek 3 Total monthly flow in AF | ||||||||||||
| Water Year | Oct | Nov | Dec | Jan | Feb | Mar | Apr | May | Jun | Jul | Aug | Sep | Total |
|---|---|---|---|---|---|---|---|---|---|---|---|---|---|
| 1970 | |||||||||||||
| 1971 | 475.40 | 2287.73 | 2162.78 | 1372.36 | 1423.34 | 841.31 | 8562.92 | ||||||
| 1972 | 113.36 | 1385.51 | 2269.09 | 1630.61 | 1426.91 | 286.04 | 7111.52 | ||||||
| 1973 | 418.67 | 1583.48 | 2742.94 | 1591.73 | 1186.31 | 676.94 | 8200.07 | ||||||
| 1974 | 117.46 | 1975.81 | 2162.78 | 1619.70 | 1414.21 | 571.04 | 7861.00 | ||||||
| 1975 | 0.00 | 0.00 | 0.00 | 2280.73 | 1878.74 | 0.00 | 4159.47 | ||||||
| 1976 | |||||||||||||
| 1977 | 0.00 | 1496.03 | 1556.43 | 1357.43 | 957.04 | 180.04 | 5546.97 | ||||||
| 1978 | 238.31 | 661.65 | 1123.04 | 1257.62 | 1640.27 | 568.66 | 5489.55 | ||||||
| 1979 | |||||||||||||
| 1980 | 266.00 | 1680.00 | 1665.00 | 1230.00 | 1051.00 | 366.00 | 6258.00 | ||||||
| 1981 | 116.00 | 984.00 | 1662.00 | 1413.00 | 1032.00 | 505.00 | 5712.00 | ||||||
| 1982 | 190.00 | 700.00 | 1880.00 | 1510.00 | 1120.00 | 670.00 | 6070.00 | ||||||
| 1983 | 433.00 | 701.00 | 1760.00 | 1120.00 | 990.00 | 940.00 | 5944.00 | ||||||
| 1984 | 0.00 | 725.00 | 969.00 | 1033.00 | 1570.00 | 764.00 | 5061.00 | ||||||
| 1985 | 0.00 | 0.00 | 1451.00 | 1073.00 | 1308.00 | 348.00 | 4180.00 | ||||||
| 1986 | 0.00 | 1877.00 | 2001.00 | 1160.00 | 1078.00 | 1365.00 | 7481.00 | ||||||
| 1987 | 277.00 | 1992.00 | 1430.00 | 973.00 | 901.00 | 964.00 | 6537.00 | ||||||
| 1988 | 287.40 | 1353.70 | 1942.60 | 1401.30 | 633.50 | 120.00 | 5738.50 | ||||||
| 1989 | 160.60 | 424.40 | 1709.90 | 1398.10 | 691.90 | 397.30 | 4782.20 | ||||||
| 1990 | 286.60 | 1505.44 | 1692.62 | 1276.36 | 1313.49 | 530.39 | 6604.90 | ||||||
| 1991 | 237.90 | 965.70 | 1577.50 | 1020.90 | 954.80 | 406.60 | 5163.40 | ||||||
| 1992 | 210.60 | 1317.60 | 1001.40 | 744.00 | 620.30 | 746.70 | 4640.60 | ||||||
| 1993 | 53.50 | 1405.10 | 1209.40 | 526.80 | 601.40 | 393.20 | 4189.40 | ||||||
| 1994 | 80.10 | 1034.40 | 1368.30 | 819.40 | 432.80 | 27.70 | 3762.70 | ||||||
| 1995 | 0.00 | 102.70 | 1138.80 | 562.00 | 676.30 | 366.90 | 2846.70 | ||||||
| 1996 | 0.00 | 1188.90 | 1935.90 | 666.40 | 488.10 | 380.10 | 4659.40 | ||||||
| 1997 | 0.00 | 792.10 | 957.20 | 507.70 | 375.20 | 435.20 | 3067.40 | ||||||
| 1998 | 0.00 | 1225.60 | 2186.90 | 823.80 | 929.30 | 305.20 | 5470.80 | ||||||
| 1999 | 0.00 | 317.80 | 1333.00 | 614.70 | 982.20 | 466.00 | 3713.70 | ||||||
| Mean | 146.74 | 1099.36 | 1588.47 | 1147.54 | 1025.04 | 504.49 | 5511.64 | ||||||
| Max | 475.40 | 2287.73 | 2742.94 | 2280.73 | 1878.74 | 1365.00 | 8562.92 | ||||||
| Min | 0.00 | 0.00 | 0.00 | 507.70 | 375.20 | 0.00 | 2846.70 | ||||||
| Name Source District Data |
Lake DeSmet (M&M) Ditch Diversion Rock Creek 3 First & Last Dates, Max. Days | ||
| Water Year | First Date of Measurement | Last Date of Measurement | Maximum Days Missing |
|---|---|---|---|
| 1970 | |||
| 1971 | 04-Apr | 30-Sep | 0 |
| 1972 | 19-Apr | 16-Sep | 0 |
| 1973 | 10-Apr | 30-Sep | 0 |
| 1974 | 27-Apr | 30-Sep | 0 |
| 1975 | 01-Jul | 31-Aug | 0 |
| 1976 | |||
| 1977 | 01-May | 30-Sep | 0 |
| 1978 | 18-Apr | 30-Sep | 0 |
| 1979 | |||
| 1980 | 01-Apr | 30-Sep | 0 |
| 1981 | 01-Apr | 30-Sep | 0 |
| 1982 | 14-Apr | 30-Sep | 0 |
| 1983 | 01-Apr | 30-Sep | 0 |
| 1984 | 18-May | 30-Sep | 0 |
| 1985 | 06-Jun | 30-Sep | 0 |
| 1986 | 01-May | 30-Sep | 0 |
| 1987 | 10-Apr | 30-Sep | 44 |
| 1988 | 12-Apr | 30-Sep | 0 |
| 1989 | 11-Apr | 30-Sep | 0 |
| 1990 | 05-Apr | 30-Sep | 0 |
| 1991 | 02-Apr | 30-Sep | 0 |
| 1992 | 01-Apr | 30-Sep | 0 |
| 1993 | 16-Apr | 30-Sep | 0 |
| 1994 | 20-Apr | 15-Sep | 0 |
| 1995 | 19-May | 30-Sep | 0 |
| 1996 | 14-May | 30-Sep | 0 |
| 1997 | 13-May | 30-Sep | 0 |
| 1998 | 06-May | 24-Sep | 0 |
| 1999 | 07-May | 30-Sep | 0 |
| Avg. | 24-Apr | 27-Sep | 0 |
| Earliest | 01-Apr | 31-Aug | 0 |
| Latest | 01-Jul | 30-Sep | 0 |
KEY DIVERSIONS
| Diversion: | MOWRY BASIN DITCH DIVERSION | 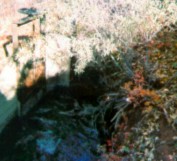 Mowry Basin headgate | ||||||||||||||||||||||||||||||||||||||||||||||||||||||
| Date | 18 Oct. 2000 | |||||||||||||||||||||||||||||||||||||||||||||||||||||||
| Diversion Description: | Headgate consists of a single, 3.5 x 1.2-foot steel gate in steel slides operated with a Waterman-type screw, mounted in a concrete headwall. | |||||||||||||||||||||||||||||||||||||||||||||||||||||||
| Diversion Location: | The Mowry Basin Ditch diversion is located on the South Fork of Rock Creek. | |||||||||||||||||||||||||||||||||||||||||||||||||||||||
|
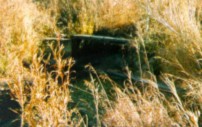 Mowry Basin flume | |||||||||||||||||||||||||||||||||||||||||||||||||||||||
| Conveyance Description: | Canal, approximately 2.4 mi. long, with approximately 450 ft. of length in pipe. | |||||||||||||||||||||||||||||||||||||||||||||||||||||||
| Direct Flow Water Rights: | The summary for direct flow rights follows: | |||||||||||||||||||||||||||||||||||||||||||||||||||||||
| ||||||||||||||||||||||||||||||||||||||||||||||||||||||||
| Associated Storage Rights: | Irrigators on Mowry Basin Ditch have arranged an exchange for water stored in Cloud Peak Reservoir. | |||||||||||||||||||||||||||||||||||||||||||||||||||||||
| Irrigation Practices: | See Rock Creek summary above | |||||||||||||||||||||||||||||||||||||||||||||||||||||||
| ||||||||||||||||||||||||||||||||||||||||||||||||||||||||
| Losses: | Approximately 5 percent by the end of the ditch | |||||||||||||||||||||||||||||||||||||||||||||||||||||||
| References: | Carmine LoGuidice, water commissioner, State Engineer.s Office, interview, 18 Oct. 2000 | |||||||||||||||||||||||||||||||||||||||||||||||||||||||
Irrigated Lands Water Rights Database
| PerNo | PerSfx | Facility Name | Priority | Acres | Amount | Unit | SupTyp | Status | Source |
|---|---|---|---|---|---|---|---|---|---|
| Terr | D | Mowry Basin (Fenton) | Oct. 20, 1884 | 80 | 1.14 | CFS | OS | Adj | South Fork Rock Creek |
| Terr | D | Mowry Basin, 2nd App. | Dec. 31, 1887 | 312 | 4.46 | CFS | OS | Adj | South Fork Rock Creek |
| Terr | D | Mowry Basin | Dec. 31, 1887 | 40 | 0.57 | CFS | OS | Adj | South Fork Rock Creek |
| 1900 | E | Enl. Fenton (Mowry Basin) | June 1, 1908 | 120 | 1.71 | CFS | OS | Adj | Rock Creek |
| 2390 | E | Enl. Mowry Basin | July 25, 1910 | 382.7 | 5.46 | CFS | OS | Adj | South Fork Rock Creek |
| 2460 | E | Enl. Mowry Basin | April 20, 1911 | 111.6 | 1.59 | CFS | OS | Adj | South Fork Rock Creek |
| 4015 | E | Enl. Mowry Basin | June 30, 1919 | 456 | 0 | Sec | Adj | Mowry Basin (1355R) | |
| 303201 | D | Love Enl. Mowry Basin | Nov. 9, 2000 | 0 | 0 | OS | Una | South Fork Rock Creek |
| Name Source District Data |
Mowry Basin Ditch Diversion Rock Creek 3 Total monthly flow in AF | ||||||||||||
| Water Year | Oct | Nov | Dec | Jan | Feb | Mar | Apr | May | Jun | Jul | Aug | Sep | Total |
|---|---|---|---|---|---|---|---|---|---|---|---|---|---|
| 1970 | |||||||||||||
| 1971 | |||||||||||||
| 1972 | |||||||||||||
| 1973 | |||||||||||||
| 1974 | |||||||||||||
| 1975 | |||||||||||||
| 1976 | |||||||||||||
| 1977 | |||||||||||||
| 1978 | |||||||||||||
| 1979 | |||||||||||||
| 1980 | |||||||||||||
| 1981 | 521.86 | 406.12 | 293.08 | 292.67 | 82.57 | 1596.30 | |||||||
| 1982 | 50.34 | 503.40 | 432.71 | 249.02 | 88.36 | 1323.83 | |||||||
| 1983 | 117.46 | 503.40 | 450.97 | 289.61 | 149.56 | 1511.00 | |||||||
| 1984 | 0.00 | 238.02 | 678.51 | 339.94 | 80.33 | 1336.80 | |||||||
| 1985 | |||||||||||||
| 1986 | 0.00 | 733.96 | 482.17 | 265.01 | 128.23 | 1609.37 | |||||||
| 1987 | 0.00 | 344.07 | 244.40 | 0.00 | 0.00 | 588.47 | |||||||
| 1988 | 0.00 | 48.10 | 221.53 | 175.85 | 73.75 | 519.23 | |||||||
| 1989 | |||||||||||||
| 1990 | 280.88 | 434.55 | 527.44 | 441.78 | 11.66 | 1696.31 | |||||||
| 1991 | 79.46 | 301.01 | 354.53 | 374.01 | 15.53 | 1124.54 | |||||||
| 1992 | 0.00 | 0.00 | 33.02 | 368.40 | 82.36 | 483.78 | |||||||
| 1993 | 317.42 | 85.51 | 198.81 | 354.18 | 33.80 | 989.72 | |||||||
| 1994 | 237.38 | 327.30 | 247.52 | 196.06 | 0.00 | 1008.26 | |||||||
| 1995 | 155.34 | 361.68 | 139.60 | 285.53 | 92.81 | 1034.96 | |||||||
| 1996 | 20.45 | 230.91 | 251.44 | 245.95 | 82.81 | 831.56 | |||||||
| 1997 | 128.08 | 214.91 | 149.95 | 155.29 | 0.00 | 648.23 | |||||||
| 1998 | 570.85 | 621.95 | 230.62 | 152.85 | 224.68 | 1800.95 | |||||||
| 1999 | 0.00 | 198.33 | 444.40 | 240.91 | 10.71 | 894.35 | |||||||
| Mean | 145.85 | 326.66 | 316.51 | 260.42 | 68.07 | 1117.51 | |||||||
| Max | 570.85 | 733.96 | 678.51 | 441.78 | 224.68 | 1800.95 | |||||||
| Min | 0.00 | 0.00 | 33.02 | 0.00 | 0.00 | 438.78 | |||||||
| Name Source District Data |
Mowry Basin Ditch Diversion Rock Creek 3 First & Last Dates, Max. Days | ||
| Water Year | First Date of Measurement | Last Date of Measurement | Maximum Days Missing |
|---|---|---|---|
| 1970 | |||
| 1971 | |||
| 1972 | |||
| 1973 | |||
| 1974 | |||
| 1975 | |||
| 1976 | |||
| 1977 | |||
| 1978 | |||
| 1979 | |||
| 1980 | |||
| 1981 | 01-May | 11-Sep | 26 |
| 1982 | 29-May | 11-Sep | 6 |
| 1983 | 25-May | 22-Sep | 10 |
| 1984 | 21-Jun | 12-Sep | 8 |
| 1985 | |||
| 1986 | 02-Jun | 15-Sep | 10 |
| 1987 | 12-Jun | 16-Jul | 4 |
| 1988 | 24-Jun | 13-Sep | 5 |
| 1989 | |||
| 1990 | 15-May | 04-Sep | 16 |
| 1991 | 27-May | 06-Sep | 25 |
| 1992 | 27-Jul | 09-Sep | 7 |
| 1993 | 04-May | 07-Sep | 45 |
| 1994 | 16-May | 30-Aug | 40 |
| 1995 | 10-May | 19-Sep | 28 |
| 1996 | 20-May | 17-Sep | 32 |
| 1997 | 21-May | 15-Aug | 21 |
| 1998 | 17-May | 22-Sep | 36 |
| 1999 | 10-Jun | 01-Sep | 20 |
| Avg | 29-May | 06-Sep | 20 |
| Earliest | 01-May | 16-Jul | 4 |
| Latest | 27-Jul | 22-Sep | 45 |
KEY DIVERSIONS
| Diversion: | PRINCE ALBERT DITCH DIVERSION | 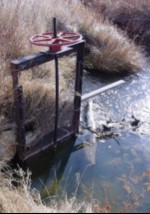 Prince Albert Ditch headgate | ||||||||||||||||||||||||
| Date | 18 Oct. 2000 | |||||||||||||||||||||||||
| Diversion Description: | Headgate consistsof a single 4 x 3.5-foot steel gate in steel slides operated with Waterman-type screws, mounted in a concrete headwall penetrated by 18 ft of three-foot-diameter corrugated metal pipe. | |||||||||||||||||||||||||
| Diversion Location: | The Prince Albert Ditch diversion is located on the main stem of Rock Creek, just upstream of the confluence Rock and Clear creeks. | |||||||||||||||||||||||||
|
 Prince Albert Ditch flume | |||||||||||||||||||||||||
| Conveyance Description: | Open channel canal, approximately 2.5 mi. long. | |||||||||||||||||||||||||
| Direct Flow Water Rights: | The summary for direct flow rights follows: | |||||||||||||||||||||||||
| ||||||||||||||||||||||||||
| Associated Storage Rights: | None | |||||||||||||||||||||||||
| Irrigation Practices: | See introduction to Rock Creek drainage above | |||||||||||||||||||||||||
| Return Flows: | Estimated percentage of total diversion developing into return flows: | |||||||||||||||||||||||||
| ||||||||||||||||||||||||||
| Losses: | Approximately 15 percent by the end of the ditch | |||||||||||||||||||||||||
| References: | Carmine LoGuidice, water commissioner, State Engineer.s Office, interview, 18 Oct. 2000 | |||||||||||||||||||||||||
Irrigated Lands Water Rights Database
| PerNo | PerSfx | Facility Name | Priority | Acres | Amount | Unit | SupTyp | Status | Source |
|---|---|---|---|---|---|---|---|---|---|
| Terr | D | Prince Albert | June 10, 1883 | 528 | 7.54 | CFS | OS | Adj | Rock Creek |
| Name Source District Data |
Princ Albert Ditch Diversion Rock Creek 3 Total monthly flow in AF | ||||||||||||
| Water Year | Oct | Nov | Dec | Jan | Feb | Mar | Apr | May | Jun | Jul | Aug | Sep | Total |
|---|---|---|---|---|---|---|---|---|---|---|---|---|---|
| 1970 | |||||||||||||
| 1971 | |||||||||||||
| 1972 | |||||||||||||
| 1973 | |||||||||||||
| 1974 | 232.76 | 240.87 | 200.65 | 98.24 | 0.00 | 772.52 | |||||||
| 1975 | |||||||||||||
| 1976 | |||||||||||||
| 1977 | |||||||||||||
| 1978 | |||||||||||||
| 1979 | |||||||||||||
| 1980 | |||||||||||||
| 1981 | 523.05 | 338.85 | 330.58 | 11.23 | 0.00 | 1203.71 | |||||||
| 1982 | 202.25 | 417.33 | 375.94 | 462.94 | 115.36 | 1573.82 | |||||||
| 1983 | 94.61 | 567.67 | 468.43 | 307.27 | 0.00 | 1437.98 | |||||||
| 1984 | 0.00 | 0.00 | 480.29 | 333.89 | 0.00 | 814.18 | |||||||
| 1985 | |||||||||||||
| 1986 | 300.50 | 465.72 | 238.79 | 400.68 | 139.37 | 1545.06 | |||||||
| 1987 | 335.36 | 446.46 | 147.97 | 0.00 | 0.00 | 929.79 | |||||||
| 1988 | 0.00 | 88.99 | 248.50 | 0.00 | 0.00 | 337.49 | |||||||
| 1989 | |||||||||||||
| 1990 | 0.00 | 13.39 | 48.20 | 12.10 | 0.00 | 73.69 | |||||||
| 1991 | 0.00 | 14.99 | 308.07 | 284.27 | 107.52 | 714.85 | |||||||
| 1992 | 0.00 | 0.00 | 26.83 | 249.55 | 180.91 | 457.29 | |||||||
| 1993 | 220.09 | 185.66 | 169.40 | 190.80 | 121.37 | 887.32 | |||||||
| 1994 | 90.86 | 394.60 | 277.71 | 59.31 | 0.00 | 822.48 | |||||||
| 1995 | 79.23 | 191.32 | 430.23 | 190.08 | 94.81 | 985.67 | |||||||
| 1996 | 23.60 | 262.06 | 299.78 | 280.76 | 158.17 | 1024.37 | |||||||
| 1997 | 107.61 | 110.70 | 367.85 | 4.72 | 0.00 | 590.88 | |||||||
| 1998 | 97.75 | 49.87 | 364.40 | 252.29 | 127.57 | 891.88 | |||||||
| 1999 | 0.00 | 10.06 | 350.34 | 349.88 | 0.00 | 710.28 | |||||||
| Mean | 128.20 | 211.03 | 285.22 | 193.78 | 58.06 | 876.29 | |||||||
| Max | 523.05 | 567.67 | 480.29 | 462.94 | 180.91 | 1573.82 | |||||||
| Min | 0.00 | 0.00 | 26.83 | 0.00 | 0.00 | 73.69 | |||||||
| Name Source District Data |
Prince Albert Ditch Diversion Rock Creek 3 First & Last Dates, Max. Days | ||
| Water Year | First Date of Measurement | Last Date of Measurement | Maximum Days Missing |
|---|---|---|---|
| 1970 | |||
| 1971 | |||
| 1972 | |||
| 1973 | |||
| 1974 | 17-May | 13-Aug | 0 |
| 1975 | |||
| 1976 | |||
| 1977 | |||
| 1978 | |||
| 1979 | |||
| 1980 | |||
| 1981 | 01-May | 01-Aug | 16 |
| 1982 | 21-May | 08-Sep | 26 |
| 1983 | 27-May | 24-Aug | 10 |
| 1984 | 07-Jul | 30-Aug | 8 |
| 1985 | |||
| 1986 | 16-May | 13-Sep | 10 |
| 1987 | 14-May | 16-Jul | 24 |
| 1988 | 24-Jun | 24-Jul | 4 |
| 1989 | |||
| 1990 | 26-Jun | 07-Aug | 15 |
| 1991 | 21-Jun | 13-Sep | 13 |
| 1992 | 27-Jul | 25-Sep | 9 |
| 1993 | 18-May | 28-Sep | 14 |
| 1994 | 23-May | 30-Aug | 40 |
| 1995 | 10-May | 19-Sep | 15 |
| 1996 | 20-May | 17-Sep | 32 |
| 1997 | 21-May | 14-Aug | 23 |
| 1998 | 21-May | 16-Sep | 31 |
| 1999 | 03-Jun | 31-Aug | 26 |
| Avg | 31-May | 28-Aug | 18 |
| Earliest | 01-May | 16-Jul | 0 |
| Latest | 27-Jul | 28-Sep | 40 |