Wyoming State Water Plan
Wyoming State Water Plan
Wyoming Water Development Office
6920 Yellowtail Rd
Cheyenne, WY 82002
Phone: 307-777-7626

Wyoming Water Development Office
6920 Yellowtail Rd
Cheyenne, WY 82002
Phone: 307-777-7626


| SUBJECT: |
Appendix A Irrigation Diversion Operation and Description LITTLE GOOSE CREEK |
| PREPARED BY: | HKM Engineering Inc. |
| DATE: | March 2002 |
LITTLE GOOSE CREEK
BURN CLEUCH DITCH DIVERSION
COLORADO COLONY DITCH DIVERSION
GERDEL DITCH DIVERSION
LAST CHANCE DITCH DIVERSION
PERALTA DITCH DIVERSION & MOUNTAIN SUPPLY (PERALTA) DIVERSION DITCH
LITTLE GOOSE CREEK DRAINAGE
INTRODUCTION
BACKGROUND
Little Goose Creek flows out of the east slope of the Bighorn Mountains, sandwiched between Piney Creek drainage and the East Fork of Big Goose Creek to the north. In Sheridan, it joins Big Goose Creek, which runs north to join the Tongue east of Ranchester. Little Goose Creek transfers much Big Goose Creek stored water in via transbasin diversion ditches like the Peralta, Cross Creek, and Park Diversion ditches though it has some storage in Willits and Fordyce Tepee No. 1 reservoirs.
CHARACTERISTICS
State Engineer.s Office water commissioners estimate the instream losses in Little Goose Creek to be a maximum of 10 percent by its confluence with Big Goose Creek.
Available reservoir water in Little Goose Creek drainage helps to mitigate water shortages.
In addition, irrigators today tend toward more conservation of the water they can use, which often materializes as new sprinkler irrigation. This has the effect of reducing return flows to the creek. Partially as a result, Little Goose Creek typically goes into regulation every year.
In years of ample water, water commissioners/hydrographers divert 15-20 cfs into Little Goose Creek drainage from the Big Goose Creek drainage via the Peralta and Park Diversion ditches to enhance Little Goose flows.
USAGE
Little Goose Creek.s diversions are used primarily for agricultural irrigation but also supply stock and industrial demands.
Regulation
Water commissioners estimate that regulation is imposed on Little Goose drainage diversions with the following timing:
| Wet Year | Average Year | Dry Year |
|---|---|---|
| End of July | Mid-July | End of June |
Though these times provide the general timing of the imposition of regulation, water commissioners begin regulation when Little Goose Creek.s stream flow drops below 60 cfs at the mouth of the canyon.
Agriculture
Growers in Little Goose Creek drainage tend to plant acreage in the following pattern:
The grains (usually barley or oats) are used to rejuvenate the soil after approximately five years of alfalfa/grass growth. Corn is used as a silage crop.
Irrigation Practices
| Type of irrigation | Percentage of irrigated land |
|---|---|
| Ditch-flood | 65 |
| Gated Pipe | 15 |
| Sprinkler | 20 |
The typical irrigation season runs from April 15-May 1 (depending on whether the spring runoff is delayed by colder weather) to early/mid October (depending on when the first snows fall and the ground freezes). Post-season irrigation is not typically practiced because reservoirs that would provide that water are shut off on the first of October.
Double appropriation
Irrigation water rights with priority dates of March 1, 1945 or earlier are entitled to an additional 1cfs per 70 acres under Wyoming.s surplus water statutes. Whenever the supply in a stream exceeds the amount required to satisfy all existing appropriations established prior to March 1, 1985, the stream is said to be in an excess flow condition and water right holders with priorities between March 2, 1945 and March 1, 1985 may use an additional 1 cfs for each 70 acres irrigated.
On Little Goose Creek, this practice is limited primarily by the condition of ditches. Many of the ditches are not capable of carrying all of the water an irrigator could use.
| % of appropriation | % of ditches in drainage capable of flow |
|---|---|
| 200 | 20 |
| 150 | 60 |
| 100-150 | 90 |
| 0-100 | 90 |
Permitted Uses
Permits granted for water appropriation are granted for specific uses. The following pages contain tables of permits and their associated uses. The following table provides a key to those uses:
| Code | Use |
|---|---|
| Chem | Chemical |
| Com | Commercial |
| Cul | Culinary |
| D | Domestic |
| Drl | Drilling |
| Eng | Steam Engines |
| Fire | Fire Protection |
| Fish | Fish Propogation |
| F.C. | Flood Control |
| I | Irrigation |
| Ind | Industrial |
| I.F. | Instream Flow |
| Mech | Mechanical |
| Mfg | Manufacturing |
| Mil | Milling |
| Min | Mining |
| Misc | Miscellaneous |
| Mun | Municipal |
| Oil | Oil Refining or Production |
| P.C. | Pollution Control |
| Power | Power Development |
| R.R. | Railroad |
| Rec | Recreational |
| Ref | Refining |
| Res. Supply | Supply Facility for a Reservoir |
| S | Stock |
| T | Transportation |
WATER RIGHTS
Two water rights summary tables are provided for each diversion serving irrigation referenced here. The first, included in the body of the diversion synopsis, refers to the rights on record with the State Engineer.s Office and is derived from that office.s Tabulation of Adjudicated Surface Water Rights of the State of Wyoming, Water Division Number Two (Oct. 1999).
Because this rights summary is pulled directly from the SEO Tab, the rights cited follow the SEO.s priority order:
| Hierarchy | Format of right | Example |
|---|---|---|
| 1 | Day, Month, Year | 05-15-1884 |
| 2 | Month and Year | 05-00-1884 |
| 3 | Specified Season and Year | Spring 1884 |
| 4 | Year Only | 1884 |
| 5 | Before Year | Before 1884 |
Board orders or court orders may also establish a specific priority.
Irrigated Lands Water Rights Database
The second table, which follows the diversion synopsis, is taken from the irrigated lands water rights database developed for the basin plan. It can be used as a reference with the following caveats: It only lists water rights associated with the irrigated lands polygons mapped by HKM. The table does not include nonirrigation rights devoted to reservoir supply, municipal, fish propagation, etc. The rights on this table are associated only with those irrigated lands identified through the course of this study, both actively irrigated and currently idle.
| Column Heading Key | ||
| PerNo | Permit Number | "Terr" denotes a territorial right. |
| PerSfx | Permit Suffix | D = direct flow |
| E = enlargement | ||
| R = reservoir | ||
| Facility Name | Parantheses denote the former means of conveyance for the water right. | |
| Unit | Flow or volume | CFS = cubic feet per second |
| AF = acre-feet | ||
| GPM = gallons per minute | ||
| SupTyp | Supply Type | OS = original supply |
| SS = supplement supply, for lands having an original supply from another source. | ||
| Sec = secondary supply, for water stored in a reservoir | ||
| Status | Status of adjudication | Adj = adjudicated |
| Una = unadjudicated | ||
| Source | Source water | Parantheses denote the permit number of the related storage right. |
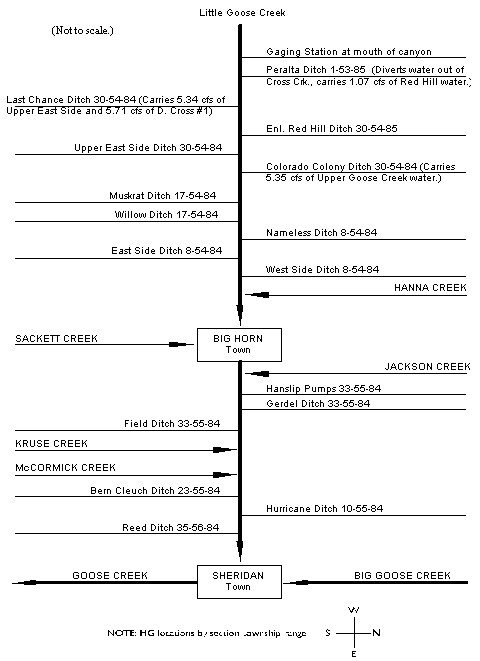
Schematic for Little Goose stream and diversions:
KEY DIVERSIONS
| Diversion: | BURN CLEUCH DITCH DIVERSION | |||||||||||||||||||||||||||||||||||||||||||
| Date | 29 Aug. 2000 | |||||||||||||||||||||||||||||||||||||||||||
| Note: | The Burn Cleuch Ditch has returned no flows to Big Goose Creek in recent years, primarily due to construction around Sheridan. | 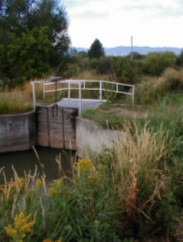
Burn Cleuch Ditch Headgate | ||||||||||||||||||||||||||||||||||||||||||
| Diversion Description: | Headgate consists of a single 5.9 x 5.6-foot rectangular wooden gate in concrete slides operated with a Waterman-type screw, mounted in a concrete headwall. | |||||||||||||||||||||||||||||||||||||||||||
| Diversion Location: | The Burn Cleuch Ditch diversion is located on the main stem of Little Goose Creek between the confluences of Little Goose with McCormick and Big Goose Creek in Sheridan. | |||||||||||||||||||||||||||||||||||||||||||
| ||||||||||||||||||||||||||||||||||||||||||||
| Conveyance Description: | Open channel canal, approximately 5 mi. long. | |||||||||||||||||||||||||||||||||||||||||||
| Direct Flow Water Rights: | The summary of direct flow rights follows: | |||||||||||||||||||||||||||||||||||||||||||
| ||||||||||||||||||||||||||||||||||||||||||||
| Associated Storage Rights: | None | |||||||||||||||||||||||||||||||||||||||||||
| Irrigation Practices: | See Little Goose summary. | |||||||||||||||||||||||||||||||||||||||||||
| Return Flows: | Estimated percentage of total diversion developing into return flows: | |||||||||||||||||||||||||||||||||||||||||||
| ||||||||||||||||||||||||||||||||||||||||||||
| Losses: | 15 percent by the end of the ditch | |||||||||||||||||||||||||||||||||||||||||||
| References: | Bill Knapp, water commissioner, State Engineer.s Office, interview, 29 Aug. 2000 | |||||||||||||||||||||||||||||||||||||||||||
Irrigated Lands Water Rights Database
| PerNo | PerSfx | Facility Name | Priority | Acres | Amount | Unit | SupTyp | Status | Source |
|---|---|---|---|---|---|---|---|---|---|
| Terr | D | Burn Cleuch (5 pump points) | Oct. 29, 1881 | 932.8 | 13.39 | CFS | OS | Adj | Little Goose Creek |
| 6731 | E | Whitney Enlargement Burn Cleuch | Aug. 12, 1977 | 37.41 | 0.53 | CFS | OS | Adj | Little Goose Creek |
| Name Source District Data |
Burn Cleuch Ditch Diversion Little Goose Creek 4 Total monthly flow in AF | ||||||||||||
| Water Year | Oct | Nov | Dec | Jan | Feb | Mar | Apr | May | Jun | Jul | Aug | Sep | Total |
|---|---|---|---|---|---|---|---|---|---|---|---|---|---|
| 1970 | |||||||||||||
| 1971 | |||||||||||||
| 1972 | |||||||||||||
| 1973 | |||||||||||||
| 1974 | 0.00 | 0.00 | 433.82 | 647.84 | 643.02 | 0.00 | 1724.68 | ||||||
| 1975 | |||||||||||||
| 1976 | |||||||||||||
| 1977 | |||||||||||||
| 1978 | |||||||||||||
| 1979 | |||||||||||||
| 1980 | |||||||||||||
| 1981 | 0.00 | 541.00 | 278.00 | 543.00 | 393.00 | 291.00 | 2046.00 | ||||||
| 1982 | 0.00 | 227.83 | 519.15 | 456.92 | 592.87 | 96.78 | 1893.55 | ||||||
| 1983 | 0.00 | 102.66 | 447.73 | 537.58 | 544.17 | 260.25 | 1892.39 | ||||||
| 1984 | 0.00 | 101.31 | 578.60 | 745.77 | 828.39 | 307.62 | 2561.69 | ||||||
| 1985 | 0.00 | 535.53 | 522.09 | 817.10 | 567.22 | 164.34 | 2606.28 | ||||||
| 1986 | 0.00 | 491.58 | 736.73 | 460.48 | 610.99 | 164.60 | 2464.38 | ||||||
| 1987 | |||||||||||||
| 1988 | 0.00 | 267.20 | 639.81 | 582.85 | 96.65 | 0.00 | 1586.51 | ||||||
| 1989 | 0.00 | 190.65 | 551.70 | 562.02 | 556.11 | 252.79 | 2113.27 | ||||||
| 1990 | 0.00 | 561.05 | 0.00 | ||||||||||
| 1991 | 0.00 | 0.00 | 305.43 | 571.46 | 509.02 | 146.80 | 1532.71 | ||||||
| 1992 | 0.00 | 557.81 | 331.87 | ||||||||||
| 1993 | 0.00 | 100.87 | 308.02 | 409.27 | 425.42 | 290.40 | 1533.98 | ||||||
| 1994 | 0.00 | 279.09 | 531.78 | 516.46 | 527.91 | 305.53 | 2160.77 | ||||||
| 1995 | 0.00 | 10.18 | 373.75 | 370.89 | 285.70 | 234.61 | 1275.13 | ||||||
| 1996 | 0.65 | 235.46 | 673.18 | 564.08 | 635.43 | 569.40 | 2678.20 | ||||||
| 1997 | 0.00 | 176.28 | 269.17 | 406.59 | 373.54 | 108.79 | 1334.37 | ||||||
| 1998 | 0.00 | 482.82 | 479.32 | 615.46 | 481.43 | 144.28 | 2203.31 | ||||||
| 1999 | 0.00 | 0.00 | 248.36 | 563.84 | 539.53 | 269.75 | 1621.48 | ||||||
| Mean | 0.03 | 220.14 | 464.51 | 551.27 | 512.07 | 207.31 | 1954.63 | ||||||
| Max | 0.65 | 541.00 | 736.73 | 817.10 | 828.39 | 569.40 | 2678.20 | ||||||
| Min | 0.00 | 0.00 | 248.36 | 370.89 | 96.65 | 0.00 | 1275.13 | ||||||
| Name Source District Data |
Burn Cleuch Ditch Diversion Little Goose Creek 4 First & Last Dates, Max. Days | ||
| Water Year | First Date of Measurement | Last Date of Measurement | Maximum Days Missing |
|---|---|---|---|
| 1970 | |||
| 1971 | |||
| 1972 | |||
| 1973 | |||
| 1974 | 12-Jun | 31-Aug | 0 |
| 1975 | |||
| 1976 | |||
| 1977 | |||
| 1978 | |||
| 1979 | |||
| 1980 | |||
| 1981 | 01-May | 30-Sep | 0 |
| 1982 | 15-May | 05-Sep | 13 |
| 1983 | 28-May | 20-Sep | 17 |
| 1984 | 24-May | 11-Sep | 24 |
| 1985 | 07-May | 09-Sep | 20 |
| 1986 | 16-May | 08-Sep | 35 |
| 1987 | |||
| 1988 | 18-May | 06-Aug | 18 |
| 1989 | 23-May | 14-Sep | 7 |
| 1990 | 15-May | 30-Aug | 57 |
| 1991 | 06-Jun | 12-Sep | 9 |
| 1992 | 06-May | 30-Sep | 69 |
| 1993 | 11-May | 28-Sep | 23 |
| 1994 | 18-May | 20-Sep | 7 |
| 1995 | 31-May | 15-Sep | 16 |
| 1996 | 29-Apr | 24-Sep | 30 |
| 1997 | 15-May | 11-Sep | 27 |
| 1998 | 08-May | 08-Sep | 25 |
| 1999 | 18-Jun | 17-Sep | 25 |
| Avg | 19-May | 12-Sep | 22 |
| Earliest | 29-Apr | 06-Aug | 0 |
| Latest | 18-Jun | 30-Sep | 69 |
KEY DIVERSIONS
| Diversion: | COLORADO COLONY DITCH DIVERSION | |||||||||||||||||||||||||||||||
| Date | 29 Aug. 2000 | 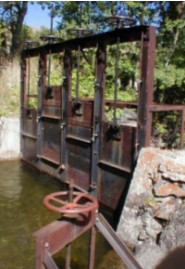 Colorado Colony Headgate | ||||||||||||||||||||||||||||||
| Note: | The Colorado Colony Ditch will entirely divert Little Goose Creek in normal years. More senior rights downstream are normally able to satisfy their appropriations with return flows to Little Goose Creek. In dry years, conservation and sprinkler usage reduce the return flows, requiring water commissioners to allow flow past the Colorado Colony headgate. | |||||||||||||||||||||||||||||||
| Diversion Description: | Headgate consists of four, 2.8 x 2-foot rectangular steel gates in steel slides operated with Waterman-type screws, mounted in a concrete-and- rock headwall. The headgate is adjacent to a similarly constructed bypass gate used to control head on the main gates. All gates appear to be in good condition. | |||||||||||||||||||||||||||||||
| Diversion Location: | The Colorado Colony Ditch diversion is located on the main stem of Little Goose Creek. | |||||||||||||||||||||||||||||||
| ||||||||||||||||||||||||||||||||
| Conveyance Description: | Open channel canal, approximately 15 mi. long. | |||||||||||||||||||||||||||||||
| Direct Flow Water Rights: | The summary of direct flow rights follows: | |||||||||||||||||||||||||||||||
| ||||||||||||||||||||||||||||||||
| Associated Storage Rights: | Big Horn Reservoir is attached to lands below Colorado Colony. Irrigators on the Colorado Colony Ditch also use Park Reservoir and Cross Creek Reservoir water. | |||||||||||||||||||||||||||||||
| Irrigation Practices: | See Little Goose summary. | |||||||||||||||||||||||||||||||
| Return Flows: | Estimated percentage of total diversion developing into return flows: | |||||||||||||||||||||||||||||||
| ||||||||||||||||||||||||||||||||
| Losses: | Approximately 25 percent by the end of the ditch | |||||||||||||||||||||||||||||||
| References: | Bill Knapp, water commissioner, State Engineer.s Office, interview, 29 Aug. 2000 | |||||||||||||||||||||||||||||||
Irrigated Lands Water Rights Database
| PerNo | PerSfx | Facility Name | Priority | Acres | Amount | Unit | SupTyp | Status | Source |
|---|---|---|---|---|---|---|---|---|---|
| Terr | D | Upper Goose Creek (Red Hill Extension, Colorado Colony) | Nov. 15, 1881 | 375 | 5.35 | CFS | OS | Adj | Little Goose Creek |
| Terr | D | Colorado Colony | July 4, 1883 | 5868.74 | 83.86 | CFS | OS | Adj | Little Goose Creek |
| Terr | D | Big Goose & Beaver (Peralta, Colorado Colony) | Aug. 29, 1885 | 6430 | 92.01 | CFS | OS | Adj | East Fork Big Goose Creek |
| Terr | D | Peralta (Colorado Colony, Red Hill, Big Goose & Beaver) | Nov. 1, 1885 | 3971.5 | 56.7 | CFS | OS | Adj | Cross Creek |
| 305 | E | Enl. Colorado Colony | Jan. 14, 1898 | 35 | 0.5 | CFS | OS | Adj | Little Goose Creek |
| 445 | E | Enl. Colorado Colony | June 15, 1898 | 6317.8 | 0 | SS | Adj | Cross Creek | |
| 4186 | E | Enl. Colorado Colony | July 10, 1908 | 5317.24 | 0 | Sec | Adj | Cross Creek (1352R) | |
| 3145 | E | Enl. Colorado Colony | March 8, 1915 | 815.1 | 11.64 | CFS | OS | Adj | Little Goose Creek |
| 3145 | E | Enl. Colorado Colony | March 8, 1915 | 728 | 0 | SS | Adj | Little Goose Creek | |
| 4298 | E | Enl. Peralta (Colorado Colony) | Nov. 7, 1921 | 2049 | 0 | SS | Adj | Little Goose Creek | |
| 5335 | E | Third Enl. Red Hill (Colorado Colony) | Dec. 22, 1942 | 237 | 3.36 | CFS | OS | Adj | Little Goose Creek |
| 5978 | E | Enl. Peralta (Colorado Colony) | April 14, 1952 | 844.9 | 0 | SS | Adj | Cross Creek | |
| 5978 | E | Enl. Peralta (Colorado Colony) | April 14, 1952 | 456.8 | 6.52 | CFS | OS | Adj | Cross Creek |
| 5979 | E | Enl. Peralta (Colorado Colony) | April 14, 1952 | 693.2 | 0 | SS | Adj | Little Goose Creek | |
| 5979 | E | Enl. Peralta (Colorado Colony) | April 14, 1952 | 25.72 | 0.37 | CFS | OS | Adj | Little Goose Creek |
| Name Source District Data |
Colorado Colony Ditch Diversion Little Goose Creek 4 Total monthly flow in AF | ||||||||||||
| Water Year | Oct | Nov | Dec | Jan | Feb | Mar | Apr | May | Jun | Jul | Aug | Sep | Total |
|---|---|---|---|---|---|---|---|---|---|---|---|---|---|
| 1970 | |||||||||||||
| 1971 | 0.00 | 0.00 | 0.00 | 726.94 | 3811.04 | 3657.32 | 4174.21 | 1479.27 | 13848.78 | ||||
| 1972 | 0.00 | 0.00 | 0.00 | 1350.74 | 5536.66 | 3415.34 | 3532.36 | 2602.91 | 16438.01 | ||||
| 1973 | 161.85 | 0.00 | 0.00 | 861.62 | 5345.85 | 3423.07 | 4159.53 | 1653.22 | 15605.14 | ||||
| 1974 | 0.00 | 0.00 | 0.00 | 1993.39 | 5591.60 | 4083.77 | 3893.95 | 1884.89 | 17447.60 | ||||
| 1975 | 0.00 | 0.00 | 0.00 | 37.79 | 2343.37 | 3784.86 | 3992.53 | 2812.56 | 12971.11 | ||||
| 1976 | 0.00 | 0.00 | 615.87 | 2535.67 | 5070.74 | 4124.03 | 3807.87 | 2487.27 | 18641.45 | ||||
| 1977 | 0.00 | 0.00 | 0.00 | 3295.93 | 3625.39 | 2567.80 | 3055.73 | 1543.34 | 14088.19 | ||||
| 1978 | 0.00 | 0.00 | 0.00 | 0.00 | 0.00 | 3583.93 | 2696.53 | 2448.20 | 8728.66 | ||||
| 1979 | |||||||||||||
| 1980 | 0.00 | 0.00 | 586.00 | 3896.00 | 3244.00 | 2906.00 | 2081.00 | 1226.00 | 13939.00 | ||||
| 1981 | 0.00 | 274.00 | 843.00 | 2883.00 | 2112.00 | 2312.00 | 1454.00 | 1572.00 | 11450.00 | ||||
| 1982 | 0.00 | 0.00 | 0.00 | 2590.00 | 2620.00 | 3530.00 | 3900.00 | 2380.00 | 15020.00 | ||||
| 1983 | 0.00 | 0.00 | 0.00 | 580.00 | 4500.00 | 4050.00 | 2970.00 | 1700.00 | 13800.00 | ||||
| 1984 | 0.00 | 0.00 | 0.00 | 0.00 | 2517.84 | 3796.58 | 3183.56 | 1838.23 | 11336.21 | ||||
| 1985 | 0.00 | 0.00 | 0.00 | 3005.08 | 3420.78 | 2989.07 | 1697.70 | 822.00 | 11934.63 | ||||
| 1986 | 0.00 | 0.00 | 17.93 | 3184.59 | 4084.40 | 3351.50 | 3256.33 | 1295.17 | 15189.92 | ||||
| 1987 | 0.00 | 0.00 | 0.00 | 4351.00 | 2954.00 | 2510.00 | 2573.00 | 1810.00 | 14198.00 | ||||
| 1988 | 0.00 | 0.00 | 0.00 | 2050.00 | 4090.00 | 3274.00 | 1970.00 | 1005.00 | 12389.00 | ||||
| 1989 | 0.00 | 0.00 | 696.50 | 3685.80 | 3236.20 | 2767.60 | 2891.70 | 1626.60 | 14904.40 | ||||
| 1990 | 0.00 | 0.00 | 0.00 | 865.50 | 3195.30 | 3567.60 | 3064.70 | 2589.20 | 13282.30 | ||||
| 1991 | 0.00 | 0.00 | 0.00 | 964.70 | 2924.80 | 3157.80 | 2710.60 | 1414.60 | 11172.50 | ||||
| 1992 | 0.00 | 0.00 | 785.50 | 3525.90 | 2739.70 | 2373.30 | 3330.90 | 2744.20 | 15499.50 | ||||
| 1993 | 0.00 | 0.00 | 0.00 | 1608.20 | 2864.60 | 2821.90 | 3353.80 | 3169.50 | 13818.00 | ||||
| 1994 | 0.00 | 0.00 | 0.00 | 2053.90 | 3284.30 | 2908.70 | 2431.40 | 1126.50 | 11804.80 | ||||
| 1995 | 0.00 | 0.00 | 96.10 | 389.90 | 2149.00 | 2576.70 | 3788.50 | 2554.40 | 11554.60 | ||||
| 1996 | 0.00 | 0.00 | 0.00 | 781.40 | 3574.50 | 3331.50 | 3309.60 | 2268.50 | 13265.50 | ||||
| 1997 | 0.00 | 0.00 | 0.00 | 1013.80 | 3438.00 | 3296.20 | 3005.40 | 3250.60 | 14004.00 | ||||
| 1998 | 0.00 | 0.00 | 0.00 | 3540.30 | 4019.90 | 3669.50 | 3444.10 | 2478.80 | 17152.60 | ||||
| 1999 | 0.00 | 0.00 | 102.00 | 393.00 | 2455.00 | 3443.00 | 3322.00 | 1776.00 | 11491.00 | ||||
| Mean | 5.78 | 9.79 | 133.68 | 1863.01 | 3383.89 | 3259.75 | 3108.96 | 1984.25 | 13749.10 | ||||
| Max | 161.85 | 274.00 | 843.00 | 4351.00 | 5591.60 | 4124.03 | 4174.21 | 3250.60 | 18641.45 | ||||
| Min | 0.00 | 0.00 | 0.00 | 0.00 | 0.00 | 2312.00 | 1454.00 | 822.00 | 8728.66 | ||||
| Name Source District Data |
Colorado Colony Ditch Diversion Little Goose Creek 4 First & Last Dates, Max. Days | ||
| Water Year | First Date of Measurement | Last Date of Measurement | Maximum Days Missing |
|---|---|---|---|
| 1970 | |||
| 1971 | 21-May | 30-Sep | 0 |
| 1972 | 11-May | 02-Oct | 0 |
| 1973 | 22-May | 27-Sep | 0 |
| 1974 | 08-May | 30-Sep | 0 |
| 1975 | 27-May | 30-Sep | 0 |
| 1976 | 09-Apr | 30-Sep | 0 |
| 1977 | 01-May | 30-Sep | 1 |
| 1978 | 01-Jul | 30-Sep | 0 |
| 1979 | |||
| 1980 | 22-Apr | 30-Sep | 0 |
| 1981 | 16-Mar | 30-Sep | 0 |
| 1982 | 01-May | 30-Sep | 0 |
| 1983 | 23-May | 30-Sep | 0 |
| 1984 | 04-Jun | 30-Sep | 0 |
| 1985 | 01-May | 30-Sep | 0 |
| 1986 | 29-Apr | 20-Sep | 0 |
| 1987 | 01-May | 30-Sep | 0 |
| 1988 | 03-May | 30-Sep | 0 |
| 1989 | 20-Apr | 30-Sep | 0 |
| 1990 | 23-May | 30-Sep | 0 |
| 1991 | 03-May | 30-Sep | 0 |
| 1992 | 15-Apr | 30-Sep | 0 |
| 1993 | 01-May | 30-Sep | 0 |
| 1994 | 12-May | 30-Sep | 0 |
| 1995 | 26-Apr | 30-Sep | 0 |
| 1996 | 11-May | 30-Sep | 0 |
| 1997 | 16-May | 30-Sep | 0 |
| 1998 | 05-May | 30-Sep | 0 |
| 1999 | 12-Apr | 30-Sep | 0 |
| Avg | 05-May | 29-Sep | 0 |
| Earliest | 16-Mar | 20-Sep | 0 |
| Latest | 01-Jul | 02-Oct | 1 |
KEY DIVERSIONS
| Diversion: | GERDEL DITCH DIVERSION | |||||||||||||||||||||||||||||||||||||||||||||||||||||||
| Date | 29 Aug. 2000 | 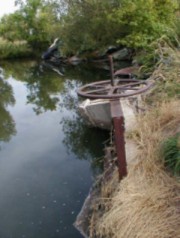 Gerdel Ditch Headgate | ||||||||||||||||||||||||||||||||||||||||||||||||||||||
| Note: | The Gerdel Ditch entirely diverts Little Goose Creek at its headgate. Return flows typically put 12-14 cfs back into Little Goose Creek downstream of lands served by the Gerdel Ditch. | |||||||||||||||||||||||||||||||||||||||||||||||||||||||
| Diversion Description: | Headgate consists of a single, 3.8 x 3-foot rectangular steel gate in steel slides operated with Waterman-type screw, mounted in a tilting concrete headwall. | |||||||||||||||||||||||||||||||||||||||||||||||||||||||
| Diversion Location: | The Gerdel Ditch diversion is located on the main stem of Little Goose Creek between the confluences of Little Goose with Kruse and Jackson creeks. | |||||||||||||||||||||||||||||||||||||||||||||||||||||||
| ||||||||||||||||||||||||||||||||||||||||||||||||||||||||
| Conveyance Description: | Open channel canal, approximately 5 mi. long. | |||||||||||||||||||||||||||||||||||||||||||||||||||||||
| Direct Flow Water Rights: | The summary of direct flow rights follows: | |||||||||||||||||||||||||||||||||||||||||||||||||||||||
| ||||||||||||||||||||||||||||||||||||||||||||||||||||||||
| Associated Storage Rights: | None | |||||||||||||||||||||||||||||||||||||||||||||||||||||||
| Irrigation Practices: | See Little Goose summary. | |||||||||||||||||||||||||||||||||||||||||||||||||||||||
| Return Flows: | Estimated percentage of total diversion developing into return flows: | |||||||||||||||||||||||||||||||||||||||||||||||||||||||
| ||||||||||||||||||||||||||||||||||||||||||||||||||||||||
| Losses: | 15 percent by the end of the ditch | |||||||||||||||||||||||||||||||||||||||||||||||||||||||
| References: | Bill Knapp, water commissioner, State Engineer.s Office, interview, 29 Aug. 2000 | |||||||||||||||||||||||||||||||||||||||||||||||||||||||
Irrigated Lands Water Rights Database
| PerNo | PerSfx | Facility Name | Priority | Acres | Amount | Unit | SupTyp | Status | Source |
|---|---|---|---|---|---|---|---|---|---|
| Terr | D | Gerdel (Waldheim Pump System, Argento Pump) | April 15, 1880 | 636 | 9.1 | CFS | OS | Adj | Little Goose Creek |
| 4108 | E | Enl Gerdel | June 9, 1920 | 52.8 | 0.75 | CFS | OS | Adj | Little Goose Creek |
| Name Source District Data |
Gerdel Ditch Diversion Little Goose Creek 4 Total monthly flow in AF | ||||||||||||
| Water Year | Oct | Nov | Dec | Jan | Feb | Mar | Apr | May | Jun | Jul | Aug | Sep | Total |
|---|---|---|---|---|---|---|---|---|---|---|---|---|---|
| 1970 | |||||||||||||
| 1971 | |||||||||||||
| 1972 | |||||||||||||
| 1973 | |||||||||||||
| 1974 | 0.00 | 0.00 | 215.05 | 436.38 | 410.90 | 0.00 | 1062.33 | ||||||
| 1975 | |||||||||||||
| 1976 | |||||||||||||
| 1977 | |||||||||||||
| 1978 | |||||||||||||
| 1979 | |||||||||||||
| 1980 | |||||||||||||
| 1981 | 0.00 | 631.72 | 856.00 | 436.00 | 433.00 | 431.00 | 2787.72 | ||||||
| 1982 | 0.00 | 384.83 | 768.87 | 475.60 | 682.88 | 468.30 | 2780.48 | ||||||
| 1983 | 0.00 | 44.11 | 836.65 | 753.43 | 511.55 | 99.31 | 2245.05 | ||||||
| 1984 | 0.00 | 0.00 | 324.57 | 609.72 | 586.71 | 155.08 | 1676.08 | ||||||
| 1985 | 0.00 | 602.74 | 463.87 | 544.37 | 540.99 | 109.07 | 2261.04 | ||||||
| 1986 | 0.00 | 634.42 | 115.27 | ||||||||||
| 1987 | 0.00 | 345.13 | 398.33 | 293.63 | 446.43 | 195.19 | 1687.71 | ||||||
| 1988 | 179.54 | 351.33 | 633.69 | 692.80 | 111.45 | 0.00 | 1968.81 | ||||||
| 1989 | 0.00 | 137.34 | 474.34 | 553.17 | 586.62 | 221.93 | 1973.40 | ||||||
| 1990 | 0.00 | 433.09 | 253.82 | ||||||||||
| 1991 | 0.00 | 0.00 | 250.23 | 649.96 | 632.21 | 422.00 | 1954.40 | ||||||
| 1992 | 0.00 | 621.99 | 485.39 | ||||||||||
| 1993 | 0.00 | 277.92 | 527.37 | 395.10 | 546.95 | 291.03 | 2038.37 | ||||||
| 1994 | 0.00 | 556.79 | 627.32 | 635.05 | 649.11 | 435.42 | 2903.69 | ||||||
| 1995 | 0.00 | 0.00 | 460.99 | 625.27 | 675.92 | 319.00 | 2081.18 | ||||||
| 1996 | 0.53 | 276.57 | 552.98 | 652.54 | 595.48 | 433.03 | 2511.13 | ||||||
| 1997 | 0.00 | 359.92 | 642.69 | 629.72 | 572.25 | 172.06 | 2376.64 | ||||||
| 1998 | 0.00 | 365.80 | 622.51 | 680.78 | 616.90 | 148.00 | 2433.99 | ||||||
| 1999 | 0.00 | 0.00 | 283.53 | 662.72 | 622.47 | 306.84 | 1875.56 | ||||||
| Mean | 9.00 | 255.48 | 525.82 | 572.13 | 545.57 | 253.09 | 2153.98 | ||||||
| Max | 179.54 | 631.72 | 856.00 | 753.43 | 682.88 | 485.39 | 2903.69 | ||||||
| Min | 0.00 | 0.00 | 215.05 | 293.63 | 111.45 | 0.00 | 1062.33 | ||||||
| Name Source District Data |
Gerdel Ditch Diversion Little Goose Creek 4 First & Last Dates, Max. Days | ||
| Water Year | First Date of Measurement | Last Date of Measurement | Maximum Days Missing |
|---|---|---|---|
| 1970 | |||
| 1971 | |||
| 1972 | |||
| 1973 | |||
| 1974 | 17-Jun | 31-Aug | 0 |
| 1975 | |||
| 1976 | |||
| 1977 | |||
| 1978 | |||
| 1979 | |||
| 1980 | |||
| 1981 | 01-May | 30-Sep | 27 |
| 1982 | 18-May | 22-Sep | 13 |
| 1983 | 28-May | 10-Sep | 17 |
| 1984 | 12-Jun | 11-Sep | 21 |
| 1985 | 01-May | 09-Sep | 32 |
| 1986 | 05-May | 08-Sep | 54 |
| 1987 | 13-May | 14-Sep | 32 |
| 1988 | 20-Apr | 06-Aug | 21 |
| 1989 | 23-May | 14-Sep | 5 |
| 1990 | 10-May | 24-Sep | 62 |
| 1991 | 13-Jun | 24-Sep | 12 |
| 1992 | 05-May | 23-Sep | 74 |
| 1993 | 11-May | 28-Sep | 33 |
| 1994 | 09-May | 22-Sep | 10 |
| 1995 | 31-May | 15-Sep | 16 |
| 1996 | 29-Apr | 24-Sep | 41 |
| 1997 | 15-May | 11-Sep | 27 |
| 1998 | 08-May | 08-Sep | 25 |
| 1999 | 18-Jun | 17-Sep | 25 |
| Avg | 17-May | 14-Sep | 27 |
| Earliest | 20-Apr | 06-Aug | 0 |
| Latest | 18-Jun | 30-Sep | 74 |
KEY DIVERSIONS
| Diversion: | LAST CHANCE DITCH DIVERSION | |||||||||||||||||||||||||||||||||||||||||||||||||||||||
| Date | 29 Aug. 2000 | |||||||||||||||||||||||||||||||||||||||||||||||||||||||
| Diversion Description: | Headgate consists of two, 3.6 x 3-foot rectangular steel gates in steel slides operated with Waterman-type screws, mounted in a steel headwall. Both gates look in good condition and control flow through two, three- foot?diameter corrugated metal pipes. | 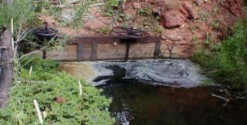 Last Chance Headgate | ||||||||||||||||||||||||||||||||||||||||||||||||||||||
| Diversion Location: | The Last Chance Ditch diversion is located on the main stem of Little Goose Creek, and delivers water to the Kruse Creek headwaters. | |||||||||||||||||||||||||||||||||||||||||||||||||||||||
| ||||||||||||||||||||||||||||||||||||||||||||||||||||||||
| Conveyance Description: | Open channel canal, approximately 11 mi. long. | |||||||||||||||||||||||||||||||||||||||||||||||||||||||
| Direct Flow Water Rights: | The summary of direct flow rights follows: | |||||||||||||||||||||||||||||||||||||||||||||||||||||||
| ||||||||||||||||||||||||||||||||||||||||||||||||||||||||
| Associated Storage Rights: | S. K. Johnston owns stored water in Park. | |||||||||||||||||||||||||||||||||||||||||||||||||||||||
| Irrigation Practices: | See Little Goose summary. | |||||||||||||||||||||||||||||||||||||||||||||||||||||||
| Return Flows: | Estimated percentage of total diversion developing into return flows: | |||||||||||||||||||||||||||||||||||||||||||||||||||||||
| ||||||||||||||||||||||||||||||||||||||||||||||||||||||||
| Losses: | Approximately 25 percent by the end of the ditch. Last Chance Ditch crosses a number of glacial gravel seams, losing much water in conveyance. | |||||||||||||||||||||||||||||||||||||||||||||||||||||||
| References: | Bill Knapp, water commissioner, State Engineer.s Office, interview, 29 Aug. 2000 | |||||||||||||||||||||||||||||||||||||||||||||||||||||||
Irrigated Lands Water Rights Database
| PerNo | PerSfx | Facility Name | Priority | Acres | Amount | Unit | SupTyp | Status | Source |
|---|---|---|---|---|---|---|---|---|---|
| Terr | D | Upper East Side (Last Chance) | Dec. 1, 1881 | 634 | 9.05 | CFS | OS | Adj | Little Goose Creek |
| Terr | D | Last Chance | May 6, 1885 | 195 | 2.78 | CFS | OS | Adj | Rock Creek |
| Terr | D | Last Chance | March 20, 1888 | 680 | 9.7 | CFS | OS | Adj | Little Goose Creek |
| Terr | D | Last Chance, 2nd App. | April 20, 1888 | 75 | 1.07 | CFS | OS | Adj | Rock Creek |
| 255 | E | Enl. Last Chance | May 31, 1897 | 40 | 0.55 | CFS | OS | Adj | Little Rapid Creek |
| 2324 | E | Enl. Last Chance | Jan. 7, 1908 | 330 | 4.71 | CFS | OS | Adj | Cross Creek and Little Goose Creek |
| 2324 | E | Enl. Last Chance | Jan. 7, 1908 | 100 | 0 | SS | Adj | Little Goose Creek | |
| 2324 | E | Enl. Last Chance | Jan. 7, 1908 | 20 | 0 | SS | Adj | Cross Creek and Little Goose Creek | |
| 13962 | D | Last Chance | Dec. 27, 1915 | 36 | 0.51 | CFS | OS | Adj | Smith Draw |
| 17133 | D | Last Chance | Sep. 4, 1926 | 44.5 | 0.66 | CFS | OS | Adj | East Pass Creek |
| 5340 | E | Enl. Last Chance | Jan. 22, 1943 | 120 | 0 | SS | Adj | Little Goose Creek | |
| 5340 | E | Enl. Last Chance | Jan. 22, 1943 | 283 | 4.04 | CFS | OS | Adj | Little Goose Creek |
| 5572 | E | Enl. Last Chance through Park Res. Diversion | April 26, 1951 | 465.1 | 0 | SS | Adj | East Fork Big Goose Creek | |
| 5572 | E | Enl. Last Chance through Park Res. Diversion | April 26, 1951 | 431.3 | 6.16 | CFS | OS | Adj | East Fork Big Goose Creek |
| 6698 | E | Clow Enlargement Last Chance | Sep. 27, 1977 | 71 | 0 | SS | Adj | Little Goose Creek | |
| 6698 | E | Clow Enlargement Last Chance | Sep. 27, 1977 | 61.7 | 0.88 | CFS | OS | Adj | Little Goose Creek |
| Name Source District Data |
Last Chance Ditch Diversion Little Goose Creek 4 Total monthly flow in AF | ||||||||||||
| Water Year | Oct | Nov | Dec | Jan | Feb | Mar | Apr | May | Jun | Jul | Aug | Sep | Total |
|---|---|---|---|---|---|---|---|---|---|---|---|---|---|
| 1970 | |||||||||||||
| 1971 | 0.00 | 0.00 | 181.90 | 624.26 | 1109.16 | 1627.64 | 617.63 | 4160.59 | |||||
| 1972 | 0.00 | 5.20 | 56.87 | 1137.20 | 1230.35 | 1286.48 | 903.93 | 4620.03 | |||||
| 1973 | 21.54 | 0.00 | 73.79 | 942.23 | 1307.11 | 1364.23 | 592.26 | 4301.16 | |||||
| 1974 | 0.00 | 0.00 | 523.04 | 1449.12 | 1459.83 | 1233.32 | 810.45 | 5475.76 | |||||
| 1975 | 0.00 | 0.00 | 1.98 | 11.90 | 865.98 | 1296.40 | 743.19 | 2919.45 | |||||
| 1976 | 0.00 | 0.00 | 4.40 | 1019.03 | 1337.06 | 1355.11 | 677.81 | 4393.41 | |||||
| 1977 | 0.00 | 0.00 | 786.39 | 1543.73 | 1252.96 | 1151.60 | 678.21 | 5412.89 | |||||
| 1978 | 0.00 | 0.00 | 0.00 | 85.67 | 1259.90 | 1368.00 | 966.94 | 3680.51 | |||||
| 1979 | |||||||||||||
| 1980 | 0.00 | 0.00 | 1289.00 | 1506.00 | 462.00 | 303.00 | 345.00 | 3905.00 | |||||
| 1981 | 0.00 | 325.00 | 489.00 | 933.00 | 718.00 | 683.00 | 636.00 | 3784.00 | |||||
| 1982 | 0.00 | 0.00 | 141.00 | 483.00 | 1100.00 | 1570.00 | 430.00 | 3724.00 | |||||
| 1983 | 0.00 | 0.00 | 0.00 | 1670.00 | 1520.00 | 1300.00 | 1040.00 | 5530.00 | |||||
| 1984 | 0.00 | 0.00 | 0.00 | 0.00 | 1546.08 | 1556.00 | 1225.17 | 4327.25 | |||||
| 1985 | 0.00 | 0.00 | 792.84 | 1067.80 | 1122.50 | 991.81 | 533.07 | 4508.02 | |||||
| 1986 | 0.00 | 0.00 | 983.46 | 786.10 | 1191.07 | 827.23 | 359.85 | 4147.71 | |||||
| 1987 | 0.00 | 233.00 | 1043.00 | 919.00 | 992.00 | 875.00 | 467.00 | 4529.00 | |||||
| 1988 | 0.00 | 0.00 | 235.00 | 1288.00 | 1292.00 | 548.00 | 354.00 | 3717.00 | |||||
| 1989 | 0.00 | 0.00 | 373.60 | 781.30 | 901.50 | 1183.10 | 822.20 | 4061.70 | |||||
| 1990 | 0.00 | 0.00 | 89.80 | 388.10 | 1084.60 | 1111.10 | 817.00 | 3490.60 | |||||
| 1991 | 0.00 | 0.00 | 0.00 | 259.60 | 1080.30 | 1159.30 | 530.30 | 3029.50 | |||||
| 1992 | 0.00 | 55.30 | 1035.80 | 672.10 | 753.50 | 876.10 | 564.10 | 3956.90 | |||||
| 1993 | 0.00 | 0.00 | 0.00 | 302.00 | 366.90 | 897.90 | 630.70 | 2197.50 | |||||
| 1994 | 0.00 | 0.00 | 250.00 | 855.30 | 1118.60 | 757.10 | 605.90 | 3586.90 | |||||
| 1995 | 0.00 | 0.00 | 0.00 | 143.70 | 819.70 | 1063.90 | 703.50 | 2730.80 | |||||
| 1996 | 0.00 | 0.00 | 17.40 | 680.10 | 1217.80 | 1150.40 | 654.70 | 3720.40 | |||||
| 1997 | 0.00 | 0.00 | 148.30 | 288.80 | 642.20 | 685.50 | 565.60 | 2330.40 | |||||
| 1998 | 0.00 | 0.00 | 614.20 | 827.40 | 1147.60 | 1148.00 | 511.40 | 4248.60 | |||||
| 1999 | 0.00 | 0.00 | 0.00 | 414.00 | 1000.00 | 1076.00 | 555.00 | 3045.00 | |||||
| Mean | 0.77 | 22.09 | 326.10 | 752.80 | 1067.81 | 1087.33 | 655.03 | 3911.93 | |||||
| Max | 21.54 | 325.00 | 1289.00 | 1670.00 | 1546.08 | 1627.64 | 1225.17 | 5530.00 | |||||
| Min | 0.00 | 0.00 | 0.00 | 0.00 | 366.90 | 303.00 | 345.00 | 2197.50 | |||||
| Name Source District Data |
Last Chance Ditch Diversion Little Goose Creek 4 First & Last Dates, Max. Days | ||
| Water Year | First Date of Measurement | Last Date of Measurement | Maximum Days Missing |
|---|---|---|---|
| 1970 | |||
| 1971 | 17-May | 30-Sep | 6 |
| 1972 | 27-Apr | 02-Oct | 0 |
| 1973 | 24-May | 28-Sep | 0 |
| 1974 | 10-May | 30-Sep | 0 |
| 1975 | 27-May | 30-Sep | 0 |
| 1976 | 31-May | 26-Sep | 0 |
| 1977 | 10-May | 30-Sep | 0 |
| 1978 | 27-Jun | 30-Sep | 0 |
| 1979 | |||
| 1980 | 01-May | 30-Sep | 0 |
| 1981 | 12-Apr | 30-Sep | 0 |
| 1982 | 01-May | 30-Sep | 0 |
| 1983 | 01-Jun | 30-Sep | 0 |
| 1984 | 03-Jul | 30-Sep | 0 |
| 1985 | 01-May | 30-Sep | 0 |
| 1986 | 05-May | 30-Sep | 0 |
| 1987 | 21-Apr | 30-Sep | 0 |
| 1988 | 22-May | 30-Sep | 0 |
| 1989 | 16-May | 30-Sep | 0 |
| 1990 | 23-May | 30-Sep | 0 |
| 1991 | 03-Jun | 30-Sep | 0 |
| 1992 | 28-Apr | 30-Sep | 0 |
| 1993 | 09-Jun | 30-Sep | 0 |
| 1994 | 18-May | 30-Sep | 0 |
| 1995 | 06-Jun | 30-Sep | 0 |
| 1996 | 21-May | 30-Sep | 0 |
| 1997 | 15-May | 30-Sep | 0 |
| 1998 | 05-May | 30-Sep | 0 |
| 1999 | 09-Jun | 30-Sep | 0 |
| Avg | 18-May | 29-Sep | 0 |
| Earliest | 12-Apr | 26-Sep | 0 |
| Latest | 03-Jul | 02-Oct | 6 |
KEY DIVERSIONS
| Diversion: | PERALTA DITCH DIVERSIION and MOUNTAIN SUPPLY (PERALTA) DIVERSION DITCH | |||||||||||||||||||||||||||||||||||||||||||||||||||||||||||||||||||||||||||||||||||||||||||||||||||||||||||||||||||||||||||||||||||||||||||||||||||||||||||||||||||||||||||||||||||||||||||||||||||||||||||||||||||||||||||||||||||||||||||||||||||||||
| Date | 29 Aug. 2000 | |||||||||||||||||||||||||||||||||||||||||||||||||||||||||||||||||||||||||||||||||||||||||||||||||||||||||||||||||||||||||||||||||||||||||||||||||||||||||||||||||||||||||||||||||||||||||||||||||||||||||||||||||||||||||||||||||||||||||||||||||||||||
| Diversion Description: | Headgate consists of two, 3.5 x 3.5-foot square steel gates in steel slides operated with Waterman-type screws, mounted in a concrete-and-rock throat. One of the gates screws is badly bent. | 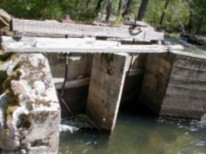 Mountain Supply Ditch Headgate | ||||||||||||||||||||||||||||||||||||||||||||||||||||||||||||||||||||||||||||||||||||||||||||||||||||||||||||||||||||||||||||||||||||||||||||||||||||||||||||||||||||||||||||||||||||||||||||||||||||||||||||||||||||||||||||||||||||||||||||||||||||||
| Diversion Location: | The Peralta Ditch diversion is located on the main stem of Little Goose Creek, and represents the first diversion downstream of the canyon mouth. | |||||||||||||||||||||||||||||||||||||||||||||||||||||||||||||||||||||||||||||||||||||||||||||||||||||||||||||||||||||||||||||||||||||||||||||||||||||||||||||||||||||||||||||||||||||||||||||||||||||||||||||||||||||||||||||||||||||||||||||||||||||||
| ||||||||||||||||||||||||||||||||||||||||||||||||||||||||||||||||||||||||||||||||||||||||||||||||||||||||||||||||||||||||||||||||||||||||||||||||||||||||||||||||||||||||||||||||||||||||||||||||||||||||||||||||||||||||||||||||||||||||||||||||||||||||
| Conveyance Description: | Open channel canal, approximately 14 mi. long. Approximately 250 feet of the diversion is piped near the headgate. The conveyance crosses a number of gravel seams, increasing the ditch loss. | |||||||||||||||||||||||||||||||||||||||||||||||||||||||||||||||||||||||||||||||||||||||||||||||||||||||||||||||||||||||||||||||||||||||||||||||||||||||||||||||||||||||||||||||||||||||||||||||||||||||||||||||||||||||||||||||||||||||||||||||||||||||
| Direct Flow Water Rights: | The summary of direct flow rights follows: | |||||||||||||||||||||||||||||||||||||||||||||||||||||||||||||||||||||||||||||||||||||||||||||||||||||||||||||||||||||||||||||||||||||||||||||||||||||||||||||||||||||||||||||||||||||||||||||||||||||||||||||||||||||||||||||||||||||||||||||||||||||||
| ||||||||||||||||||||||||||||||||||||||||||||||||||||||||||||||||||||||||||||||||||||||||||||||||||||||||||||||||||||||||||||||||||||||||||||||||||||||||||||||||||||||||||||||||||||||||||||||||||||||||||||||||||||||||||||||||||||||||||||||||||||||||
| Associated Storage Rights: | Individual landowners use water stored in Cross Creek, Park, Martin, and Willits reservoirs. | |||||||||||||||||||||||||||||||||||||||||||||||||||||||||||||||||||||||||||||||||||||||||||||||||||||||||||||||||||||||||||||||||||||||||||||||||||||||||||||||||||||||||||||||||||||||||||||||||||||||||||||||||||||||||||||||||||||||||||||||||||||||
| Irrigation Practices: | See Little Goose summary. | |||||||||||||||||||||||||||||||||||||||||||||||||||||||||||||||||||||||||||||||||||||||||||||||||||||||||||||||||||||||||||||||||||||||||||||||||||||||||||||||||||||||||||||||||||||||||||||||||||||||||||||||||||||||||||||||||||||||||||||||||||||||
| Return Flows: | Estimated percentage of total diversion developing into return flows: | |||||||||||||||||||||||||||||||||||||||||||||||||||||||||||||||||||||||||||||||||||||||||||||||||||||||||||||||||||||||||||||||||||||||||||||||||||||||||||||||||||||||||||||||||||||||||||||||||||||||||||||||||||||||||||||||||||||||||||||||||||||||
| ||||||||||||||||||||||||||||||||||||||||||||||||||||||||||||||||||||||||||||||||||||||||||||||||||||||||||||||||||||||||||||||||||||||||||||||||||||||||||||||||||||||||||||||||||||||||||||||||||||||||||||||||||||||||||||||||||||||||||||||||||||||||
| Losses: | 30 percent by the end of the ditch | |||||||||||||||||||||||||||||||||||||||||||||||||||||||||||||||||||||||||||||||||||||||||||||||||||||||||||||||||||||||||||||||||||||||||||||||||||||||||||||||||||||||||||||||||||||||||||||||||||||||||||||||||||||||||||||||||||||||||||||||||||||||
| References: | Bill Knapp, water commissioner, State Engineer.s Office, interview, 29 Aug. 2000 | |||||||||||||||||||||||||||||||||||||||||||||||||||||||||||||||||||||||||||||||||||||||||||||||||||||||||||||||||||||||||||||||||||||||||||||||||||||||||||||||||||||||||||||||||||||||||||||||||||||||||||||||||||||||||||||||||||||||||||||||||||||||
Irrigated Lands Water Rights Database
| PerNo | PerSfx | Facility Name | Priority | Acres | Amount | Unit | SupTyp | Status | Source |
|---|---|---|---|---|---|---|---|---|---|
| Terr | D | Red Hill (Peralta) | April 30, 1883 | 75 | 1.07 | CFS | OS | Adj | Little Goose Creek |
| Terr | D | Big Goose & Beaver (Peralta, Colorado Colony) | Aug. 29, 1885 | 6430 | 92.01 | CFS | OS | Adj | East Fork Big Goose Creek |
| Terr | D | Peralta (Colorado Colony, Red Hill, Big Goose & Beaver) | Nov. 1, 1885 | 3971.5 | 56.7 | CFS | OS | Adj | Cross Creek |
| Terr | D | Peralta (Big Goose & Beaver) | Nov. 1, 1885 | 70.5 | 1 | CFS | OS | Adj | East Fork Big Goose Creek |
| Terr | D | Peralta (Colorado Colony, Red Hill, Big Goose & Beaver) | Nov. 1, 1885 | 3971.5 | 56.7 | CFS | OS | Adj | Cross Creek |
| 238 | E | Enl. Peralta | March 8, 1897 | 55 | 0.78 | CFS | OS | Adj | Cross Creek |
| 381 | E | Enl. Peralta | July 1 1898 | 40 | 0.57 | CFS | OS | Adj | Cross Creek |
| 16007 | D | Peralta | Sep. 15, 1920 | 30.42 | 0.43 | CFS | SS | Adj | North Prong Hurlburt Creek |
| 4298 | E | Enl. Peralta (Colorado Colony) | Nov. 7, 1921 | 1489 | 21.33 | CFS | OS | Adj | Little Goose Creek |
| 4298 | E | Enl. Peralta (Colorado Colony) | Nov. 7, 1921 | 2049 | 0 | SS | Adj | Little Goose Creek | |
| 5601 | E | Enl. Peralta | Feb. 7, 1952 | 200 | 0 | SS | Adj | Little Goose Creek | |
| 5979 | E | Enl. Peralta (Colorado Colony) | April 14, 1952 | 25.72 | 0.37 | CFS | OS | Adj | Little Goose Creek |
| 5978 | E | Enl. Peralta (Colorado Colony) | April 14, 1952 | 456.8 | 6.52 | CFS | OS | Adj | Cross Creek |
| 5979 | E | Enl. Peralta (Colorado Colony) | April 14, 1952 | 693.2 | 0 | SS | Adj | Little Goose Creek |
| Name Source District Data |
Mountain Supply (Peralta) Diversion Cross Creek 4 Total monthly flow in AF | ||||||||||||
| Water Year | Oct | Nov | Dec | Jan | Feb | Mar | Apr | May | Jun | Jul | Aug | Sep | Total |
|---|---|---|---|---|---|---|---|---|---|---|---|---|---|
| 1970 | |||||||||||||
| 1971 | 0.00 | 0.00 | 1806.99 | 2492.43 | 627.17 | 4926.59 | |||||||
| 1972 | 0.00 | 626.50 | 1243.79 | 1885.68 | 1233.52 | 4989.49 | |||||||
| 1973 | 0.00 | 437.75 | 1556.17 | 2073.92 | 718.61 | 4786.45 | |||||||
| 1974 | 0.00 | 1099.24 | 2354.58 | 2512.46 | 674.78 | 6641.06 | |||||||
| 1975 | 0.00 | 294.39 | 2290.81 | 2804.43 | 895.66 | 6285.29 | |||||||
| 1976 | 0.00 | 1105.90 | 2362.71 | 2438.87 | 1340.83 | 7248.31 | |||||||
| 1977 | 0.00 | 2109.42 | 1253.02 | 2142.35 | 739.44 | 6244.23 | |||||||
| 1978 | 0.00 | 0.00 | 1839.09 | 1058.38 | 2651.70 | 5549.17 | |||||||
| 1979 | |||||||||||||
| 1980 | 0.00 | 1178.00 | 2518.00 | 2043.00 | 1058.00 | 6797.00 | |||||||
| 1981 | 271.00 | 1304.00 | 1229.00 | 1342.00 | 1801.00 | 5947.00 | |||||||
| 1982 | 0.00 | 287.00 | 1880.00 | 2670.00 | 968.00 | 5805.00 | |||||||
| 1983 | 0.00 | 1410.00 | 2910.00 | 2290.00 | 1080.00 | 7690.00 | |||||||
| 1984 | 0.00 | 1609.00 | 2277.00 | 2095.00 | 1276.00 | 7257.00 | |||||||
| 1985 | 0.00 | 1536.16 | 2066.93 | 1134.26 | 0.00 | 4737.35 | |||||||
| 1986 | 0.00 | 1728.38 | 1703.87 | 2413.46 | 389.66 | 6235.37 | |||||||
| 1987 | 0.00 | 479.00 | 672.00 | 1529.00 | 584.00 | 3264.00 | |||||||
| 1988 | 0.00 | 789.00 | 2702.00 | 1129.00 | 428.00 | 5048.00 | |||||||
| 1989 | 0.00 | 877.20 | 1885.70 | 2234.10 | 833.40 | 5830.40 | |||||||
| 1990 | 0.00 | 1239.50 | 1039.00 | 1884.40 | 2076.50 | 6239.40 | |||||||
| 1991 | 0.00 | 1768.60 | 1575.60 | 1682.50 | 0.00 | 5026.70 | |||||||
| 1992 | 198.20 | 1650.50 | 1774.30 | 1836.20 | 2242.10 | 7701.30 | |||||||
| 1993 | 0.00 | 1523.70 | 950.60 | 2617.10 | 2132.50 | 7223.90 | |||||||
| 1994 | 0.00 | 1093.70 | 2091.40 | 1765.90 | 315.50 | 5266.50 | |||||||
| 1995 | 0.00 | 0.00 | 804.00 | 2930.90 | 1582.10 | 5317.00 | |||||||
| 1996 | 0.00 | 2245.10 | 1592.10 | 2438.70 | 1380.40 | 7656.30 | |||||||
| 1997 | 0.00 | 2231.20 | 1542.70 | 1790.10 | 1695.60 | 7259.60 | |||||||
| 1998 | 50.40 | 1808.60 | 2047.00 | 1500.20 | 1967.50 | 7373.70 | |||||||
| 1999 | 0.00 | 2178.30 | 2171.00 | 2891.90 | 776.30 | 8017.50 | |||||||
| Mean | 18.56 | 1164.65 | 1790.69 | 2058.08 | 1123.87 | 6155.84 | |||||||
| Max | 271.00 | 2245.10 | 2910.00 | 2930.90 | 2651.70 | 8017.50 | |||||||
| Min | 0.00 | 0.00 | 672.00 | 1058.38 | 0.00 | 3264.00 | |||||||
| Name Source District Data |
Mountain Supply (Peralta) Diversion Ditch Cross Creek 4 First & Last Dates, Max. Days | ||
| Water Year | First Date of Measurement | Last Date of Measurement | Maximum Days Missing |
|---|---|---|---|
| 1970 | |||
| 1971 | 01-Jul | 30-Sep | 5 |
| 1972 | 10-Jun | 30-Sep | 0 |
| 1973 | 25-Jun | 18-Sep | 0 |
| 1974 | 11-Jun | 22-Sep | 0 |
| 1975 | 19-Jun | 17-Sep | 0 |
| 1976 | 07-Jun | 28-Sep | 0 |
| 1977 | 01-Jun | 30-Sep | 0 |
| 1978 | 01-Jul | 30-Sep | 0 |
| 1979 | |||
| 1980 | 13-Jun | 30-Sep | 0 |
| 1981 | 04-May | 30-Sep | 0 |
| 1982 | 25-Jun | 17-Sep | 0 |
| 1983 | 15-Jun | 30-Sep | 0 |
| 1984 | 05-Jun | 30-Sep | 0 |
| 1985 | 03-Jun | 29-Aug | 0 |
| 1986 | 11-Jun | 08-Sep | 0 |
| 1987 | 10-Jun | 30-Sep | 0 |
| 1988 | 05-Jun | 25-Sep | 0 |
| 1989 | 01-Jun | 20-Sep | 0 |
| 1990 | 20-Jun | 30-Sep | 0 |
| 1991 | 05-Jun | 30-Aug | 0 |
| 1992 | 12-May | 30-Sep | 0 |
| 1993 | 11-Jun | 30-Sep | 0 |
| 1994 | 06-Jun | 30-Sep | 0 |
| 1995 | 13-Jul | 30-Sep | 0 |
| 1996 | 03-Jun | 30-Sep | 0 |
| 1997 | 05-Jun | 30-Sep | 0 |
| 1998 | 26-May | 30-Sep | 0 |
| 1999 | 11-Jun | 30-Sep | 0 |
| Avg. | 09-Jun | 24-Sep | 0 |
| Earliest | 04-May | 29-Aug | 0 |
| Latest | 13-Jul | 30-Sep | 5 |
| Name Source District Data |
Peralta Ditch Diversion Little Goose Creek 4 Total monthly flow in AF | ||||||||||||
| Water Year | Oct | Nov | Dec | Jan | Feb | Mar | Apr | May | Jun | Jul | Aug | Sep | Total |
|---|---|---|---|---|---|---|---|---|---|---|---|---|---|
| 1970 | |||||||||||||
| 1971 | 0.00 | 783.15 | 1420.36 | 944.96 | 792.24 | 170.70 | 4111.41 | ||||||
| 1972 | 0.00 | 189.42 | 1970.97 | 999.89 | 962.78 | 533.04 | 4656.10 | ||||||
| 1973 | 0.00 | 2.34 | 1587.29 | 1203.41 | 827.50 | 972.89 | 4593.43 | ||||||
| 1974 | 0.00 | 529.78 | 1743.67 | 992.33 | 769.39 | 550.81 | 4585.98 | ||||||
| 1975 | 0.00 | 0.00 | 60.85 | 485.81 | 1026.45 | 746.56 | 2319.67 | ||||||
| 1976 | |||||||||||||
| 1977 | 0.00 | 966.64 | 1117.69 | 742.71 | 599.29 | 178.51 | 3604.84 | ||||||
| 1978 | 0.00 | 0.00 | 0.00 | 0.00 | 220.54 | 814.61 | 1035.15 | ||||||
| 1979 | |||||||||||||
| 1980 | 100.00 | 1601.00 | 1446.00 | 358.00 | 142.00 | 236.00 | 3883.00 | ||||||
| 1981 | 142.00 | 573.00 | 1211.00 | 444.00 | 232.00 | 248.00 | 2850.00 | ||||||
| 1982 | 0.00 | 229.00 | 1370.00 | 1010.00 | 1040.00 | 624.00 | 4273.00 | ||||||
| 1983 | 0.00 | 0.00 | 1200.00 | 1020.00 | 580.00 | 298.00 | 3098.00 | ||||||
| 1984 | 0.00 | 0.00 | 70.69 | 971.22 | 493.51 | 295.20 | 1830.62 | ||||||
| 1985 | 0.00 | 744.17 | 1534.50 | 774.90 | 429.09 | 147.85 | 3630.51 | ||||||
| 1986 | 0.00 | 302.21 | 1411.86 | 792.79 | 569.64 | 423.62 | 3500.12 | ||||||
| 1987 | 0.00 | 1297.00 | 1042.00 | 559.00 | 707.00 | 356.00 | 3961.00 | ||||||
| 1988 | 52.00 | 496.00 | 1494.00 | 681.00 | 363.00 | 159.00 | 3245.00 | ||||||
| 1989 | 0.00 | 0.00 | 1534.00 | 708.90 | 675.00 | 431.50 | 3349.40 | ||||||
| 1990 | 0.00 | 0.00 | 312.00 | 758.60 | 663.90 | 400.20 | 2134.70 | ||||||
| 1991 | 0.00 | 27.30 | 653.80 | 765.40 | 359.40 | 152.80 | 1958.70 | ||||||
| 1992 | 36.50 | 607.00 | 985.60 | 905.50 | 713.90 | 690.40 | 3938.90 | ||||||
| 1993 | 0.00 | 375.30 | 558.40 | 452.50 | 759.40 | 622.30 | 2767.90 | ||||||
| 1994 | 0.00 | 431.80 | 758.80 | 382.00 | 357.30 | 324.30 | 2254.20 | ||||||
| 1995 | 0.00 | 0.00 | 0.00 | 433.40 | 955.80 | 456.20 | 1845.40 | ||||||
| 1996 | 0.00 | 87.00 | 786.30 | 778.60 | 566.30 | 414.20 | 2632.40 | ||||||
| 1997 | 0.00 | 334.80 | 284.20 | 715.30 | 738.60 | 596.30 | 2669.20 | ||||||
| 1998 | 0.00 | 864.20 | 1034.30 | 928.00 | 738.30 | 1049.40 | 4614.20 | ||||||
| 1980 | 0.00 | 4.66 | 577.00 | 772.00 | 690.00 | 357.00 | 2400.66 | ||||||
| Mean | 12.24 | 386.88 | 969.08 | 725.19 | 628.60 | 453.68 | 3175.68 | ||||||
| Max | 142.00 | 1601.00 | 1970.97 | 1203.41 | 1040.00 | 1049.40 | 4656.10 | ||||||
| Min | 0.00 | 0.00 | 0.00 | 0.00 | 142.00 | 147.85 | 1035.15 | ||||||
| Name Source District Data |
Peralta Ditch Diversion Little Goose Creek 4 First & Last Dates, Max. Days | ||
| Water Year | First Date of Measurement | Last Date of Measurement | Maximum Days Missing |
|---|---|---|---|
| 1970 | |||
| 1971 | 17-May | 30-Sep | 0 |
| 1972 | 29-May | 02-Oct | 0 |
| 1973 | 21-May | 27-Sep | 0 |
| 1974 | 20-May | 30-Sep | 0 |
| 1975 | 18-Jun | 30-Sep | 0 |
| 1976 | |||
| 1977 | 10-May | 30-Sep | 0 |
| 1978 | 17-Aug | 30-Sep | 0 |
| 1979 | |||
| 1980 | 22-Apr | 30-Sep | 0 |
| 1981 | 17-Apr | 30-Sep | 0 |
| 1982 | 13-May | 30-Sep | 0 |
| 1983 | 08-Jun | 30-Sep | 0 |
| 1984 | 23-Jun | 30-Sep | 0 |
| 1985 | 01-May | 30-Sep | 0 |
| 1986 | 17-May | 30-Sep | 0 |
| 1987 | 01-May | 30-Sep | 0 |
| 1988 | 19-Apr | 30-Sep | 0 |
| 1989 | 01-Jun | 30-Sep | 0 |
| 1990 | 18-Jun | 30-Sep | 0 |
| 1991 | 20-May | 30-Sep | 0 |
| 1992 | 27-Apr | 30-Sep | 0 |
| 1993 | 11-May | 30-Sep | 0 |
| 1994 | 18-May | 30-Sep | 0 |
| 1995 | 12-Jul | 30-Sep | 0 |
| 1996 | 21-May | 30-Sep | 0 |
| 1997 | 05-May | 30-Sep | 0 |
| 1998 | 05-May | 30-Sep | 0 |
| 1999 | 28-May | 30-Sep | 0 |
| Avg | 22-May | 29-Sep | 0 |
| Earliest | 17-Apr | 27-Sep | 0 |
| Latest | 17-Aug | 02-Oct | 0 |