Wyoming State Water Plan
Wyoming State Water Plan
Wyoming Water Development Office
6920 Yellowtail Rd
Cheyenne, WY 82002
Phone: 307-777-7626

Wyoming Water Development Office
6920 Yellowtail Rd
Cheyenne, WY 82002
Phone: 307-777-7626


| SUBJECT: |
Appendix A Irrigation Diversion Operation and Description CLEAR CREEK |
| PREPARED BY: | HKM Engineering Inc. |
| DATE: | March 2002 |
CLEAR CREEK
BIG BONANZA DITCH DIVERSION
CLEAR CREEK LAND & DITCH CO. DITCH DIVERSION
CROWN DITCH DIVERSION
DES MOINES DITCH DIVERSION
FOUR LAKES & FRENCH CREEK DITCH DIVERSION
FRANK G. HOPKINS DITCH DIVERSION
HILLYER & ONSLOW DITCH DIVERSION
JOHNSON-HOLT DITCH DIVERSION
KENDRICK DITCH DIVERSION
PRATT & FERRIS NO. 2 DITCH DIVERSION
PRATT & FERRIS NO. 3 DITCH DIVERSION
REDMAN DITCH DIVERSION
ROBERTS DITCH DIVERSION
SIX MILE DITCH DIVERSION
CLEAR CREEK DRAINAGE
INTRODUCTION
BACKGROUND
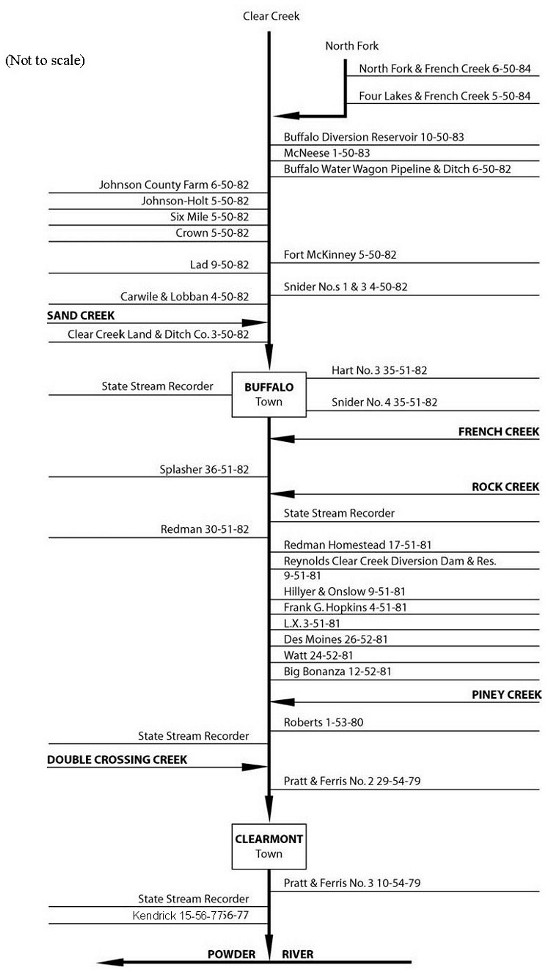
Clear Creek flows out of the east slope of the Bighorn Mountains, gathering French, Piney, Rock, Double Crossing, Bull, and Sand creeks in addition to its own North, South, and Middle forks. It finally joins the Powder River well north of Arvada, Wyoming. The Powder River crosses the Montana state line north of Spotted Horse, Wyoming.
CHACTERISTICS
Losses on upper Clear Creek are low, thanks to the stream.s steep descent to the foothills of the Bighorn Mountains. But it becomes a slow-moving, relatively high-loss stream just before it enters Buffalo. Releases from Lake DeSmet are calculated to take 33 hours to reach Pratt & Ferris No. 3, the first diversion downstream from Clearmont. Clear Creek also passes through Buffalo and Clearmont. The slower velocities and meanders of the lower elevation passage and low-volume pumps tapping Clear Creek.s flows through the two towns contribute to its losses; its storage (see below) helps ameliorate much of this for irrigators. Nevertheless, water commissioners work carefully with irrigators to ensure that Clear Creek normally dries up at least twice before it can reach the Powder. Return flows recharge the creek.s flows downstream of Pratt & Ferris No. 3 enough to provide flows for the Kendrick Canal, which in turn diverts all of the creek.s flows.
Clear Creek drainage also contains many transbasin diversions. Four Lakes diversion moves water out of Clear Creek into its tributaries through French Creek, then to Penrose to deliver the water to Johnson Creek (a tributary of Rock Creek, which is a tributary of Clear Creek), where the water is used.
USAGE
Clear Creek.s diversions are used primarily by agricultural irrigation, but also find municipal, industrial, and recreation uses.
Regulation
Water commissioners estimate that regulation is imposed on Clear Creek drainage diversions with the following timing:
| Wet Year | Average Year | Dry Year |
|---|---|---|
| mid-August | mid-July | mid-June |
Agriculture
Growers in the Clear Creek drainage tend to plant acreage in the following pattern:
The grains (usually barley or oats) are used to rejuvenate the soil after approximately five years of alfalfa/grass growth. Corn is used as a silage crop.
The typical irrigation season runs from April 15-May 1 (depending on whether the spring runoff is delayed by colder weather) to early/mid October (depending on when the first snows fall and the ground freezes). Approximately 40 percent of the irrigators practice post-season irrigation, though they usually do not use their entire right to do so.
Irrigation Practices
| Type of irrigation | Percentage of irrigated land |
|---|---|
| Ditch-flood | 65 |
| Gated pipe | 15 |
| Sprinkler | 20 |
Water commissioners calculate the .shrinkage,. or instream loss from reservoir requests depending on the distance between the reservoir and diversion. In general, for Clear and Rock creeks, irrigators are charged approximately one percent loss per mile of travel from reservoir release to headgate, as long as the headgate is upstream of Lake DeSmet. The system changes there. A summary of the major reservoir shrinkage schemes used by the water commissioners follow:
Lake DeSmet
DeSmet.s shrinkage is experientially based for each headgate downstream from the reservoir. Numbers are essentially independent of the amount of water available to the system in any given year:
| Diversion | Flow loss (%) |
|---|---|
| Upper E | 1 |
| Lower E | 2 |
| Maverick | 2 |
| Sturdevant | 2 |
| WJD | 3 |
| Athorpe | 4 |
| Dunlop | 5 |
| Pratt & Ferris No. 1 | 10 |
| Roberts | 15 |
| Pratt & Ferris No. 2 | 23 |
| Pratt & Ferris No. 3 | 25 |
| Ucross Pumps | 15 |
| Smith Pumps | 15 |
| Ucross Lower Pumps | 20 |
Willow Park and Cloud Peak Reservoirs
Irrigators requesting water from rights in Willow and Cloud Peak reservoirs are assessed flat shrinkages depending on location. Water commissioners estimate the shrinkage based on distance downstream from the high-elevation reservoirs:
At mouth of canyon (HF Bar):
| Type of water year | Shrinkage (% of flow/volume) |
|---|---|
| Wet | 0 |
| Average | 10 |
| Dry | 20 |
Downstream of Buffalo:
| Type of water year | Shrinkage (% of flow/volume) |
|---|---|
| Wet | 25 |
| Average | 50 |
| Dry | 50 |
Double Appropriation
Irrigation water rights with priority dates of March 1, 1945 or earlier are entitled to an additional 1cfs per 70 acres under Wyoming.s surplus water statutes. Whenever the supply in a stream exceeds the amount required to satisfy all existing appropriations established prior to March 1, 1985, the stream is said to be in an excess flow condition and water right holders with priorities between March 2, 1945 and March 1, 1985 may use an additional 1 cfs for each 70 acres irrigated.
In Clear Creek, this practice is limited primarily by the condition of ditches that follow the diversions from the creek. Many of the ditches are not capable of carrying all of the water an irrigator could use.
| % of appropriation | % of ditches in drainage capable of flow |
|---|---|
| 200 | 20 |
| 150 | 60 |
| 100-150 | 90 |
| 0-100 | 90 |
Permitted Uses
Permits granted for water appropriation are granted for specific uses. The following pages contain tables of permits and their associated uses. The following table provides a key to those uses:
| Code | Use |
|---|---|
| Chem | Chemical |
| Com | Commercial |
| Cul | Culinary |
| D | Domestic |
| Drl | Drilling |
| Eng | Steam Engines |
| Fire | Fire Protection |
| Fish | Fish Propogation |
| F.C. | Flood Control |
| I | Irrigation |
| Ind | Industrial |
| I.F. | Instream Flow |
| Mech | Mechanical |
| Mfg | Manufacturing |
| Mil | Milling |
| Min | Mining |
| Misc | Miscellaneous |
| Mun | Municipal |
| Oil | Oil Refining or Production |
| P.C. | Pollution Control |
| Power | Power Development |
| R.R. | Railroad |
| Rec | Recreational |
| Ref | Refining |
| Res. Supply | Supply Facility for a Reservoir |
| S | Stock |
| T | Transportation |
WATER RIGHTS
Two water rights summary tables are provided for each diversion serving irrigation referenced here. The first, included in the body of the diversion synopsis, refers to the rights on record with the State Engineer.s Office and is derived from that office.s Tabulation of Adjudicated Surface Water Rights of the State of Wyoming, Water Division Number Two (Oct. 1999).
Because this rights summary is pulled directly from the SEO Tab, the rights cited follow the SEO.s priority order:
| Hierarchy | Format of right | Example |
|---|---|---|
| 1 | Day, Month, Year | 05-15-1884 |
| 2 | Month and Year | 05-00-1884 |
| 3 | Specified Season and Year | Spring 1884 |
| 4 | Year Only | 1884 |
| 5 | Before Year | Before 1884 |
Board orders or court orders may also establish a specific priority.
Irrigated Lands Water Rights Database
The second table, which follows the diversion synopsis, is taken from the irrigated lands water rights database developed for the basin plan. It can be used as a reference with the following caveats: It only lists water rights associated with the irrigated lands polygons mapped by HKM. The table does not include nonirrigation rights devoted to reservoir supply, municipal, fish propagation, etc. The rights on this table are associated only with those irrigated lands identified through the course of this study, both actively irrigated and currently idle.
| Column Heading Key | ||
| PerNo | Permit Number | "Terr" denotes a territorial right. |
| PerSfx | Permit Suffix | D = direct flow |
| E = enlargement | ||
| R = reservoir | ||
| Facility Name | Parantheses denote the former means of conveyance for the water right. | |
| Unit | Flow or volume | CFS = cubic feet per second |
| AF = acre-feet | ||
| GPM = gallons per minute | ||
| SupTyp | Supply Type | OS = original supply |
| SS = supplement supply, for lands having an original supply from another source. | ||
| Sec = secondary supply, for water stored in a reservoir | ||
| Status | Status of adjudication | Adj = adjudicated |
| Una = unadjudicated | ||
| Source | Source water | Parantheses denote the permit number of the related storage right. |
Schematic of Clear Creek stream and diversions:
KEY DIVERSIONS
| Diversion: | BIG BONANZA DITCH DIVERSION | 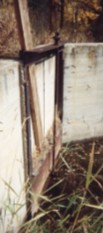 Big Bonanza headgate | ||||||||||||||||||||||||
| Date: | 4 Oct. 2000 | |||||||||||||||||||||||||
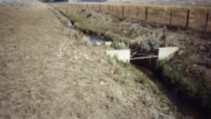
| Diversion Description: | Headgate consists of a single, 1 x 6-foot rectangular steel gate operated with Waterman-type screw (missing handle), mounted in concrete headwall. | |||||||||||||||||||||||||
| Diversion Location: | The Big Bonanza Ditch diversion is located on the main stem of Clear Creek just upstream of the creek.s confluence with Piney Creek. | |||||||||||||||||||||||||
|
 Big Bonanza flume | |||||||||||||||||||||||||
| Conveyance Description: | Open channel canal, approximately 4.9 mi. long, well above Clear Creek channel. | |||||||||||||||||||||||||
| Direct Flow Water Rights: |
| |||||||||||||||||||||||||
| Associated Storage Rights: | Irrigators on the Big Bonanza Ditch have rights in Healy and Lake DeSmet reservoirs. | |||||||||||||||||||||||||
| Irrigation Practices: | See introduction to Clear Creek drainage | |||||||||||||||||||||||||
| Agricultural Practices: | See introduction to Clear Creek drainage | |||||||||||||||||||||||||
| Return Flows: | Estimated percentage of total diversion developing into return flows: | |||||||||||||||||||||||||
| ||||||||||||||||||||||||||
| Losses: | Approximately 15 percent by the end of the ditch | |||||||||||||||||||||||||
| References: | Carmine Loguidice, Interview, State Engineer.s Office, 4 Oct. 2000 | |||||||||||||||||||||||||
Irrigated Lands Water Rights Database
| PerNo | PerSfx | Facility Name | Priority | Acres | Amount | Unit | SupTyp | Status | Source |
|---|---|---|---|---|---|---|---|---|---|
| Terr | D | Big Bonanza, 1st Appropriation | April 30, 1882 | 520 | 7.43 | CFS | OS | Adj | Clear Creek |
| Terr | D | Big Bonanza, 2nd Appropriation | Dec. 31, 1883 | 1000 | 14.28 | CFS | OS | Adj | Clear Creek |
| 1174 | E | Enl. Des Moinse L&C CO (Big Bonanza) | Jan. 19, 1904 | 205 | 2.92 | CFS | OS | Adj | Clear Creek |
| 6396 | E | Enl. Big Bonanza | April 28, 1971 | 33.51 | 0.48 | CFS | OS | Una | Clear Creek |
| Name Source District Data |
Big Bonanza Ditch Diversion Clear Creek 2 Total monthly flow in AF | ||||||||||||
| Water Year | Oct | Nov | Dec | Jan | Feb | Mar | Apr | May | Jun | Jul | Aug | Sep | Total |
|---|---|---|---|---|---|---|---|---|---|---|---|---|---|
| 1970 | |||||||||||||
| 1971 | |||||||||||||
| 1972 | |||||||||||||
| 1973 | |||||||||||||
| 1974 | 728.91 | 1274.10 | 1614.60 | 0.00 | 0.00 | 3617.61 | |||||||
| 1975 | |||||||||||||
| 1976 | |||||||||||||
| 1977 | |||||||||||||
| 1978 | |||||||||||||
| 1979 | |||||||||||||
| 1980 | |||||||||||||
| 1981 | 588.42 | 1253.74 | 1304.61 | 838.01 | 764.40 | 4749.18 | |||||||
| 1982 | 0.00 | 695.63 | 1379.42 | 1254.90 | 543.27 | 3873.22 | |||||||
| 1983 | 111.97 | 1274.27 | 1069.58 | 0.00 | 0.00 | 2455.82 | |||||||
| 1984 | 0.00 | 930.53 | 1560.60 | 1403.23 | 562.71 | 4457.07 | |||||||
| 1985 | 0.00 | 186.55 | 1374.17 | 1161.25 | 508.20 | 3230.17 | |||||||
| 1986 | 865.42 | 1445.76 | 1289.11 | 1007.63 | 298.05 | 4905.97 | |||||||
| 1987 | 872.00 | 856.49 | 850.91 | 989.15 | 3.97 | 3572.52 | |||||||
| 1988 | 1145.47 | 1010.49 | 1247.97 | 747.27 | 271.43 | 4422.63 | |||||||
| 1989 | 641.77 | 1233.13 | 1263.66 | 395.27 | 100.01 | 3633.84 | |||||||
| 1990 | 667.95 | 1017.10 | 1065.00 | 613.67 | 673.40 | 4037.12 | |||||||
| 1991 | 289.48 | 330.02 | 1132.74 | 1359.67 | 588.10 | 3700.01 | |||||||
| 1992 | 1426.50 | 451.43 | 368.32 | 692.53 | 204.31 | 3143.09 | |||||||
| 1993 | 234.61 | 588.19 | 227.51 | 290.43 | 321.51 | 1662.25 | |||||||
| 1994 | 212.37 | 836.99 | 637.75 | 295.19 | 0.00 | 1982.30 | |||||||
| 1995 | 120.95 | 709.33 | 1041.61 | 742.67 | 167.70 | 2782.26 | |||||||
| 1996 | 305.66 | 467.83 | 908.74 | 687.53 | 61.67 | 2431.43 | |||||||
| 1997 | 137.76 | 571.97 | 129.21 | 56.15 | 0.00 | 895.09 | |||||||
| 1998 | 610.97 | 1047.35 | 1153.80 | 390.06 | 0.00 | 3202.18 | |||||||
| 1999 | 0.00 | 542.28 | 825.32 | 798.15 | 0.00 | 2165.75 | |||||||
| Mean | 448.01 | 836.16 | 1022.23 | 686.14 | 253.44 | 3245.98 | |||||||
| Max | 1426.50 | 1445.76 | 1614.60 | 1403.23 | 764.40 | 4905.97 | |||||||
| Min | 0.00 | 186.55 | 129.21 | 0.00 | 0.00 | 895.09 | |||||||
| Name Source District Data |
Big Bonanza Ditch Diversion Clear Creek 2 First & Last Dates, Max. Days | ||
| Water Year | First Date of Measurement | Last Date of Measurement | Maximum Days Missing |
|---|---|---|---|
| 1970 | |||
| 1971 | |||
| 1972 | |||
| 1973 | |||
| 1974 | 14-May | 20-Jul | 0 |
| 1975 | |||
| 1976 | |||
| 1977 | |||
| 1978 | |||
| 1979 | |||
| 1980 | |||
| 1981 | 15-May | 24-Sep | 14 |
| 1982 | 13-Jun | 12-Sep | 12 |
| 1983 | 22-May | 24-Jul | 9 |
| 1984 | 02-Jun | 11-Sep | 9 |
| 1985 | 25-Jun | 18-Sep | 5 |
| 1986 | 20-May | 08-Sep | 5 |
| 1987 | 15-May | 03-Sep | 6 |
| 1988 | 20-May | 15-Sep | 4 |
| 1989 | 16-May | 14-Sep | 8 |
| 1990 | 21-May | 13-Sep | 12 |
| 1991 | 18-May | 14-Sep | 8 |
| 1992 | 15-May | 27-Sep | 27 |
| 1993 | 26-May | 30-Sep | 19 |
| 1994 | 20-May | 24-Aug | 40 |
| 1995 | 26-May | 18-Sep | 17 |
| 1996 | 21-May | 16-Sep | 19 |
| 1997 | 29-May | 13-Aug | 27 |
| 1998 | 15-May | 19-Aug | 9 |
| 1999 | 03-Jun | 30-Aug | 13 |
| Avg. | 24-May | 05-Sep | 13 |
| Earliest | 14-May | 20-Jul | 0 |
| Latest | 25-Jun | 30-Sep | 40 |
KEY DIVERSIONS
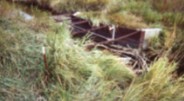
| Diversion: | CLEAR CREEK LAND & DITCH DITCH CO. DITCH DIVERSION | 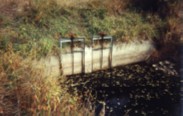 Clear Creek Land & Ditch Co. headgate | ||||||||||||||||||||||||||||||||||||||||||||||||||||||
| Date: | 4 Oct. 2000 | |||||||||||||||||||||||||||||||||||||||||||||||||||||||
| Diversion Description: | Headgate consists of two, 2.9 x 2.7-foot rectangular steel gates operated with Waterman-type screws, mounted in concrete headwall. | |||||||||||||||||||||||||||||||||||||||||||||||||||||||
| Diversion Location: | The Clear Creek Land & Ditch Co. diversion is located on the main stem of Clear Creek just upstream from the town of Buffalo. | 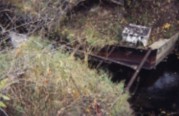 Clear Creek Land & Ditch Co. flume | ||||||||||||||||||||||||||||||||||||||||||||||||||||||
|
||||||||||||||||||||||||||||||||||||||||||||||||||||||||
| Conveyance Description: | Open channel canal, approximately 4.0 mi. long. | |||||||||||||||||||||||||||||||||||||||||||||||||||||||
| Direct Flow Water Rights: |
| |||||||||||||||||||||||||||||||||||||||||||||||||||||||
| Associated Storage Rights: | None | |||||||||||||||||||||||||||||||||||||||||||||||||||||||
| Irrigation Practices: | See introduction to Clear Creek drainage | |||||||||||||||||||||||||||||||||||||||||||||||||||||||
| Agricultural Practices: | See introduction to Clear Creek drainage | |||||||||||||||||||||||||||||||||||||||||||||||||||||||
| Return Flows: | Estimated percentage of total diversion developing into return flows: | |||||||||||||||||||||||||||||||||||||||||||||||||||||||
| ||||||||||||||||||||||||||||||||||||||||||||||||||||||||
| Losses: | Approximately 10 - 15 percent by the end of the ditch | |||||||||||||||||||||||||||||||||||||||||||||||||||||||
| References: | Dave Pelloux, Interview, State Engineer.s Office, 25 Oct. 2000 | |||||||||||||||||||||||||||||||||||||||||||||||||||||||
Irrigated Lands Water Rights Database
| PerNo | PerSfx | Facility Name | Priority | Acres | Amount | Unit | SupTyp | Status | Source |
|---|---|---|---|---|---|---|---|---|---|
| Terr | D | Clear Creek Land & Ditch Co. | June 20, 1883 | 1045 | 14.91 | CFS | OS | Adj | Clear Creek |
| Terr | D | Clear Creek Land & Ditch Co. | March 24, 1884 | 240 | 3.43 | CFS | OS | Adj | Clear Creek |
| Terr | D | Clear Creek Land & Ditch Co., 2nd App. | May 31, 1887 | 350 | 5 | CFS | OS | Adj | Clear Creek |
| 4220 | E | Enl. Clear Creek Land & Ditch Co. | Sep. 23, 1920 | 80 | 0 | SS | Adj | Clear Creek |
| Name Source District Data |
Clear Creek Land & Ditch Co. Ditch Diversion Clear Creek 2 Total monthly flow in AF | ||||||||||||
| Water Year | Oct | Nov | Dec | Jan | Feb | Mar | Apr | May | Jun | Jul | Aug | Sep | Total |
|---|---|---|---|---|---|---|---|---|---|---|---|---|---|
| 1970 | |||||||||||||
| 1971 | |||||||||||||
| 1972 | |||||||||||||
| 1973 | |||||||||||||
| 1974 | 632.59 | 1468.05 | 709.51 | 0.00 | 0.00 | 2810.15 | |||||||
| 1975 | |||||||||||||
| 1976 | |||||||||||||
| 1977 | |||||||||||||
| 1978 | |||||||||||||
| 1979 | |||||||||||||
| 1980 | |||||||||||||
| 1981 | 409.17 | 574.22 | 441.24 | 246.97 | 0.00 | 1671.60 | |||||||
| 1982 | 0.00 | 652.95 | 867.10 | 828.66 | 398.90 | 2747.61 | |||||||
| 1983 | 0.00 | 250.01 | 795.98 | 0.00 | 0.00 | 1045.99 | |||||||
| 1984 | 10.69 | 627.59 | 693.23 | 679.72 | 222.72 | 2233.95 | |||||||
| 1985 | 0.00 | 161.34 | 749.18 | 659.63 | 346.79 | 1916.94 | |||||||
| 1986 | 308.38 | 1085.12 | 680.71 | 764.89 | 194.02 | 3033.12 | |||||||
| 1987 | 460.90 | 660.07 | 981.54 | 745.30 | 146.55 | 2994.36 | |||||||
| 1988 | |||||||||||||
| 1989 | 647.24 | 1258.07 | 1133.15 | 699.34 | 366.99 | 4104.79 | |||||||
| 1990 | 632.47 | 1129.67 | 873.03 | 983.48 | 53.66 | 3672.31 | |||||||
| 1991 | 102.99 | 1037.98 | 1064.49 | 1043.43 | 384.44 | 3633.33 | |||||||
| 1992 | 694.43 | 578.35 | 166.28 | 925.78 | 329.40 | 2694.24 | |||||||
| 1993 | 506.24 | 789.25 | 356.56 | 940.61 | 341.96 | 2934.62 | |||||||
| 1994 | 694.19 | 1125.77 | 990.93 | 603.53 | 0.00 | 3414.42 | |||||||
| 1995 | 63.50 | 1142.81 | 521.74 | 984.14 | 416.51 | 3128.70 | |||||||
| 1996 | 202.86 | 732.38 | 916.45 | 727.13 | 320.86 | 2899.68 | |||||||
| 1997 | 91.21 | 571.89 | 328.61 | 0.00 | 0.00 | 991.71 | |||||||
| 1998 | 192.30 | 786.85 | 836.08 | 686.18 | 547.27 | 3048.68 | |||||||
| 1999 | 0.00 | 544.98 | 599.09 | 780.10 | 180.89 | 2105.06 | |||||||
| Mean | 297.32 | 798.81 | 721.31 | 647.31 | 223.73 | 2688.49 | |||||||
| Max | 694.43 | 1468.05 | 1133.15 | 1043.43 | 547.27 | 4104.79 | |||||||
| Min | 0.00 | 161.34 | 166.28 | 0.00 | 0.00 | 991.71 | |||||||
| Name Source District Data |
Clear Creek Land & Ditch Co. Ditch Diversion Clear Creek 2 First & Last Dates, Max. Days | ||
| Water Year | First Date of Measurement | Last Date of Measurement | Maximum Days Missing |
|---|---|---|---|
| 1970 | |||
| 1971 | |||
| 1972 | |||
| 1973 | |||
| 1974 | 16-May | 28-Jul | 0 |
| 1975 | |||
| 1976 | |||
| 1977 | |||
| 1978 | |||
| 1979 | |||
| 1980 | |||
| 1981 | 06-May | 25-Aug | 19 |
| 1982 | 03-Jun | 15-Sep | 19 |
| 1983 | 17-Jun | 26-Jul | 11 |
| 1984 | 31-May | 12-Sep | 8 |
| 1985 | 25-Jun | 18-Sep | 4 |
| 1986 | 15-May | 08-Sep | 6 |
| 1987 | 14-May | 10-Sep | 5 |
| 1988 | |||
| 1989 | 15-May | 15-Sep | 6 |
| 1990 | 15-May | 13-Sep | 12 |
| 1991 | 28-May | 14-Sep | 8 |
| 1992 | 15-May | 27-Sep | 28 |
| 1993 | 17-May | 30-Sep | 16 |
| 1994 | 12-May | 24-Aug | 40 |
| 1995 | 26-May | 18-Sep | 17 |
| 1996 | 21-May | 16-Sep | 19 |
| 1997 | 29-May | 29-Jul | 19 |
| 1998 | 21-May | 28-Sep | 9 |
| 1999 | 03-Jun | 08-Sep | 11 |
| Avg. | 23-May | 06-Sep | 14 |
| Earliest | 06-May | 26-Jul | 0 |
| Latest | 25-Jun | 30-Sep | 40 |
KEY DIVERSIONS
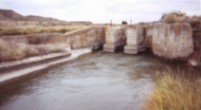
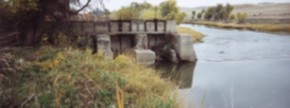
| Diversion: | CROWN DITCH DIVERSION | 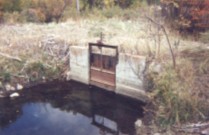 Crown Ditch Headgate | ||||||||||||||||||||||||||||||||||||||||||||||||||||||||||||||||||
| Date: | 4 Oct. 2000 | |||||||||||||||||||||||||||||||||||||||||||||||||||||||||||||||||||
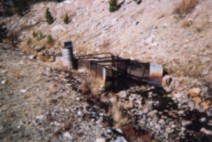
| Diversion Description: | Headgate consists of a single, 3.7 x 1-foot rectangular steel gate operated with Waterman-type screw, mounted in concrete headwall. | |||||||||||||||||||||||||||||||||||||||||||||||||||||||||||||||||||
| Diversion Location: | The Crown diversion is located on the main stem of Clear Creek between the confluences of Clear Creek and North Fork and Sand creeks. | |||||||||||||||||||||||||||||||||||||||||||||||||||||||||||||||||||
|
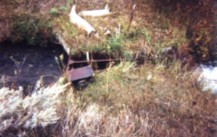 Crown Ditch Flume | |||||||||||||||||||||||||||||||||||||||||||||||||||||||||||||||||||
| Conveyance Description: | Open channel canal, approximately 5.3 mi. long. | |||||||||||||||||||||||||||||||||||||||||||||||||||||||||||||||||||
| Direct Flow Water Rights: |
| |||||||||||||||||||||||||||||||||||||||||||||||||||||||||||||||||||
| Associated Storage Rights: | None | |||||||||||||||||||||||||||||||||||||||||||||||||||||||||||||||||||
| Irrigation Practices: | See introduction to Clear Creek drainage | |||||||||||||||||||||||||||||||||||||||||||||||||||||||||||||||||||
| Agricultural Practices: | See introduction to Clear Creek drainage | |||||||||||||||||||||||||||||||||||||||||||||||||||||||||||||||||||
| Return Flows: | Estimated percentage of total diversion developing into return flows: | |||||||||||||||||||||||||||||||||||||||||||||||||||||||||||||||||||
| ||||||||||||||||||||||||||||||||||||||||||||||||||||||||||||||||||||
| Losses: | Approximately 15 percent by the end of the ditch | |||||||||||||||||||||||||||||||||||||||||||||||||||||||||||||||||||
| References: | Dave Pelloux, Interview, State Engineer.s Office, 4 Oct. 2000 | |||||||||||||||||||||||||||||||||||||||||||||||||||||||||||||||||||
Irrigated Lands Water Rights Database
| PerNo | PerSfx | Facility Name | Priority | Acres | Amount | Unit | SupTyp | Status | Source |
|---|---|---|---|---|---|---|---|---|---|
| Terr | D | Crown | Dec. 31, 1884 | 639.75 | 9.13 | CFS | OS | Adj | Clear Creek |
| 1269 | E | Enl. Crown | Aug. 24, 1904 | 48.39 | 0 | SS | Adj | Clear Creek | |
| 1347 | E | Enl. Crown | Jan. 23, 1905 | 157 | 2.24 | CFS | OS | Adj | Clear Creek |
| 2151 | E | Enl. Crown | Aug. 6, 1909 | 76 | 1.08 | CFS | OS | Adj | Clear Creek |
| 2404 | E | Enl. Crown | Jan. 27, 1911 | 110.8 | 1.59 | CFS | OS | Una | Clear Creek |
| 3965 | E | Enl. Crown | Feb. 1, 1919 | 20 | 0.28 | CFS | OS | Adj | Clear Creek |
| 4051 | E | Enl. Crown | Dec. 5, 1919 | 138.5 | 1.97 | CFS | OS | Adj | Clear Creek |
| 4221 | E | Enl. Crown | Sep. 23, 1920 | 108 | 1.54 | CFS | OS | Una | Clear Creek |
| 5292 | E | Enl. Crown | April 24, 1935 | 13 | 0 | SS | Adj | Clear Creek |
| Name Source District Data |
Crown Ditch Diversion Clear Creek 2 Total monthly flow in AF | ||||||||||||
| Water Year | Oct | Nov | Dec | Jan | Feb | Mar | Apr | May | Jun | Jul | Aug | Sep | Total |
|---|---|---|---|---|---|---|---|---|---|---|---|---|---|
| 1970 | |||||||||||||
| 1971 | |||||||||||||
| 1972 | |||||||||||||
| 1973 | |||||||||||||
| 1974 | 314.08 | 844.30 | 618.84 | 0.00 | 0.00 | 1777.22 | |||||||
| 1975 | |||||||||||||
| 1976 | |||||||||||||
| 1977 | |||||||||||||
| 1978 | |||||||||||||
| 1979 | |||||||||||||
| 1980 | |||||||||||||
| 1981 | 547.99 | 484.11 | 306.76 | 308.11 | 152.33 | 1799.30 | |||||||
| 1982 | 0.00 | 845.24 | 729.11 | 606.37 | 266.66 | 2447.38 | |||||||
| 1983 | 82.16 | 333.46 | 458.42 | 0.00 | 0.00 | 874.04 | |||||||
| 1984 | 0.00 | 482.60 | 729.84 | 571.48 | 210.71 | 1994.63 | |||||||
| 1985 | 0.00 | 133.63 | 359.24 | 88.62 | 0.00 | 581.49 | |||||||
| 1986 | 531.06 | 1037.84 | 678.09 | 251.55 | 85.79 | 2584.33 | |||||||
| 1987 | 650.14 | 741.97 | 805.35 | 490.68 | 84.52 | 2772.66 | |||||||
| 1988 | 434.39 | 848.44 | 322.76 | 195.20 | 149.05 | 1949.84 | |||||||
| 1989 | 444.30 | 1025.02 | 872.34 | 518.33 | 43.40 | 2903.39 | |||||||
| 1990 | 450.01 | 819.64 | 652.60 | 552.02 | 174.55 | 2648.82 | |||||||
| 1991 | 79.21 | 696.66 | 672.98 | 490.92 | 92.81 | 2032.58 | |||||||
| 1992 | 584.70 | 559.16 | 477.47 | 401.52 | 374.40 | 2397.25 | |||||||
| 1992 | 221.11 | 661.30 | 315.58 | 542.67 | 451.36 | 2192.02 | |||||||
| 1994 | 415.78 | 708.99 | 654.84 | 381.08 | 0.00 | 2160.69 | |||||||
| 1995 | 54.15 | 755.99 | 762.86 | 344.69 | 244.25 | 2161.94 | |||||||
| 1996 | 98.74 | 798.02 | 682.98 | 335.92 | 133.17 | 2048.83 | |||||||
| 1997 | 187.56 | 679.56 | 658.01 | 58.46 | 0.00 | 1583.59 | |||||||
| 1998 | 395.99 | 1049.91 | 839.27 | 742.12 | 429.96 | 3457.25 | |||||||
| 1999 | 0.00 | 735.80 | 794.90 | 480.84 | 128.03 | 2139.57 | |||||||
| Mean | 274.57 | 712.08 | 619.61 | 368.03 | 151.05 | 2125.34 | |||||||
| Max | 650.14 | 1049.91 | 872.34 | 742.12 | 451.36 | 3457.25 | |||||||
| Min | 0.00 | 133.63 | 306.76 | 0.00 | 0.00 | 581.49 | |||||||
| Name Source District Data |
Crown Ditch Diversion Clear Creek 2 First & Last Dates, Max. Days | ||
| Water Year | First Date of Measurement | Last Date of Measurement | Maximum Days Missing |
|---|---|---|---|
| 1970 | |||
| 1971 | |||
| 1972 | |||
| 1973 | |||
| 1974 | 16-May | 28-Jul | 1 |
| 1975 | |||
| 1976 | |||
| 1977 | |||
| 1978 | |||
| 1979 | |||
| 1980 | |||
| 1981 | 01-May | 15-Sep | 19 |
| 1982 | 03-Jun | 15-Sep | 19 |
| 1983 | 25-May | 28-Jul | 13 |
| 1984 | 08-Jun | 12-Sep | 6 |
| 1985 | 25-Jun | 19-Aug | 8 |
| 1986 | 15-May | 08-Sep | 7 |
| 1987 | 14-May | 10-Sep | 6 |
| 1988 | 16-May | 15-Sep | 50 |
| 1989 | 15-May | 04-Sep | 6 |
| 1990 | 15-May | 13-Sep | 12 |
| 1991 | 28-May | 14-Sep | 8 |
| 1992 | 15-May | 27-Sep | 28 |
| 1993 | 21-May | 30-Sep | 16 |
| 1994 | 12-May | 24-Aug | 40 |
| 1995 | 26-May | 18-Sep | 17 |
| 1996 | 21-May | 16-Sep | 19 |
| 1997 | 19-May | 11-Aug | 19 |
| 1998 | 21-May | 28-Sep | 9 |
| 1999 | 03-Jun | 08-Sep | 11 |
| Avg. | 22-May | 06-Sep | 16 |
| Earliest | 01-May | 28-Jul | 1 |
| Latest | 25-Jun | 30-Sep | 50 |
KEY DIVERSIONS
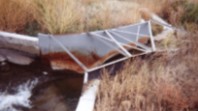
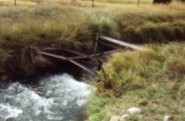
| Diversion: | DES MOINES DITCH DIVERSION | 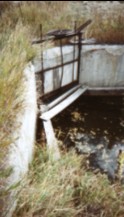 Des Moines headgate | ||||||||||||||||||||||||||||||
| Date: | 4 Oct. 2000 | |||||||||||||||||||||||||||||||
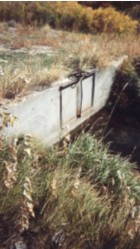
| Diversion Description: | Headgate consists of a single, 6.2 x 1.5-foot rectangular steel gate operated with Waterman-type screw (badly bent), mounted in concrete headwall, adjacent to a rock dam. | |||||||||||||||||||||||||||||||
| Diversion Location: | The Des Moines Ditch diversion is located on the main stem of Clear Creek between the confluences of Clear Creek with Piney and Rock creeks. | |||||||||||||||||||||||||||||||
|
 Des Moines flume | |||||||||||||||||||||||||||||||
| Conveyance Description: | Open channel canal, approximately 3.7 mi. long. | |||||||||||||||||||||||||||||||
| Direct Flow Water Rights: |
| |||||||||||||||||||||||||||||||
| Associated Storage Rights: | Irrigators on the Des Moines Ditch use water stored in Willow Park, Lake DeSmet, and Healy reservoirs. | |||||||||||||||||||||||||||||||
| Irrigation Practices: | See introduction to Clear Creek drainage | |||||||||||||||||||||||||||||||
| Agricultural Practices: | See introduction to Clear Creek drainage | |||||||||||||||||||||||||||||||
| Return Flows: | Estimated percentage of total diversion developing into return flows: | |||||||||||||||||||||||||||||||
| ||||||||||||||||||||||||||||||||
| Losses: | Approximately 10 percent by the end of the ditch | |||||||||||||||||||||||||||||||
| References: | Carmine Loguidice, Interview, State Engineer.s Office, 4 Oct. 2000 | |||||||||||||||||||||||||||||||
Irrigated Lands Water Rights Database
| PerNo | PerSfx | Facility Name | Priority | Acres | Amount | Unit | SupTyp | Status | Source |
|---|---|---|---|---|---|---|---|---|---|
| Terr | D | Des Moines, 1st Appropriation | Sep. 15, 1884 | 200 | 2.86 | CFS | OS | Adj | Clear Creek |
| 1174 | E | Enl. Des Moines L&C CO (Big Bonanza) | Jan. 19, 1904 | 205 | 2.92 | CFS | OS | Adj | Clear Creek |
| 6270 | E | Enl. Des Moines | Oct. 5, 1960 | 11.2 | 0.16 | CFS | OS | Adj | Clear Creek |
| Name Source District Data |
Des Moines Ditch Diversion Clear Creek 2 Total monthly flow in AF | ||||||||||||
| Water Year | Oct | Nov | Dec | Jan | Feb | Mar | Apr | May | Jun | Jul | Aug | Sep | Total |
|---|---|---|---|---|---|---|---|---|---|---|---|---|---|
| 1970 | |||||||||||||
| 1971 | |||||||||||||
| 1972 | |||||||||||||
| 1973 | |||||||||||||
| 1974 | 278.54 | 289.51 | 268.96 | 0.00 | 0.00 | 837.01 | |||||||
| 1975 | |||||||||||||
| 1976 | |||||||||||||
| 1977 | |||||||||||||
| 1978 | |||||||||||||
| 1979 | |||||||||||||
| 1980 | |||||||||||||
| 1981 | 350.78 | 314.03 | 471.87 | 224.42 | 192.79 | 1553.89 | |||||||
| 1982 | 0.00 | 623.43 | 679.81 | 761.75 | 571.24 | 2636.23 | |||||||
| 1983 | 40.34 | 707.38 | 618.84 | 0.00 | 0.00 | 1366.56 | |||||||
| 1984 | 0.00 | 531.79 | 700.94 | 476.71 | 221.55 | 1930.99 | |||||||
| 1985 | 0.00 | 84.73 | 481.85 | 218.58 | 95.61 | 880.77 | |||||||
| 1986 | 326.80 | 665.44 | 533.10 | 480.65 | 162.86 | 2168.85 | |||||||
| 1987 | 398.94 | 298.11 | 660.91 | 329.09 | 48.48 | 1735.53 | |||||||
| 1988 | 281.94 | 536.14 | 504.57 | 375.16 | 137.58 | 1835.39 | |||||||
| 1989 | 231.15 | 235.86 | 339.24 | 338.48 | 71.83 | 1216.56 | |||||||
| 1990 | 106.13 | 188.34 | 287.84 | 180.30 | 146.43 | 909.04 | |||||||
| 1991 | 123.65 | 174.35 | 281.10 | 174.31 | 169.86 | 923.27 | |||||||
| 1992 | 209.39 | 187.85 | 205.21 | 367.60 | 148.93 | 1118.98 | |||||||
| 1993 | 108.61 | 117.53 | 236.36 | 254.48 | 29.35 | 746.33 | |||||||
| 1994 | 95.76 | 271.27 | 258.25 | 185.45 | 0.00 | 810.73 | |||||||
| 1995 | 3.58 | 146.70 | 446.96 | 177.93 | 87.86 | 863.03 | |||||||
| 1996 | 93.22 | 267.39 | 358.96 | 144.72 | 43.14 | 907.43 | |||||||
| 1997 | 54.88 | 61.64 | 193.42 | 5.53 | 0.00 | 315.47 | |||||||
| 1998 | 777.23 | 768.85 | 1356.61 | 410.56 | 75.98 | 3389.23 | |||||||
| 1999 | 0.00 | 88.13 | 451.67 | 265.78 | 0.00 | 805.58 | |||||||
| Mean | 174.05 | 327.92 | 466.82 | 268.58 | 110.17 | 1347.54 | |||||||
| Max | 777.23 | 768.85 | 1356.61 | 761.75 | 571.24 | 3389.23 | |||||||
| Min | 0.00 | 61.64 | 193.42 | 0.00 | 0.00 | 315.47 | |||||||
| Name Source District Data |
Des Moines Ditch Diversion Clear Creek 2 First & Last Dates, Max. Days | ||
| Water Year | First Date of Measurement | Last Date of Measurement | Maximum Days Missing |
|---|---|---|---|
| 1970 | |||
| 1971 | |||
| 1972 | |||
| 1973 | |||
| 1974 | 14-May | 20-Jul | 0 |
| 1975 | |||
| 1976 | |||
| 1977 | |||
| 1978 | |||
| 1979 | |||
| 1980 | |||
| 1981 | 04-May | 24-Sep | 14 |
| 1982 | 03-Jun | 24-Sep | 12 |
| 1983 | 30-May | 26-Jul | 9 |
| 1984 | 02-Jun | 11-Sep | 9 |
| 1985 | 25-Jun | 18-Sep | 5 |
| 1986 | 20-May | 08-Sep | 5 |
| 1987 | 15-May | 10-Sep | 7 |
| 1988 | 16-May | 15-Sep | 4 |
| 1989 | 16-May | 14-Sep | 7 |
| 1990 | 23-May | 14-Sep | 12 |
| 1991 | 21-May | 14-Sep | 8 |
| 1992 | 15-May | 27-Sep | 27 |
| 1993 | 07-May | 14-Sep | 16 |
| 1994 | 20-May | 24-Aug | 40 |
| 1995 | 26-May | 18-Sep | 38 |
| 1996 | 17-May | 16-Sep | 19 |
| 1997 | 19-May | 13-Aug | 21 |
| 1998 | 15-May | 28-Sep | 9 |
| 1999 | 03-Jun | 30-Aug | 20 |
| Avg. | 21-May | 07-Sep | 14 |
| Earliest | 04-May | 20-Jul | 0 |
| Latest | 25-Jun | 28-Sep | 40 |
KEY DIVERSIONS
| Diversion: | FOUR LAKES & FRENCH CREEK DITCH DIVERSION | 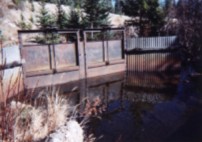 Four Lakes & French Creek headgates | ||||||||||||||||||||||||||||||||||||||||||||||||||||||||||||||||||||||||||||||||||||||||||||||||||||||||||||
| Date: | 18 Oct. 2000 | |||||||||||||||||||||||||||||||||||||||||||||||||||||||||||||||||||||||||||||||||||||||||||||||||||||||||||||
| Diversion Description: | Headgate consists of two, 5.5 x 13.5-foot rectangular steel gates in steel slider raised/lowered by Waterman-type screws mounted in a corrugated steel headwall. | |||||||||||||||||||||||||||||||||||||||||||||||||||||||||||||||||||||||||||||||||||||||||||||||||||||||||||||
| Diversion Location: | The Four Lakes & French Creek Ditch diversion is located on the North Fork of Clear Creek and diverts water to Johnson Creek (a tributary to Rock Creek) through French Creek and Penrose Ditch. | |||||||||||||||||||||||||||||||||||||||||||||||||||||||||||||||||||||||||||||||||||||||||||||||||||||||||||||
|
 Four Lakes & French Creek flume | |||||||||||||||||||||||||||||||||||||||||||||||||||||||||||||||||||||||||||||||||||||||||||||||||||||||||||||
| Conveyance Description: | Open channel canal, approximately 2 mi. long. | |||||||||||||||||||||||||||||||||||||||||||||||||||||||||||||||||||||||||||||||||||||||||||||||||||||||||||||
| Direct Flow Water Rights: | The direct-flow rights summary follows:
| |||||||||||||||||||||||||||||||||||||||||||||||||||||||||||||||||||||||||||||||||||||||||||||||||||||||||||||
| Note: Permit No. 2492E is adjudicated from Clear Creek to Moeller No. 3 and
Robbin.s ditches from French Creek.
Because Four Lakes diverts water from one tributary of Clear Creek to another (North Fork to French Creek), the waters destined for Johnson Creek are for supplemental supply, making those flows officially 0 cfs. But because Johnson Creek.s direct flow is notoriously poor, this supplemental supply is put to maximum use for most of the season. As a result, the flow destined for Penrose Ditch and Johnson Creek can reasonably be calculated using the Wyoming State Engineer.s Office baseline allocation: 1 cfs/70 acres * 144.04 acres = 2.06 cfs | ||||||||||||||||||||||||||||||||||||||||||||||||||||||||||||||||||||||||||||||||||||||||||||||||||||||||||||||
The supplemental supply summary follows:
| ||||||||||||||||||||||||||||||||||||||||||||||||||||||||||||||||||||||||||||||||||||||||||||||||||||||||||||||
| Associated Storage Rights: | None | |||||||||||||||||||||||||||||||||||||||||||||||||||||||||||||||||||||||||||||||||||||||||||||||||||||||||||||
| Irrigation Practices: | See introduction to Clear Creek drainage | |||||||||||||||||||||||||||||||||||||||||||||||||||||||||||||||||||||||||||||||||||||||||||||||||||||||||||||
| Agricultural Practices: | See introduction to Clear Creek drainage | |||||||||||||||||||||||||||||||||||||||||||||||||||||||||||||||||||||||||||||||||||||||||||||||||||||||||||||
| Return Flows: | Estimated percentage of total diversion developing into return flows: | |||||||||||||||||||||||||||||||||||||||||||||||||||||||||||||||||||||||||||||||||||||||||||||||||||||||||||||
| ||||||||||||||||||||||||||||||||||||||||||||||||||||||||||||||||||||||||||||||||||||||||||||||||||||||||||||||
| Losses: | Typical (10 percent) by the end of the ditch | |||||||||||||||||||||||||||||||||||||||||||||||||||||||||||||||||||||||||||||||||||||||||||||||||||||||||||||
| References: | Dave Pelloux, interview, State Engineer.s Office, 25 Oct. 2000 | |||||||||||||||||||||||||||||||||||||||||||||||||||||||||||||||||||||||||||||||||||||||||||||||||||||||||||||
Irrigated Lands Water Rights Database
| PerNo | PerSfx | Facility Name | Priority | Acres | Amount | Unit | SupTyp | Status | Source |
|---|---|---|---|---|---|---|---|---|---|
| Terr | D | Four Lakes & French Creek Ditch and Flume Co. | June 1, 1884 | 3222.4 | 45.05 | CFS | OS | Adj | North Fork Clear Creek |
| Terr | D | Four Lakes & French Creek | June 1, 1886 | 130 | 1.86 | CFS | OS | Adj | North Fork Clear Creek |
| 307 | E | Enl. Four Lakes & French Creek | Jan. 28, 1898 | 135 | 1.92 | CFS | OS | Adj | North Fork Clear Creek |
| 1369 | E | Enl. Four Lakes & French Creek Ditch and Flume Co. | April 7, 1905 | 53 | 0.75 | CFS | OS | Adj | North Fork Clear Creek |
| 1404 | E | Enl. Four Lakes & French Creek | July 17, 1905 | 52 | 0.75 | CFS | OS | Adj | North Fork Clear Creek |
| 4731 | E | Enl. Four Lakes & French Creek | Jan. 28, 1931 | 81.12 | 0 | SS | Adj | North Fork Clear Creek | |
| 5285 | E | Enl. Four Lakes & French Creek | April 24, 1935 | 113.3 | 0 | SS | Una | North Fork Clear Creek | |
| 5308 | E | Enl. Four Lakes & French Creek | Jan. 10, 1941 | 347.1 | 0 | SS | Una | North Fork Clear Creek |
| Name Source District Data |
Four Lakes & French Creek Ditch Diversion North Fork Clear Creek 2 Total monthly flow in AF | ||||||||||||
| Water Year | Oct | Nov | Dec | Jan | Feb | Mar | Apr | May | Jun | Jul | Aug | Sep | Total |
|---|---|---|---|---|---|---|---|---|---|---|---|---|---|
| 1970 | |||||||||||||
| 1971 | |||||||||||||
| 1972 | 0.00 | 244.76 | 1355.31 | 1200.40 | 604.32 | 3404.79 | |||||||
| 1973 | 0.00 | 1107.03 | 726.88 | 360.50 | 355.14 | 2549.55 | |||||||
| 1974 | 0.00 | 940.80 | 937.78 | 209.36 | 0.00 | 2087.94 | |||||||
| 1975 | 0.00 | 3209.33 | 3788.75 | 2112.02 | 1082.60 | 10192.70 | |||||||
| 1976 | 0.00 | 1092.57 | 3041.33 | 1027.60 | 1064.69 | 6226.19 | |||||||
| 1977 | 0.00 | 1111.83 | 1491.99 | 2046.88 | 1856.83 | 6507.53 | |||||||
| 1978 | 0.00 | 0.00 | 2091.81 | 2410.07 | 1154.52 | 5656.40 | |||||||
| 1979 | |||||||||||||
| 1980 | 0.00 | 3415.00 | 3025.00 | 1246.00 | 1094.00 | 8780.00 | |||||||
| 1981 | 0.00 | 0.00 | 3133.00 | 1780.00 | 1395.00 | 6308.00 | |||||||
| 1982 | 0.00 | 0.00 | 4380.00 | 3170.00 | 2010.00 | 9560.00 | |||||||
| 1983 | 0.00 | 0.00 | 3380.00 | 2320.00 | 1740.00 | 7440.00 | |||||||
| 1984 | 0.00 | 0.00 | 4320.00 | 2860.00 | 1440.00 | 8620.00 | |||||||
| 1985 | 1195.00 | 2229.00 | 2867.00 | 806.00 | 1121.00 | 8218.00 | |||||||
| 1986 | 0.00 | 3416.00 | 3867.00 | 2644.00 | 2482.00 | 12409.00 | |||||||
| 1987 | 0.00 | 3839.26 | 3591.00 | 2488.00 | 2083.00 | 12001.26 | |||||||
| 1988 | 0.00 | 2870.20 | 1261.70 | 2.70 | 0.00 | 4134.60 | |||||||
| 1989 | 2090.70 | 3969.40 | 3953.00 | 2060.50 | 160.30 | 12233.90 | |||||||
| 1990 | 683.06 | 3244.97 | 2850.49 | 1536.66 | 589.62 | 8904.80 | |||||||
| 1991 | 30.00 | 3393.90 | 2375.10 | 931.60 | 0.00 | 6730.60 | |||||||
| 1992 | 1740.10 | 3643.70 | 2876.20 | 1302.60 | 634.00 | 10196.60 | |||||||
| 1993 | 825.30 | 2698.70 | 2893.10 | 1858.30 | 535.10 | 8810.50 | |||||||
| 1994 | 1304.90 | 2639.20 | 1591.60 | 1443.70 | 741.40 | 7720.80 | |||||||
| 1995 | 5.40 | 2512.50 | 3843.30 | 1197.90 | 725.60 | 8284.70 | |||||||
| 1996 | 0.00 | 4091.00 | 2950.00 | 888.10 | 1045.20 | 8974.30 | |||||||
| 1997 | 0.00 | 0.00 | 3244.30 | 1657.90 | 1106.10 | 6008.30 | |||||||
| 1998 | 751.60 | 2987.60 | 3718.30 | 1739.90 | 1049.70 | 10247.10 | |||||||
| 1999 | 0.00 | 2404.80 | 2893.60 | 1296.10 | 1069.10 | 7663.60 | |||||||
| Mean | 319.48 | 2039.32 | 2831.39 | 1577.66 | 1005.16 | 7773.01 | |||||||
| Max | 2090.70 | 4091.00 | 4380.00 | 3170.00 | 2482.00 | 12409.00 | |||||||
| Min | 0.00 | 0.00 | 726.88 | 2.70 | 0.00 | 2087.94 | |||||||
| Name Source District Data |
Four Lakes & French Creek Ditch Diversion North Fork Clear Creek 2 First & Last Dates, Max. Days | ||
| Water Year | First Date of Measurement | Last Date of Measurement | Maximum Days Missing |
|---|---|---|---|
| 1970 | |||
| 1971 | |||
| 1972 | 26-Jun | 30-Sep | 0 |
| 1973 | 06-Jun | 28-Sep | 0 |
| 1974 | 01-Jun | 14-Aug | 0 |
| 1975 | 01-Jun | 30-Sep | 0 |
| 1976 | 17-Jun | 30-Sep | 0 |
| 1977 | 15-Jun | 30-Sep | 0 |
| 1978 | 13-Jul | 30-Sep | 0 |
| 1979 | |||
| 1980 | 01-Jun | 30-Sep | 0 |
| 1981 | 01-Jul | 30-Sep | 0 |
| 1982 | 01-Jul | 26-Sep | 0 |
| 1983 | 01-Jul | 30-Sep | 0 |
| 1984 | 01-Jul | 30-Sep | 0 |
| 1985 | 20-May | 30-Sep | 0 |
| 1986 | 11-Jun | 30-Sep | 0 |
| 1987 | 04-Jun | 30-Sep | 5 |
| 1988 | 07-Jun | 01-Aug | 0 |
| 1989 | 11-May | 05-Sep | 0 |
| 1990 | 22-May | 24-Sep | 0 |
| 1991 | 31-May | 26-Aug | 0 |
| 1992 | 07-May | 30-Sep | 0 |
| 1993 | 20-May | 30-Sep | 0 |
| 1994 | 18-May | 30-Sep | 0 |
| 1995 | 31-May | 30-Sep | 0 |
| 1996 | 01-Jun | 30-Sep | 0 |
| 1997 | 01-Jul | 30-Sep | 0 |
| 1998 | 24-May | 30-Sep | 0 |
| 1999 | 10-Jun | 21-Sep | 0 |
| Avg. | 07-Jun | 23-Sep | 0 |
| Earliest | 07-May | 01-Aug | 0 |
| Latest | 13-Jul | 30-Sep | 5 |
KEY DIVERSIONS
| Diversion: | FRANK G. HOPKINS DITCH DIVERSION AKA: Hopkins (on Clear Creek) |
 Frank G. Hopkins headgate | ||||||||||||||||||||||||||||||
| Date: | 4 Oct. 2000 | |||||||||||||||||||||||||||||||
| Diversion Description: | Headgate consists of a single, 5 x 1-foot rectangular steel gate operated with Waterman-type screw (bent), mounted in concrete headwall. | |||||||||||||||||||||||||||||||
| Diversion Location: | The Frank G. Hopkins diversion is located on the main stem of Clear Creek between the confluences of Clear Creek with Piney and Rock creeks. | |||||||||||||||||||||||||||||||
|
 Frank G. Hopkins flume | |||||||||||||||||||||||||||||||
| Conveyance Description: | Open channel canal, approximately 3.2 mi. long. | |||||||||||||||||||||||||||||||
| Direct Flow Water Rights: |
| |||||||||||||||||||||||||||||||
| Associated Storage Rights: | Irrigators on the Frank G. Hopkins Ditch use water stored in Willow Park, Lake DeSmet, and Healy reservoirs. | |||||||||||||||||||||||||||||||
| Irrigation Practices: | See introduction to Clear Creek drainage | |||||||||||||||||||||||||||||||
| Agricultural Practices: | See introduction to Clear Creek drainage | |||||||||||||||||||||||||||||||
| Return Flows: | Estimated percentage of total diversion developing into return flows: | |||||||||||||||||||||||||||||||
| ||||||||||||||||||||||||||||||||
| Losses: | Approximately 10 percent by the end of the ditch | |||||||||||||||||||||||||||||||
| References: | Carmine Loguidice, Interview, State Engineer.s Office, 4 Oct. 2000 | |||||||||||||||||||||||||||||||
Irrigated Lands Water Rights Database
| PerNo | PerSfx | Facility Name | Priority | Acres | Amount | Unit | SupTyp | Status | Source |
|---|---|---|---|---|---|---|---|---|---|
| 617 | D | Frank G. Hopkins | Nov. 27, 1893 | 167.7 | 2.39 | CFS | OS | Adj | Clear Creek |
| 5455 | D | Smith (Frank G. Hopkins) | May 7, 1903 | 70 | 1 | CFS | OS | Adj | Clear Creek |
| 3854 | E | Enl. Frank G. Hopkins | Feb. 1, 1918 | 146 | 2.08 | CFS | OS | Adj | Clear Creek |
| 4463 | E | Frank G. Hopkins | May 21, 1925 | 115.32 | 1.64 | CFS | OS | Adj | Clear Creek |
| Name Source District Data |
Frank G. Hopkins Ditch Diversion Clear Creek 2 Total monthly flow in AF | ||||||||||||
| Water Year | Oct | Nov | Dec | Jan | Feb | Mar | Apr | May | Jun | Jul | Aug | Sep | Total |
|---|---|---|---|---|---|---|---|---|---|---|---|---|---|
| 1970 | |||||||||||||
| 1971 | |||||||||||||
| 1972 | |||||||||||||
| 1973 | |||||||||||||
| 1974 | 569.43 | 846.74 | 745.55 | 0.00 | 0.00 | 2161.72 | |||||||
| 1975 | |||||||||||||
| 1976 | |||||||||||||
| 1977 | |||||||||||||
| 1978 | |||||||||||||
| 1979 | |||||||||||||
| 1980 | |||||||||||||
| 1981 | 1032.90 | 1400.67 | 1112.20 | 168.21 | 0.00 | 3713.98 | |||||||
| 1982 | 0.00 | 816.58 | 474.15 | 406.16 | 557.40 | 2254.29 | |||||||
| 1983 | 38.42 | 1153.60 | 373.05 | 0.00 | 0.00 | 1565.07 | |||||||
| 1984 | 0.00 | 1182.06 | 968.04 | 963.33 | 445.92 | 3559.35 | |||||||
| 1985 | 0.00 | 0.00 | 644.51 | 260.39 | 239.10 | 1144.00 | |||||||
| 1986 | 365.02 | 939.61 | 521.28 | 621.97 | 52.00 | 2499.88 | |||||||
| 1987 | 312.09 | 442.91 | 333.40 | 312.40 | 0.00 | 1400.80 | |||||||
| 1988 | 66.03 | 662.11 | 468.70 | 38.68 | 0.00 | 1235.52 | |||||||
| 1989 | 268.35 | 373.88 | 509.75 | 176.77 | 138.84 | 1467.59 | |||||||
| 1990 | 176.53 | 263.14 | 567.93 | 96.20 | 0.00 | 1103.80 | |||||||
| 1991 | 204.06 | 227.26 | 380.29 | 263.73 | 166.61 | 1241.95 | |||||||
| 1992 | 321.32 | 245.96 | 149.36 | 232.04 | 0.00 | 948.68 | |||||||
| 1993 | 192.79 | 213.40 | 431.46 | 154.11 | 117.92 | 1109.68 | |||||||
| 1994 | 331.76 | 712.05 | 553.14 | 404.27 | 0.00 | 2001.22 | |||||||
| 1995 | 41.61 | 351.89 | 842.20 | 279.01 | 0.00 | 1514.71 | |||||||
| 1996 | 31.43 | 766.70 | 596.43 | 202.32 | 103.15 | 1700.03 | |||||||
| 1997 | 2.53 | 443.08 | 678.04 | 0.00 | 0.00 | 1123.65 | |||||||
| 1998 | 507.29 | 345.85 | 650.97 | 1062.16 | 355.63 | 2921.90 | |||||||
| 1999 | 0.00 | 226.59 | 766.23 | 395.31 | 0.00 | 1388.13 | |||||||
| Mean | 223.08 | 580.70 | 588.33 | 301.85 | 108.83 | 1802.80 | |||||||
| Max | 1032.90 | 1400.67 | 1112.20 | 1062.16 | 557.40 | 3713.98 | |||||||
| Min | 0.00 | 0.00 | 149.36 | 0.00 | 0.00 | 948.68 | |||||||
| Name Source District Data |
Frank G. Hopkins Ditch Diversion Clear Creek 2 First & Last Dates, Max. Days | ||
| Water Year | First Date of Measurement | Last Date of Measurement | Maximum Days Missing |
|---|---|---|---|
| 1970 | |||
| 1971 | |||
| 1972 | |||
| 1973 | |||
| 1974 | 14-May | 20-Jul | 0 |
| 1975 | |||
| 1976 | |||
| 1977 | |||
| 1978 | |||
| 1979 | |||
| 1980 | |||
| 1981 | 03-May | 09-Aug | 14 |
| 1982 | 13-Jun | 24-Sep | 17 |
| 1983 | 30-May | 26-Jul | 9 |
| 1984 | 02-Jun | 11-Sep | 9 |
| 1985 | 07-Jul | 18-Sep | 17 |
| 1986 | 25-May | 05-Sep | 7 |
| 1987 | 19-May | 12-Aug | 17 |
| 1988 | 29-May | 08-Aug | 7 |
| 1989 | 16-May | 14-Sep | 8 |
| 1990 | 16-May | 15-Aug | 17 |
| 1991 | 15-May | 12-Sep | 13 |
| 1992 | 15-May | 25-Aug | 28 |
| 1993 | 26-May | 14-Sep | 27 |
| 1994 | 20-May | 24-Aug | 40 |
| 1995 | 26-May | 01-Sep | 22 |
| 1996 | 21-May | 16-Sep | 19 |
| 1997 | 29-May | 23-Jul | 40 |
| 1998 | 21-May | 15-Sep | 30 |
| 1999 | 03-Jun | 30-Aug | 30 |
| Avg. | 25-May | 26-Aug | 19 |
| Earliest | 03-May | 20-Jul | 0 |
| Latest | 07-Jul | 24-Sep | 40 |
KEY DIVERSIONS
| Diversion: | HILLYER & ONSLOW DITCH DIVERSION | ||||||||||||||||||
| Date: | 4 Oct. 2000 | ||||||||||||||||||
| Diversion Description: | Diversion consists of a large concrete dam and adjacent headgate incorporated into it. | ||||||||||||||||||
| Diversion Location: | The Hillyer & Onslow Ditch diversion is located on the main stem of Clear Creek between the confluences of Clear Creek with Rock and Piney creeks. | ||||||||||||||||||
 Hillyer & Onslow diversion | |||||||||||||||||||
| |||||||||||||||||||
| Conveyance Description: | Open channel canal, approximately 2.7 mi. long, approximately 600 feet of which is in pipe. | ||||||||||||||||||
| Direct Flow Water Rights: |
| ||||||||||||||||||
| Associated Storage Rights: | Irrigators on the Hillyer & Onslow Ditch use water from Willow Park, Lake DeSmet, and Healy reservoirs. | ||||||||||||||||||
| Irrigation Practices: | See introduction to Clear Creek drainage | ||||||||||||||||||
| Agricultural Practices: | See introduction to Clear Creek drainage | ||||||||||||||||||
| Return Flows: | Estimated percentage of total diversion developing into return flows: | ||||||||||||||||||
| |||||||||||||||||||
| Losses: | Approximately 15 percent by the end of the ditch | ||||||||||||||||||
| References: | Carmine Loguidice, Interview, State Engineer.s Office, 4 Oct. 2000 | ||||||||||||||||||
Irrigated Lands Water Rights Database
| PerNo | PerSfx | Facility Name | Priority | Acres | Amount | Unit | SupTyp | Status | Source |
|---|---|---|---|---|---|---|---|---|---|
| Terr | D | Hillyer & Onslow | July 1, 1881 | 129 | 1.84 | CFS | OS | Adj | Clear Creek |
| Name Source District Data |
Hillyer & Onslow Ditch Diversion Clear Creek 2 Total monthly flow in AF | ||||||||||||
| Water Year | Oct | Nov | Dec | Jan | Feb | Mar | Apr | May | Jun | Jul | Aug | Sep | Total |
|---|---|---|---|---|---|---|---|---|---|---|---|---|---|
| 1970 | |||||||||||||
| 1971 | |||||||||||||
| 1972 | |||||||||||||
| 1973 | |||||||||||||
| 1974 | 322.35 | 750.09 | 592.26 | 0.00 | 0.00 | 1664.70 | |||||||
| 1975 | |||||||||||||
| 1976 | |||||||||||||
| 1977 | |||||||||||||
| 1978 | |||||||||||||
| 1979 | |||||||||||||
| 1980 | |||||||||||||
| 1981 | |||||||||||||
| 1982 | |||||||||||||
| 1983 | |||||||||||||
| 1984 | |||||||||||||
| 1985 | 0.00 | 68.43 | 236.63 | 0.00 | 0.00 | 305.06 | |||||||
| 1986 | 0.00 | 411.28 | 114.80 | 23.68 | 0.00 | 549.76 | |||||||
| 1987 | 115.20 | 297.50 | 322.54 | 0.00 | 0.00 | 735.24 | |||||||
| 1988 | 45.68 | 244.49 | 128.44 | 0.00 | 0.00 | 418.61 | |||||||
| 1989 | 347.87 | 603.09 | 616.02 | 153.24 | 0.00 | 1720.22 | |||||||
| 1990 | 55.88 | 216.20 | 280.04 | 50.34 | 26.92 | 629.38 | |||||||
| 1991 | 77.30 | 156.86 | 308.74 | 144.74 | 0.00 | 687.64 | |||||||
| 1992 | 129.32 | 10.23 | |||||||||||
| 1993 | 81.64 | 74.81 | 121.72 | 96.89 | 0.00 | 375.06 | |||||||
| 1994 | 40.31 | 230.02 | 191.10 | 27.64 | 0.00 | 489.07 | |||||||
| 1995 | 5.91 | 242.11 | 367.91 | 2.25 | 0.00 | 618.18 | |||||||
| 1996 | 9.34 | 99.18 | 99.93 | 121.55 | 115.97 | 445.97 | |||||||
| 1997 | |||||||||||||
| 1998 | 48.66 | 116.96 | 309.30 | 266.78 | 45.85 | 787.55 | |||||||
| 1999 | 0.00 | 276.52 | 675.60 | 206.59 | 37.02 | 1195.73 | |||||||
| Mean | 85.30 | 270.54 | 311.79 | 78.12 | 15.73 | 758.73 | |||||||
| Max | 347.87 | 750.09 | 675.60 | 266.78 | 115.97 | 1720.22 | |||||||
| Min | 0.00 | 68.43 | 99.93 | 0.00 | 0.00 | 305.06 | |||||||
| Name Source District Data |
Hillyer & Onslow Ditch Diversion Clear Creek 2 First & Last Dates, Max. Days | ||
| Water Year | First Date of Measurement | Last Date of Measurement | Maximum Days Missing |
|---|---|---|---|
| 1970 | |||
| 1971 | |||
| 1972 | |||
| 1973 | |||
| 1974 | 14-May | 20-Jul | 0 |
| 1975 | |||
| 1976 | |||
| 1977 | |||
| 1978 | |||
| 1979 | |||
| 1980 | |||
| 1981 | |||
| 1982 | |||
| 1983 | |||
| 1984 | |||
| 1985 | 25-Jun | 22-Jul | 7 |
| 1986 | 05-Jun | 04-Aug | 11 |
| 1987 | 29-May | 27-Jul | 34 |
| 1988 | 29-May | 21-Jul | 14 |
| 1989 | 16-May | 10-Aug | 6 |
| 1990 | 23-May | 14-Sep | 35 |
| 1991 | 24-May | 19-Aug | 35 |
| 1992 | 15-May | 04-Sep | 58 |
| 1993 | 26-May | 18-Aug | 42 |
| 1994 | 26-May | 19-Aug | 40 |
| 1995 | 26-May | 03-Aug | 46 |
| 1996 | 21-May | 16-Sep | 19 |
| 1997 | |||
| 1998 | 26-May | 15-Sep | 34 |
| 1999 | 03-Jun | 08-Sep | 35 |
| Avg. | 26-May | 16-Aug | 28 |
| Earliest | 14-May | 20-Jul | 0 |
| Latest | 25-Jun | 16-Sep | 58 |
KEY DIVERSIONS
| Diversion: | JOHNSON-HOLT DITCH DIVERSION AKA: Johnson (on Clear Creek) |
 Johnson-Holt headgate | ||||||||||||||||||||||||||||||||||||||||||||||||||||||
| Date: | 4 Oct. 2000 | |||||||||||||||||||||||||||||||||||||||||||||||||||||||
| Diversion Description: | Headgate consists of a single, 4.2 x 2.6-foot rectangular steel gate operated with Waterman-type screw, mounted in concrete headwall, adjacent to a rock dam. | |||||||||||||||||||||||||||||||||||||||||||||||||||||||
| Diversion Location: | The Johnson-Holt diversion is located on the main stem of Clear Creek between the confluences of Clear Creek and North Fork and Sand creeks. | |||||||||||||||||||||||||||||||||||||||||||||||||||||||
|
 Johnson-Holt flume | |||||||||||||||||||||||||||||||||||||||||||||||||||||||
| Conveyance Description: | Open channel canal, approximately 6.0 mi. long. | |||||||||||||||||||||||||||||||||||||||||||||||||||||||
| Direct Flow Water Rights: |
| |||||||||||||||||||||||||||||||||||||||||||||||||||||||
| Associated Storage Rights: | None | |||||||||||||||||||||||||||||||||||||||||||||||||||||||
| Irrigation Practices: | See introduction to Clear Creek drainage | |||||||||||||||||||||||||||||||||||||||||||||||||||||||
| Agricultural Practices: | See introduction to Clear Creek drainage | |||||||||||||||||||||||||||||||||||||||||||||||||||||||
| Return Flows: | Estimated percentage of total diversion developing into return flows: | |||||||||||||||||||||||||||||||||||||||||||||||||||||||
| ||||||||||||||||||||||||||||||||||||||||||||||||||||||||
| Losses: | Approximately 20 percent by the end of the ditch | |||||||||||||||||||||||||||||||||||||||||||||||||||||||
| References: | Dave Pelloux, Interview, State Engineer.s Office, 25 Oct. 2000 | |||||||||||||||||||||||||||||||||||||||||||||||||||||||
Irrigated Lands Water Rights Database
| PerNo | PerSfx | Facility Name | Priority | Acres | Amount | Unit | SupTyp | Status | Source |
|---|---|---|---|---|---|---|---|---|---|
| 1334 | E | Enl. Johnson or Johnson-Holt | Jan. 14, 1905 | 590.16 | 8.42 | CFS | OS | Adj | Clear Creek |
| 2391 | E | Enl. Johnson-Holt | Jan. 25, 1911 | 203.96 | 2.91 | CFS | OS | Adj | Clear Creek |
| 2627 | E | Enl. Johnson or Johnson-Holt | June 17, 1912 | 174 | 2.48 | CFS | OS | Adj | Clear Creek |
| 4383 | E | Enl. Johnson/Johnson-Holt | June 28, 1923 | 143.77 | 2.06 | CFS | OS | Adj | Clear Creek |
| Name Source District Data |
Johnson-Holt Ditch Diversion Clear Creek 2 Total monthly flow in AF | ||||||||||||
| Water Year | Oct | Nov | Dec | Jan | Feb | Mar | Apr | May | Jun | Jul | Aug | Sep | Total |
|---|---|---|---|---|---|---|---|---|---|---|---|---|---|
| 1970 | |||||||||||||
| 1971 | |||||||||||||
| 1972 | |||||||||||||
| 1973 | |||||||||||||
| 1974 | 461.08 | 620.65 | 348.20 | 0.00 | 0.00 | 1429.93 | |||||||
| 1975 | |||||||||||||
| 1976 | |||||||||||||
| 1977 | |||||||||||||
| 1978 | |||||||||||||
| 1979 | |||||||||||||
| 1980 | |||||||||||||
| 1981 | 483.48 | 405.47 | 482.08 | 27.15 | 0.00 | 1398.18 | |||||||
| 1982 | 0.00 | 437.70 | 900.57 | 713.87 | 238.02 | 2290.16 | |||||||
| 1983 | 187.02 | 833.52 | 696.84 | 0.00 | 0.00 | 1717.38 | |||||||
| 1984 | 0.00 | 539.85 | 726.71 | 570.81 | 197.97 | 2035.34 | |||||||
| 1985 | 0.00 | 100.73 | 101.32 | 0.00 | 0.00 | 202.05 | |||||||
| 1986 | 444.74 | 923.58 | 616.58 | 123.11 | 0.00 | 2108.01 | |||||||
| 1987 | 526.30 | 373.24 | 665.46 | 408.54 | 49.60 | 2023.14 | |||||||
| 1988 | 526.08 | 727.54 | 80.77 | 0.00 | 0.00 | 1334.39 | |||||||
| 1989 | 495.30 | 900.99 | 589.98 | 539.32 | 0.00 | 2525.59 | |||||||
| 1990 | 326.21 | 855.08 | 611.04 | 487.71 | 0.00 | 2280.04 | |||||||
| 1991 | 164.18 | 705.75 | 392.65 | 146.45 | 101.75 | 1510.78 | |||||||
| 1992 | 377.53 | 601.21 | 188.03 | 174.35 | 84.40 | 1425.52 | |||||||
| 1993 | 116.65 | 331.29 | 162.88 | 500.62 | 92.21 | 1203.65 | |||||||
| 1994 | 352.94 | 355.14 | 221.48 | 280.96 | 0.00 | 1210.52 | |||||||
| 1995 | 48.03 | 554.89 | 620.39 | 227.82 | 65.89 | 1517.02 | |||||||
| 1996 | 70.16 | 402.78 | 300.35 | 194.03 | 160.83 | 1128.15 | |||||||
| 1997 | 266.25 | 486.51 | 464.32 | 24.03 | 0.00 | 1241.11 | |||||||
| 1998 | 364.70 | 523.56 | 479.83 | 221.10 | 176.28 | 1765.47 | |||||||
| 1999 | 0.00 | 249.90 | 170.00 | 21.02 | 0.00 | 440.92 | |||||||
| Mean | 260.53 | 546.47 | 440.97 | 233.04 | 58.35 | 1539.37 | |||||||
| Max | 526.30 | 923.58 | 900.57 | 713.87 | 238.02 | 2525.59 | |||||||
| Min | 0.00 | 100.73 | 80.77 | 0.00 | 0.00 | 202.05 | |||||||
| Name Source District Data |
Johnson-Holt Ditch Diversion Clear Creek 2 First & Last Dates, Max. Days | ||
| Water Year | First Date of Measurement | Last Date of Measurement | Maximum Days Missing |
|---|---|---|---|
| 1970 | |||
| 1971 | |||
| 1972 | |||
| 1973 | |||
| 1974 | 16-May | 28-Jul | 1 |
| 1975 | |||
| 1976 | |||
| 1977 | |||
| 1978 | |||
| 1979 | |||
| 1980 | |||
| 1981 | 01-May | 02-Aug | 27 |
| 1982 | 03-Jun | 15-Sep | 19 |
| 1983 | 25-May | 28-Jul | 13 |
| 1984 | 08-Jun | 12-Sep | 6 |
| 1985 | 25-Jun | 07-Jul | 9 |
| 1986 | 15-May | 14-Aug | 5 |
| 1987 | 14-May | 10-Sep | 5 |
| 1988 | 16-May | 05-Jul | 8 |
| 1989 | 15-May | 29-Aug | 6 |
| 1990 | 15-May | 22-Aug | 12 |
| 1991 | 20-May | 14-Sep | 8 |
| 1992 | 15-May | 27-Sep | 28 |
| 1993 | 21-May | 14-Sep | 16 |
| 1994 | 12-May | 24-Aug | 40 |
| 1995 | 26-May | 18-Sep | 28 |
| 1996 | 21-May | 16-Sep | 35 |
| 1997 | 19-May | 11-Aug | 19 |
| 1998 | 15-May | 28-Sep | 14 |
| 1999 | 03-Jun | 24-Aug | 11 |
| Avg. | 21-May | 25-Aug | 16 |
| Earliest | 01-May | 05-Jul | 1 |
| Latest | 25-Jun | 28-Sep | 40 |
KEY DIVERSIONS
| Diversion: | KENDRICK DITCH DIVERSION | ||||||||||||||||||||||||||||||||||||||||||||||||||||||||||||
| Date: | 4 Oct. 2000 | ||||||||||||||||||||||||||||||||||||||||||||||||||||||||||||
| Diversion Description: | Landowner would not permit access. | ||||||||||||||||||||||||||||||||||||||||||||||||||||||||||||
| Diversion Location: | The Kendrick Ditch diversion is located on the main stem of Clear Creek just upstream of the creek.s confluence with the Powder River. Clear Creek itself is a tributary to the Powder River. | ||||||||||||||||||||||||||||||||||||||||||||||||||||||||||||
| |||||||||||||||||||||||||||||||||||||||||||||||||||||||||||||
| Conveyance Description: | Open channel canal, approximately 5 mi. long. | ||||||||||||||||||||||||||||||||||||||||||||||||||||||||||||
| Direct Flow Water Rights: |
| ||||||||||||||||||||||||||||||||||||||||||||||||||||||||||||
| Associated Storage Rights: | None | ||||||||||||||||||||||||||||||||||||||||||||||||||||||||||||
| Irrigation Practices: | See introduction to Clear Creek drainage
Some Sprinkling in K Ranch; majority is flood. | ||||||||||||||||||||||||||||||||||||||||||||||||||||||||||||
| Agricultural Practices: | See introduction to Clear Creek drainage | ||||||||||||||||||||||||||||||||||||||||||||||||||||||||||||
| Return Flows: | Estimated percentage of total diversion developing into return flows: | ||||||||||||||||||||||||||||||||||||||||||||||||||||||||||||
| |||||||||||||||||||||||||||||||||||||||||||||||||||||||||||||
| Losses: | Approximately 10 percent | ||||||||||||||||||||||||||||||||||||||||||||||||||||||||||||
| References: | Carmine Loguidice, Interview, State Engineer.s Office, 4 Oct. 2000 | ||||||||||||||||||||||||||||||||||||||||||||||||||||||||||||
Irrigated Lands Water Rights Database
| PerNo | PerSfx | Facility Name | Priority | Acres | Amount | Unit | SupTyp | Status | Source |
|---|---|---|---|---|---|---|---|---|---|
| 10735 | D | Kendrick | Oct. 18, 1911 | 1120 | 16 | CFS | OS | Adj | Clear Creek |
| 2763 | E | Enl. Kendrick | May 17, 1912 | 1120 | 16 | CFS | OS | Adj | Clear Creek |
| 5532 | E | Enl. Kendrick Canal | Dec. 27, 1949 | 204.3 | 2.91 | CFS | OS | Adj | Clear Creek |
| 5604 | E | Enl. Kendrick Canal | Feb. 25, 1952 | 103.6 | 1.48 | CFS | OS | Adj | Clear Creek |
| 6773 | E | Enl. Kendrick Canal | June 1, 1977 | 73 | 1.04 | CFS | OS | Adj | Clear Creek |
| Name Source District Data |
Kendrick Ditch Diversion Clear Creek 9 Total monthly flow in AF | ||||||||||||
| Water Year | Oct | Nov | Dec | Jan | Feb | Mar | Apr | May | Jun | Jul | Aug | Sep | Total |
|---|---|---|---|---|---|---|---|---|---|---|---|---|---|
| 1970 | |||||||||||||
| 1971 | |||||||||||||
| 1972 | |||||||||||||
| 1973 | |||||||||||||
| 1974 | 0.00 | 156.59 | 1134.64 | 1282.39 | 0.00 | 2573.62 | |||||||
| 1975 | 0.00 | 857.63 | 1493.89 | 1359.75 | 0.00 | 3711.27 | |||||||
| 1976 | 0.00 | 0.00 | 420.50 | 1230.43 | 827.29 | 2478.22 | |||||||
| 1977 | 239.01 | 811.24 | 795.57 | 1607.40 | 1343.01 | 4796.23 | |||||||
| 1978 | 238.71 | 441.18 | 777.34 | 858.05 | 777.68 | 3092.96 | |||||||
| 1979 | |||||||||||||
| 1980 | 1200.00 | 1225.00 | 1248.00 | 1444.00 | 978.00 | 6095.00 | |||||||
| 1981 | 1260.00 | 646.00 | 466.00 | 533.00 | 405.00 | 3310.00 | |||||||
| 1982 | |||||||||||||
| 1983 | |||||||||||||
| 1984 | |||||||||||||
| 1985 | |||||||||||||
| 1986 | |||||||||||||
| 1987 | |||||||||||||
| 1988 | |||||||||||||
| 1989 | |||||||||||||
| 1990 | |||||||||||||
| 1991 | |||||||||||||
| 1992 | |||||||||||||
| 1993 | |||||||||||||
| 1994 | |||||||||||||
| 1995 | |||||||||||||
| 1996 | |||||||||||||
| 1997 | |||||||||||||
| 1998 | |||||||||||||
| 1999 | |||||||||||||
| Mean | 419.67 | 591.09 | 905.13 | 1187.86 | 618.71 | 3722.47 | |||||||
| Max | 1260.00 | 1225.00 | 1493.89 | 1607.40 | 1343.01 | 6095.00 | |||||||
| Min | 0.00 | 0.00 | 420.50 | 533.00 | 0.00 | 2478.22 | |||||||
| Name Source District Data |
Kendrick Ditch Diversion Clear Creek 9 First & Last Dates, Max. Days | ||
| Water Year | First Date of Measurement | Last Date of Measurement | Maximum Days Missing |
|---|---|---|---|
| 1970 | |||
| 1971 | |||
| 1972 | |||
| 1973 | |||
| 1974 | 26-Jun | 29-Aug | 0 |
| 1975 | 01-Jun | 31-Aug | 0 |
| 1976 | 19-Jul | 30-Sep | 0 |
| 1977 | 26-May | 30-Sep | 14 |
| 1978 | 01-May | 30-Sep | 0 |
| 1979 | |||
| 1980 | 06-May | 30-Sep | 0 |
| 1981 | 01-May | 30-Sep | 0 |
| 1982 | |||
| 1983 | |||
| 1984 | |||
| 1985 | |||
| 1986 | |||
| 1987 | |||
| 1988 | |||
| 1989 | |||
| 1990 | |||
| 1991 | |||
| 1992 | |||
| 1993 | |||
| 1994 | |||
| 1995 | |||
| 1996 | |||
| 1997 | |||
| 1998 | |||
| 1999 | |||
| Avg. | 29-May | 21-Sep | 2 |
| Earliest | 01-May | 29-Aug | 0 |
| Latest | 19-Jul | 30-Sep | 14 |
KEY DIVERSIONS
| Diversion: | PRATT & FERRIS NO. 2 DITCH DIVERSION AKA: P&F No. 2 |
 Pratt & Ferris No. 2 diversion structure | ||||||||||||||||||||||||||||||||||||||||||||||||||||||||||||
| Date: | 4 Oct. 2000 | |||||||||||||||||||||||||||||||||||||||||||||||||||||||||||||
| Note: | The Pratt & Ferris No. 2 diversion diverts more than 50 cfs. | |||||||||||||||||||||||||||||||||||||||||||||||||||||||||||||
| Diversion Description: | Headgate consists of a single, 3 x 4.3-foot rectangular steel gate operated with Waterman-type screw, mounted in concrete headwall. | |||||||||||||||||||||||||||||||||||||||||||||||||||||||||||||
| Diversion Location: | The Pratt & Ferris No. 2 diversion is located on the main stem of Clear Creek just upstream of the town of Clearmont. | |||||||||||||||||||||||||||||||||||||||||||||||||||||||||||||
|
 Pratt & Ferris No. 2 flume | |||||||||||||||||||||||||||||||||||||||||||||||||||||||||||||
| Conveyance Description: | Open channel canal, approximately 4.4 mi. long, terminates into Pratt & Ferris No. 3, where tailwaters are distributed. | |||||||||||||||||||||||||||||||||||||||||||||||||||||||||||||
| Direct Flow Water Rights: |
| |||||||||||||||||||||||||||||||||||||||||||||||||||||||||||||
| Associated Storage Rights: | Irrigators on the Pratt & Ferris No. 2 Ditch use water from Lake DeSmet reservoir. | |||||||||||||||||||||||||||||||||||||||||||||||||||||||||||||
| Irrigation Practices: | See introduction to Clear Creek drainage | |||||||||||||||||||||||||||||||||||||||||||||||||||||||||||||
| Agricultural Practices: | See introduction to Clear Creek drainage | |||||||||||||||||||||||||||||||||||||||||||||||||||||||||||||
| Return Flows: | Estimated percentage of total diversion developing into return flows: | |||||||||||||||||||||||||||||||||||||||||||||||||||||||||||||
| ||||||||||||||||||||||||||||||||||||||||||||||||||||||||||||||
| Losses: | Approximately 10 percent by the end of the ditch | |||||||||||||||||||||||||||||||||||||||||||||||||||||||||||||
| References: | Carmine LoGuidice, water commissioner, State Engineer.s Office, interview, 4 Oct. 2000 | |||||||||||||||||||||||||||||||||||||||||||||||||||||||||||||
Irrigated Lands Water Rights Database
| PerNo | PerSfx | Facility Name | Priority | Acres | Amount | Unit | SupTyp | Status | Source |
|---|---|---|---|---|---|---|---|---|---|
| Terr. | D | Pratt & Ferris No. 2 (Roebling Pump and Pipe Line) | Sep. 21, 1884 | 750 | 10.71 | CFS | OS | Adj | Clear Creek |
| 966 | E | Enl. Pratt & Ferris No. 2 | Jan. 9, 1903 | 115 | 1.64 | CFS | OS | Adj | Clear Creek |
| 1040 | E | Enl. Pratt & Ferris No. 2 | May 9, 1903 | 119.43 | 1.71 | CFS | OS | Adj | Clear Creek |
| 1853 | E | Enl. Pratt & Ferris No. 2 | Jan. 10, 1908 | 20 | 0.28 | CFS | OS | Adj | Clear Creek |
| 1853 | E | Enl. Pratt & Ferris No. 2 | Jan. 10, 1908 | 145 | 2.07 | CFS | OS | Adj | Clear Creek |
| 2672 | E | Enl. Pratt & Ferris No. 2 | Nov. 6, 1912 | 572 | 8.17 | CFS | OS | Adj | Clear Creek |
| 5580 | E | Enl. Pratt & Ferris No. 2 | July 20, 1951 | 15.4 | 0.21 | CFS | OS | Adj | Clear Creek |
| 6532 | E | Enl. Pratt & Ferris No. 2 | July 2, 1973 | 176.9 | 2.53 | CFS | OS | Adj | Clear Creek |
| 6533 | E | Enl. Pratt & Ferris No. 2 | May 24, 1974 | 87.8 | 1.25 | CFS | OS | Adj | Clear Creek |
| Name Source District Data |
Pratt & Ferris No. 2 Ditch Diversion Clear Creek 9 Total monthly flow in AF | ||||||||||||
| Water Year | Oct | Nov | Dec | Jan | Feb | Mar | Apr | May | Jun | Jul | Aug | Sep | Total |
|---|---|---|---|---|---|---|---|---|---|---|---|---|---|
| 1970 | |||||||||||||
| 1971 | |||||||||||||
| 1972 | |||||||||||||
| 1973 | |||||||||||||
| 1974 | 0.00 | 728.85 | 1905.90 | 1672.16 | 0.00 | 4306.91 | |||||||
| 1975 | |||||||||||||
| 1976 | |||||||||||||
| 1977 | |||||||||||||
| 1978 | |||||||||||||
| 1979 | |||||||||||||
| 1980 | |||||||||||||
| 1981 | 1919.55 | 1151.46 | 2426.18 | 1618.71 | 999.47 | 8115.37 | |||||||
| 1982 | 805.03 | 1235.93 | 1881.08 | 1872.13 | 776.66 | 6570.83 | |||||||
| 1983 | 0.00 | 1531.44 | 2561.92 | 1805.57 | 963.34 | 6862.27 | |||||||
| 1984 | 0.00 | 1061.73 | 2133.82 | 1690.66 | 248.74 | 5134.95 | |||||||
| 1985 | 1671.67 | 1281.62 | 1668.00 | 1781.55 | 927.57 | 7330.41 | |||||||
| 1986 | 777.77 | 2168.78 | 5238.34 | 1999.34 | 195.97 | 10380.20 | |||||||
| 1987 | 1485.58 | 1592.34 | 1694.73 | 1315.48 | 0.00 | 6088.13 | |||||||
| 1988 | 0.00 | 740.96 | 2051.41 | 2075.37 | 447.07 | 5314.81 | |||||||
| 1989 | 1017.72 | 2224.56 | 2401.29 | 1827.77 | 889.98 | 8361.32 | |||||||
| 1990 | 927.57 | 1757.19 | 2224.43 | 2474.48 | 798.84 | 8182.51 | |||||||
| 1991 | 871.74 | 889.19 | 2038.31 | 2039.80 | 1009.78 | 6848.82 | |||||||
| 1992 | 1131.47 | 1541.95 | 2219.40 | 2052.79 | 959.11 | 7904.72 | |||||||
| 1993 | 1875.34 | 1167.80 | 1146.18 | 2006.35 | 1451.90 | 7647.57 | |||||||
| 1994 | 827.98 | 2178.73 | 2319.99 | 1845.52 | 1553.16 | 8725.38 | |||||||
| 1995 | 19.54 | 831.36 | 2299.30 | 1709.10 | 1838.56 | 6697.86 | |||||||
| 1996 | 267.08 | 368.75 | 2366.75 | 1966.20 | 671.44 | 5640.22 | |||||||
| 1997 | 0.00 | 1161.29 | 1931.69 | 528.08 | 403.49 | 4024.55 | |||||||
| 1998 | 627.92 | 1174.42 | 1499.41 | 1533.51 | 689.09 | 5524.35 | |||||||
| 1999 | 0.00 | 384.59 | 1699.95 | 1584.18 | 925.39 | 4594.11 | |||||||
| Mean | 711.30 | 1258.65 | 2185.40 | 1769.94 | 787.48 | 6712.76 | |||||||
| Max | 1919.55 | 2224.56 | 5238.34 | 2474.48 | 1838.56 | 10380.20 | |||||||
| Min | 0.00 | 368.75 | 1146.18 | 528.08 | 0.00 | 4024.55 | |||||||
| Name Source District Data |
Pratt & Ferris No. 2 Ditch Diversion Clear Creek 9 First & Last Dates, Max. Days | ||
| Water Year | First Date of Measurement | Last Date of Measurement | Maximum Days Missing |
|---|---|---|---|
| 1970 | |||
| 1971 | |||
| 1972 | |||
| 1973 | |||
| 1974 | 17-Jun | 31-Aug | 0 |
| 1975 | |||
| 1976 | |||
| 1977 | |||
| 1978 | |||
| 1979 | |||
| 1980 | |||
| 1981 | 01-May | 28-Sep | 13 |
| 1982 | 17-May | 20-Sep | 16 |
| 1983 | 03-Jun | 30-Sep | 8 |
| 1984 | 01-Jun | 04-Sep | 11 |
| 1985 | 09-May | 16-Sep | 10 |
| 1986 | 19-May | 12-Sep | 8 |
| 1987 | 12-May | 21-Aug | 21 |
| 1988 | 21-Jun | 08-Sep | 13 |
| 1989 | 15-May | 15-Sep | 5 |
| 1990 | 18-May | 14-Sep | 11 |
| 1991 | 15-May | 13-Sep | 17 |
| 1992 | 15-May | 18-Sep | 11 |
| 1993 | 05-May | 29-Sep | 9 |
| 1994 | 23-May | 30-Sep | 7 |
| 1995 | 31-May | 27-Sep | 5 |
| 1996 | 07-May | 20-Sep | 20 |
| 1997 | 03-Jun | 11-Sep | 15 |
| 1998 | 22-May | 16-Sep | 22 |
| 1999 | 10-Jun | 20-Sep | 18 |
| Avg. | 22-May | 16-Sep | 12 |
| Earliest | 01-May | 21-Aug | 0 |
| Latest | 21-Jun | 30-Sep | 22 |
KEY DIVERSIONS
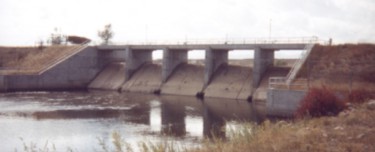
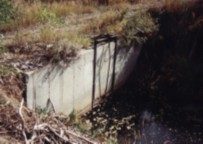
| Diversion: | PRATT & FERRIS NO. 3 DITCH DIVERSION AKA: P&F No. 3 |
 Pratt & Ferris No. 3 headgate | ||||||||||||||||||||||||||||||||||||
| Date: | 4 Oct. 2000 | |||||||||||||||||||||||||||||||||||||
| Diversion Description: | Headgate consists of two, 2 x 3.9-foot rectangular steel gates operated with Waterman-type screws, mounted in concrete throats adjacent to a concrete dam. | |||||||||||||||||||||||||||||||||||||
| Diversion Location: | The Pratt & Ferris No. 3 Ditch diversion is located on the main stem of Clear Creek just downstream of the town of Clearmont. | |||||||||||||||||||||||||||||||||||||
|
 Pratt & Ferris No. 3 flume | |||||||||||||||||||||||||||||||||||||
| Conveyance Description: | Open channel canal, approximately 9 mi. long. | |||||||||||||||||||||||||||||||||||||
| Direct Flow Water Rights: |
| |||||||||||||||||||||||||||||||||||||
| Associated Storage Rights: | Irrigators on the Pratt & Ferris No. 3 Ditch use water from Lake DeSmet reservoir. | |||||||||||||||||||||||||||||||||||||
| Irrigation Practices: | See introduction to Clear Creek drainage | |||||||||||||||||||||||||||||||||||||
| Agricultural Practices: | See introduction to Clear Creek drainage | |||||||||||||||||||||||||||||||||||||
| Return Flows: | Estimated percentage of total diversion developing into return flows: | |||||||||||||||||||||||||||||||||||||
| ||||||||||||||||||||||||||||||||||||||
| Losses: | Approximately 10 percent by the end of the ditch | |||||||||||||||||||||||||||||||||||||
| References: | Carmine LoGuidice, Interview, State Engineer.s Office, 4 Oct. 2000 | |||||||||||||||||||||||||||||||||||||
Irrigated Lands Water Rights Database
| PerNo | PerSfx | Facility Name | Priority | Acres | Amount | Unit | SupTyp | Status | Source |
|---|---|---|---|---|---|---|---|---|---|
| Terr | D | Pratt & Ferris No. 3 | Aug. 1, 1884 | 1500 | 21.43 | CFS | OS | Clear Creek | |
| 1041 | E | Enl. Pratt & Ferris No. 3 | May 9, 1903 | 1305 | 19.28 | CFS | OS | Adj | Clear Creek |
| 3872 | E | Enl. Pratt & Ferris No. 3 | Feb. 13, 1918 | 526.6 | 7.53 | CFS | OS | Una | Clear Creek |
| 5593 | E | Enl. Pratt & Ferris No. 3 | Nov. 13, 1951 | 15 | 0.21 | CFS | OS | Adj | Clear Creek |
| Name Source District Data |
Pratt & Ferris No. 3 Ditch Diversion Clear Creek 9 Total monthly flow in AF | ||||||||||||
| Water Year | Oct | Nov | Dec | Jan | Feb | Mar | Apr | May | Jun | Jul | Aug | Sep | Total |
|---|---|---|---|---|---|---|---|---|---|---|---|---|---|
| 1970 | |||||||||||||
| 1971 | |||||||||||||
| 1972 | |||||||||||||
| 1973 | |||||||||||||
| 1974 | 0.00 | 973.71 | 1657.31 | 2648.79 | 0.00 | 5279.81 | |||||||
| 1975 | |||||||||||||
| 1976 | |||||||||||||
| 1977 | |||||||||||||
| 1978 | |||||||||||||
| 1979 | |||||||||||||
| 1980 | |||||||||||||
| 1981 | 2146.91 | 1520.73 | 2691.97 | 1720.36 | 1469.06 | 9549.03 | |||||||
| 1982 | 341.19 | 1252.63 | 2033.82 | 1464.66 | 1360.73 | 6453.03 | |||||||
| 1983 | 316.19 | 1895.68 | 1949.50 | 1960.07 | 1153.00 | 7274.44 | |||||||
| 1984 | 0.00 | 1643.59 | 2564.21 | 1433.55 | 219.13 | 5860.48 | |||||||
| 1985 | 1823.80 | 2113.98 | 2905.44 | 1385.85 | 692.73 | 8921.80 | |||||||
| 1986 | 599.93 | 1437.50 | 3023.30 | 1902.91 | 746.03 | 7709.67 | |||||||
| 1987 | 1558.31 | 2159.65 | 2472.26 | 1229.22 | 0.00 | 7419.44 | |||||||
| 1988 | 0.00 | 913.85 | 2205.87 | 2083.73 | 344.43 | 5547.88 | |||||||
| 1989 | 512.23 | 2716.60 | 3079.20 | 2699.21 | 1132.56 | 10139.80 | |||||||
| 1990 | 1077.12 | 2616.30 | 2655.77 | 2603.70 | 956.93 | 9909.82 | |||||||
| 1991 | 728.53 | 1800.48 | 2718.46 | 2015.96 | 1092.00 | 8355.43 | |||||||
| 1992 | 1159.73 | 2095.73 | 2146.71 | 2050.11 | 160.07 | 7612.35 | |||||||
| 1993 | 1501.98 | 1240.96 | 1547.64 | 2094.16 | 1822.86 | 8207.60 | |||||||
| 1994 | 534.73 | 2382.64 | 2223.70 | 2273.00 | 1845.38 | 9259.45 | |||||||
| 1995 | 0.00 | 535.75 | 1556.30 | 2161.05 | 1260.50 | 5513.60 | |||||||
| 1996 | 26.28 | 240.69 | 2265.46 | 2247.72 | 855.41 | 5635.56 | |||||||
| 1997 | 0.00 | 1069.04 | 1727.64 | 974.62 | 463.64 | 4234.94 | |||||||
| 1998 | 672.91 | 1802.35 | 1781.11 | 1994.44 | 1222.88 | 7473.69 | |||||||
| 1999 | 0.00 | 305.45 | 2050.11 | 2100.15 | 1173.37 | 5629.08 | |||||||
| Mean | 649.99 | 1535.87 | 2262.79 | 1952.16 | 898.54 | 7299.35 | |||||||
| Max | 2146.91 | 2716.60 | 3079.20 | 2699.21 | 1845.38 | 10139.80 | |||||||
| Min | 0.00 | 240.69 | 1547.64 | 974.62 | 0.00 | 4234.94 | |||||||
| Name Source District Data |
Pratt & Ferris No. 3 Ditch Diversion Clear Creek 9 First & Last Dates, Max. Days | ||
| Water Year | First Date of Measurement | Last Date of Measurement | Maximum Days Missing |
|---|---|---|---|
| 1970 | |||
| 1971 | |||
| 1972 | |||
| 1973 | |||
| 1974 | 17-Jun | 31-Aug | 0 |
| 1975 | |||
| 1976 | |||
| 1977 | Erroneous | Data | |
| 1978 | |||
| 1979 | |||
| 1980 | |||
| 1981 | 01-May | 28-Sep | 14 |
| 1982 | 21-May | 20-Sep | 16 |
| 1983 | 26-May | 30-Sep | 8 |
| 1984 | 01-Jun | 04-Sep | 10 |
| 1985 | 09-May | 16-Sep | 10 |
| 1986 | 19-May | 12-Sep | 8 |
| 1987 | 12-May | 21-Aug | 21 |
| 1988 | 21-Jun | 08-Sep | 13 |
| 1989 | 15-May | 15-Sep | 5 |
| 1990 | 18-May | 14-Sep | 11 |
| 1991 | 15-May | 13-Sep | 17 |
| 1992 | 15-May | 02-Sep | 7 |
| 1993 | 07-May | 29-Sep | 7 |
| 1994 | 23-May | 30-Sep | 7 |
| 1995 | 02-Jun | 25-Sep | 7 |
| 1996 | 07-May | 20-Sep | 21 |
| 1997 | 03-Jun | 11-Sep | 15 |
| 1998 | 22-May | 16-Sep | 22 |
| 1999 | 10-Jun | 20-Sep | 18 |
| Avg. | 22-May | 15-Sep | 12 |
| Earliest | 01-May | 21-Aug | 0 |
| Latest | 21-Jun | 30-Sep | 22 |
KEY DIVERSIONS
| Diversion: | REDMAN DITCH DIVERSION | 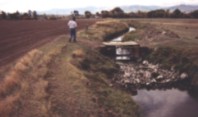 Redman flume | ||||||||||||||||||||||||||||||
| Date: | 4 Oct. 2000 | |||||||||||||||||||||||||||||||
| Diversion Description: | Headgate consists of a single, 6.2 x 1.7-foot rectangular steel gate operated with a Waterman-type screw, mounted in a concrete headwall. | |||||||||||||||||||||||||||||||
| Diversion Location: | The Redman diversion is located on the main stem of Clear Creek between the confluences of Clear Creek with Piney and Rock creeks. | |||||||||||||||||||||||||||||||
| ||||||||||||||||||||||||||||||||
| Conveyance Description: | Open channel canal, approximately 4.5 mi. long. | |||||||||||||||||||||||||||||||
| Direct Flow Water Rights: |
| |||||||||||||||||||||||||||||||
| Associated Storage Rights: | None | |||||||||||||||||||||||||||||||
| Irrigation Practices: | See introduction to Clear Creek drainage | |||||||||||||||||||||||||||||||
| Agricultural Practices: | See introduction to Clear Creek drainage | |||||||||||||||||||||||||||||||
| Return Flows: | Estimated percentage of total diversion developing into return flows: | |||||||||||||||||||||||||||||||
| ||||||||||||||||||||||||||||||||
| Side cuts drain to draws feeding other fields, lowering return. | ||||||||||||||||||||||||||||||||
| Losses: | Approximately 20 percent by the end of the ditch | |||||||||||||||||||||||||||||||
| References: | Carmine LoGuidice, Interview, State Engineer.s Office, 4 Oct. 2000 | |||||||||||||||||||||||||||||||
Irrigated Lands Water Rights Database
| PerNo | PerSfx | Facility Name | Priority | Acres | Amount | Unit | SupTyp | Status | Source |
|---|---|---|---|---|---|---|---|---|---|
| Terr | D | Redman | March 20, 1884 | 1218 | 17.4 | CFS | OS | Adj | Clear Creek |
| Name Source District Data |
Redman Ditch Diversion Clear Creek 2 Total monthly flow in AF | ||||||||||||
| Water Year | Oct | Nov | Dec | Jan | Feb | Mar | Apr | May | Jun | Jul | Aug | Sep | Total |
|---|---|---|---|---|---|---|---|---|---|---|---|---|---|
| 1970 | |||||||||||||
| 1971 | |||||||||||||
| 1972 | |||||||||||||
| 1973 | |||||||||||||
| 1974 | 358.49 | 762.39 | 487.50 | 0.00 | 0.00 | 1608.38 | |||||||
| 1975 | |||||||||||||
| 1976 | |||||||||||||
| 1977 | |||||||||||||
| 1978 | |||||||||||||
| 1979 | |||||||||||||
| 1980 | |||||||||||||
| 1981 | 363.24 | 292.29 | 190.06 | 99.59 | 0.00 | 945.18 | |||||||
| 1982 | 0.00 | 572.73 | 296.82 | 1000.63 | 124.87 | 1995.05 | |||||||
| 1983 | 175.39 | 480.88 | 138.03 | 0.00 | 0.00 | 794.30 | |||||||
| 1984 | 0.00 | 303.72 | 250.66 | 261.54 | 90.05 | 905.97 | |||||||
| 1985 | 0.00 | 51.29 | 158.01 | 103.79 | 67.89 | 380.98 | |||||||
| 1986 | 50.05 | 364.40 | 331.65 | 74.18 | 0.00 | 820.28 | |||||||
| 1987 | 0.00 | 0.00 | 395.53 | 961.17 | 0.00 | 1356.70 | |||||||
| 1988 | 14.88 | 744.42 | 418.96 | 782.75 | 395.09 | 2356.10 | |||||||
| 1989 | 0.00 | 604.97 | 772.95 | 325.02 | 406.57 | 2109.51 | |||||||
| 1990 | 0.00 | 235.82 | 666.59 | 519.29 | 412.09 | 1833.79 | |||||||
| 1991 | 0.00 | 284.34 | 471.96 | 975.34 | 633.31 | 2364.95 | |||||||
| 1992 | 299.90 | 628.99 | |||||||||||
| 1993 | 0.00 | 0.00 | 0.00 | 302.28 | 649.84 | 952.12 | |||||||
| 1994 | 0.00 | 90.52 | 275.22 | 119.40 | 0.00 | 485.14 | |||||||
| 1995 | 22.34 | 216.88 | 518.54 | 964.94 | 0.00 | 1722.70 | |||||||
| 1996 | 12.47 | 202.81 | 933.84 | 556.68 | 279.48 | 1985.28 | |||||||
| 1997 | 1.94 | 340.02 | 530.76 | 0.00 | 0.00 | 872.72 | |||||||
| 1998 | 111.04 | 480.32 | 469.67 | 357.05 | 2.52 | 1420.60 | |||||||
| 1999 | 0.00 | 700.61 | 59.86 | ||||||||||
| Mean | 70.49 | 334.88 | 405.93 | 426.54 | 187.53 | 1383.88 | |||||||
| Max | 363.24 | 762.39 | 933.84 | 1000.63 | 649.84 | 2364.95 | |||||||
| Min | 0.00 | 0.00 | 0.00 | 0.00 | 0.00 | 380.98 | |||||||
| Name Source District Data |
Redman Ditch Diversion Clear Creek 2 First & Last Dates, Max. Days | ||
| Water Year | First Date of Measurement | Last Date of Measurement | Maximum Days Missing |
|---|---|---|---|
| 1970 | |||
| 1971 | |||
| 1972 | |||
| 1973 | |||
| 1974 | 14-May | 20-Jul | 0 |
| 1975 | |||
| 1976 | |||
| 1977 | |||
| 1978 | |||
| 1979 | |||
| 1980 | |||
| 1981 | 03-May | 16-Aug | 14 |
| 1982 | 03-Jun | 12-Sep | 12 |
| 1983 | 22-May | 26-Jul | 9 |
| 1984 | 03-Jun | 11-Sep | 10 |
| 1985 | 25-Jun | 18-Sep | 6 |
| 1986 | 20-May | 14-Aug | 8 |
| 1987 | 20-Jul | 27-Aug | 11 |
| 1988 | 29-May | 15-Sep | 4 |
| 1989 | 14-Jun | 14-Sep | 27 |
| 1990 | 06-Jun | 14-Sep | 12 |
| 1991 | 21-Jun | 14-Sep | 22 |
| 1992 | 25-May | 27-Sep | 69 |
| 1993 | 18-Aug | 30-Sep | 13 |
| 1994 | 22-Jun | 16-Aug | 40 |
| 1995 | 26-May | 01-Sep | 47 |
| 1996 | 21-May | 16-Sep | 35 |
| 1997 | 29-May | 23-Jul | 49 |
| 1998 | 26-May | 02-Sep | 20 |
| 1999 | 03-Jun | 08-Sep | 54 |
| Avg. | 06-Jun | 31-Aug | 23 |
| Earliest | 03-May | 20-Jul | 0 |
| Latest | 18-Aug | 30-Sep | 69 |
KEY DIVERSIONS
| Diversion: | ROBERTS DITCH DIVERSION |  Roberts Ditch headgate | ||||||||||||||||||||||||||||||||||||||||||
| Date: | 4 Oct. 2000 | |||||||||||||||||||||||||||||||||||||||||||
| Diversion Description: | Headgate consists of two 2 x 2.5-foot rectangular steel gates on slides operated with Waterman-type screws in a steel headwall. | |||||||||||||||||||||||||||||||||||||||||||
| Diversion Location: | The Roberts Ditch diversion is located on the main stem of Clear Creek between the confluences of Clear Creek with Piney Creek and Double Crossing Creek. | |||||||||||||||||||||||||||||||||||||||||||
| 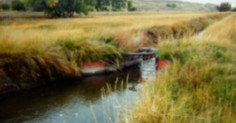 Roberts Ditch flume | |||||||||||||||||||||||||||||||||||||||||||
| Conveyance Description: | Open channel canal, approximately 4 mi. long. | |||||||||||||||||||||||||||||||||||||||||||
| Direct Flow Water Rights: |
| |||||||||||||||||||||||||||||||||||||||||||
| Associated Storage Rights: | Irrigators on the Roberts Ditch use water from Lake DeSmet reservoir. | |||||||||||||||||||||||||||||||||||||||||||
| Irrigation Practices: | See introduction to Clear Creek drainage | |||||||||||||||||||||||||||||||||||||||||||
| Agricultural Practices: | See introduction to Clear Creek drainage | |||||||||||||||||||||||||||||||||||||||||||
| Return Flows: | Estimated percentage of total diversion developing into return flows: | |||||||||||||||||||||||||||||||||||||||||||
| ||||||||||||||||||||||||||||||||||||||||||||
| Losses: | Approximately 10 percent by the end of the ditch | |||||||||||||||||||||||||||||||||||||||||||
| References: | Carmine LoGuidice, Interview, State Engineer.s Office, 4 Oct. 2000 | |||||||||||||||||||||||||||||||||||||||||||
Irrigated Lands Water Rights Database
| PerNo | PerSfx | Facility Name | Priority | Acres | Amount | Unit | SupTyp | Status | Source |
|---|---|---|---|---|---|---|---|---|---|
| 542 | D | Huson (Roberts) | July 7, 1893 | 110 | 1.57 | CFS | OS | Adj | Clear Creek |
| 710 | D | Roberts | May 4, 1894 | 257 | 3.67 | CFS | OS | Adj | Clear Creek |
| 1032 | E | Enl. Huson (Roberts) | May 6, 1903 | 60 | 0.85 | CFS | OS | Adj | Clear Creek |
| 1705 | E | Enl. Roberts | April 23, 1907 | 90 | 1.29 | CFS | OS | Adj | Clear Creek |
| 1898 | E | Enl. Huson (Roberts) | June 18, 1908 | 30 | 0.42 | CFS | OS | Adj | Clear Creek |
| 9800 | D | Winter No. 1 (Roberts) | May 10, 1910 | 24 | 0.34 | CFS | OS | Adj | Clear Creek |
| 9801 | D | Winter No. 2 (Roberts) | May 10, 1910 | 29 | 0.41 | CFS | OS | Adj | Clear Creek |
| 9802 | D | Winter No. 2 (Roberts) | May 10, 1910 | 23 | 0.33 | CFS | OS | Adj | Clear Creek |
| 2820 | E | Enl. Roberts | June 26, 1913 | 85 | 1.21 | CFS | OS | Una | Clear Creek |
| 3076 | E | Enl. Roberts | Dec. 7, 1914 | 55 | 0.78 | CFS | OS | Adj | Clear Creek |
| 20242 | D | Roberts | July 6, 1948 | 40.3 | 0.57 | CFS | OS | Adj | Clear Creek |
| 5947 | E | Enl. Roberts | Jan. 9, 1958 | 52.9 | 0.63 | CFS | OS | Adj | Clear Creek |
| Name Source District Data |
Roberts Ditch Diversion Clear Creek 9 Total monthly flow in AF | ||||||||||||
| Water Year | Oct | Nov | Dec | Jan | Feb | Mar | Apr | May | Jun | Jul | Aug | Sep | Total |
|---|---|---|---|---|---|---|---|---|---|---|---|---|---|
| 1970 | |||||||||||||
| 1971 | |||||||||||||
| 1972 | |||||||||||||
| 1973 | |||||||||||||
| 1974 | 0.00 | 233.28 | 644.67 | 568.09 | 0.00 | 1446.04 | |||||||
| 1975 | |||||||||||||
| 1976 | |||||||||||||
| 1977 | |||||||||||||
| 1978 | |||||||||||||
| 1979 | |||||||||||||
| 1980 | |||||||||||||
| 1981 | 394.48 | 547.13 | 555.41 | 444.10 | 0.00 | 1941.12 | |||||||
| 1982 | 358.93 | 453.28 | 520.45 | 415.87 | 0.00 | 1748.53 | |||||||
| 1983 | 0.00 | 1103.11 | 519.17 | 604.76 | 172.86 | 2399.90 | |||||||
| 1984 | 0.00 | 458.02 | 753.52 | 528.04 | 0.00 | 1739.58 | |||||||
| 1985 | 519.07 | 191.21 | 505.59 | 0.00 | 0.00 | 1215.87 | |||||||
| 1986 | 173.75 | 495.62 | 541.64 | 189.50 | 89.97 | 1490.48 | |||||||
| 1987 | 212.13 | 365.98 | 251.06 | 48.56 | 0.00 | 877.73 | |||||||
| 1988 | 0.00 | 0.00 | 298.72 | 387.27 | 80.37 | 766.36 | |||||||
| 1989 | 16.66 | 795.37 | 438.09 | 622.31 | 75.07 | 1947.50 | |||||||
| 1990 | 211.04 | 721.69 | 748.07 | 545.26 | 108.59 | 2334.65 | |||||||
| 1991 | 117.52 | 304.11 | 679.09 | 491.70 | 157.88 | 1750.30 | |||||||
| 1992 | 247.24 | 314.83 | 260.54 | 608.47 | 28.46 | 1459.54 | |||||||
| 1993 | 375.27 | 511.64 | 200.93 | 307.64 | 216.79 | 1612.27 | |||||||
| 1994 | 177.86 | 425.18 | 345.77 | 225.48 | 214.45 | 1388.74 | |||||||
| 1995 | 0.00 | 0.00 | 618.80 | 551.94 | 71.81 | 1242.55 | |||||||
| 1996 | |||||||||||||
| 1997 | 0.00 | 90.06 | 452.96 | 103.71 | 25.60 | 672.33 | |||||||
| 1998 | 272.81 | 244.17 | 458.70 | 394.84 | 52.21 | 1422.73 | |||||||
| 1999 | 0.00 | 215.90 | 425.81 | 637.92 | 50.08 | 1329.71 | |||||||
| Mean | 161.93 | 393.19 | 485.21 | 403.97 | 70.74 | 1515.05 | |||||||
| Max | 519.07 | 1103.11 | 753.52 | 637.92 | 216.79 | 2399.90 | |||||||
| Min | 0.00 | 0.00 | 200.93 | 0.00 | 0.00 | 672.33 | |||||||
| Name Source District Data |
Roberts Ditch Diversion Clear Creek 9 First & Last Dates, Max. Days | ||
| Water Year | First Date of Measurement | Last Date of Measurement | Maximum Days Missing |
|---|---|---|---|
| 1970 | |||
| 1971 | |||
| 1972 | |||
| 1973 | |||
| 1974 | 17-Jun | 31-Aug | 0 |
| 1975 | |||
| 1976 | |||
| 1977 | |||
| 1978 | |||
| 1979 | |||
| 1980 | |||
| 1981 | 19-May | 26-Aug | 26 |
| 1982 | 13-May | 16-Aug | 11 |
| 1983 | 03-Jun | 13-Sep | 8 |
| 1984 | 01-Jun | 27-Aug | 10 |
| 1985 | 09-May | 26-Jul | 25 |
| 1986 | 24-May | 05-Sep | 20 |
| 1987 | 12-May | 17-Aug | 27 |
| 1988 | 12-Jul | 06-Sep | 30 |
| 1989 | 30-May | 15-Sep | 9 |
| 1990 | 28-May | 14-Sep | 11 |
| 1991 | 17-May | 13-Sep | 17 |
| 1992 | 15-May | 15-Sep | 16 |
| 1993 | 17-May | 27-Sep | 7 |
| 1994 | 23-May | 30-Sep | 7 |
| 1995 | 14-Jul | 08-Sep | 5 |
| 1996 | |||
| 1997 | 03-Jun | 11-Sep | 15 |
| 1998 | 22-May | 16-Sep | 22 |
| 1999 | 10-Jun | 20-Sep | 18 |
| Avg. | 29-May | 06-Sep | 15 |
| Earliest | 09-May | 26-Jul | 0 |
| Latest | 14-Jul | 30-Sep | 30 |
KEY DIVERSIONS
| Diversion: | SIX MILE DITCH DIVERSION | 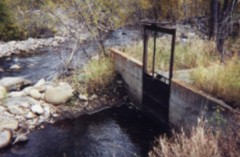 Six Mile headgate | ||||||||||||||||||||||||
| Date: | 4 Oct. 2000 | |||||||||||||||||||||||||
| Diversion Description: | Headgate consists of a single, 3.5 x 5.3-foot rectangular steel gate operated with a Waterman-type screw, mounted in a concrete headwall, adjacent to a rock dam. | |||||||||||||||||||||||||
| Diversion Location: | The Six Mile diversion is located on the main stem of Clear Creek between the confluences of Clear Creek and North Fork and Sand creeks. | |||||||||||||||||||||||||
| 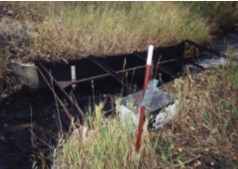 Six Mile flume | |||||||||||||||||||||||||
| Conveyance Description: | Open channel canal, approximately 6.5 mi. long. | |||||||||||||||||||||||||
| Direct Flow Water Rights: |
| |||||||||||||||||||||||||
| Associated Storage Rights: | Irrigators on Six Mile Ditch have an exchange arranged, receiving stored water from Cloud Peak Reservoir in exchange for Rock Creek flow. | |||||||||||||||||||||||||
| Irrigation Practices: | See introduction to Clear Creek drainage | |||||||||||||||||||||||||
| Agricultural Practices: | See introduction to Clear Creek drainage | |||||||||||||||||||||||||
| Return Flows: | Estimated percentage of total diversion developing into return flows: | |||||||||||||||||||||||||
| ||||||||||||||||||||||||||
| Losses: | Approximately 15 percent by the end of the ditch | |||||||||||||||||||||||||
| References: | Dave Pelloux, Interview, State Engineer.s Office, 25 Oct. 2000 | |||||||||||||||||||||||||
Irrigated Lands Water Rights Database
| PerNo | PerSfx | Facility Name | Priority | Acres | Amount | Unit | SupTyp | Status | Source |
|---|---|---|---|---|---|---|---|---|---|
| Terr | D | Six Mile | July 12, 1884 | 800 | 11.53 | CFS | OS | Adj | Clear Creek |
| Terr | D | Six Mile | July 12, 1884 | 800 | 11.53 | CFS | OS | Adj | Clear Creek |
| 1899 | E | Enl. Six Mile | March 2, 1908 | 1160 | 16.57 | CFS | OS | Adj | Clear Creek |
| 14763 | D | Six Mile | Aug. 10, 1917 | 55 | 0.78 | CFS | OS | Adj | Gresser or Six Mile Creek |
| 4177 | E | Enl. Six Mile | Jan. 15, 1921 | 101.2 | 1.44 | CFS | OS | Adj | Clear Creek |
| 21703 | D | Six Mile | Sep. 19, 1955 | 1934 | 27.63 | CFS | OS | Una | Clear Creek |
| 21703 | D | Six Mile | Sep. 19, 1955 | 1934 | 910.25 | CFS | OS | Adj | Clear Creek |
| Name Source District Data |
Six Mile Ditch Diversion Clear Creek 2 Total monthly flow in AF | ||||||||||||
| Water Year | Oct | Nov | Dec | Jan | Feb | Mar | Apr | May | Jun | Jul | Aug | Sep | Total |
|---|---|---|---|---|---|---|---|---|---|---|---|---|---|
| 1970 | |||||||||||||
| 1971 | |||||||||||||
| 1972 | |||||||||||||
| 1973 | |||||||||||||
| 1974 | 429.76 | 1164.52 | 854.74 | 0.00 | 0.00 | 2449.02 | |||||||
| 1975 | |||||||||||||
| 1976 | |||||||||||||
| 1977 | |||||||||||||
| 1978 | |||||||||||||
| 1979 | |||||||||||||
| 1980 | |||||||||||||
| 1981 | 796.17 | 740.06 | 805.01 | 630.58 | 263.52 | 3235.34 | |||||||
| 1982 | 0.00 | 832.23 | 846.71 | 761.55 | 371.52 | 2812.01 | |||||||
| 1983 | 327.20 | 807.47 | 701.61 | 0.00 | 0.00 | 1836.28 | |||||||
| 1984 | 22.31 | 729.16 | 824.88 | 763.64 | 294.66 | 2634.65 | |||||||
| 1985 | 0.00 | 195.47 | 752.91 | 639.25 | 322.17 | 1909.80 | |||||||
| 1986 | 534.10 | 1434.40 | 774.22 | 643.60 | 177.95 | 3564.27 | |||||||
| 1987 | 934.20 | 947.43 | 887.05 | 555.62 | 238.18 | 3562.48 | |||||||
| 1988 | 725.58 | 1435.18 | 828.19 | 179.53 | 157.98 | 3326.46 | |||||||
| 1989 | 597.47 | 1147.46 | 1119.53 | 892.26 | 336.77 | 4093.49 | |||||||
| 1990 | 730.99 | 1305.06 | 911.88 | 823.43 | 288.34 | 4059.70 | |||||||
| 1991 | 257.41 | 524.28 | 1121.65 | 624.30 | 115.49 | 2643.13 | |||||||
| 1992 | 767.62 | 724.02 | 610.33 | 874.12 | 636.91 | 3613.00 | |||||||
| 1993 | 178.57 | 820.27 | 935.36 | 938.53 | 420.55 | 3293.28 | |||||||
| 1994 | 424.79 | 946.84 | 854.06 | 561.70 | 0.00 | 2787.39 | |||||||
| 1995 | 102.86 | 1012.02 | 848.96 | 797.20 | 294.03 | 3055.07 | |||||||
| 1996 | 225.44 | 1056.77 | 885.34 | 487.27 | 222.69 | 2877.51 | |||||||
| 1997 | 426.53 | 979.52 | 884.49 | 134.23 | 0.00 | 2424.77 | |||||||
| 1998 | 385.50 | 1355.84 | 1226.26 | 812.65 | 535.28 | 4315.53 | |||||||
| 1999 | 0.00 | 774.76 | 1037.54 | 660.50 | 159.97 | 2632.77 | |||||||
| Mean | 393.33 | 946.64 | 885.54 | 589.00 | 241.80 | 3056.30 | |||||||
| Max | 934.20 | 1435.18 | 1226.26 | 938.53 | 636.91 | 4315.53 | |||||||
| Min | 0.00 | 195.47 | 610.33 | 0.00 | 0.00 | 1836.28 | |||||||
| Name Source District Data |
Six Mile Ditch Diversion Clear Creek 2 First & Last Dates, Max. Days | ||
| Water Year | First Date of Measurement | Last Date of Measurement | Maximum Days Missing |
|---|---|---|---|
| 1970 | |||
| 1971 | |||
| 1972 | |||
| 1973 | |||
| 1974 | 16-May | 28-Jul | 0 |
| 1975 | |||
| 1976 | |||
| 1977 | |||
| 1978 | |||
| 1979 | |||
| 1980 | |||
| 1981 | 01-May | 15-Sep | 19 |
| 1982 | 03-Jun | 15-Sep | 19 |
| 1983 | 17-May | 28-Jul | 13 |
| 1984 | 31-May | 12-Sep | 8 |
| 1985 | 25-Jun | 18-Sep | 4 |
| 1986 | 15-May | 08-Sep | 5 |
| 1987 | 14-May | 10-Sep | 5 |
| 1988 | 16-May | 15-Sep | 12 |
| 1989 | 15-May | 15-Sep | 6 |
| 1990 | 15-May | 13-Sep | 12 |
| 1991 | 15-May | 14-Sep | 8 |
| 1992 | 15-May | 27-Sep | 42 |
| 1993 | 26-May | 30-Sep | 16 |
| 1994 | 20-May | 24-Aug | 40 |
| 1995 | 26-May | 18-Sep | 17 |
| 1996 | 17-May | 16-Sep | 19 |
| 1997 | 19-May | 11-Aug | 19 |
| 1998 | 21-May | 28-Sep | 9 |
| 1999 | 03-Jun | 08-Sep | 11 |
| Avg | 21-May | 08-Sep | 14 |
| Earliest | 01-May | 28-Jul | 0 |
| Latest | 25-Jun | 30-Sep | 42 |