Wyoming State Water Plan
Wyoming State Water Plan
Wyoming Water Development Office
6920 Yellowtail Rd
Cheyenne, WY 82002
Phone: 307-777-7626

Wyoming Water Development Office
6920 Yellowtail Rd
Cheyenne, WY 82002
Phone: 307-777-7626


This chapter presents estimates of the availability of surface water to meet future water uses and also characterizes the potential for ground water development.
As with all chapters in this final plan report, explicit lists of references are not provided. Instead, all references to reports, maps, and personal communications are provided in the various Technical Memoranda prepared during the planning process. The reader is referred to the following technical memoranda for a more detailed description of each topic as well as the list of references:
A. Surface WaterThe determination of available surface water is broken down into seven components discussed in the following sections:
Historic Streamflow Records
Available records of streamflow in the Powder/Tongue River Basin planning area have been compiled for this study.
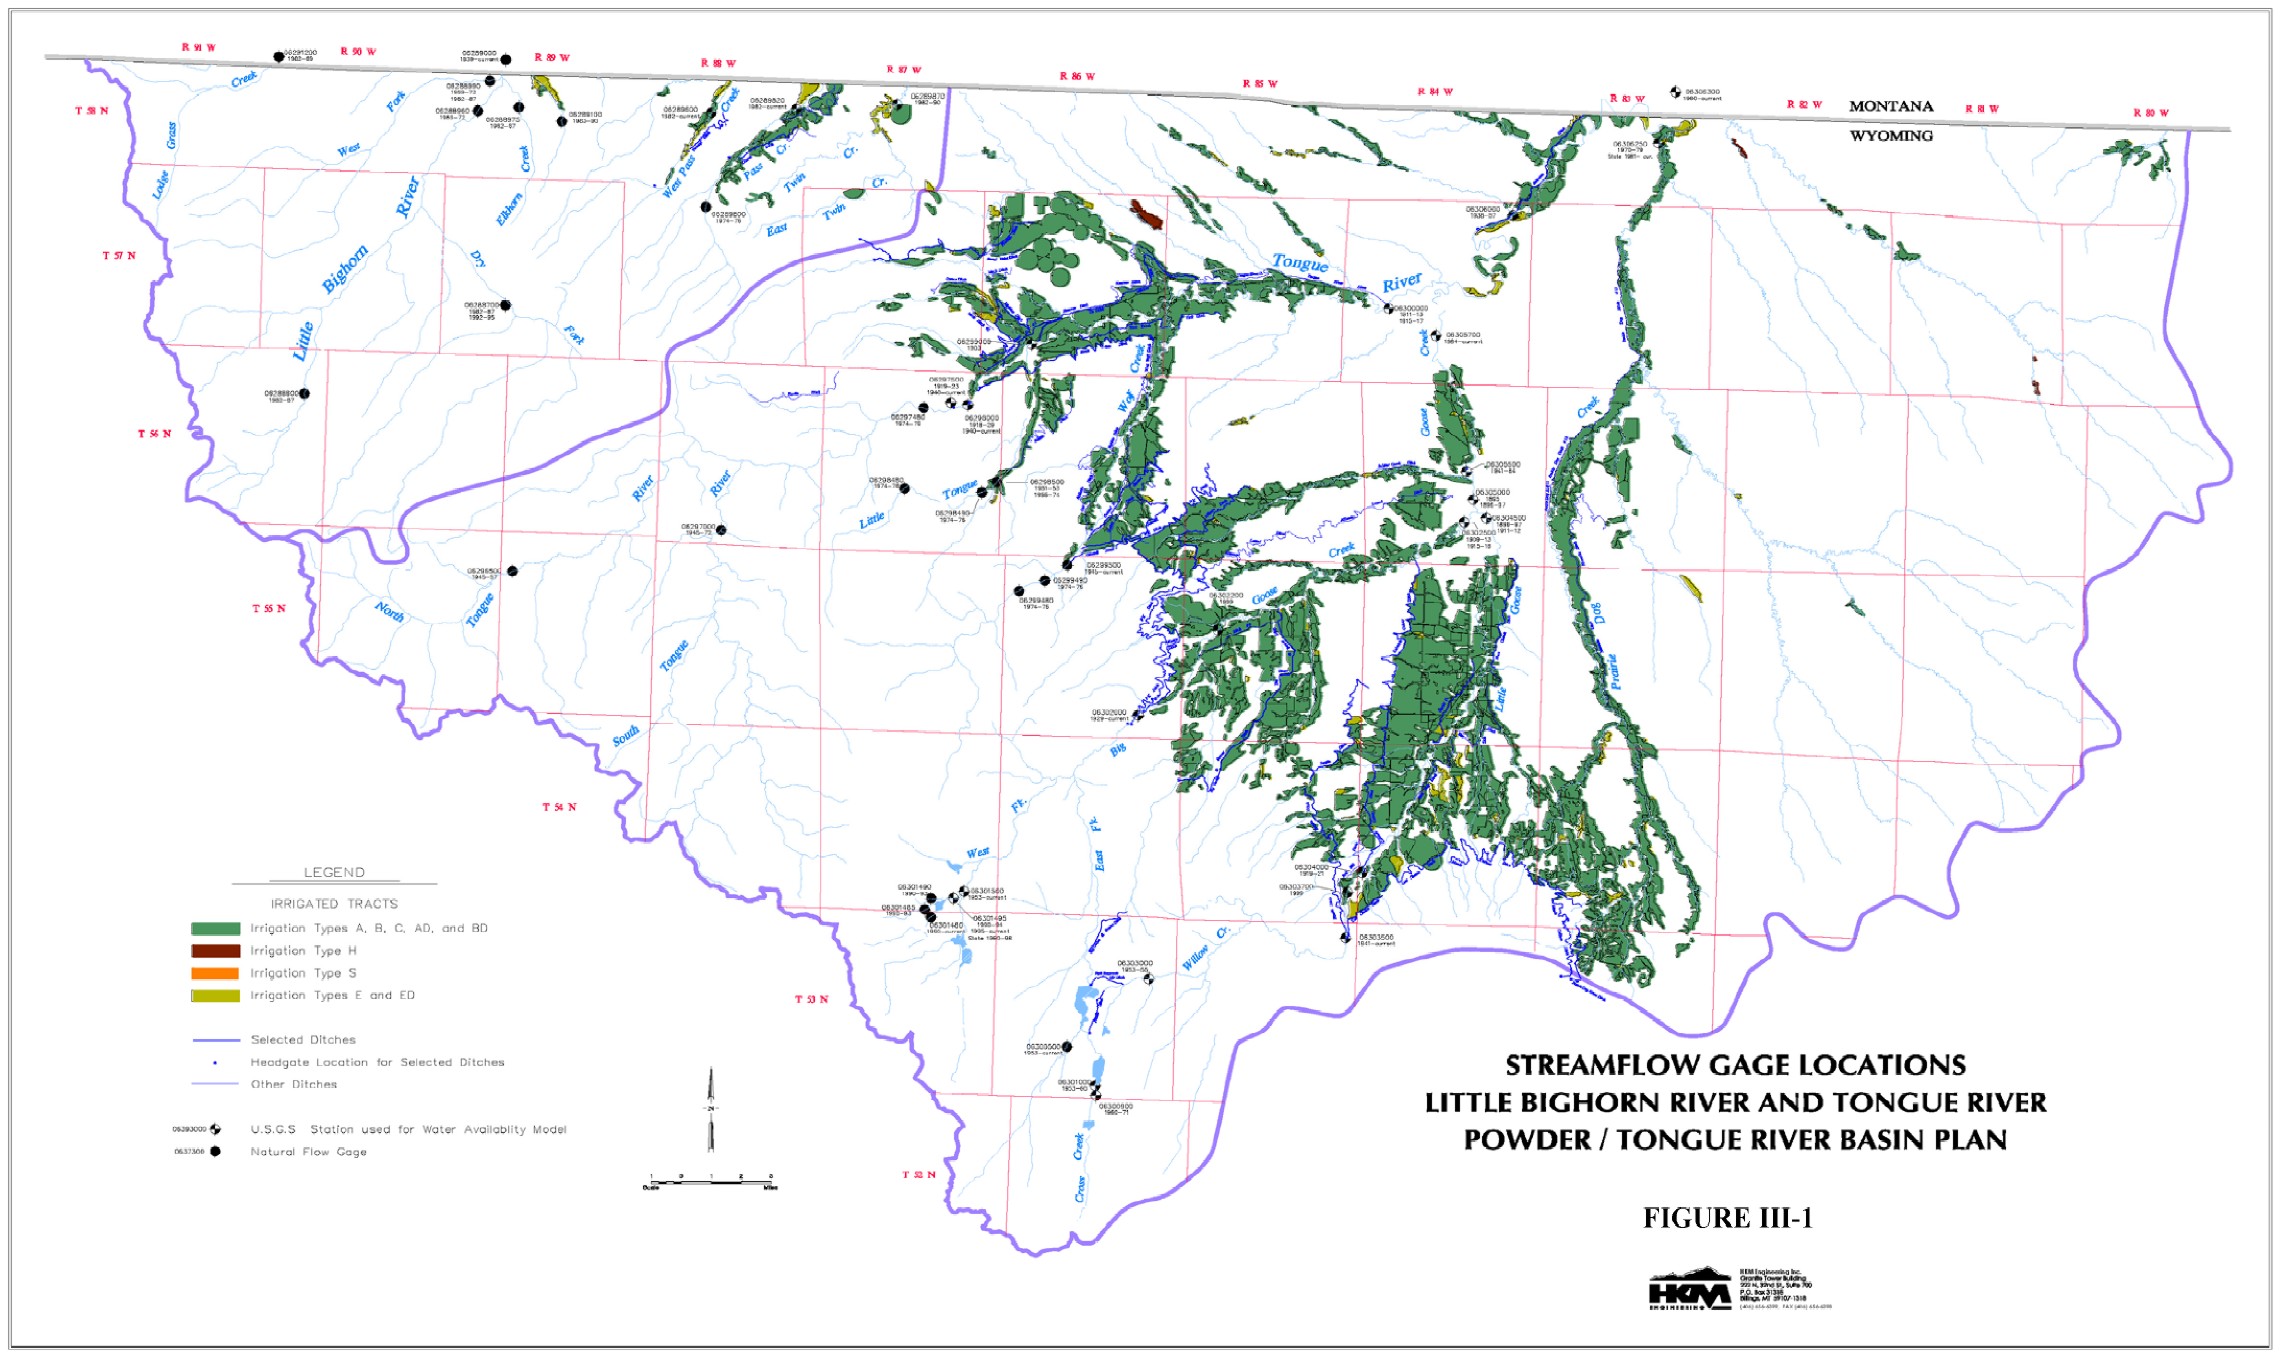
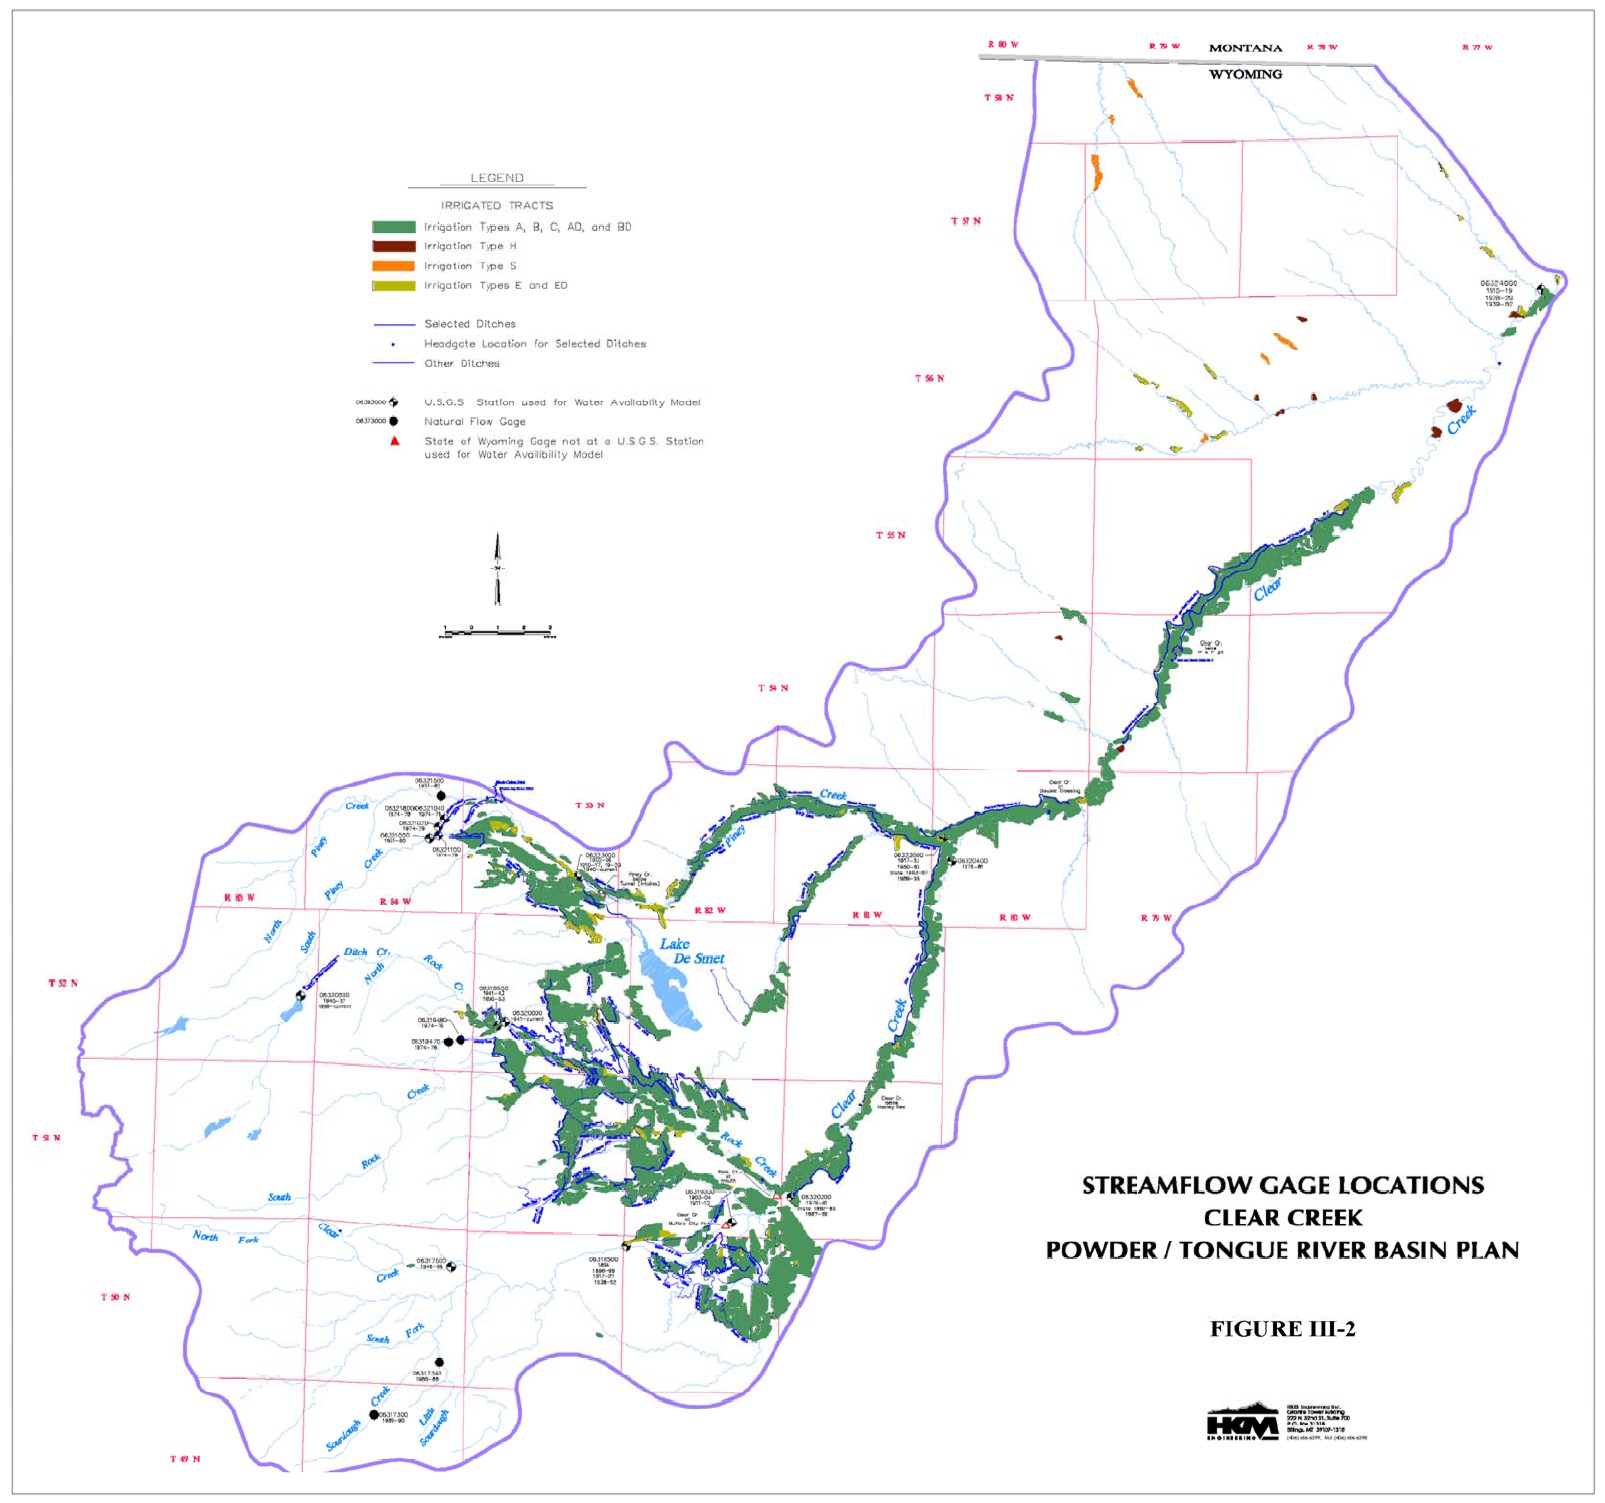
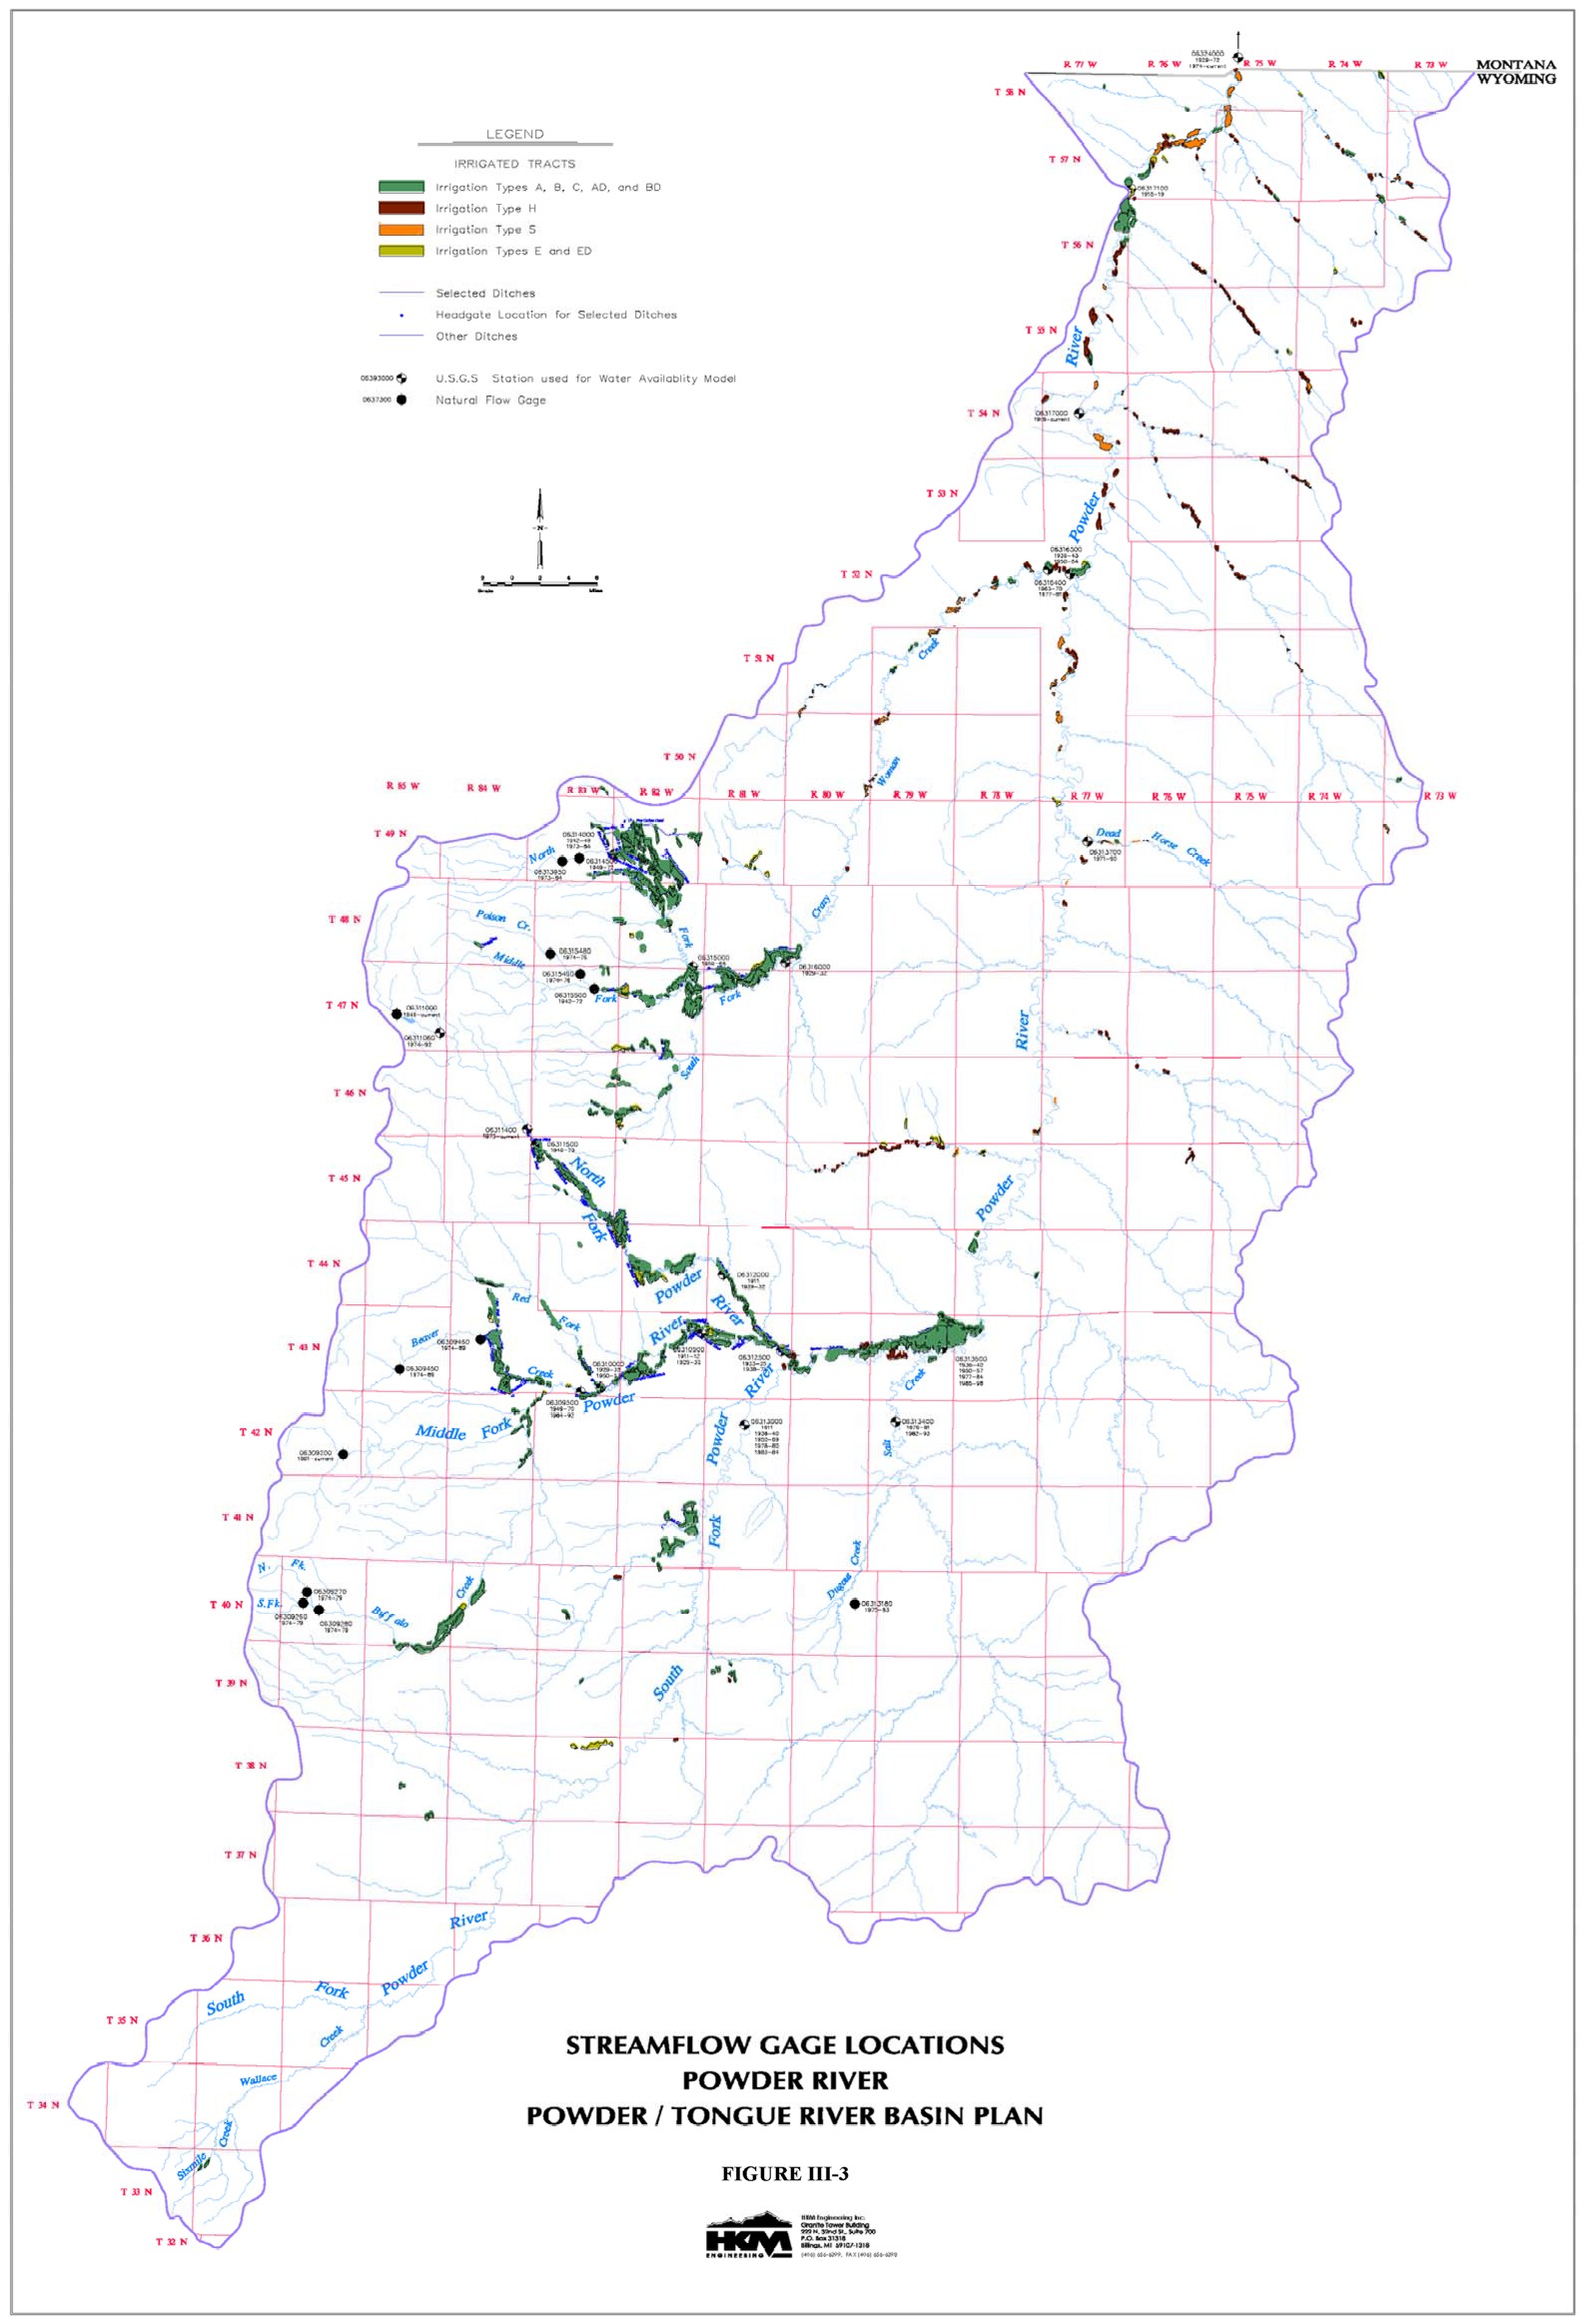
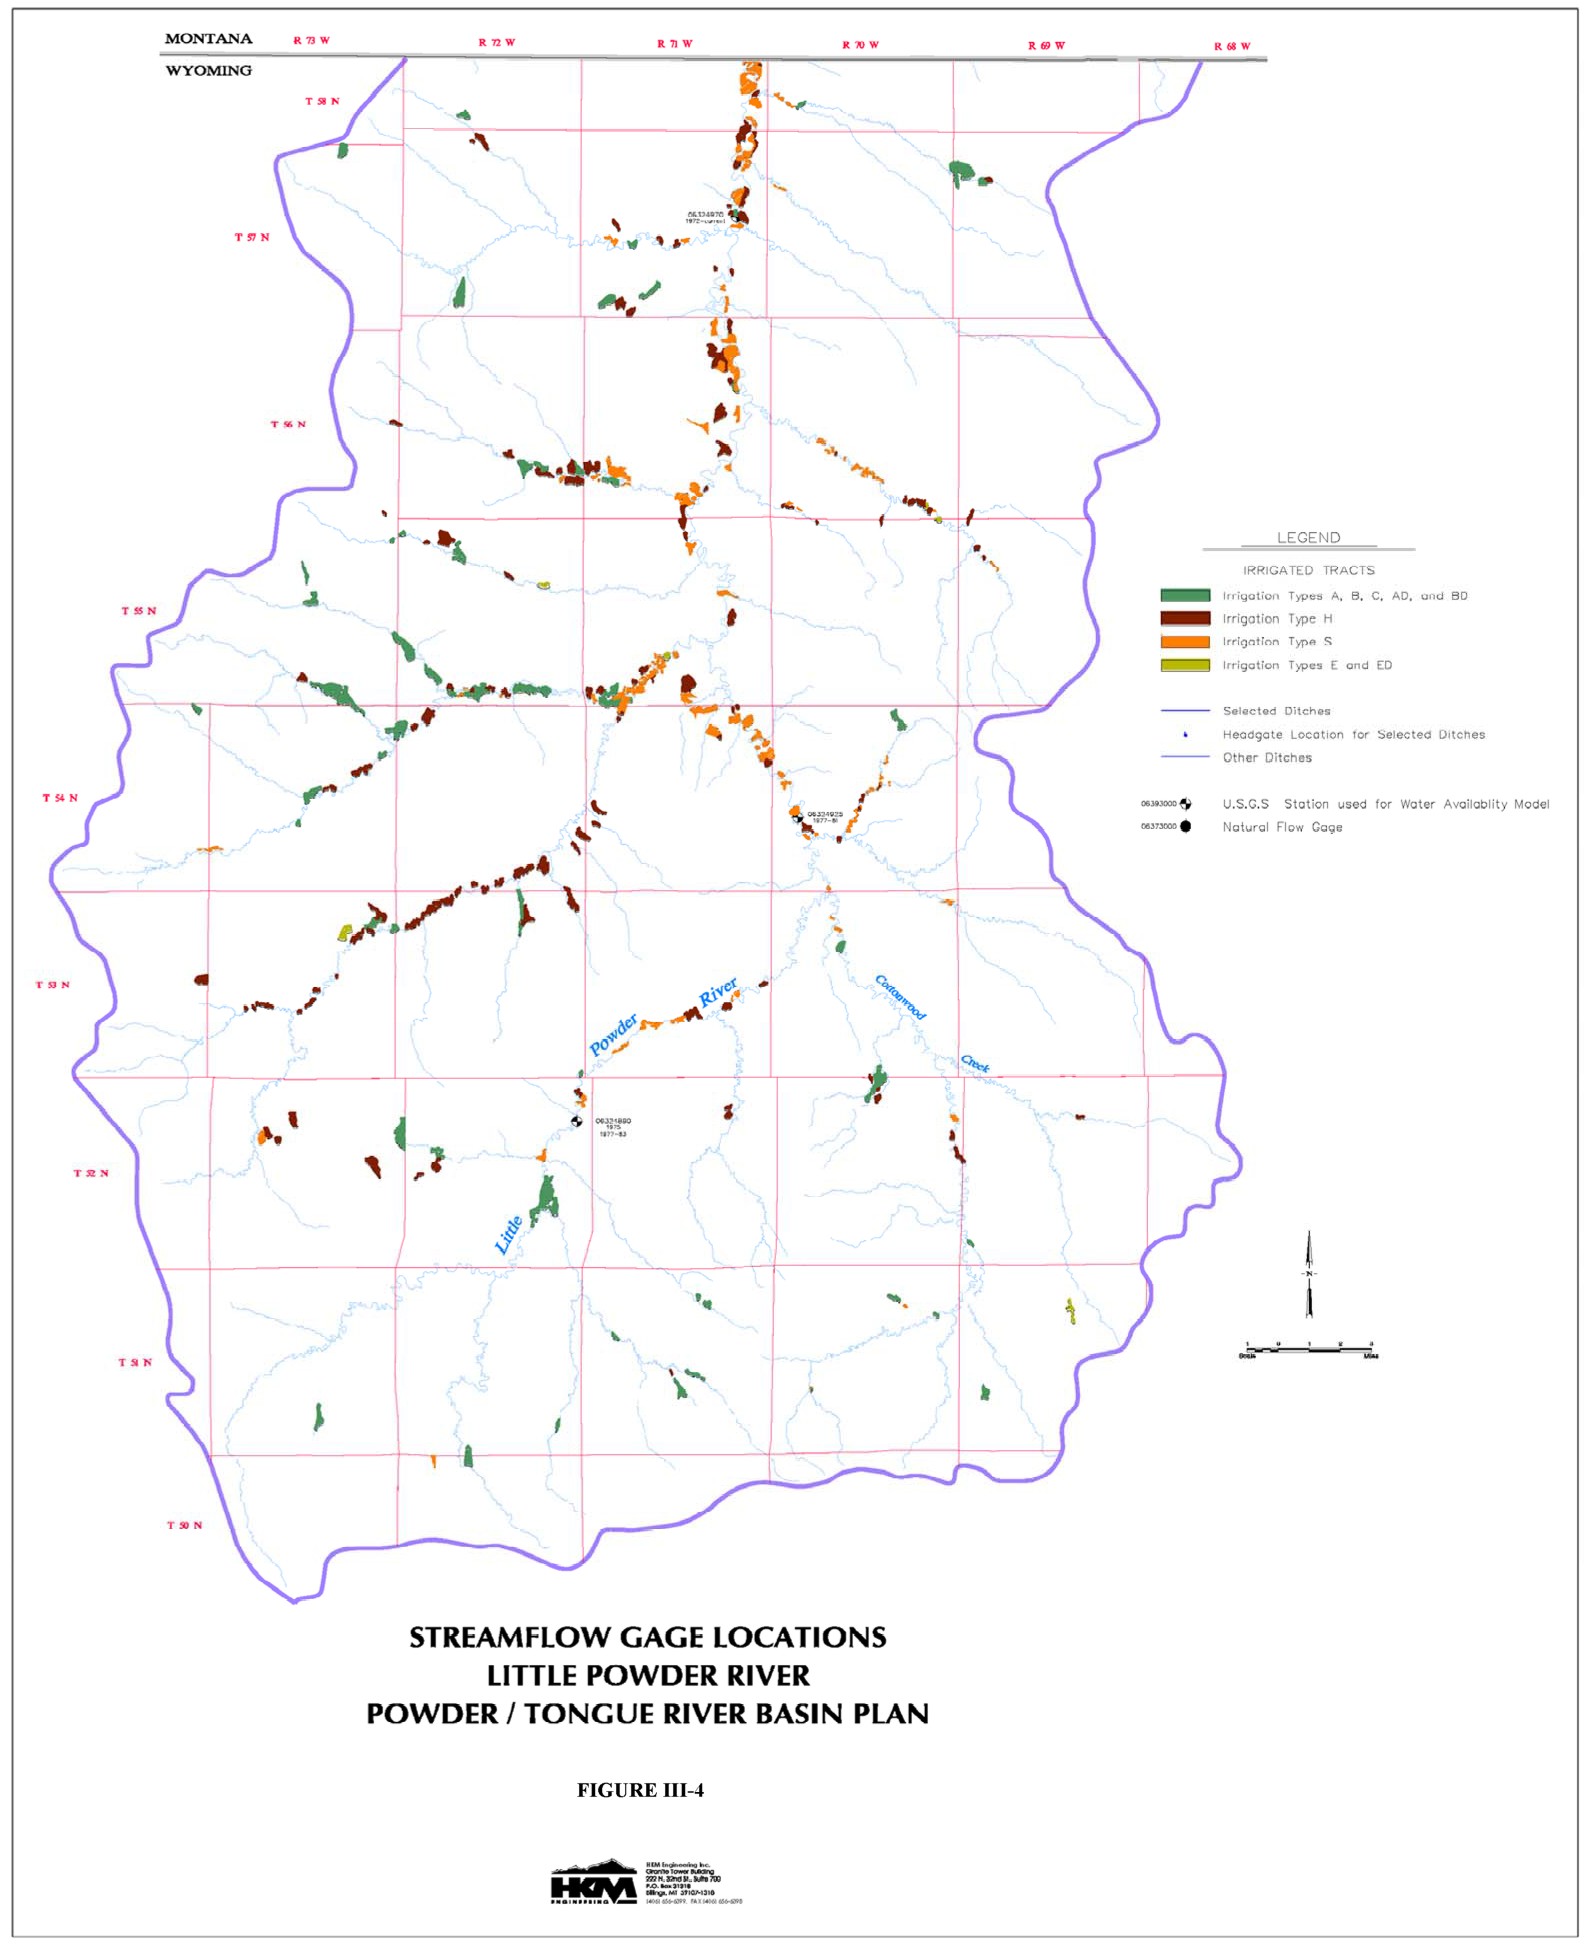
The location of the various streamflow gaging stations are plotted in relation to the significant storage reservoirs and the irrigated lands mapped for the Basin Plan (Figures III-1 through III-4). The streamflow gages that are relatively free from the influence of depletions or storage regulations are characterized as natural flow stations. Where reasonably possible, those gages that are impacted by upstream irrigation depletions were adjusted to remove these effects. The list of streamflow gages inventoried for this study is provided in Table III-1.
Records from an additional 40 to 50 streamflow gaging stations are available beginning in the 1970s and 1980s in comparison to those gages with earlier records.
Study Period
It is important in any water availability evaluation to select a study period that is long enough to include a variety of hydrologic conditions including an extended period of dry years as well as wet years and normal years. At the same time, it is also important not to select a study period so long that many streamflows must be synthesized to fill-in missing data.
The USGS has maintained a streamflow station on the Tongue River near Dayton (#06298000) since 1919 and continuous records are available from 1941 to present (Table III-1). This station is impacted by diversions to the Highline Ditch just upstream of the gage. Natural flow at this station is therefore determined by adding these recorded diversions to the recorded streamflow. The 59- year period of continuous record for this station (1941 through 1999) is selected as the best single representation of long term natural hydrologic conditions in the basin. Figure III-5 is a Cumulative Surplus/Deficit plot for the Tongue River near Dayton and represents a running total of the annual deviations from the long-term mean annual streamflow. Downward sloping lines (left to right) represent periods of time during which annual streamflow is less than the long-term mean. Conversely, upward sloping lines represent years which are wetter than average. As shown on Figure III-5, the periods from 1941 through 1947 and from 1962 through 1978 can be generally characterized as wet periods, whereas the periods from 1948 through 1961 and from 1979 through 1989 can be generally characterized as dry periods. The period from 1990 through 1999 can generally be characterized as near average. Exceptions to each of these generalities exist within each period. By way of example, 1966 is a dry year within a generally wet period of years and 1984 is a wet year within a generally dry period. Based on an evaluation of the long-term hydrologic conditions on the Tongue River, together with the an understanding of the availability of historic streamflow records, the 30-year period 1970 through 1999 was selected as a candidate study period. Selection of this potential study period is also influenced by the fact that ditch diversion records are available predominantly for the period after 1970. Both streamflow records and ditch diversions records are needed to develop water availability models that accurately simulate existing water use in the basin. As shown on Figure III-5, the average annual flow of the Tongue River near Dayton, for the period 1970 . 1999, is essentially equal to the long-term (1941 . 1999) average annual flow (133,175 AF vs. 133,210 AF).
The representativeness of the 1970 to 1999 study period was further evaluated by reviewing long- term natural flow gages that more completely represent the entire Powder/Tongue River Basin, including the Little Bighorn River, the Tongue River, and the Powder River. Three gages with relatively long periods of record are selected for this purpose: 1) Little Bighorn River at State Line (#06289000); 2) Tongue River near Dayton (#06298000); and North Fork Powder River near Hazelton (#06311000). The average annual flow for the period 1970 to 1999 is relatively close to
Table III-1
Streamflow Stations in the Powder/Tongue River Basins
| Basin | Station Number |
Station Name | Natural Flow | Period of Record in Water Years ** |
Note |
| Little Bighorn | |||||
| 06288600 | Little Bighorn River Below Dayton Gulch Near Burgess Junction, WY | YES | 1983-1987 | ||
| 06288700 | Dry Fork Little Bighorn Below Lick Creek Near Burgess Junction, WY | YES | 1983-1987, 1993-1995 | ||
| 06288960 | Little Bighorn River Near Parkman, WY | YES | 1970-1972 | ||
| 06288975 | Elkhorn Creek Above Fuller Ranch Ditch Near Parkman, WY | YES | 1983-1987 | No winter records in 1985 | |
| 06288990 | West Fork Little Bighorn River Near Parkman, WY | YES | 1970-72, 1983-1987 | No winter records in 1987 | |
| 06289000 | Little Bighorn River at State Line Near Wyola, MT | YES | 1939-current | ||
| 06289100 | Red Canyon Creek Near Parkman, WY | YES | 1982-1990 | No winter records in 1985, 1987 | |
| 06289500 | Little Bighorn River Near Wyola, MT | NO | 1912-1924 | No winter records; Abt. 7 mi. into MT | |
| 06289600 | West Pass Creek Near Parkman, WY | NO | 1983-current | No winter records 1985-1987 | |
| 06289800 | East Pass Creek Near Parkman, WY | YES | 1975-1976 | ||
| 06289820 | East Pass Creek Near Dayton, WY | NO | 1983-current | ||
| 06289870 | Twin Creek Near Parkman, WY | NO | 1983-1990 | No winter records 1985-1987 | |
| 06290000 | Pass Creek Near Wyola, MT | NO | 1939-1975 | Winter records incomplete before 1939; Abt. 4 mi. into MT | |
| 06290500 | Little Bighorn River Below Pass Creek Near Wyola, MT | NO | 1939-1975 | Abt. 13 mi. into MT | |
| 06291200 | Lodge Grass Creek at State Line Near Wyola, MT | YES | 1982-1989 | No winter records 1986 | |
| Tongue | 06296500 | North Fork Tongue River Near Dayton, WY | YES | 1945-1958 | No winter records before 1950 |
| 06297000 | South Fork Tongue River Near Dayton, WY | YES | 1945-1972 | ||
| 06297480 | Tongue River at Tongue Canyon Campground Near Dayton, WY | YES | 1975-1979 | ||
| 06298000 | Tongue River Near Dayton, WY | YES | 1919-1929, 1941-current | Adjusted using Highline Ditch Near Dayton, WY (06297500) as published | |
| 06298480 | Little Tongue River at Steamboat Point Near Dayton, WY | YES | 1975-1976 | ||
| 06298490 | Little Tongue River Above South Fork Little Tongue River Near Dayton, WY | YES | 1975-1976 | ||
| 06298500 | Little Tongue River Near Dayton, WY | YES | 1951-1974 | ||
| 06299000 | Tongue River at Dayton, WY | NO | 1903-1904 | Seasonal (May 1903 to Oct. 1904) | |
| 06299480 | Wolf Creek Below Alden Creek Near Wolf, WY | YES | 1975-1976 | ||
| 06299490 | Wolf Creek Above Red Canyon Creek at Wolf, WY | YES | 1975-1976 | ||
| 06299500 | Wolf Creek at Wolf, WY | YES | 1945-current | No winter records after 1971 | |
| 06300000 | Tongue River at Carneyville, WY | NO | 1911-1917 | Seasonal only | |
| 06300500 | East Fork Big Goose Creek Near Big Horn, WY | YES | 1954-current | No winter records after 1973 | |
| 06300900 | Cross Creek Above Big Horn Reservoir Near Big Horn, WY | NO | 1961-1971 | ||
| 06301000 | Cross Creek Near Big Horn, WY | NO | 1954-1960 | ||
| 06301480 | Coney Creek Above Twin Lakes Near Big Horn, WY | YES | 1991-current | No winter records 1993, 1996, 1998, 1999 | |
| 06301485 | Lost Lake Creek Near Big Horn, WY | YES | 1991-1993 | ||
| 06301490 | Snail Creek Near Big Horn, WY | YES | 1991-1993 | ||
| 06301495 | Coney Creek Below Twin Lakes Near Big Horn, WY | NO | 1991-1994, 1996-current | No winter records some years | |
| 06301500 | West Fork Big Goose Creek Near Big Horn, WY | NO | 1954-current | No winter records after 1971 | |
| 06302000 | Big Goose Creek Near Sheridan, WY | NO | 1929-current | No winter records after 1971; Adjusted for diversions using PK Ditch & Sheridan City Intake Ditch | |
| 06302200 | Big Goose Creek Above Park Creek Near Sheridan, WY | NO | 1999-current | Jul. - Sep. 1999 | |
| 06302500 | Goose Creek at Sheridan, WY | NO | 1909-1916 | No winter records | |
| 06303000 | Willow Creek Near Big Horn, WY | NO | 1954-1955 | ||
| 06303500 | Little Goose Creek in Canyon Near Big Horn, WY | NO | 1941-current | No winter records after 1971 | |
| 06303700 | Little Goose Creek Above Davis Creek Near Big Horn, WY | NO | 1999-current | Jul. - Sep. 1999 | |
| 06304000 | Little Goose Creek Near Big Horn, WY | NO | 1919-1922 | No winter records 1919 | |
| 06304500 | Little Goose Creek at Sheridan, WY | NO | 1896-1897, 1911-1913 | No winter records | |
| 06305000 | Goose Creek Below Little Goose Creek at Sheridan, WY | NO | 1896-1897 | No winter records | |
| 06305500 | Goose Creek Below Sheridan, WY | NO | 1942-1984 | ||
| 06305700 | Goose Creek Near Acme, WY | NO | 1984-current | ||
| 06306000 | Tongue River Near Acme, WY | NO | 1939-1957 | ||
| 06306100 | Squirrel Creek Near Decker, MT | NO | 1975-1986 | Abt. 3.5 mi. into MT | |
| 06306250 | Prairie Dog Creek Near Acme, WY | NO | WRDS: 1965-1970; USGS: 1971- 1980; SEO: 1981-1999 |
State data seasonal only | |
| 06306300 | Tongue River at State Line Near Decker, MT | NO | 1960-current | ||
| Powder | 06309200 | Middle Fork Powder River Near Barnum, WY | YES | 1961-current | |
| 06309260 | Buffalo Creek Above North Fork Buffalo Creek Near Arminto, WY | YES | 1975-1979 | ||
| 06309270 | North Fork Buffalo Creek Near Arminto, WY | YES | 1975-1979 | ||
| 06309280 | Buffalo Creek Below North Fork Buffalo Creek Near Arminto, WY | YES | 1975-1979 | ||
| 06309450 | Beaver Creek Below Bayer Creek Near Barnum, WY | YES | 1975-1989 | ||
| 06309460 | Beaver Creek Above White Panther Ditch Near Barnum, WY | YES | 1975-1989 | ||
| 06309500 | Middle Fork Powder River Above Kaycee, WY | NO | 1949-1970, 1984-1992 | ||
| 06310000 | Red Fork Powder River Near Barnum, WY | NO | 1929-1932, 1950-1954 | ||
| 06310500 | Middle Fork Powder River at Kaycee, WY | NO | 1911-1913, 1929-1932 | ||
| 06311000 | North Fork Powder River Near Hazelton, WY | YES | 1946-current | ||
| 06311060 | North Fork Powder River Below Bull Creek Near Hazelton, WY | YES | 1975-1992 | ||
| 06311400 | North Fork Powder River Below Pass Creek Near Mayoworth, WY | NO | 1974-current | ||
| 06311500 | North Fork Powder River Near Mayoworth, WY | NO | 1941-1973 | ||
| 06312000 | North Fork Powder River Near Kaycee, WY | NO | 1911-1912, 1929-1932 | ||
| 06312500 | Powder River Near Kaycee, WY | NO | 1934-1935, 1938-1971, 1979-1980 | ||
| 06313000 | South Fork Powder River Near Kaycee, WY | NO | 1911-1912, 1938-1940, 1950- 1969, 1979-1980, 1983-1984 |
||
| 06313180 | Dugout Creek Tributary Near Midwest, WY | YES | 1975-1983 | ||
| 06313400 | Salt Creek Near Sussex, WY | NO | 1976-1981, 1983-1993 | ||
| 06313500 | Powder River at Sussex, WY | NO | 1938-1940, 1950-1957, 1978-1999 | ||
| 06313700 | Dead Horse Creek Near Buffalo, WY | NO | 1972-1990 | ||
| 06313950 | North Fork Crazy Woman Creek Below Pole Creek Near Buffalo, WY | YES | 1974-1984 | ||
| 06314000 | North Fork Crazy Woman Creek Near Buffalo, WY | YES | 1942-1949, 1974-1984 | ||
| 06314500 | North Fork Crazy Woman Creek Below Spring Draw Near Buffalo, WY | YES | 1949-1972 | ||
| 06315000 | North Fork Crazy Woman Near Greub, WY | NO | 1950-1968 | ||
| 06315480 | Poison Creek Below Tetley Spring Near Mayoworth, WY | YES | 1975-1976 | ||
| 06315490 | Poison Creek Near Mayoworth, WY | YES | 1975-1976 | ||
| 06315500 | Middle Fork Crazy Woman Creek Near Greub, WY | YES | 1942-1972 | No winter records 1972 | |
| 06316000 | Crazy Woman Creek Near Buffalo, WY | NO | 1929-1932 | No winter records some years | |
| SEO Gage | Crazy Woman Creek at Trabing Bridge Near Buffalo, WY | NO | SEO: 1982-current | Seasonal data only | |
| 06316400 | Crazy Woman Creek at Upper Station Near Arvada, WY | NO | 1963-1970, 1978-1981 | ||
| 06316500 | Crazy Woman Creek Near Arvada, WY | NO | 1940-1944, 1950-1964 | ||
| 06317000 | Powder River at Arvada, WY | NO | 1919-current | No winter records 1919-1930, 1934 | |
| 06317100 | Powder River Near Arvada, WY | NO | 1915-1919 | No winter records | |
| 06317300 | Sourdough Creek Near Buffalo, WY | YES | 1985-1990 | ||
| 06317340 | Little Sourdough Creek Near Buffalo, WY | YES | 1985-1988 | ||
| 06317500 | North Fork Clear Creek Near Buffalo, WY | NO | 1950-1968 | ||
| 06318500 | Clear Creek Near Buffalo, WY | NO | 1894, 1896, 1897-1900, 1917-1928, 1938-1992 |
Records after Oct. 1987 not equivalent due to diversion by City of Buffalo; Adjusted for diversions using 100 acres of irrigated lands upstream and 6 cfs diversion by Buffalo | |
| SEO Gage | Clear Creek in Buffalo City Park Buffalo, WY | NO | WRDS: 1971-1978; SEO: 1987-1999 |
Seasonal data only | |
| 06319000 | Clear Creek at Buffalo, WY | NO | 1903-1905, 1911-1912 | No winter records | |
| 06319470 | South Rock Creek at Forest Boundary Near Buffalo, WY | YES | 1975-1976 | ||
| 06319480 | South Rock Creek Above Red Canyon Near Buffalo, WY | YES | 1975-1976 | ||
| 06319500 | South Fork Rock Creek Near Buffalo, WY | NO | 1941-1943, 1950-1954 | No winter records 1941-1943 | |
| 06320000 | Rock Creek Near Buffalo, WY | NO | 1941-current | No winter records after 1971; Adjusted for irrigation using Mowry Basin Ditch | |
| SEO Gage | Rock Creek at Mouth Near Buffalo, WY | NO | WRDS: 1971-1975, 1977-1978; SEO: 1980-1981, 1983, 1985-1988, 1990-1999 |
Seasonal data only | |
| 06320200 | Clear Creek Below Rock Creek Near Buffalo, WY | NO | USGS: 1976-1981; SEO: 1982-1985, 1987-1999 |
State data mostly seasonal | |
| 06320400 | Clear Creek at Ucross, WY | NO | 1976-1981 | ||
| SEO Gage | Clear Creek Below Healy Reservoir Near Buffalo, WY | NO | 1977-1999 | State data mostly seasonal | |
| 06320500 | South Piney Creek at Willow Park Reservoir, WY | NO | 1945-1957, 1960-current | No winter records before 1948 and after 1971 | |
| 06321000 | South Piney Creek Near Story, WY | NO | 1951-1980 | No winter records 1972-1974 | |
| 06321100 | South Piney Creek Below Mead-Coffeen Ditch Near Story, WY | NO | 1975-1979 | ||
| 06321500 | North Piney Creek Near Story, WY | YES | 1951-1982 | ||
| 06321800 | Spring Creek Near Story, WY | NO | 1975-1979 | ||
| 06323000 | Piney Creek at Kearney, WY | NO | 1902-1906, 1910-1917, 1919-1923, 1941-current |
No winter records some years | |
| SEO Gage | Little Piney Creek, WY | NO | SEO: 1981, 1983, 1985- 1986, 1988, 1991-1999 |
Seasonal data only; from spot measurements | |
| SEO Gage | Piney Creek Below Lake DeSmet Tunnel Intake Near Story, WY | NO | WRDS: 1971-1973, 1977, 1979; SEO: 1980-1984, 1986-1996 |
Mostly seasonal data | |
| 06323500 | Piney Creek at Ucross, WY | NO | USGS: 1917-1923, 1980-1982; SEO: 1983-1987, 1989-1998 |
No winter records 1917-1923; State data seasonal only | |
| SEO Gage | Clear Creek at Double Crossing Near Clearmont, WY | NO | WRDS: 1973-1978; SEO: 1980-1996, 1998-1999 |
Seasonal data only | |
| SEO Gage | Clear Creek Below P&F#3 Ditch Near Clearmont, WY | NO | WRDS: 1978; SEO: 1980-1999 | Seasonal data only | |
| 06324000 | Clear Creek Near Arvada, WY | NO | 1915-1919, 1928-1929, 1940-1982 | No winter records before 1929 | |
| 06324500 | Powder River at Moorhead, MT | NO | 1929-1972, 1975-current | Abt. 4 mi. into MT | |
| Little Powder | 06324890 | Little Powder River Below Corral Creek Near Weston, WY | NO | 1978-1981 | |
| 06324925 | Little Powder River Near Weston, WY | NO | 1977-1981 | ||
| 06324970 | Little Powder River Above Dry Creek Near Weston, WY | NO | 1973-current | ||
| Belle Fourche |
06426500 | Belle Fourche River Below Moorcroft, WY | NO | 1943-1970, 1976-1983, 1986-1987, 1991-current |
**Unless otherwise noted, records were obtained from the USGS.
Figure III-5
Cumulative Surplus/Deficit of Annual Historic Flows -
Tongue River Near Dayton, WY (Station 06298000) - 1941 to 1999
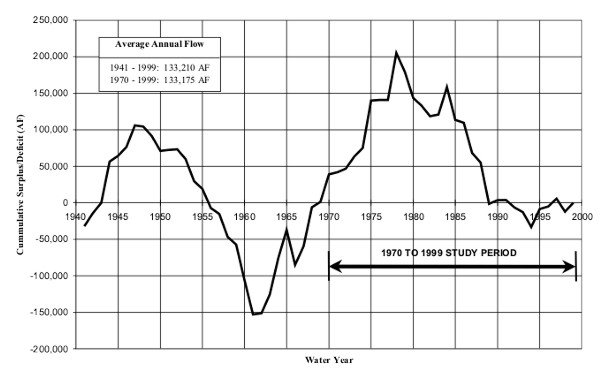
the 1947 to 1999 average annual flow for the three stations (1% to 4% wetter). This period also includes a variety of wet, normal, and dry years at all three locations.
In summary, the period 1970 through 1999 contains extended periods of dry years including some of the driest years of record as well as periods of normal and wet hydrologic conditions throughout the planning area. This period also has the greatest abundance of recorded streamflow data and ditch diversion data and therefore requires less data synthesis. A study period of 1970 through 1999 was therefore selected as appropriate for purposes of water availability modeling for the Powder/Tongue River Basin Plan.
A more detailed discussion and supporting documentation for the selection of the study period are provided in the .Surface Water Hydrology. technical memorandum.
Data Extension
The spreadsheet modeling approach used for the Basin Plan relies on both records of natural flow as well as records from stations impacted by upstream diversions or regulation. Natural flow is supplied to the model, where available, at the headwater nodes and non-natural flow records at downstream gaging stations are used to calibrate the model to historic conditions. Monthly streamflows must therefore be estimated for both categories of gaging stations for those months, during the study period, with no recorded streamflow data.
The monthly record extension approach used in this study follows the procedure used by the USGS in recent studies. This mixed-station procedure uses the best base station from among all available base stations to fill in each month of missing data for a given gage. The base station producing the smallest standard error of prediction is used for each particular month. The technique used to estimate missing values was developed by Hirsch and is referred to as MOVE.1 (Maintenance of Variance Extension, Type 1). This technique offers the advantage over ordinary least-squares regression of preserving the variance of the unextended records. This procedure was carried out using a computer program developed by the USGS.
The USGS and SEO streamflow stations are first divided into natural flow stations and non- natural flow stations. The stations are then further divided into hydrologically similar groups with each group having at least one gage with sufficient data to develop relationships based on concurrent streamflow for the entire study period. The monthly flow extension procedure is performed for each of these groupings of monthly streamflow data. There is a certain amount of overlap in hydrologic similarity among the various groupings. Some streamflow stations are therefore included in multiple groups. Records from the long-term natural flow stations are also included with some of the non-natural flow groupings where appropriate to provide adequate data for extending the records through the entire study period.
Regression of hydrologic data resulting in a coefficient of determination (R2) greater than 0.7 is typically considered strong enough for data estimating. This criterion was used in evaluating the results of the regression analyses performed for this study. The coefficient of determination is defined as the proportion of variation in the independent variable that can be explained by variation in the dependent variable. The higher the value of R2, the stronger the relationship between the two variables. A perfect relationship would have an R2 equal to 1.0. In some instances no significant correlation (R2 less than 0.7) could be found using concurrent monthly streamflows between any base station and the short record station. Annual flow regression rather than monthly flow regression was performed in these instances to fill-in the missing streamflow data. In a few cases, no significant correlation (R2 less than 0.7) could be found using the annual flow regression either. These stations were dropped from the study. The monthly streamflows for the years of missing data were estimated by applying the average monthly distribution for the period of recorded streamflow to the estimated total annual flow.
The average monthly and annual streamflows for the 1970 to 1999 study period, for the natural flow streamflow stations and the non-natural flow streamflow stations are summarized in Table III-2 and Table III-3 respectively.
Table III-2
Summary of Average Monthly and Annual Flows (1970 to 1999) - Natural Flow Stations
| Basin | Station Number | Station Name | Average Streamflow for 1970-1999 in Acre-Feet | ||||||||||||
| Oct | Nov | Dec | Jan | Feb | Mar | Apr | May | Jun | Jul | Aug | Sep | Annual | |||
| Little Bighorn | |||||||||||||||
| 06288600 | Little Bighorn River Below Dayton Gulch Near Burgess Junction, WY | 414 | 301 | 268 | 238 | 195 | 215 | 358 | 3,600 | 6,008 | 1,685 | 779 | 463 | 14,524 | |
| 06288700 | Dry Fork Little Bighorn Below Lick Creek Near Burgess Junction, WY | 1,855 | 1,599 | 1,498 | 1,383 | 1,223 | 1,326 | 1,709 | 6,248 | 9,433 | 4,505 | 2,644 | 2,029 | 35,452 | |
| 06288960 | Little Bighorn River Near Parkman, WY | 4,011 | 3,353 | 3,098 | 2,864 | 2,479 | 2,777 | 3,771 | 17,119 | 27,107 | 11,347 | 6,045 | 4,433 | 88,404 | |
| 06288975 | Elkhorn Creek Above Fuller Ranch Ditch Near Parkman, WY | 114 | 100 | 92 | 86 | 75 | 88 | 141 | 486 | 618 | 202 | 135 | 124 | 2,261 | |
| 06288990 | West Fork Little Bighorn River Near Parkman, WY | 939 | 794 | 734 | 672 | 593 | 671 | 896 | 3,868 | 5,800 | 2,421 | 1,355 | 1,040 | 19,783 | |
| 06289000 | Little Bighorn River at State Line Near Wyola, MT | 5,420 | 4,574 | 4,258 | 3,958 | 3,479 | 3,880 | 5,154 | 21,093 | 32,321 | 14,270 | 7,920 | 5,957 | 112,266 | |
| 06289100 | Red Canyon Creek Near Parkman, WY | 35 | 32 | 26 | 28 | 23 | 42 | 216 | 561 | 242 | 65 | 32 | 28 | 1,330 | |
| 06289800 | East Pass Creek Near Parkman, WY | 469 | 389 | 366 | 338 | 303 | 328 | 547 | 1,899 | 2,298 | 1,062 | 638 | 508 | 9,145 | |
| 06291200 | Lodge Grass Creek at State Line Near Wyola, MT | 464 | 352 | 316 | 288 | 242 | 271 | 558 | 3,619 | 5,268 | 1,760 | 780 | 531 | 14,449 | |
| Tongue | |||||||||||||||
| 06297000 | South Fork Tongue River Near Dayton, WY | 1,424 | 1,033 | 942 | 803 | 652 | 741 | 1,839 | 14,823 | 22,367 | 6,444 | 2,527 | 1,656 | 55,251 | |
| 06297480 | Tongue River at Tongue Canyon Campground Near Dayton, WY | 5,064 | 3,935 | 3,623 | 3,295 | 2,824 | 3,107 | 6,129 | 31,109 | 42,528 | 15,621 | 7,855 | 5,653 | 130,743 | |
| 06298000 | Tongue River Near Dayton, WY | 5,130 | 3,954 | 3,642 | 3,315 | 2,825 | 3,117 | 6,186 | 31,983 | 43,180 | 16,162 | 7,951 | 5,730 | 133,175 | |
| 06298480 | Little Tongue River at Steamboat Point Near Dayton, WY | 134 | 94 | 83 | 72 | 58 | 69 | 249 | 2,165 | 3,088 | 726 | 274 | 167 | 7,179 | |
| 06298490 | Little Tongue River Above South Fork Little Tongue River Near Dayton, WY | 98 | 67 | 58 | 50 | 40 | 46 | 139 | 1,641 | 2,643 | 591 | 200 | 118 | 5,691 | |
| 06298500 | Little Tongue River Near Dayton, WY | 225 | 158 | 139 | 124 | 105 | 118 | 402 | 3,299 | 4,503 | 1,144 | 427 | 268 | 10,912 | |
| 06299480 | Wolf Creek Below Alden Creek Near Wolf, WY | 471 | 341 | 304 | 267 | 219 | 255 | 784 | 6,063 | 8,521 | 2,214 | 855 | 537 | 20,831 | |
| 06299490 | Wolf Creek Above Red Canyon Creek at Wolf, WY | 536 | 404 | 364 | 329 | 276 | 308 | 784 | 5,804 | 8,126 | 2,169 | 849 | 540 | 20,489 | |
| 06299500 | Wolf Creek at Wolf, WY | 539 | 399 | 356 | 317 | 271 | 298 | 854 | 5,767 | 7,980 | 2,237 | 926 | 603 | 20,547 | |
| 06300500 | East Fork Big Goose Creek Near Big Horn, WY | 426 | 284 | 220 | 204 | 154 | 171 | 557 | 5,296 | 10,978 | 3,740 | 1,096 | 698 | 23,824 | |
| 06301480 | Coney Creek Above Twin Lakes Near Big Horn, WY | 30 | 18 | 14 | 10 | 8 | 9 | 49 | 1,091 | 1,781 | 534 | 83 | 48 | 3,675 | |
| Powder | 06309200 | Middle Fork Powder River Near Barnum, WY | 457 | 416 | 370 | 331 | 295 | 424 | 2,125 | 9,807 | 5,212 | 1,061 | 527 | 433 | 21,457 |
| 06309260 | Buffalo Creek Above North Fork Buffalo Creek Near Arminto, WY | 31 | 28 | 23 | 20 | 17 | 28 | 218 | 1,350 | 649 | 101 | 38 | 28 | 2,531 | |
| 06309270 | North Fork Buffalo Creek Near Arminto, WY | 86 | 79 | 70 | 62 | 55 | 79 | 370 | 1,639 | 915 | 200 | 103 | 84 | 3,742 | |
| 06309280 | Buffalo Creek Below North Fork Buffalo Creek Near Arminto, WY | 0 | 0 | 0 | 0 | 0 | 0 | 34 | 1,918 | 950 | 51 | 2 | 1 | 2,956 | |
| 06309450 | Beaver Creek Below Bayer Creek Near Barnum, WY | 185 | 166 | 143 | 126 | 111 | 156 | 519 | 1,787 | 1,141 | 429 | 247 | 192 | 5,202 | |
| 06309460 | Beaver Creek Above White Panther Ditch Near Barnum, WY | 612 | 568 | 546 | 518 | 476 | 561 | 997 | 2,211 | 1,674 | 911 | 695 | 610 | 10,379 | |
| 06311000 | North Fork Powder River Near Hazelton, WY | 294 | 220 | 180 | 144 | 120 | 142 | 603 | 3,864 | 4,037 | 1,111 | 471 | 325 | 11,511 | |
| 06313950 | North Fork Crazy Woman Creek Below Pole Creek Near Buffalo, WY | 629 | 474 | 387 | 307 | 257 | 301 | 1,142 | 5,582 | 5,774 | 1,983 | 918 | 645 | 18,399 | |
| 06314000 | North Fork Crazy Woman Creek Near Buffalo, WY | 640 | 481 | 395 | 316 | 265 | 307 | 1,152 | 5,490 | 5,637 | 1,987 | 924 | 655 | 18,249 | |
| 06314500 | North Fork Crazy Woman Creek Below Spring Draw Near Buffalo, WY | 558 | 412 | 337 | 264 | 217 | 269 | 1,184 | 7,726 | 8,139 | 2,222 | 917 | 624 | 22,869 | |
| 06315480 | Poison Creek Below Tetley Spring Near Mayoworth, WY | 214 | 175 | 150 | 127 | 112 | 126 | 346 | 1,172 | 1,155 | 490 | 279 | 218 | 4,564 | |
| 06315490 | Poison Creek Near Mayoworth, WY | 246 | 202 | 176 | 150 | 132 | 151 | 387 | 1,232 | 1,220 | 542 | 320 | 251 | 5,009 | |
| 06315500 | Middle Fork Crazy Woman Creek Near Greub, WY | 707 | 551 | 470 | 391 | 334 | 411 | 1,290 | 5,891 | 6,016 | 2,072 | 1,031 | 759 | 19,923 | |
| 06317300 | Sourdough Creek Near Buffalo, WY | 70 | 52 | 44 | 34 | 28 | 34 | 107 | 775 | 905 | 265 | 112 | 78 | 2,504 | |
| 06317340 | Little Sourdough Creek Near Buffalo, WY | 37 | 22 | 7 | 3 | 2 | 5 | 206 | 214 | 139 | 36 | 16 | 25 | 712 | |
| 06319470 | South Rock Creek at Forest Boundary Near Buffalo, WY | 447 | 341 | 280 | 227 | 187 | 217 | 900 | 5,431 | 5,744 | 1,722 | 714 | 491 | 16,701 | |
| 06319480 | South Rock Creek Above Red Canyon Near Buffalo, WY | 426 | 325 | 264 | 213 | 177 | 205 | 870 | 5,367 | 5,703 | 1,675 | 689 | 471 | 16,385 | |
| 06319500 | South Fork Rock Creek Near Buffalo, WY | 800 | 626 | 511 | 423 | 354 | 439 | 1,817 | 10,506 | 10,318 | 2,733 | 1,139 | 842 | 30,508 | |
Table III-3
Summary of Average Monthly and Annual Flows (1970 to 1999) - Non-Natural Flow Stations
| Basin | Station Number | Station Name | Average Streamflow for 1970-1999 in Acre-Feet | ||||||||||||
| Oct | Nov | Dec | Jan | Feb | Mar | Apr | May | Jun | Jul | Aug | Sep | Annual | |||
| Little Bighorn | |||||||||||||||
| 06289600 | West Pass Creek Near Parkman, WY | 522 | 476 | 441 | 419 | 407 | 497 | 770 | 2,023 | 2,007 | 810 | 488 | 495 | 9,355 | |
| 06289820 | East Pass Creek Near Dayton, WY | 621 | 575 | 543 | 531 | 519 | 629 | 958 | 2,666 | 2,800 | 905 | 469 | 530 | 11,746 | |
| 06289870 | Twin Creek Near Parkman, WY | 108 | 92 | 119 | 328 | 236 | 741 | 847 | 1,656 | 349 | 154 | 115 | 87 | 4,833 | |
| Tongue | |||||||||||||||
| 06302000 | Big Goose Creek Near Sheridan, WY | 2,307 | 1,727 | 1,576 | 1,427 | 1,199 | 1,336 | 2,247 | 13,175 | 27,034 | 8,560 | 4,642 | 3,625 | 68,855 | |
| 06303500 | Little Goose Creek in Canyon Near Big Horn, WY | 1,855 | 1,369 | 1,274 | 1,147 | 968 | 1,076 | 2,082 | 10,835 | 14,826 | 6,582 | 5,236 | 3,425 | 50,702 | |
| 06305500 | Goose Creek Below Sheridan, WY | 6,692 | 5,855 | 5,109 | 4,570 | 4,971 | 6,223 | 8,284 | 26,807 | 40,099 | 10,115 | 4,047 | 5,595 | 128,367 | |
| 06305700 | Goose Creek Near Acme, WY | 6,848 | 5,984 | 5,215 | 4,660 | 5,076 | 6,364 | 8,494 | 27,713 | 41,776 | 10,431 | 4,120 | 5,725 | 132,406 | |
| 06306250 | Prairie Dog Creek Near Acme, WY | 2,785 | 2,192 | 1,835 | 1,286 | 2,567 | 5,705 | 2,784 | 3,701 | 2,327 | 1,416 | 1,730 | 2,350 | 30,678 | |
| 06306300 | Tongue River at State Line Near Decker, MT | 16,187 | 13,719 | 11,317 | 11,134 | 13,110 | 19,427 | 21,867 | 73,969 | 98,409 | 29,613 | 11,756 | 13,340 | 333,850 | |
| Powder | |||||||||||||||
| 06309500 | Middle Fork Powder River Above Kaycee, WY | 2,812 | 2,642 | 2,490 | 2,387 | 2,235 | 2,693 | 5,676 | 14,882 | 9,586 | 3,978 | 2,759 | 2,581 | 54,721 | |
| 06311060 | North Fork Powder River Below Bull Creek Near Hazelton, WY | 240 | 169 | 159 | 129 | 119 | 143 | 367 | 3,188 | 4,121 | 2,014 | 1,524 | 1,028 | 13,202 | |
| 06311400 | North Fork Powder River Below Pass Creek Near Mayoworth, WY | 1,326 | 1,138 | 1,139 | 1,110 | 994 | 1,089 | 1,613 | 4,891 | 5,510 | 2,835 | 2,410 | 1,917 | 25,972 | |
| 06312500 | Powder River Near Kaycee, WY | 5,062 | 6,385 | 6,481 | 5,606 | 6,441 | 8,416 | 8,944 | 27,066 | 15,875 | 1,006 | 888 | 1,783 | 93,950 | |
| 06313000 | South Fork Powder River Near Kaycee, WY | 172 | 237 | 163 | 190 | 1,350 | 7,672 | 5,987 | 9,131 | 2,072 | 602 | 1,729 | 11 | 29,316 | |
| 06313400 | Salt Creek Near Sussex, WY | 2,257 | 1,820 | 1,706 | 1,849 | 2,577 | 4,243 | 3,003 | 5,395 | 4,120 | 3,062 | 1,940 | 1,853 | 33,825 | |
| 06313500 | Powder River at Sussex, WY | 10,088 | 8,646 | 7,430 | 7,200 | 10,592 | 17,746 | 17,475 | 38,478 | 26,121 | 9,211 | 4,476 | 4,899 | 162,362 | |
| SEO Gage | Crazy Woman Creek at Trabing Bridge Near Buffalo, WY | 329 | 223 | 218 | 196 | 150 | 189 | 1,697 | 8,924 | 13,287 | 3,211 | 1,242 | 978 | 30,644 | |
| 06316400 | Crazy Woman Creek at Upper Station Near Arvada, WY | 1,688 | 1,356 | 1,036 | 885 | 1,627 | 2,517 | 3,386 | 9,747 | 8,975 | 2,196 | 1,151 | 769 | 35,333 | |
| 06317000 | Powder River at Arvada, WY | 11,144 | 9,646 | 7,235 | 6,773 | 11,517 | 23,619 | 21,176 | 52,067 | 42,800 | 14,235 | 6,162 | 5,400 | 211,773 | |
| 06318500 | Clear Creek Near Buffalo, WY | 2,253 | 1,583 | 1,220 | 909 | 759 | 1,009 | 2,710 | 12,305 | 17,834 | 8,639 | 3,929 | 2,749 | 55,899 | |
| SEO Gage | Clear Creek in Buffalo City Park Buffalo, WY | 1,886 | 1,397 | 1,138 | 947 | 1,277 | 1,972 | 2,407 | 9,746 | 14,070 | 4,659 | 1,414 | 1,254 | 42,167 | |
| 06320000 | Rock Creek Near Buffalo, WY | 894 | 653 | 587 | 525 | 437 | 490 | 993 | 7,108 | 9,142 | 3,800 | 2,729 | 1,558 | 28,916 | |
| SEO Gage | Rock Creek at Mouth Near Buffalo, WY | 1,572 | 1,322 | 1,026 | 927 | 1,272 | 2,245 | 1,360 | 5,460 | 7,121 | 1,755 | 929 | 918 | 25,907 | |
| 06320200 | Clear Creek Below Rock Creek Near Buffalo, WY | 3,672 | 3,132 | 2,571 | 2,386 | 2,774 | 4,084 | 5,349 | 17,212 | 23,059 | 7,586 | 3,034 | 3,074 | 77,933 | |
| SEO Gage | Clear Creek Below Healy Reservoir Near Buffalo, WY | 2,601 | 1,730 | 1,299 | 1,079 | 1,454 | 2,483 | 3,739 | 14,926 | 20,747 | 7,964 | 3,380 | 2,772 | 64,174 | |
| 06321000 | South Piney Creek Near Story, WY | 2,068 | 1,539 | 1,514 | 1,257 | 961 | 1,032 | 1,555 | 5,964 | 20,205 | 12,621 | 9,042 | 5,535 | 63,293 | |
| 06323000 | Piney Creek at Kearney, WY | 1,886 | 2,307 | 2,059 | 1,875 | 1,607 | 2,038 | 4,072 | 15,796 | 23,765 | 6,122 | 2,061 | 1,265 | 64,853 | |
| SEO Gage | Little Piney Creek, WY | 784 | 751 | 591 | 583 | 709 | 964 | 945 | 1,620 | 1,489 | 881 | 602 | 689 | 10,608 | |
| SEO Gage | Piney Creek Below Lake DeSmet Tunnel Intake Near Story, WY | 1,524 | 1,056 | 741 | 664 | 613 | 864 | 1,953 | 10,657 | 20,258 | 5,591 | 2,118 | 1,431 | 47,470 | |
| 06323500 | Piney Creek at Ucross, WY | 3,450 | 3,413 | 2,641 | 2,362 | 1,632 | 2,969 | 3,928 | 12,580 | 20,834 | 7,887 | 5,206 | 3,718 | 70,620 | |
| SEO Gage | Clear Creek at Double Crossing Near Clearmont, WY | 8,484 | 7,580 | 6,042 | 5,208 | 5,866 | 9,456 | 9,217 | 27,303 | 42,211 | 14,623 | 7,589 | 6,807 | 150,386 | |
| SEO Gage | Clear Creek Below P&F#3 Ditch Near Clearmont, WY | 6,464 | 5,750 | 3,619 | 3,474 | 5,276 | 9,697 | 8,968 | 24,292 | 38,482 | 10,460 | 4,558 | 4,444 | 125,484 | |
| 06324000 | Clear Creek Near Arvada, WY | 7,050 | 6,494 | 4,356 | 4,151 | 5,773 | 9,919 | 10,332 | 25,700 | 38,174 | 11,742 | 5,498 | 5,462 | 134,651 | |
| 06324500 | Powder River at Moorhead, MT | 18,021 | 16,072 | 10,330 | 10,928 | 18,963 | 36,118 | 29,810 | 73,536 | 79,314 | 27,131 | 11,758 | 10,494 | 342,475 | |
| Little Powder | 06324890 | Little Powder River Below Corral Creek Near Weston, WY | 8 | 16 | 23 | 57 | 182 | 1,022 | 138 | 1,239 | 103 | 267 | 38 | 0 | 3,093 |
| 06324925 | Little Powder River Near Weston, WY | 637 | 128 | 74 | 360 | 2,640 | 4,275 | 1,982 | 3,093 | 1,600 | 463 | 275 | 161 | 15,688 | |
| 06324970 | Little Powder River Above Dry Creek Near Weston, WY | 823 | 260 | 174 | 580 | 2,501 | 4,299 | 1,602 | 4,205 | 1,992 | 748 | 404 | 284 | 17,873 | |
| Belle Fourche |
06426500 | Belle Fourche River Below Moorcroft, WY | 682 | 203 | 149 | 420 | 1,761 | 4,664 | 2,268 | 5,169 | 2,134 | 997 | 515 | 281 | 19,243 |
Supporting data and computation results for the data extension process is provided in the .Surface Water Hydrology. technical memorandum.
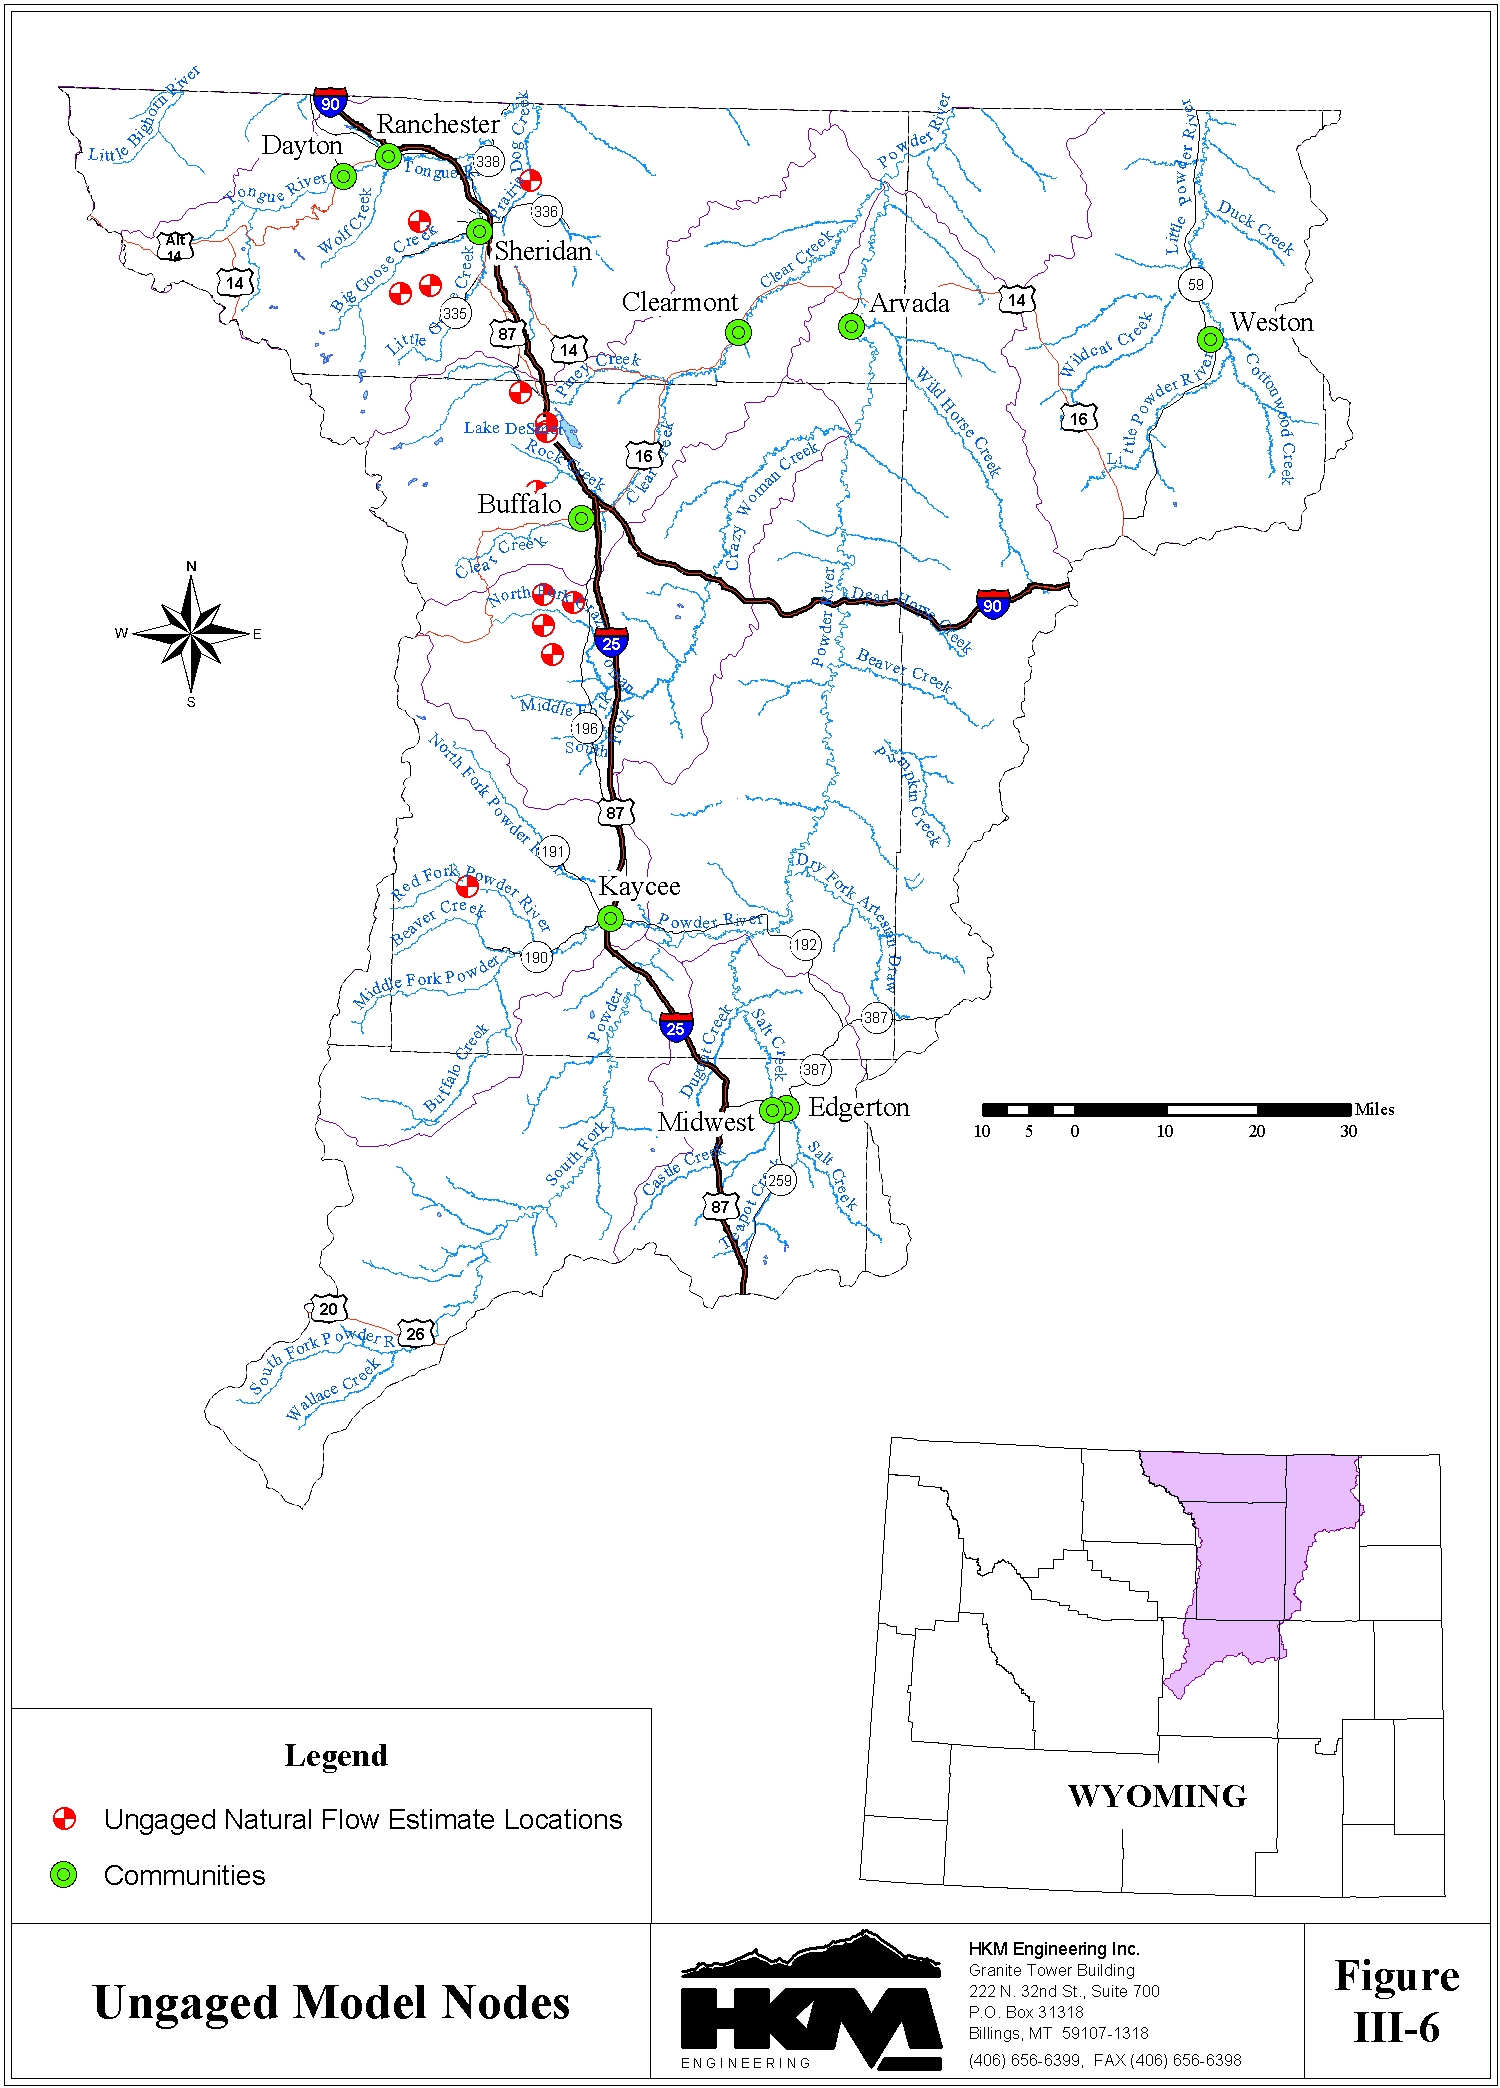
Natural Flow at Ungaged Model Nodes
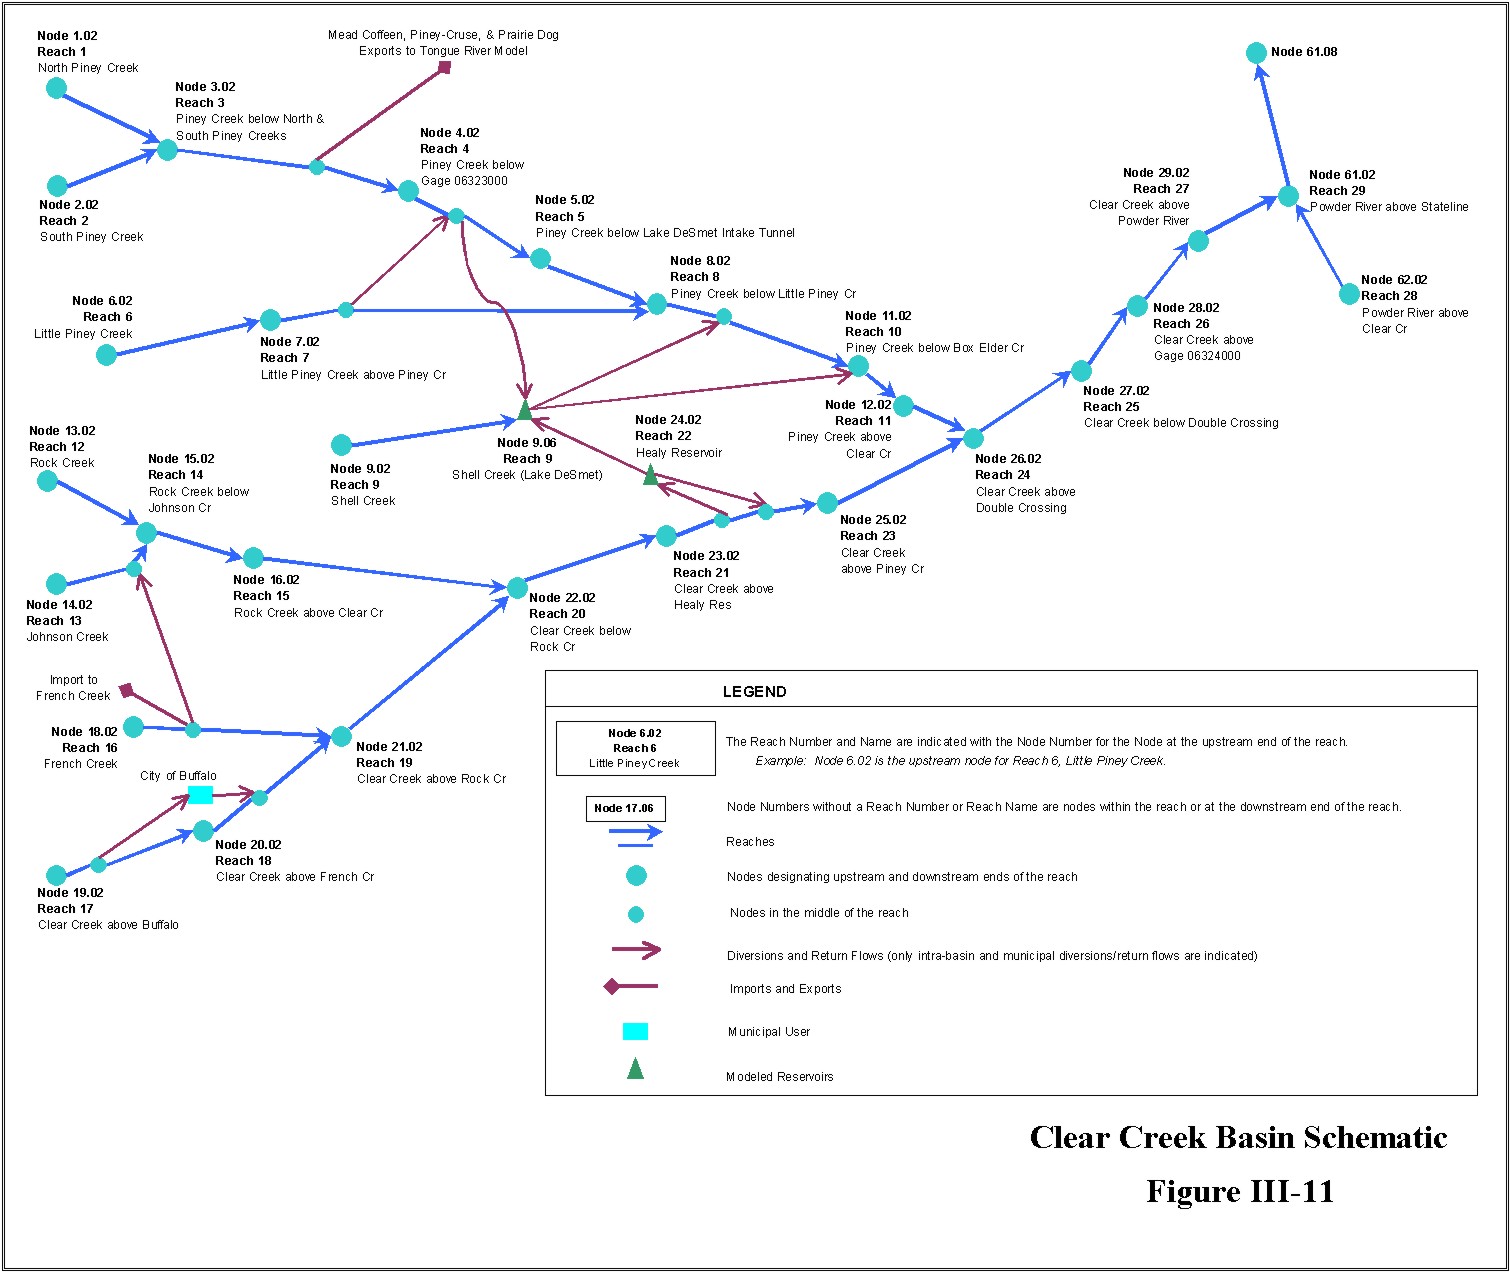
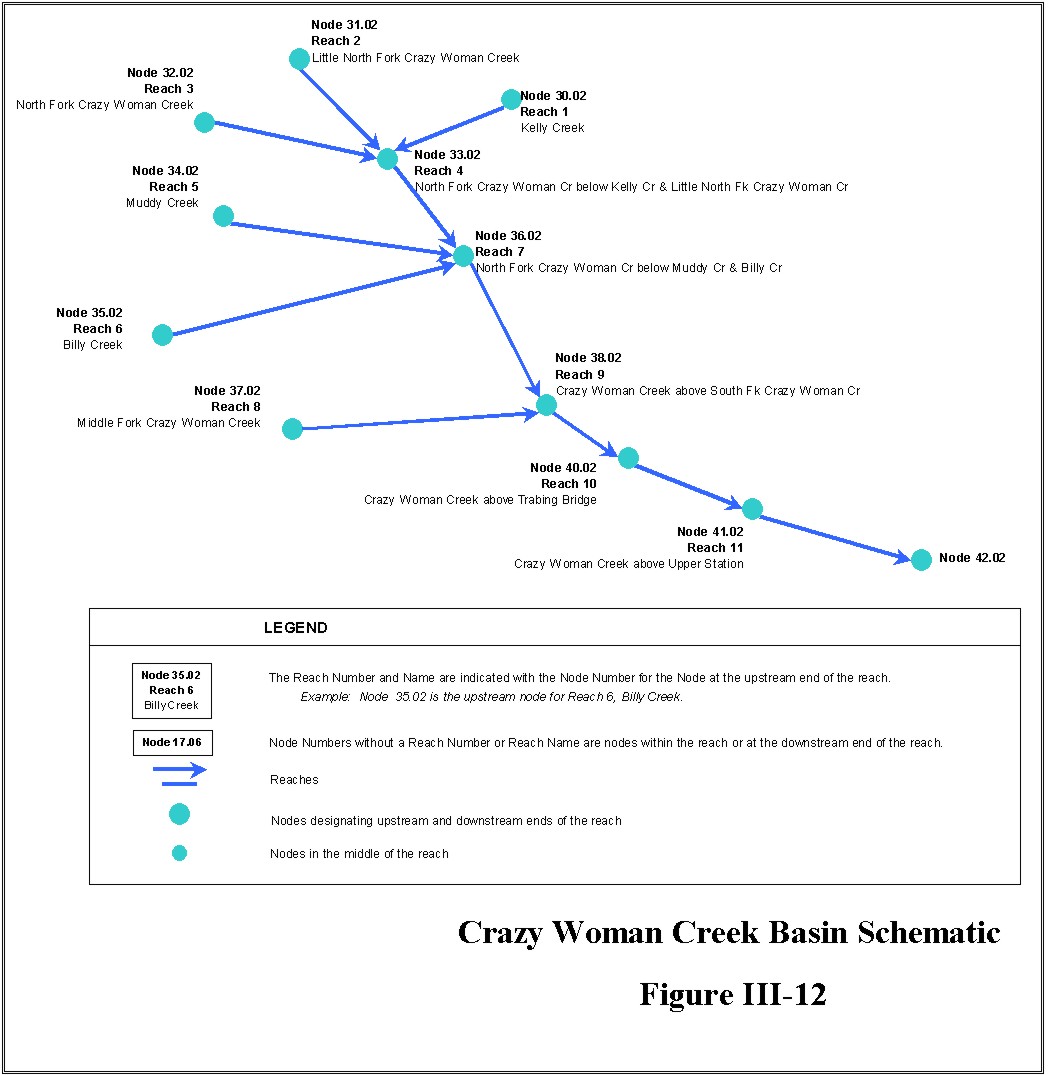
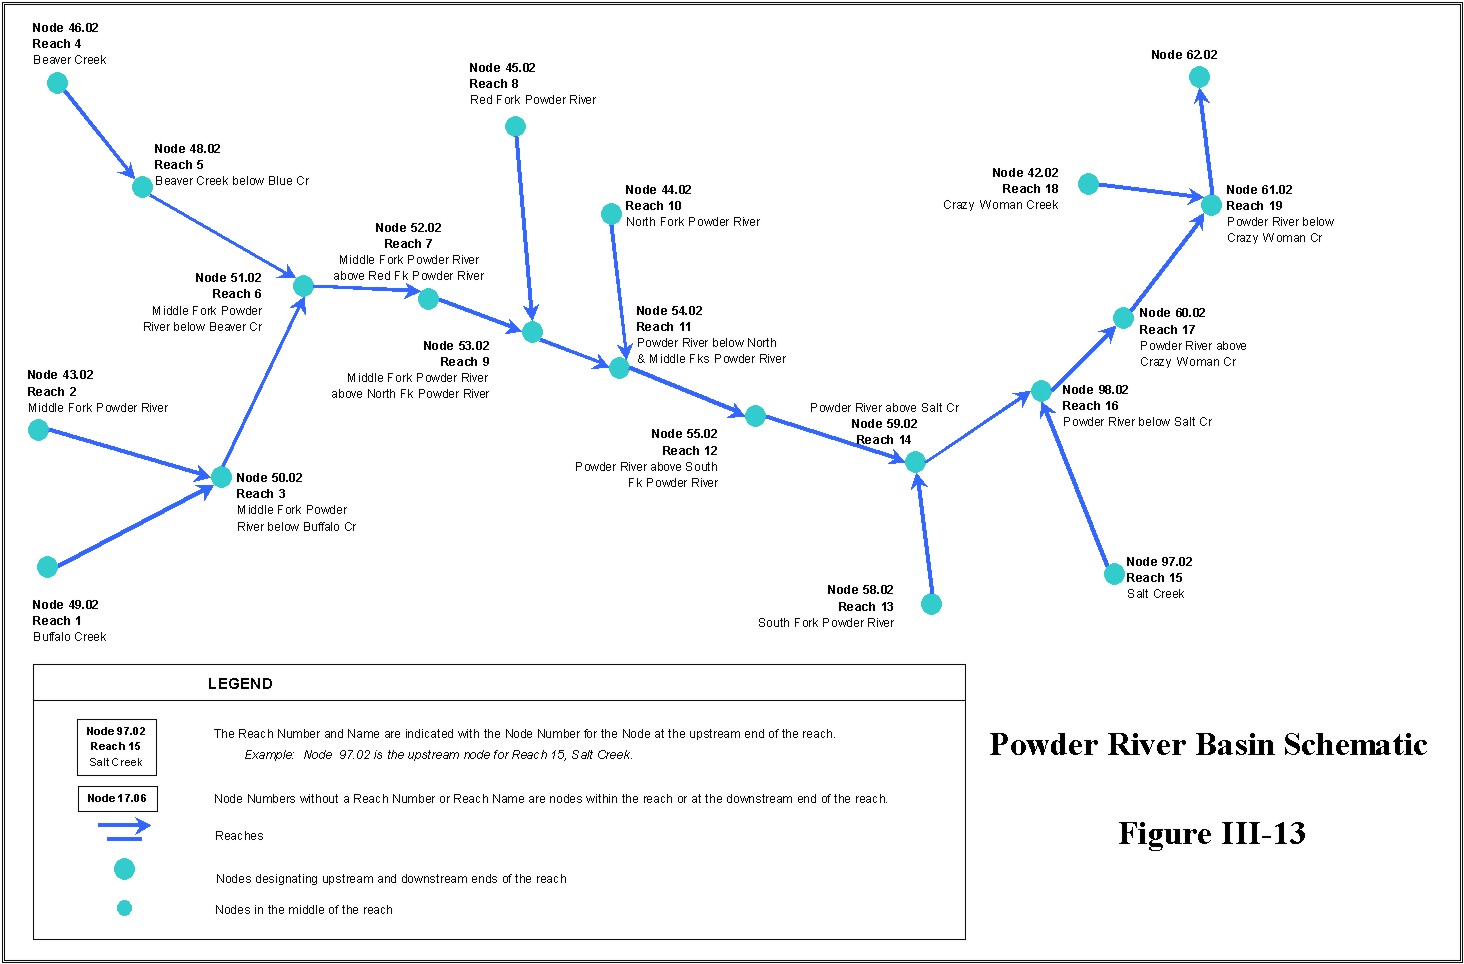
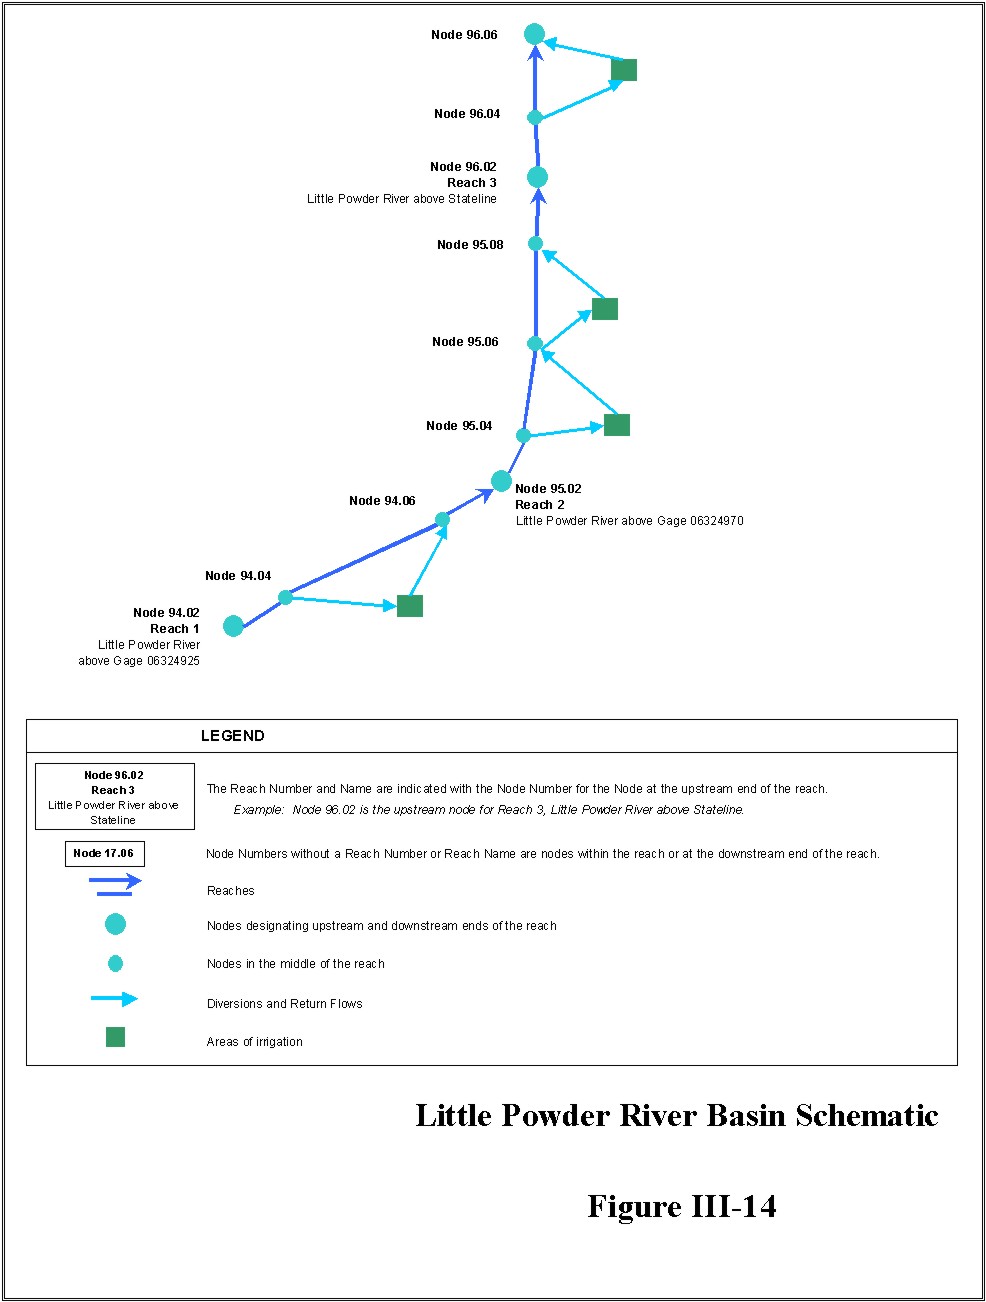
The water availability models for this Plan have been developed identifying appropriate locations of model nodes in relation to the various surface water diversion points, return flow locations, and storage reservoirs. Model nodes are located, in large part, at historic streamflow gaging stations in order to take advantage of the historic records of streamflow at these locations. Additionally, it is necessary to locate model nodes at locations with no record of streamflow, to appropriately simulate water use in the various drainages. The locations of the ungaged model nodes are shown on Figure III-6.
The following two methods were used to estimate natural flow at these locations:
The 1988 USGS report .Streamflows in Wyoming. presents regression equations, which rely on drainage area and average annual precipitation or mean basin elevation to estimate mean annual flow. The equation for the mountainous region is applicable for drainages with mean basin elevations from 5,000 to 10,800 feet. Only one ungaged model node has a mean basin elevation less than 5,000 feet (Prairie Dog Creek with a MBE of 4550). The USGS regression equation for the mountainous region was selected as the most appropriate alternative for estimating natural flow at most of the ungaged model nodes. The regression equation is as follows:
Qa = 0.0015 A1.01 (ELEV/1,000)2.88The reasonableness of the estimates of average annual flow were evaluated by comparing the estimated unit runoff (acre-feet per square mile) to the recorded unit runoff at the nearest natural flow station during the 1970 to 1999 study period. The average annual natural flow was, in some instances, adjusted based on this comparison.
Where: Qa is mean annual flow in cubic feet per second,
A is contributing drainage area in square miles, and
ELEV is mean basin elevation in feet.
In addition to average annual natural flow at the ungaged model nodes, it is necessary to generate sequential monthly flows at these sites for all years of the study period. This was accomplished by selecting a natural flow gaging station having similar hydrologic characteristics and multiplying the sequential monthly flows at the gaged location by the ratio of the ungaged average annual natural flow to the gaged average annual natural flow. The time distribution of monthly flows at the ungaged sites is, therefore, represented by the streamflow at similar gaged sites. The average monthly and annual streamflows for the 1970 to 1999 study period, for the ungaged model nodes are summarized in Table III-4. The estimated monthly natural flows for each year of the 1970 to 1999 study period are provided in the .Surface Water Hydrology. technical memorandum.
Table III-4
Summary of Average Monthly and Annual Flows (1970 to 1999) -
Ungaged Natural Flow Nodes
| Basin | Station Name | Estimated Average Streamflow for 1970-1999 in Acre-Feet | ||||||||||||
| Oct | Nov | Dec | Jan | Feb | Mar | Apr | May | Jun | Jul | Aug | Sep | Annual | ||
| Tongue | Rapid Creek Just Below Little Rapid Creek in Section 32, T55N, R85W | 98 | 73 | 65 | 58 | 49 | 54 | 156 | 1,050 | 1,453 | 407 | 169 | 110 | 3,742 |
| Beaver Creek at Bottom of Section 26, T55N, R85W | 27 | 20 | 18 | 16 | 14 | 15 | 43 | 290 | 402 | 113 | 47 | 30 | 1,034 | |
| Soldier Creek at Right Edge of Section 28, T56N, R85W | 60 | 44 | 39 | 35 | 30 | 33 | 95 | 640 | 886 | 248 | 103 | 67 | 2,281 | |
| Prairie Dog Creek Just Above Dutch Creek in Section 34, T57N, R83W | 487 | 1,314 | 3,453 | 2,229 | 3,493 | 2,296 | 1,963 | 1,560 | 1,253 | 886 | 725 | 673 | 20,3321 | |
| Powder | Red Fork Powder River Just Below North & South Forks Red Fork Powder River in Section 29, T44N, R84W | 2,706 | 2,511 | 2,415 | 2,290 | 2,104 | 2,477 | 4,405 | 9,771 | 7,396 | 4,024 | 3,071 | 2,695 | 45,866 |
| Kelly Creek at Top of Section 21, T49N, R82W | 73 | 55 | 45 | 36 | 30 | 35 | 132 | 629 | 646 | 228 | 106 | 75 | 2,092 | |
| Little North Fork Crazy Woman Creek Just Below Grossett Canyon in Section 14, T49N, R83W | 166 | 125 | 103 | 82 | 69 | 80 | 299 | 1,425 | 1,463 | 516 | 240 | 170 | 4,737 | |
| Muddy Creek at Diversion Near East Side of Section 35, T49N, R83W | 153 | 115 | 94 | 75 | 63 | 73 | 275 | 1,309 | 1,344 | 474 | 220 | 156 | 4,351 | |
| Billy Creek at Diversion to O.Malley Draw in Section 13, T48N, R83W | 96 | 79 | 69 | 59 | 52 | 59 | 151 | 481 | 477 | 212 | 125 | 98 | 1,957 | |
| Little Piney Creek Just Below Bear Gulch in Section 28, T53N, R83W | 324 | 421 | 625 | 676 | 1,295 | 1,250 | 811 | 544 | 470 | 309 | 338 | 273 | 7,3361 | |
| North & South Forks Shell Creek (Combined), at Confluence of Little North Fork Shell Creek and North Fork Shell Creek in Section 11, and Confluence of Unnamed Tributary & South Fork Shell Creek in Section 14; all in T52N, R83W | 56 | 42 | 35 | 28 | 23 | 27 | 114 | 701 | 745 | 219 | 90 | 62 | 2,141 | |
| Johnson Creek at Top of Section 22, T51N, R83W | 53 | 41 | 33 | 27 | 22 | 26 | 109 | 672 | 714 | 210 | 86 | 59 | 2,052 | |
| French Creek at Penrose Ditch Diversion in Section 27, T51N, R83W | 128 | 98 | 80 | 64 | 53 | 62 | 262 | 1,614 | 1,715 | 504 | 207 | 142 | 4,928 | |
Note: 1. The monthly and annual flows for Prairie Dog Creek and Little Piney Creek are the average of the dry, normal, and wet year monthly and annual flows.
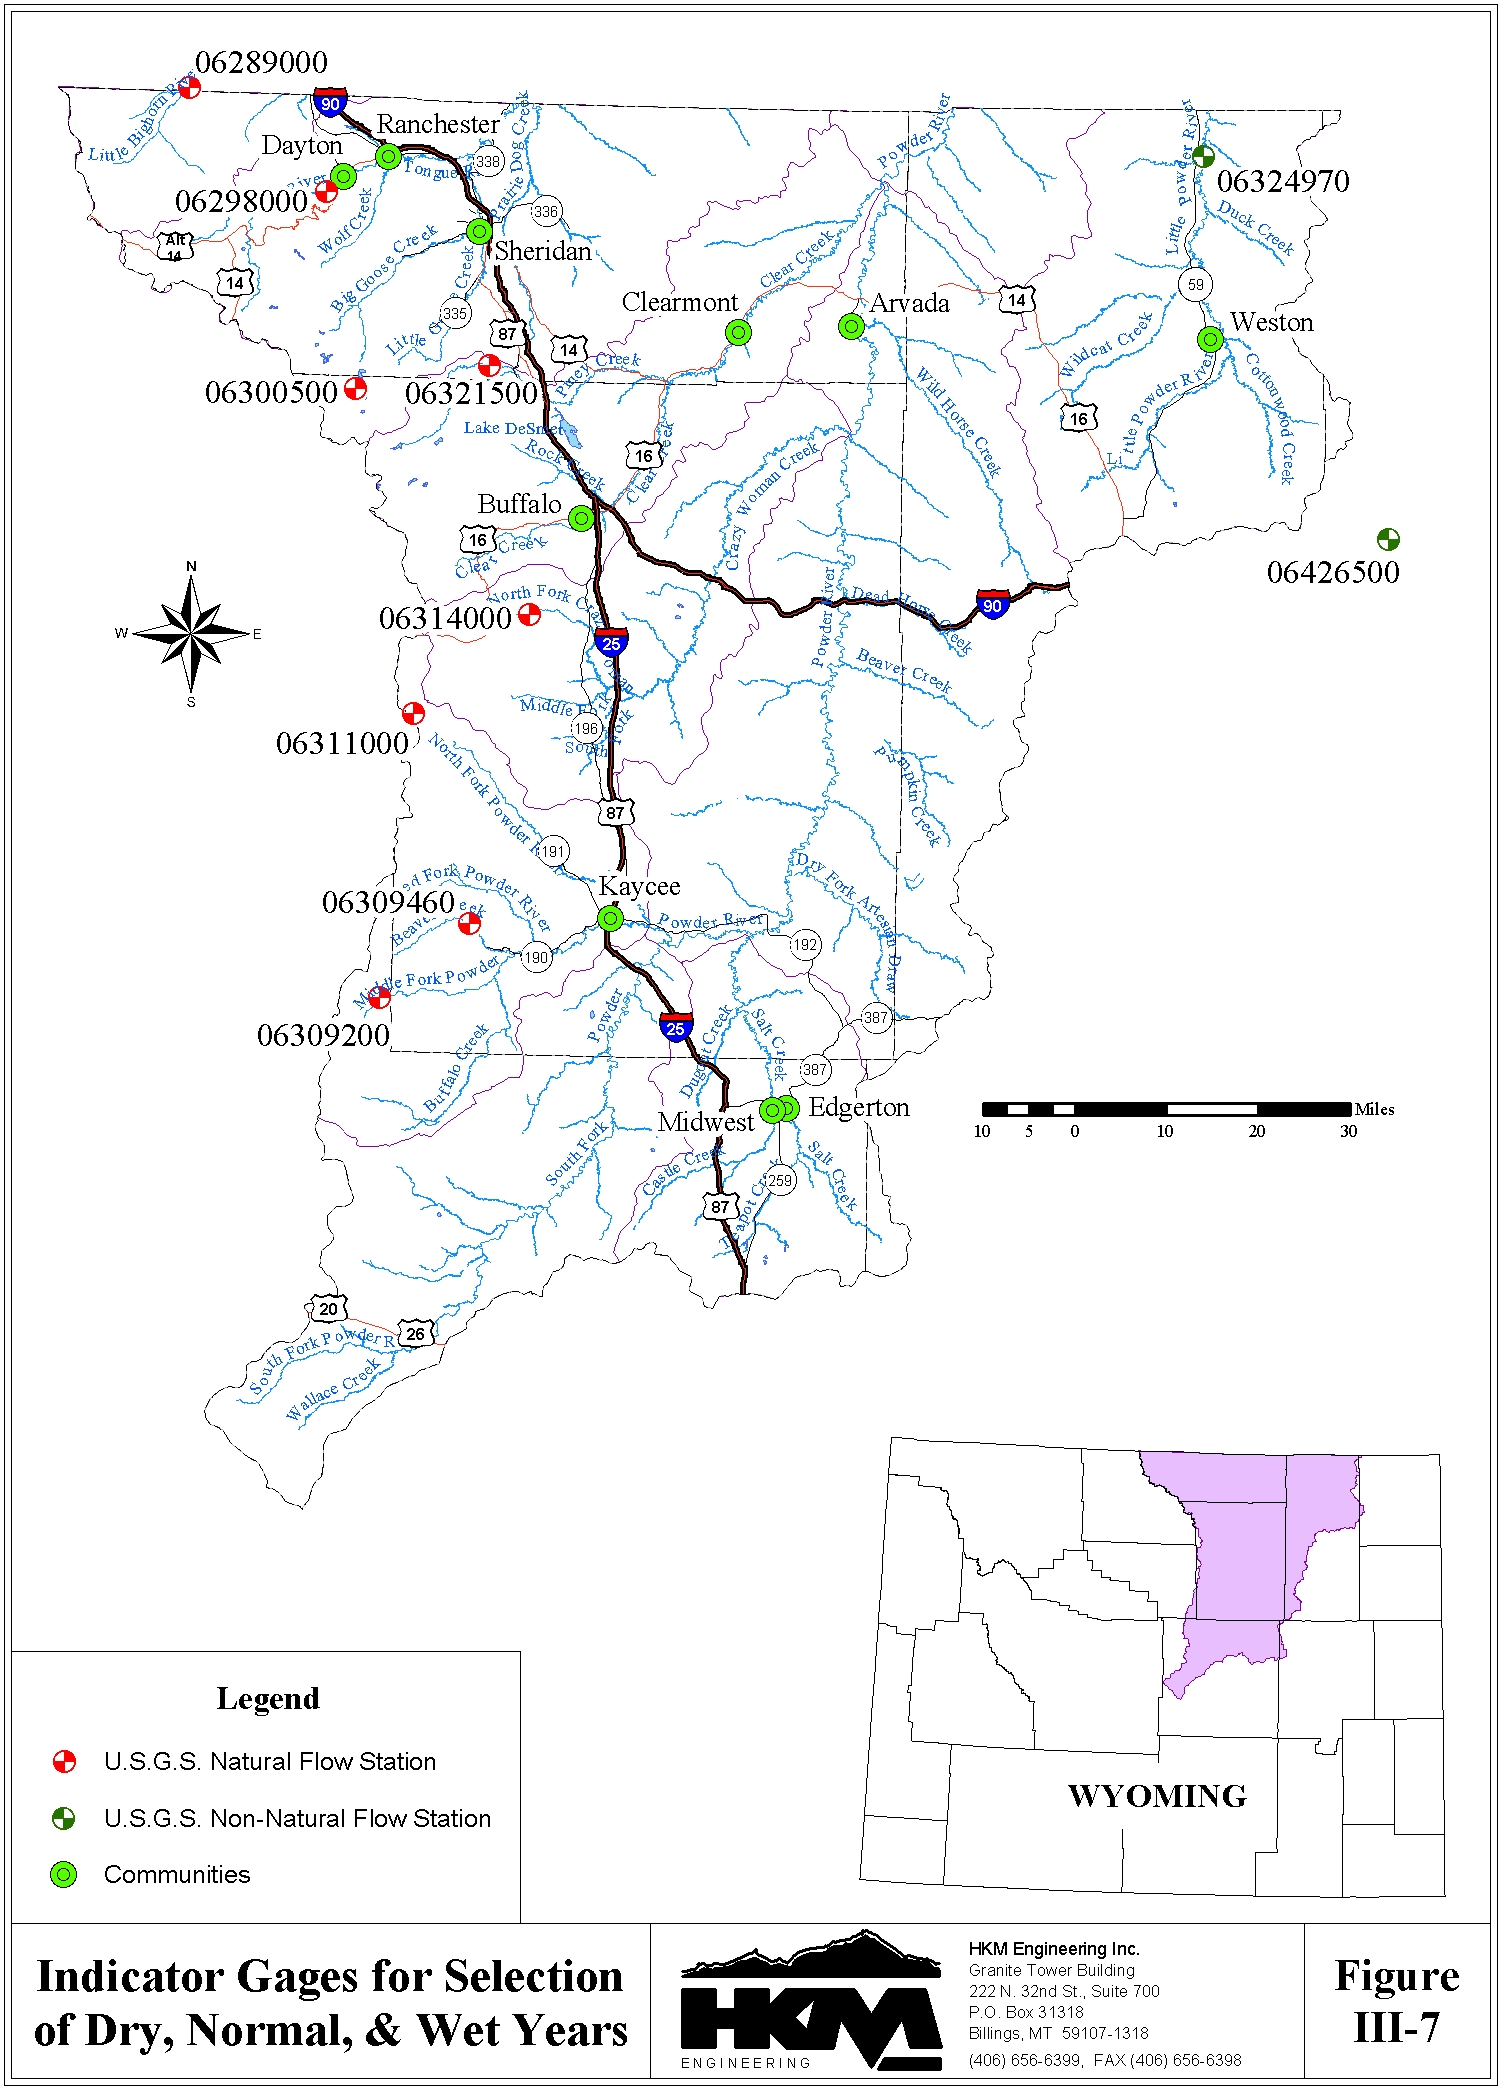
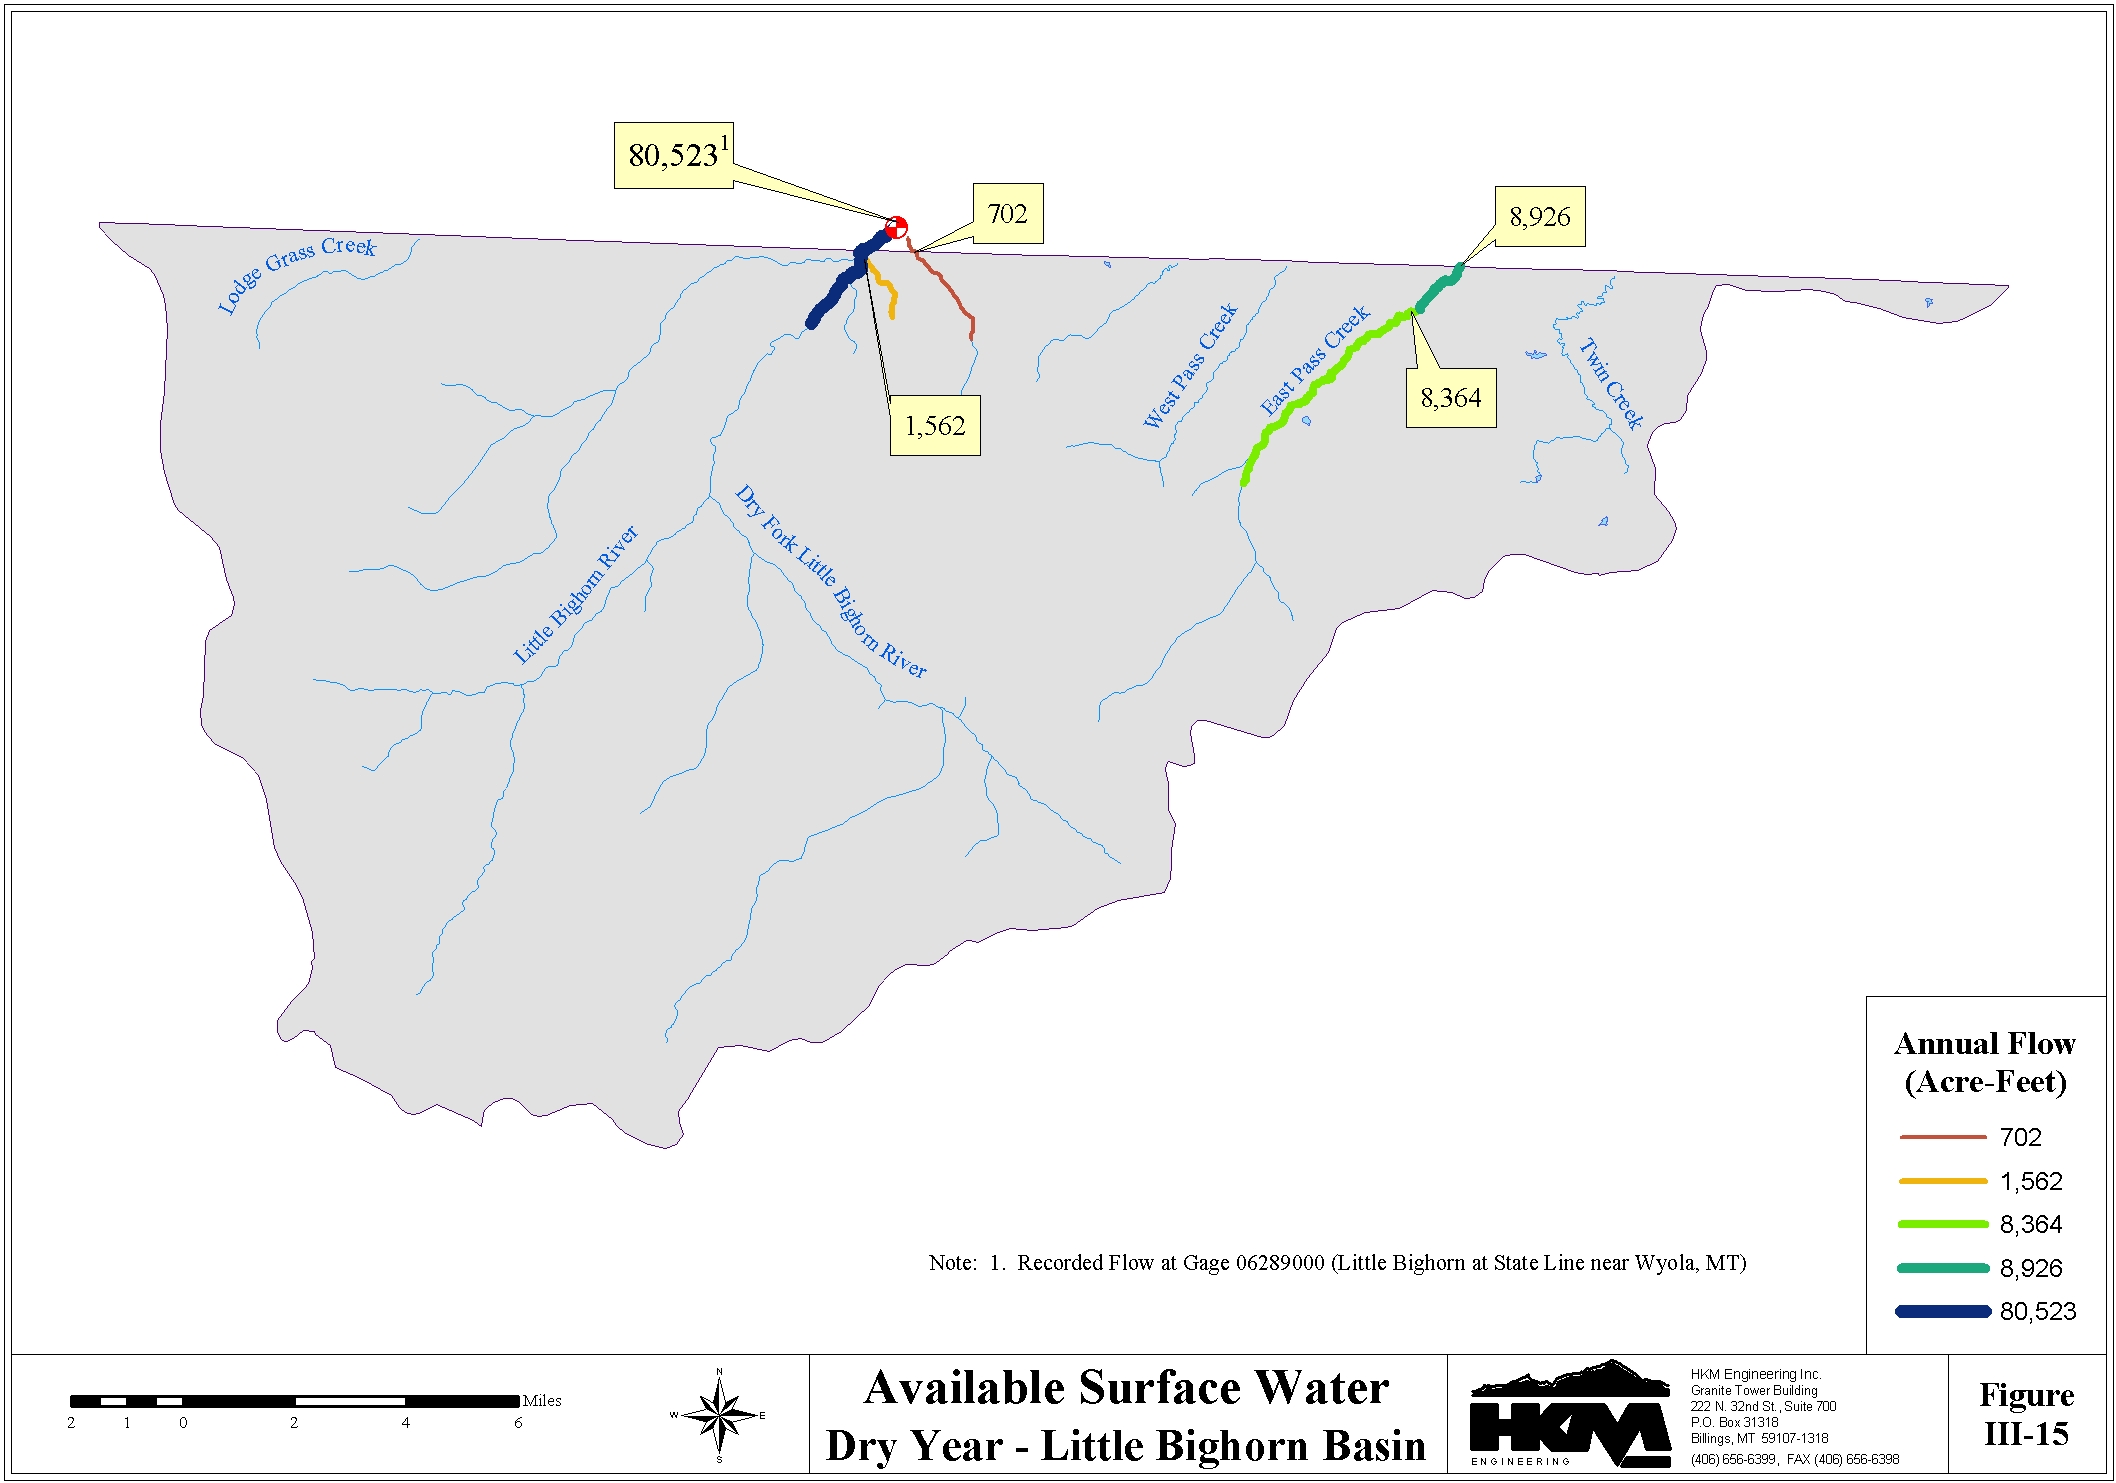
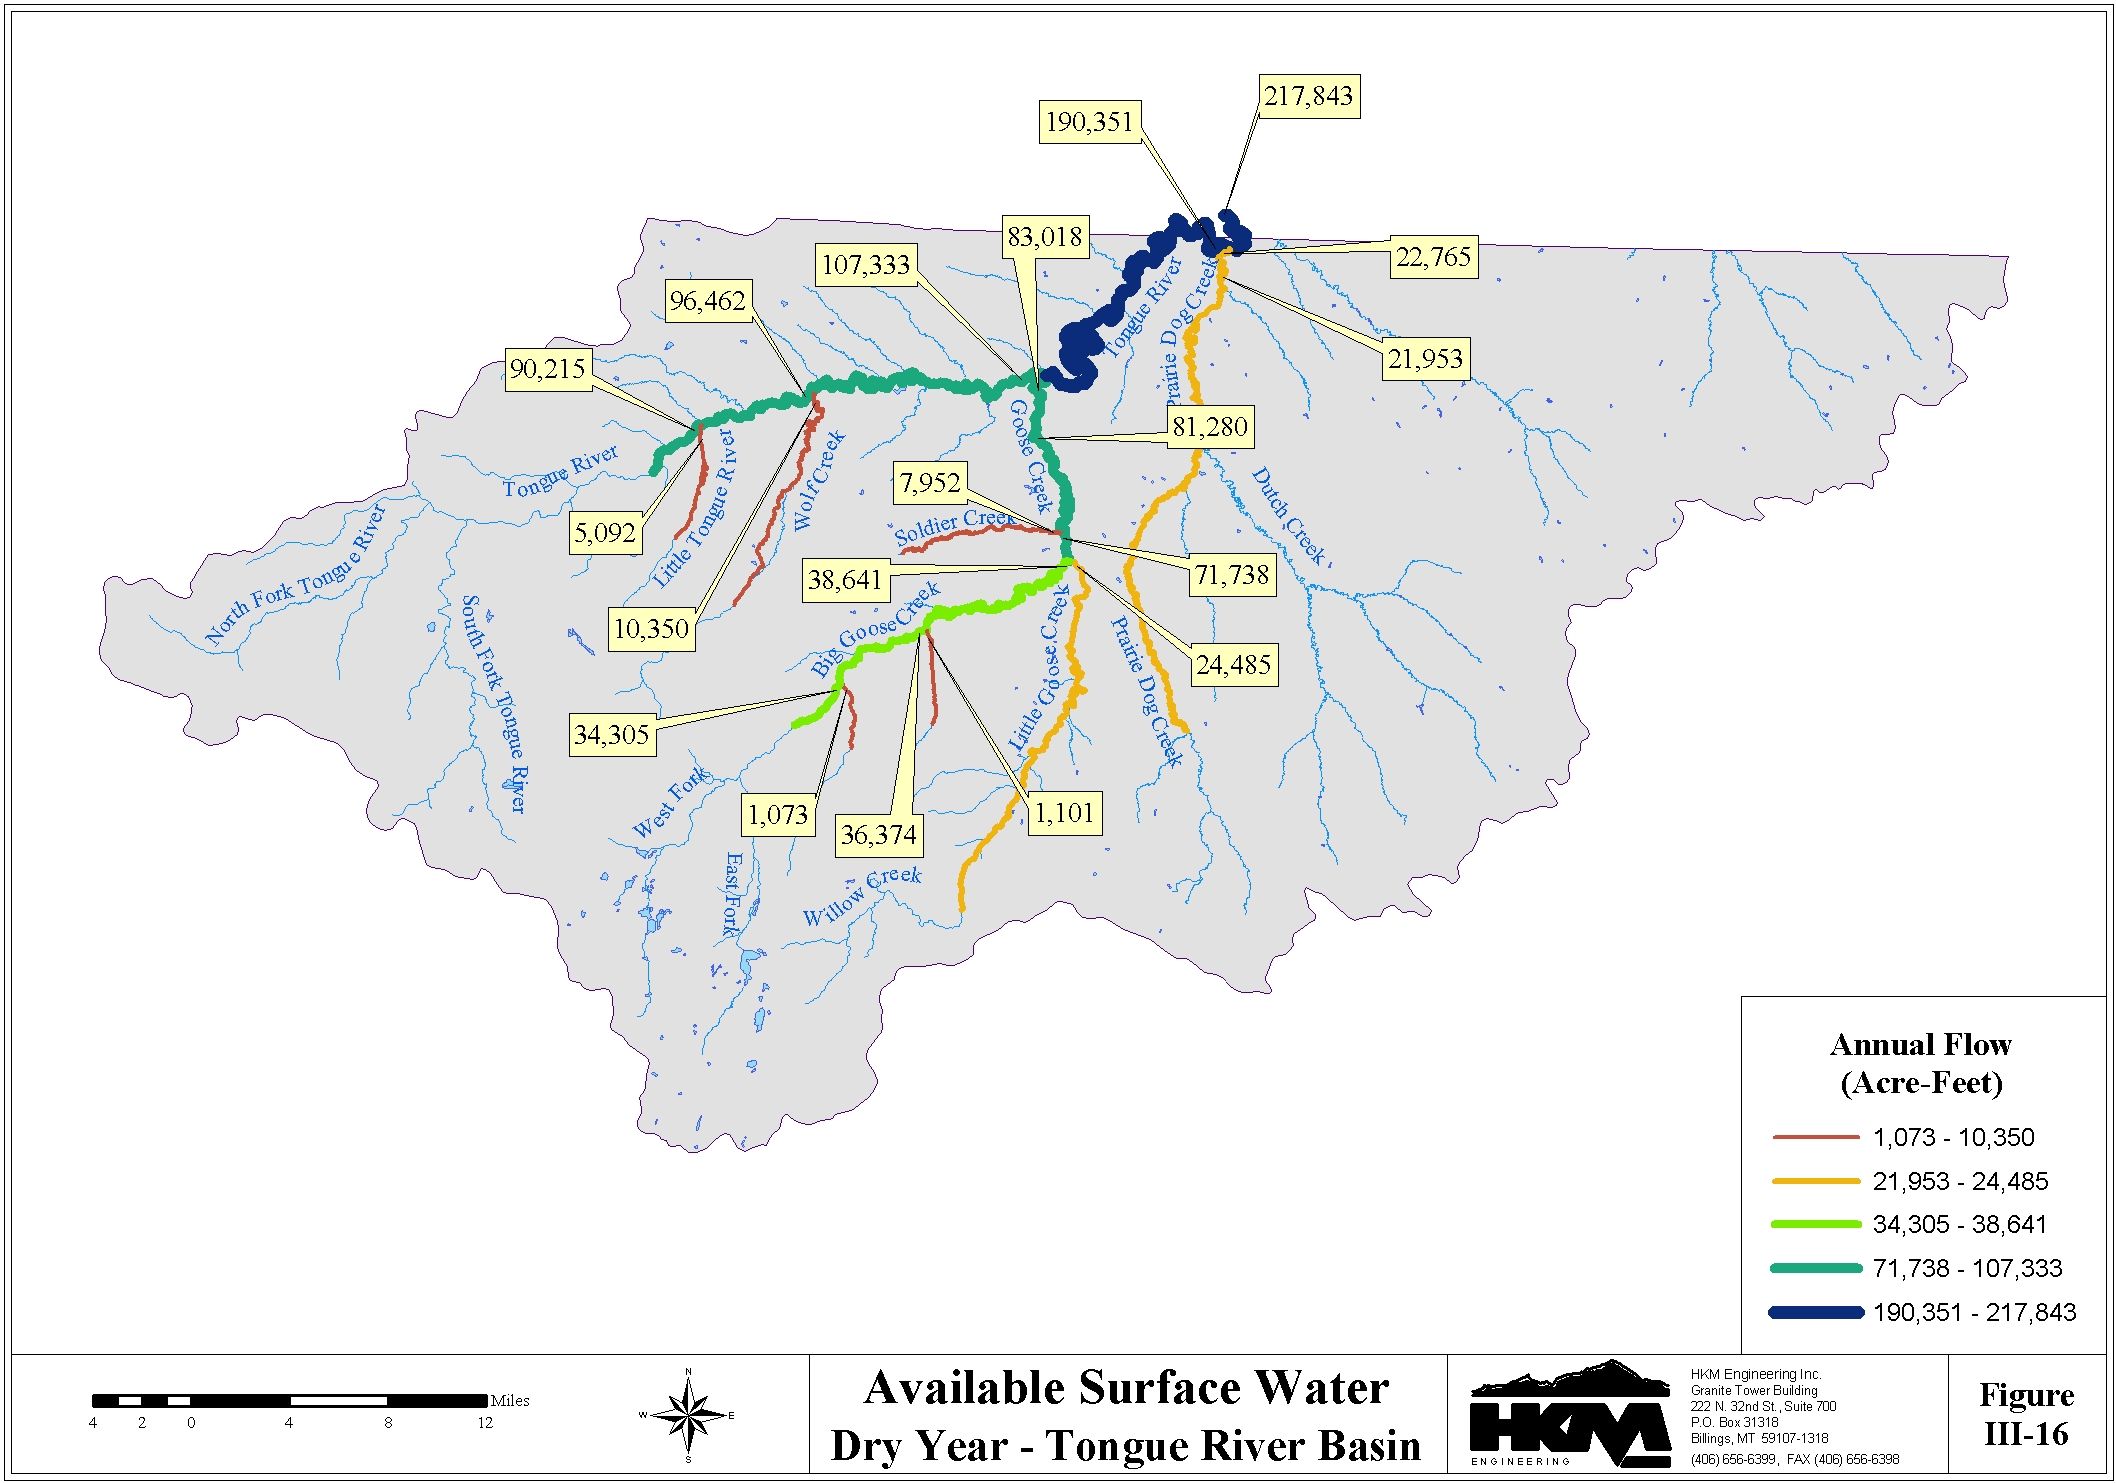
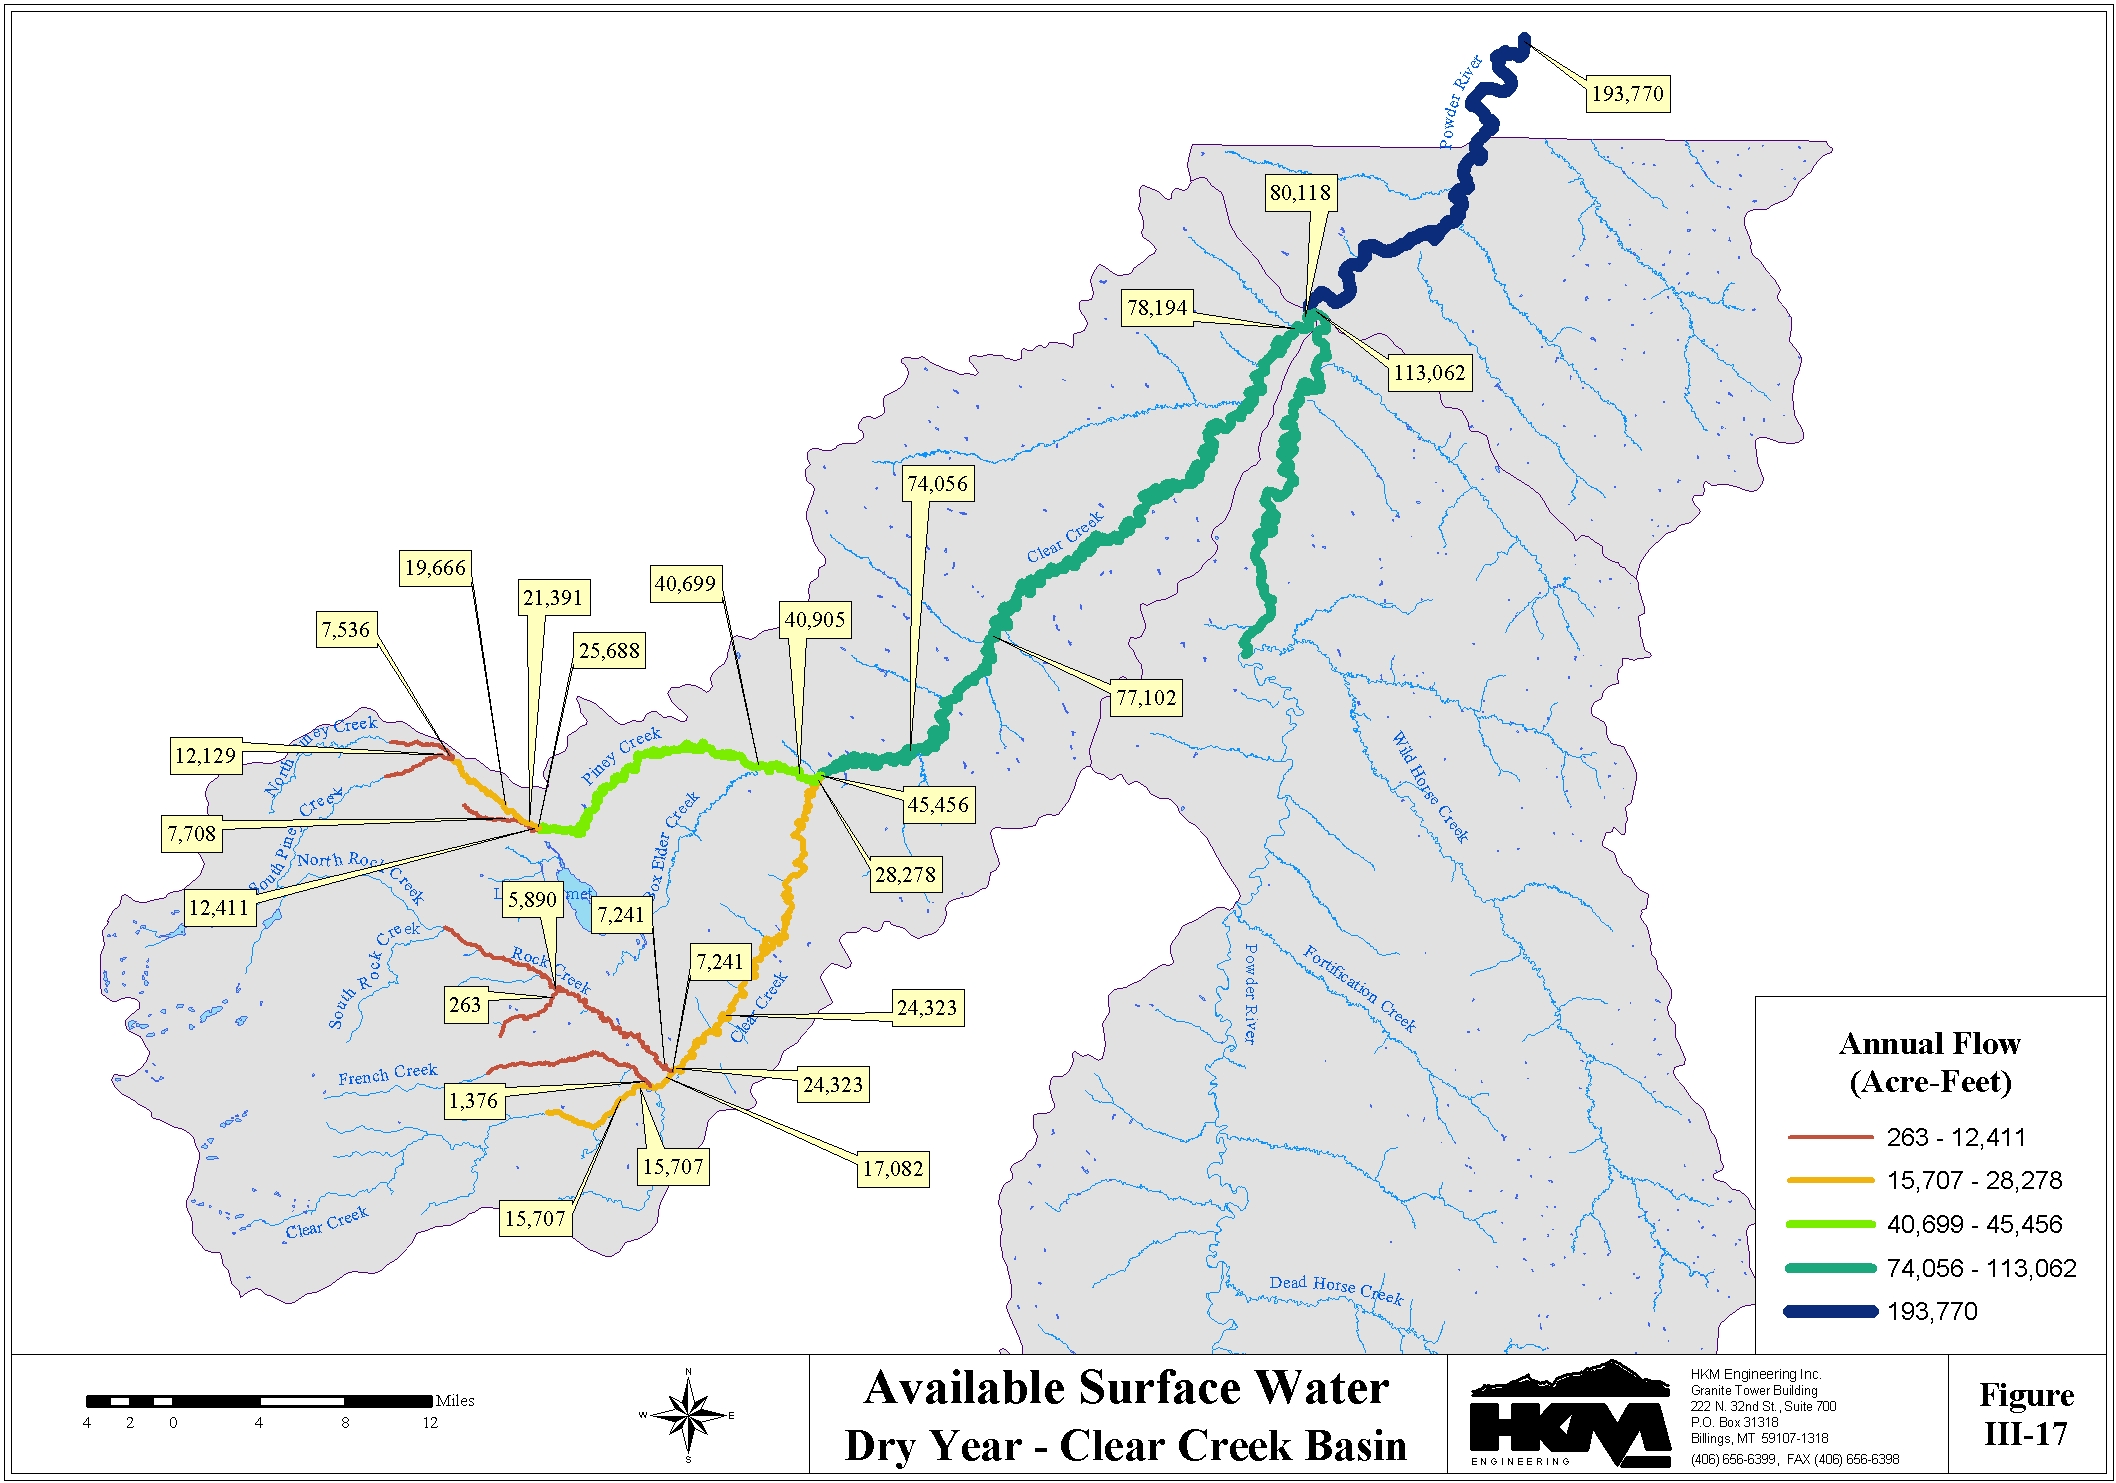
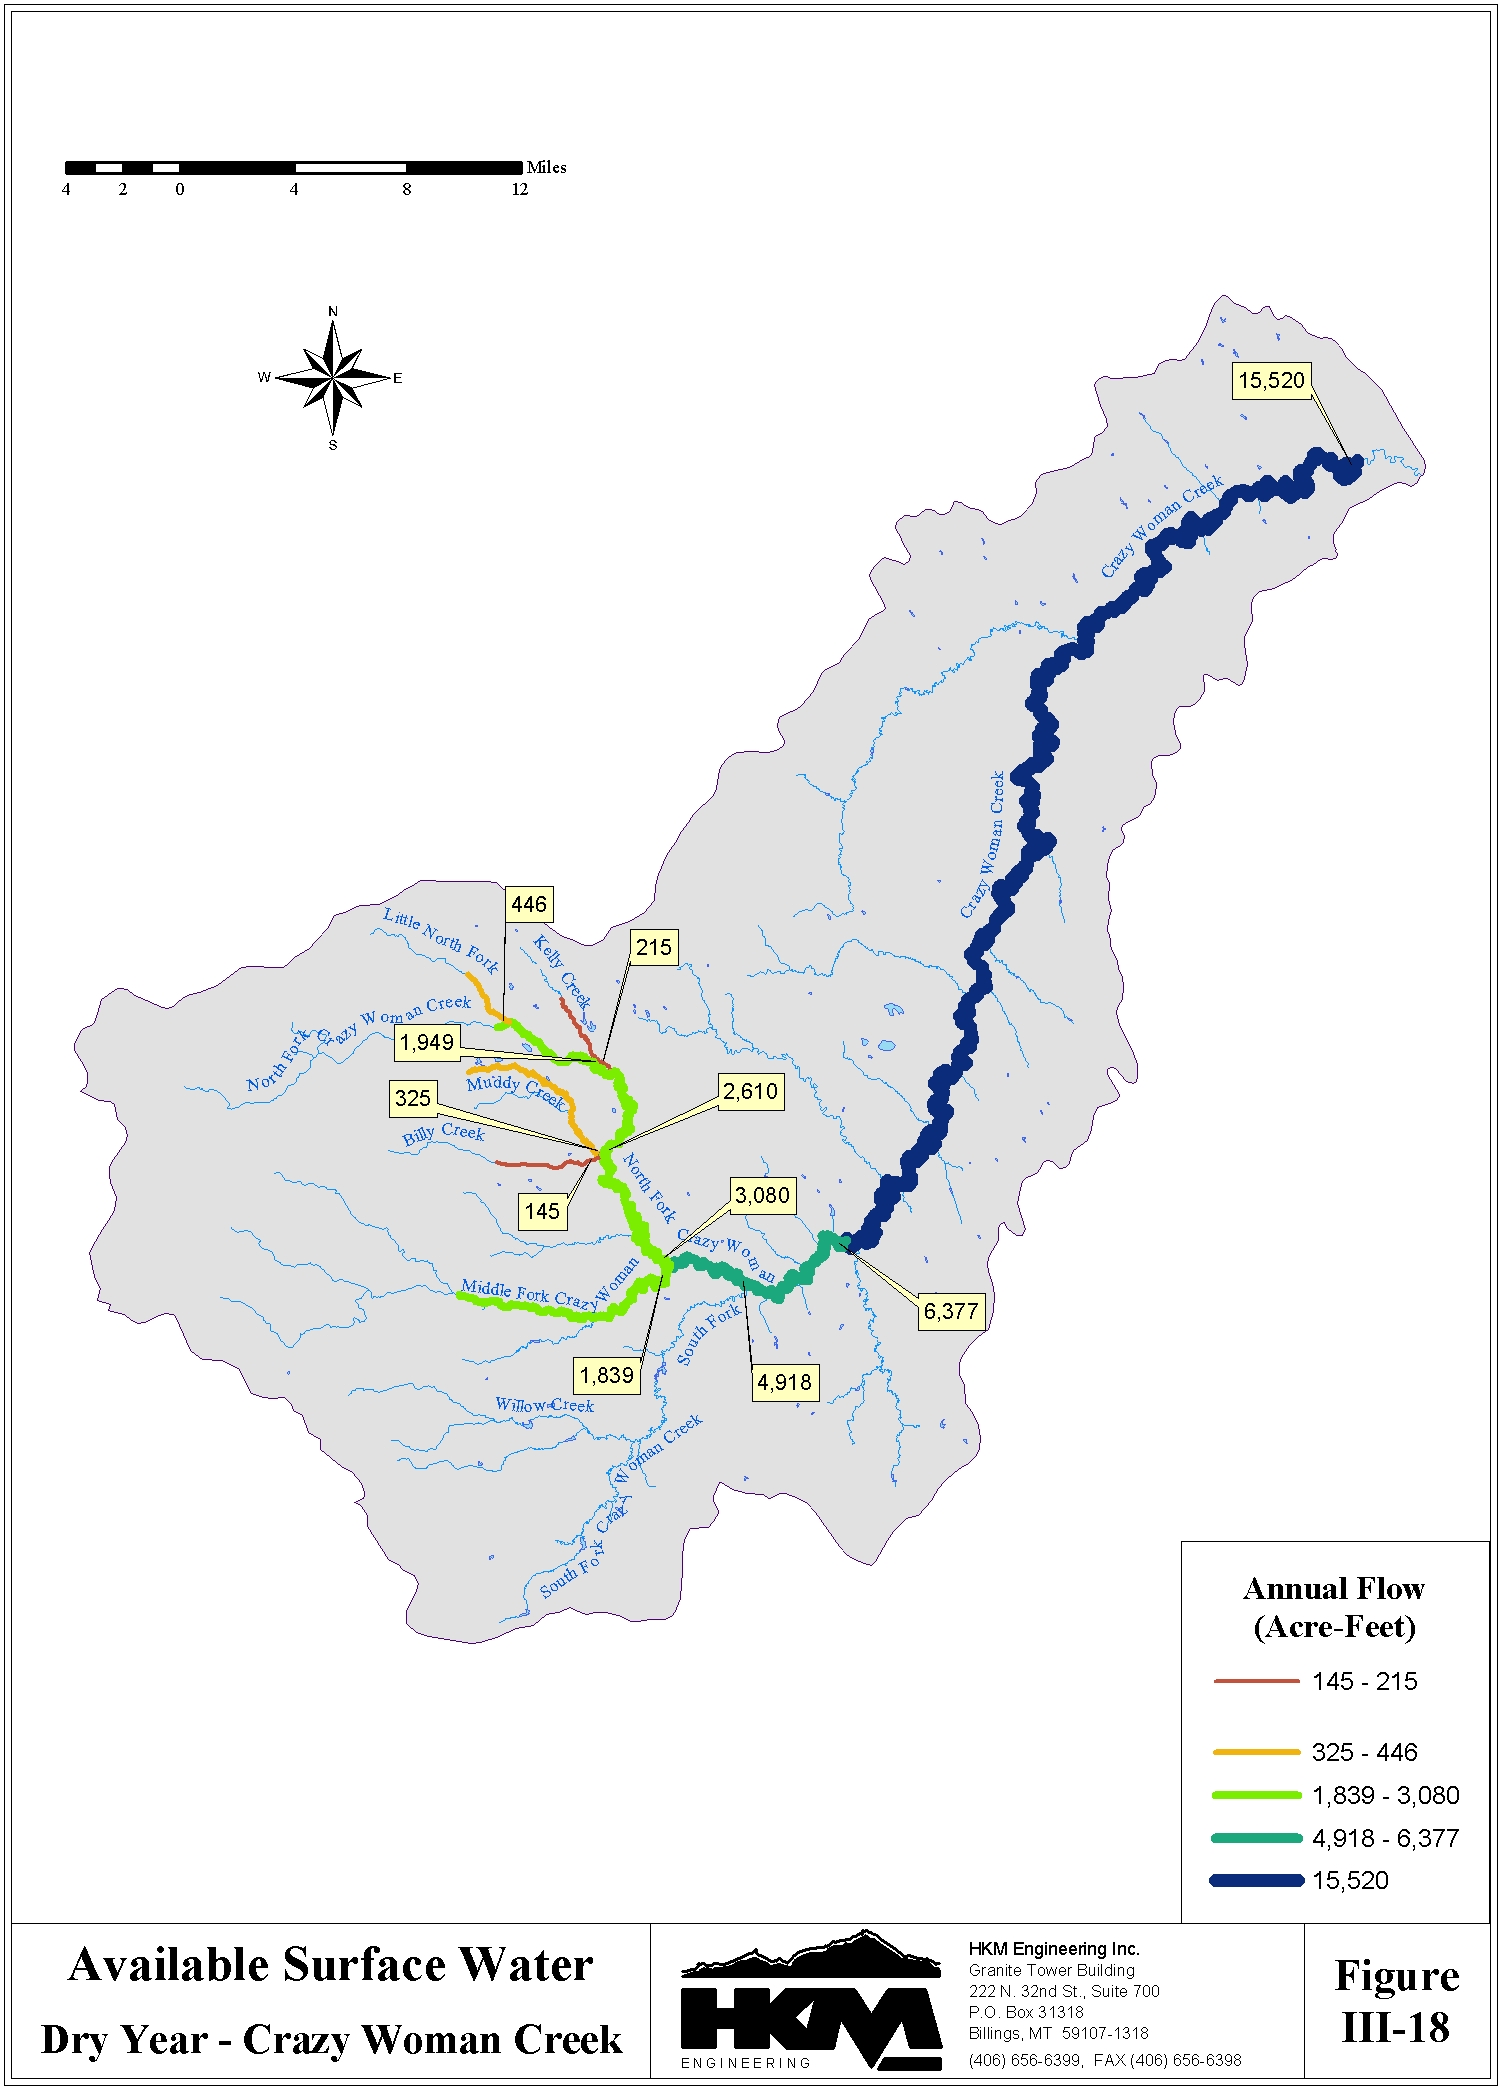
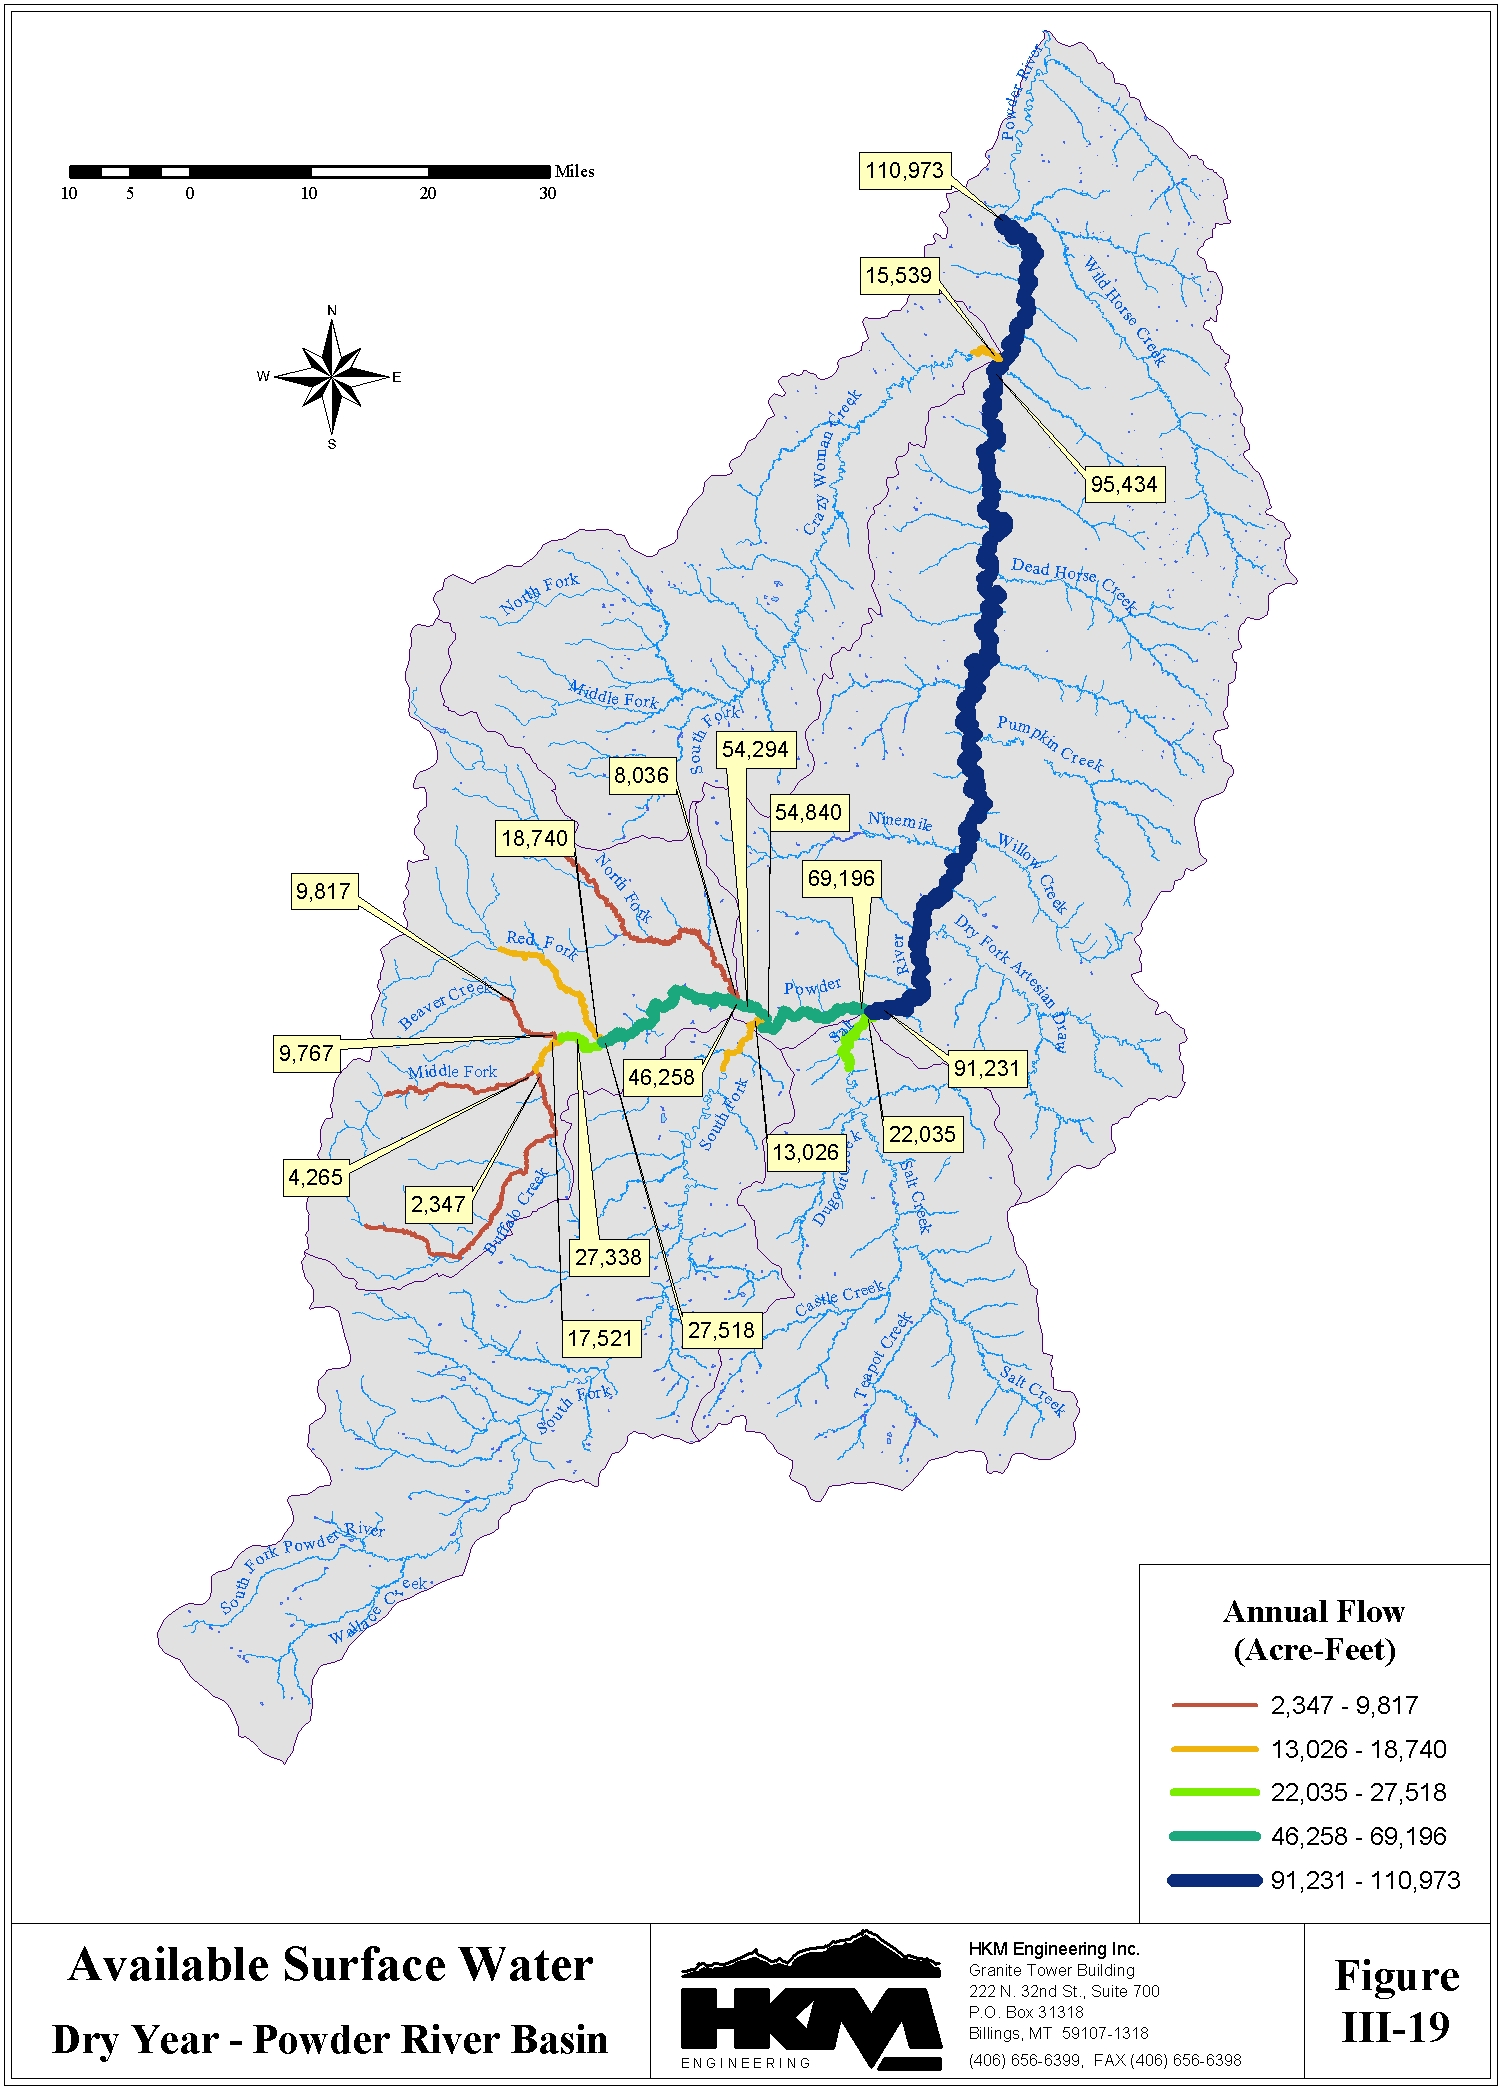
Streamflows During Wet, Dry, and Normal Years
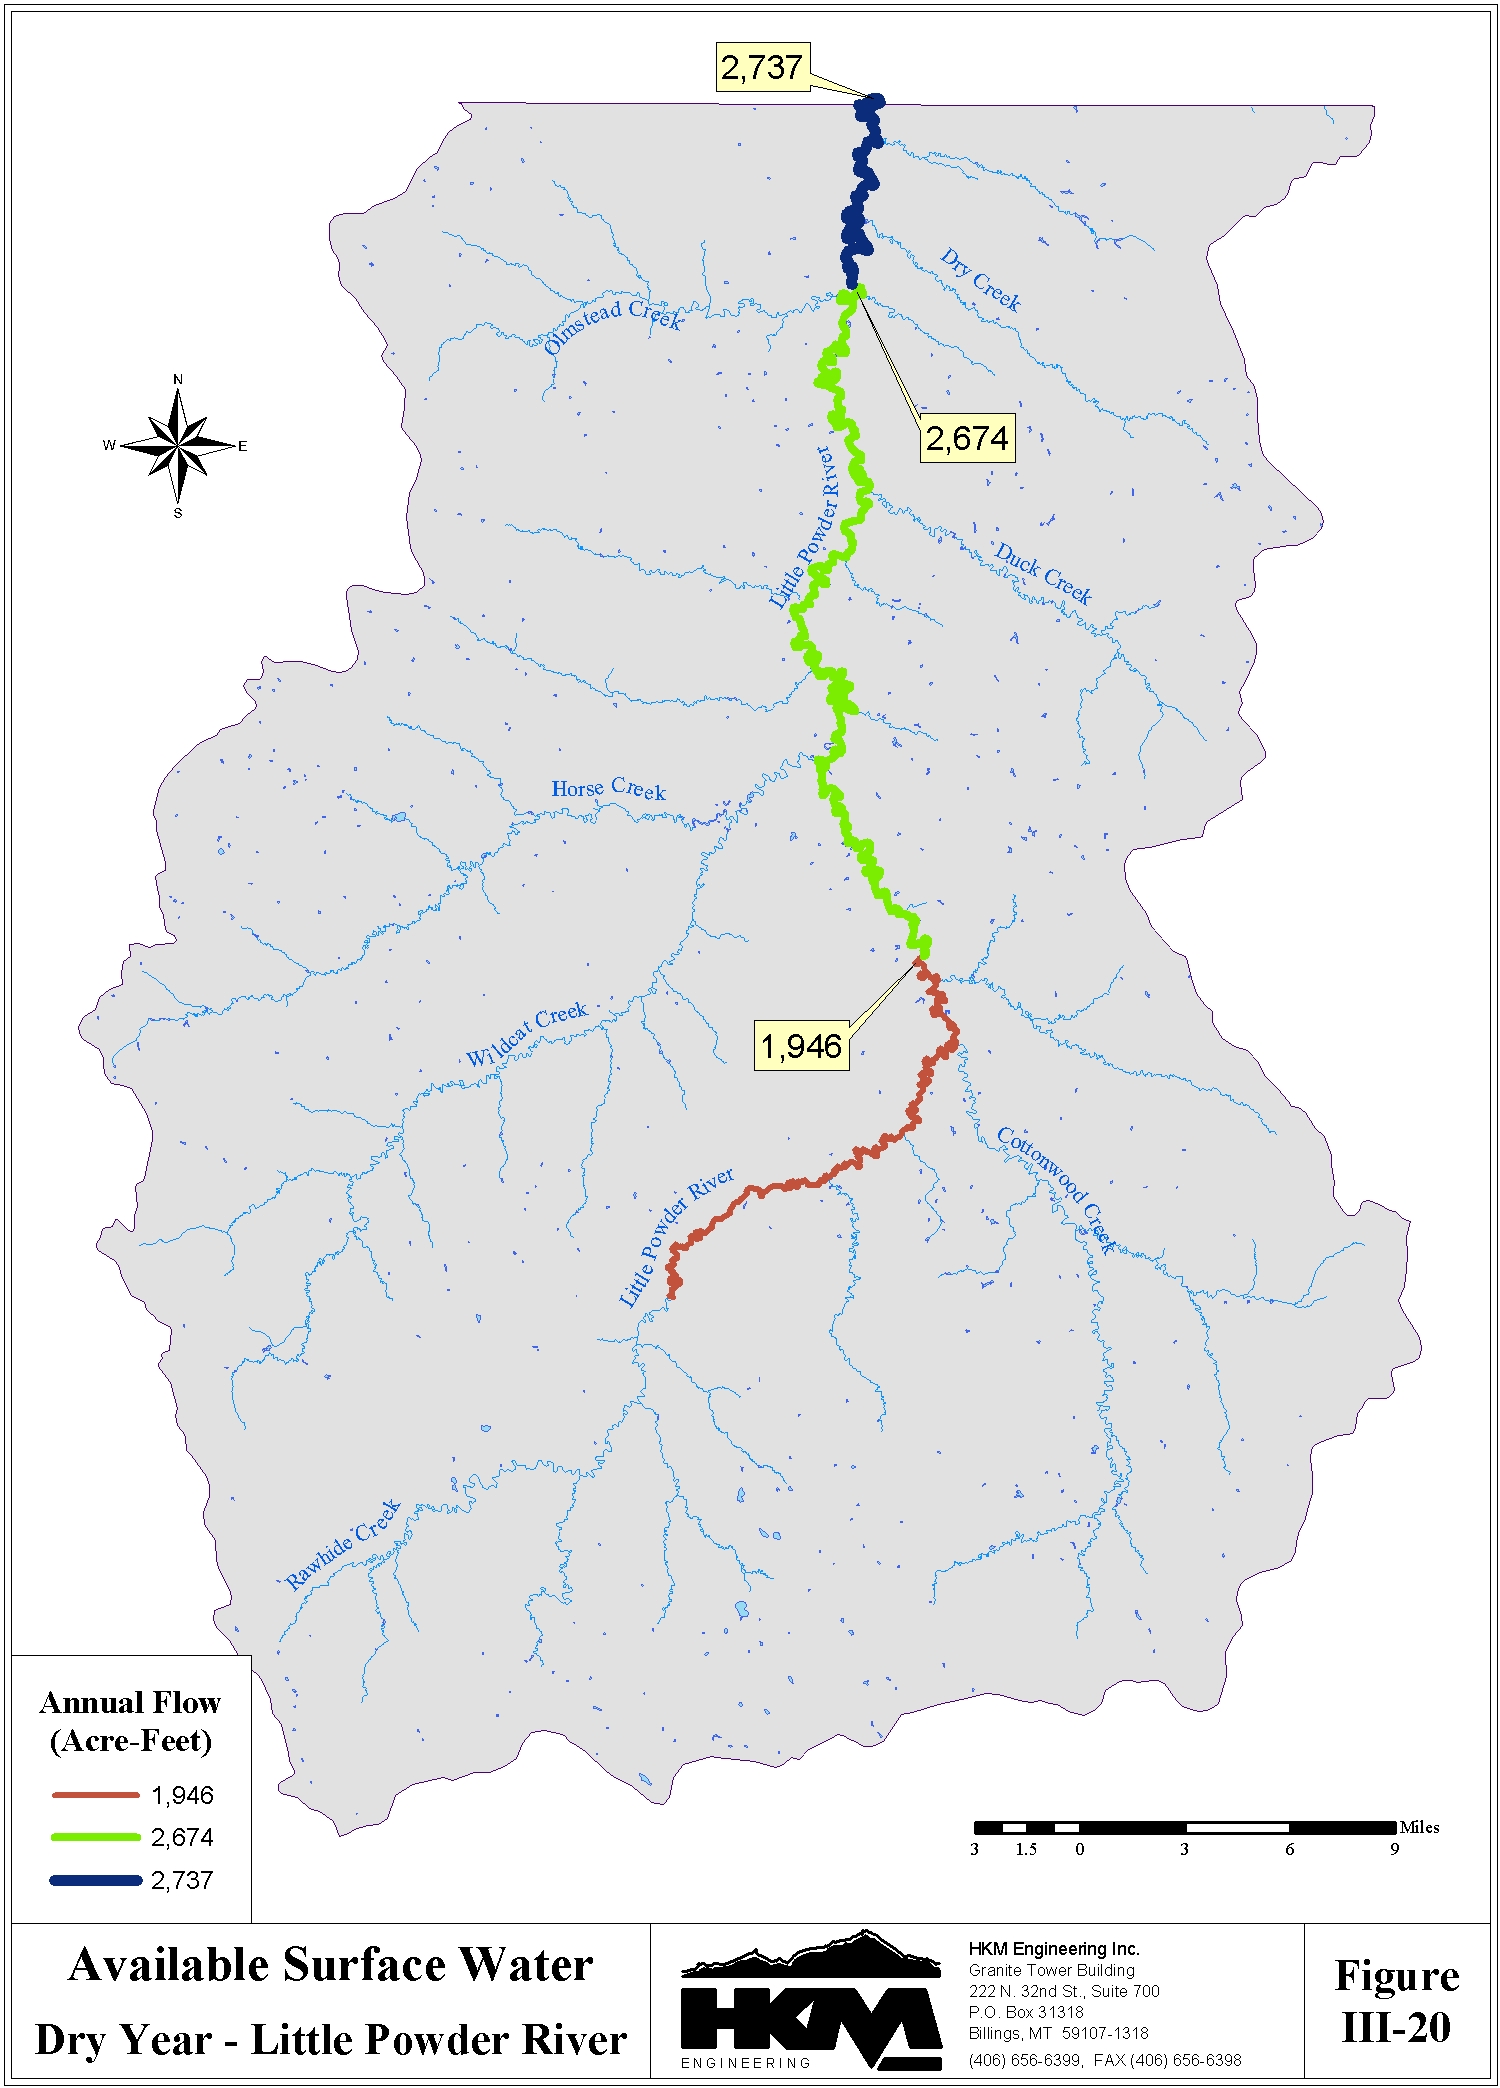
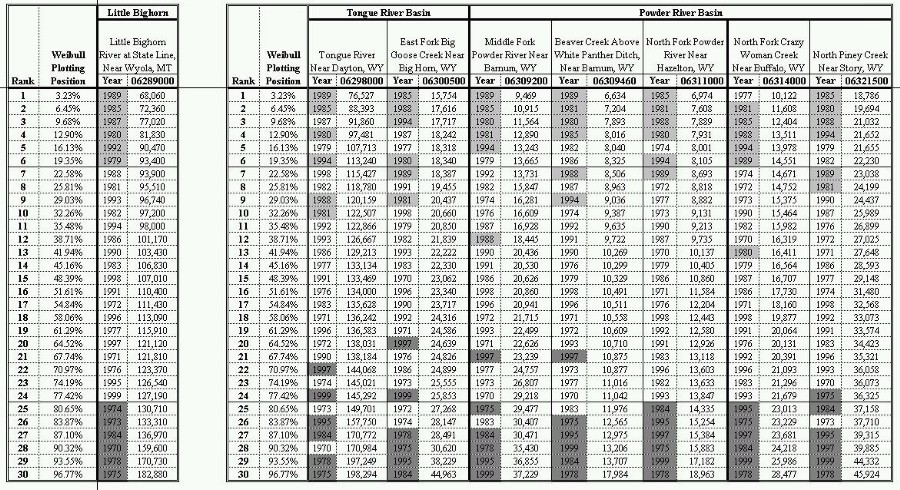
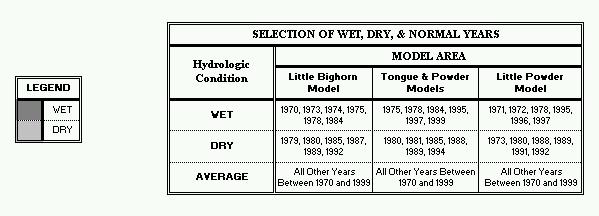
The water availability models represent dry year, normal year, and wet year hydrologic conditions throughout the Powder/Tongue River Basin. To this end, the annual streamflows for the 1970 to 1999 study period developed through the surface water hydrology work are ranked and divided into these three hydrologic categories. Indicator gages are selected for this purpose, to represent hydrologic conditions for the entire geographic area of the Powder/Tongue River Basin. To the extent possible, natural flow stations, free from transbasin diversion, irrigation depletions, or storage regulation are selected. One exception, Little Powder River above Dry Creek (#06324970) which is impacted by irrigation depletions was selected to represent hydrologic conditions in the Little Powder drainage. The nine indicator gages are shown on Figure III-7.
Water use in the Tongue River and Powder River are interrelated through transbasin diversions including the Mead Coffeen Ditch, Piney Cruse Ditch, and the Prairie Dog Ditch. Because of this interrelationship, the years selected to represent the various hydrologic conditions must be consistent for all locations within each of these two river basins. Water use in the Little Bighorn River is essentially independent of water use in the other river basins. Similarly, water use in the Little Powder River drainage is also independent of water use in the other drainages. The years with non-exceedance probabilities of 20 percent or less (the driest 20 percent) and the years with exceedance probabilities of 20 percent or less (the wettest 20 percent) at each of the indicator gages are shown in Figure III-8. The remaining 60 percent of the years represent normal years. The years selected to represent dry years, wet years, and normal years for the Little Bighorn River basin, the Tongue and Powder River basins, and the Little Powder River basin are also summarized in Figure III-8.
Figure III-8
Selection of Wet, Dry, and Normal Years for Modeling -
Indicator Stations for the Powder/Tongue River Basins
The average monthly and annual streamflow for the natural flow stations for dry years, normal years, and wet years are provided in Tables III-5, III-6, and III-7 respectively. The average monthly and annual streamflow for the non-natural flow stations for dry years, normal years, and wet years are provided in Tables III-8, III-9, and III-10 respectively. Finally, the average monthly and annual streamflow for the ungaged model nodes for dry years, normal years, and wet years are provided in Tables III-11, III-12, and III-13 respectively.
Table III-5
Summary Of Dry Year Monthly And Annual Flows (1970 To 1999) -
Natural Flow Stations
| Basin | Station Number | Station Name | Average Streamflow for 1970-1999 in Acre-Feet | ||||||||||||
| Oct | Nov | Dec | Jan | Feb | Mar | Apr | May | Jun | Jul | Aug | Sep | Annual | |||
| Little Bighorn | |||||||||||||||
| 06288600 | Little Bighorn River Below Dayton Gulch Near Burgess Junction, WY | 383 | 293 | 270 | 230 | 186 | 199 | 396 | 2,737 | 2,400 | 1,220 | 631 | 406 | 9,348 | |
| 06288700 | Dry Fork Little Bighorn Below Lick Creek Near Burgess Junction, WY | 1,781 | 1,540 | 1,467 | 1,330 | 1,157 | 1,254 | 1,685 | 4,567 | 4,393 | 2,990 | 2,106 | 1,666 | 25,935 | |
| 06288960 | Little Bighorn River Near Parkman, WY | 3,804 | 3,159 | 2,990 | 2,746 | 2,375 | 2,648 | 3,934 | 12,923 | 11,513 | 6,948 | 4,513 | 3,536 | 61,087 | |
| 06288975 | Elkhorn Creek Above Fuller Ranch Ditch Near Parkman, WY | 104 | 97 | 90 | 81 | 70 | 83 | 145 | 327 | 258 | 145 | 119 | 101 | 1,621 | |
| 06288990 | West Fork Little Bighorn River Near Parkman, WY | 911 | 765 | 710 | 645 | 563 | 627 | 872 | 2,647 | 2,377 | 1,526 | 1,041 | 824 | 13,505 | |
| 06289000 | Little Bighorn River at State Line Near Wyola, MT | 5,168 | 4,347 | 4,130 | 3,815 | 3,330 | 3,687 | 5,332 | 16,225 | 14,538 | 9,057 | 6,063 | 4,832 | 80,523 | |
| 06289100 | Red Canyon Creek Near Parkman, WY | 23 | 24 | 19 | 21 | 16 | 23 | 126 | 260 | 103 | 34 | 20 | 21 | 689 | |
| 06289800 | East Pass Creek Near Parkman, WY | 450 | 377 | 359 | 329 | 293 | 315 | 616 | 1,506 | 1,362 | 863 | 587 | 468 | 7,524 | |
| 06291200 | Lodge Grass Creek at State Line Near Wyola, MT | 445 | 356 | 322 | 284 | 238 | 262 | 607 | 2,835 | 2,606 | 1,242 | 690 | 464 | 10,349 | |
| Tongue | |||||||||||||||
| 06297000 | South Fork Tongue River Near Dayton, WY | 1,253 | 926 | 859 | 714 | 604 | 671 | 2,638 | 15,853 | 9,285 | 2,993 | 1,616 | 1,228 | 38,639 | |
| 06297480 | Tongue River at Tongue Canyon Campground Near Dayton, WY | 4,618 | 3,659 | 3,455 | 2,989 | 2,624 | 2,850 | 8,122 | 32,437 | 20,874 | 8,460 | 5,619 | 4,552 | 100,258 | |
| 06298000 | Tongue River Near Dayton, WY | 4,654 | 3,681 | 3,473 | 3,002 | 2,633 | 2,862 | 8,224 | 33,196 | 21,910 | 9,160 | 5,672 | 4,587 | 103,051 | |
| 06298480 | Little Tongue River at Steamboat Point Near Dayton, WY | 119 | 85 | 79 | 65 | 54 | 60 | 335 | 2,105 | 1,413 | 441 | 190 | 128 | 5,073 | |
| 06298490 | Little Tongue River Above South Fork Little Tongue River Near Dayton, WY | 85 | 59 | 54 | 44 | 36 | 41 | 209 | 1,748 | 926 | 239 | 115 | 83 | 3,639 | |
| 06298500 | Little Tongue River Near Dayton, WY | 200 | 143 | 132 | 108 | 90 | 101 | 528 | 3,159 | 2,144 | 692 | 306 | 208 | 7,811 | |
| 06299480 | Wolf Creek Below Alden Creek Near Wolf, WY | 423 | 313 | 291 | 241 | 205 | 227 | 1,036 | 5,941 | 4,067 | 1,352 | 610 | 419 | 15,122 | |
| 06299490 | Wolf Creek Above Red Canyon Creek at Wolf, WY | 499 | 380 | 355 | 300 | 258 | 284 | 1,025 | 5,696 | 3,926 | 1,334 | 610 | 423 | 15,089 | |
| 06299500 | Wolf Creek at Wolf, WY | 496 | 370 | 344 | 287 | 244 | 270 | 1,106 | 5,662 | 3,972 | 1,426 | 678 | 478 | 15,331 | |
| 06300500 | East Fork Big Goose Creek Near Big Horn, WY | 355 | 243 | 221 | 176 | 143 | 163 | 918 | 6,291 | 6,407 | 1,855 | 700 | 573 | 18,042 | |
| 06301480 | Coney Creek Above Twin Lakes Near Big Horn, WY | 25 | 15 | 13 | 10 | 8 | 9 | 88 | 1,282 | 1,059 | 153 | 46 | 38 | 2,746 | |
| Powder | 06309200 | Middle Fork Powder River Near Barnum, WY | 366 | 344 | 335 | 299 | 259 | 320 | 2,163 | 5,973 | 1,485 | 523 | 351 | 336 | 12,754 |
| 06309260 | Buffalo Creek Above North Fork Buffalo Creek Near Arminto, WY | 23 | 22 | 21 | 18 | 15 | 20 | 211 | 755 | 132 | 36 | 22 | 21 | 1,294 | |
| 06309270 | North Fork Buffalo Creek Near Arminto, WY | 70 | 65 | 64 | 57 | 50 | 61 | 387 | 1,033 | 269 | 98 | 67 | 64 | 2,284 | |
| 06309280 | Buffalo Creek Below North Fork Buffalo Creek Near Arminto, WY | 0 | 0 | 0 | 0 | 0 | 0 | 10 | 932 | 123 | 3 | 0 | 0 | 1,067 | |
| 06309450 | Beaver Creek Below Bayer Creek Near Barnum, WY | 167 | 145 | 128 | 110 | 89 | 119 | 461 | 804 | 454 | 252 | 180 | 153 | 3,060 | |
| 06309460 | Beaver Creek Above White Panther Ditch Near Barnum, WY | 600 | 544 | 538 | 521 | 456 | 513 | 889 | 1,247 | 860 | 647 | 558 | 508 | 7,882 | |
| 06311000 | North Fork Powder River Near Hazelton, WY | 271 | 200 | 155 | 121 | 97 | 116 | 961 | 2,983 | 1,847 | 587 | 305 | 226 | 7,867 | |
| 06313950 | North Fork Crazy Woman Creek Below Pole Creek Near Buffalo, WY | 596 | 463 | 368 | 276 | 227 | 260 | 1,652 | 4,799 | 3,037 | 1,122 | 596 | 451 | 13,847 | |
| 06314000 | North Fork Crazy Woman Creek Near Buffalo, WY | 599 | 475 | 373 | 285 | 232 | 264 | 1,648 | 4,661 | 3,031 | 1,127 | 598 | 451 | 13,744 | |
| 06314500 | North Fork Crazy Woman Creek Below Spring Draw Near Buffalo, WY | 510 | 374 | 287 | 222 | 177 | 212 | 1,878 | 6,015 | 3,677 | 1,130 | 577 | 423 | 15,483 | |
| 06315480 | Poison Creek Below Tetley Spring Near Mayoworth, WY | 209 | 173 | 145 | 117 | 100 | 111 | 453 | 1,024 | 717 | 339 | 209 | 169 | 3,766 | |
| 06315490 | Poison Creek Near Mayoworth, WY | 241 | 202 | 171 | 139 | 120 | 133 | 502 | 1,091 | 777 | 382 | 242 | 197 | 4,195 | |
| 06315500 | Middle Fork Crazy Woman Creek Near Greub, WY | 659 | 513 | 416 | 339 | 282 | 327 | 1,881 | 4,814 | 3,223 | 1,256 | 730 | 569 | 15,009 | |
| 06317300 | Sourdough Creek Near Buffalo, WY | 64 | 45 | 36 | 25 | 22 | 28 | 153 | 457 | 433 | 152 | 75 | 56 | 1,545 | |
| 06317340 | Little Sourdough Creek Near Buffalo, WY | 16 | 11 | 3 | 1 | 1 | 2 | 106 | 95 | 55 | 12 | 5 | 8 | 314 | |
| 06319470 | South Rock Creek at Forest Boundary Near Buffalo, WY | 414 | 308 | 240 | 189 | 152 | 181 | 1,425 | 4,299 | 2,691 | 882 | 466 | 347 | 11,594 | |
| 06319480 | South Rock Creek Above Red Canyon Near Buffalo, WY | 395 | 293 | 227 | 178 | 143 | 170 | 1,383 | 4,239 | 2,637 | 850 | 445 | 330 | 11,228 | |
| 06319500 | South Fork Rock Creek Near Buffalo, WY | 751 | 587 | 459 | 371 | 295 | 342 | 2,571 | 8,859 | 4,307 | 1,475 | 776 | 606 | 21,400 | |
Table III-6
Summary Of Normal Year Monthly And Annual Flows (1970 To 1999) -
Natural Flow Stations
| Basin | Station Number | Station Name | Average Streamflow for 1970-1999 in Acre-Feet | ||||||||||||
| Oct | Nov | Dec | Jan | Feb | Mar | Apr | May | Jun | Jul | Aug | Sep | Annual | |||
| Little Bighorn | |||||||||||||||
| 06288600 | Little Bighorn River Below Dayton Gulch Near Burgess Junction, WY | 422 | 303 | 267 | 237 | 196 | 220 | 361 | 3,862 | 6,199 | 1,629 | 778 | 463 | 14,937 | |
| 06288700 | Dry Fork Little Bighorn Below Lick Creek Near Burgess Junction, WY | 1,854 | 1,591 | 1,477 | 1,379 | 1,227 | 1,329 | 1,722 | 6,442 | 9,677 | 4,367 | 2,630 | 2,024 | 35,720 | |
| 06288960 | Little Bighorn River Near Parkman, WY | 4,002 | 3,337 | 3,079 | 2,837 | 2,458 | 2,766 | 3,732 | 17,480 | 27,873 | 10,893 | 6,005 | 4,414 | 88,877 | |
| 06288975 | Elkhorn Creek Above Fuller Ranch Ditch Near Parkman, WY | 116 | 101 | 92 | 86 | 75 | 88 | 139 | 470 | 602 | 186 | 136 | 123 | 2,213 | |
| 06288990 | West Fork Little Bighorn River Near Parkman, WY | 932 | 790 | 731 | 671 | 589 | 675 | 901 | 3,871 | 5,812 | 2,315 | 1,355 | 1,037 | 19,677 | |
| 06289000 | Little Bighorn River at State Line Near Wyola, MT | 5,412 | 4,543 | 4,226 | 3,927 | 3,465 | 3,879 | 5,112 | 21,438 | 33,132 | 13,750 | 7,872 | 5,948 | 112,704 | |
| 06289100 | Red Canyon Creek Near Parkman, WY | 35 | 31 | 25 | 27 | 23 | 42 | 214 | 545 | 241 | 64 | 31 | 27 | 1,304 | |
| 06289800 | East Pass Creek Near Parkman, WY | 474 | 391 | 365 | 339 | 303 | 331 | 552 | 1,928 | 2,318 | 1,057 | 644 | 510 | 9,211 | |
| 06291200 | Lodge Grass Creek at State Line Near Wyola, MT | 466 | 351 | 310 | 282 | 238 | 273 | 581 | 3,838 | 5,310 | 1,658 | 784 | 529 | 14,620 | |
| Tongue | |||||||||||||||
| 06297000 | South Fork Tongue River Near Dayton, WY | 1,462 | 1,069 | 976 | 816 | 655 | 749 | 1,756 | 14,632 | 20,914 | 5,932 | 2,554 | 1,700 | 53,216 | |
| 06297480 | Tongue River at Tongue Canyon Campground Near Dayton, WY | 5,140 | 3,987 | 3,650 | 3,349 | 2,827 | 3,124 | 5,922 | 31,052 | 40,989 | 14,721 | 7,889 | 5,768 | 128,419 | |
| 06298000 | Tongue River Near Dayton, WY | 5,232 | 4,031 | 3,687 | 3,369 | 2,853 | 3,163 | 6,003 | 31,944 | 41,798 | 15,382 | 8,019 | 5,825 | 131,306 | |
| 06298480 | Little Tongue River at Steamboat Point Near Dayton, WY | 137 | 96 | 85 | 74 | 59 | 71 | 239 | 2,024 | 2,889 | 689 | 280 | 176 | 6,819 | |
| 06298490 | Little Tongue River Above South Fork Little Tongue River Near Dayton, WY | 102 | 70 | 60 | 52 | 40 | 47 | 133 | 1,615 | 2,453 | 532 | 202 | 121 | 5,427 | |
| 06298500 | Little Tongue River Near Dayton, WY | 228 | 162 | 140 | 127 | 111 | 124 | 392 | 3,153 | 4,156 | 1,074 | 427 | 278 | 10,372 | |
| 06299480 | Wolf Creek Below Alden Creek Near Wolf, WY | 481 | 347 | 306 | 269 | 221 | 261 | 757 | 5,691 | 8,097 | 2,060 | 859 | 561 | 19,909 | |
| 06299490 | Wolf Creek Above Red Canyon Creek at Wolf, WY | 537 | 404 | 362 | 330 | 272 | 308 | 753 | 5,442 | 7,717 | 2,019 | 857 | 564 | 19,565 | |
| 06299500 | Wolf Creek at Wolf, WY | 543 | 405 | 355 | 321 | 281 | 301 | 827 | 5,443 | 7,591 | 2,118 | 934 | 627 | 19,746 | |
| 06300500 | East Fork Big Goose Creek Near Big Horn, WY | 434 | 279 | 208 | 210 | 153 | 169 | 516 | 4,890 | 10,683 | 3,453 | 1,208 | 777 | 22,980 | |
| 06301480 | Coney Creek Above Twin Lakes Near Big Horn, WY | 31 | 19 | 13 | 10 | 7 | 9 | 46 | 1,069 | 1,782 | 423 | 84 | 55 | 3,548 | |
| Powder | 06309200 | Middle Fork Powder River Near Barnum, WY | 458 | 392 | 362 | 328 | 296 | 434 | 2,192 | 9,883 | 4,450 | 1,052 | 528 | 430 | 20,805 |
| 06309260 | Buffalo Creek Above North Fork Buffalo Creek Near Arminto, WY | 31 | 26 | 23 | 20 | 18 | 29 | 229 | 1,337 | 562 | 91 | 37 | 28 | 2,429 | |
| 06309270 | North Fork Buffalo Creek Near Arminto, WY | 87 | 74 | 68 | 61 | 55 | 81 | 383 | 1,674 | 775 | 195 | 102 | 83 | 3,639 | |
| 06309280 | Buffalo Creek Below North Fork Buffalo Creek Near Arminto, WY | 0 | 0 | 0 | 0 | 0 | 0 | 51 | 1,904 | 700 | 41 | 3 | 1 | 2,700 | |
| 06309450 | Beaver Creek Below Bayer Creek Near Barnum, WY | 183 | 160 | 144 | 127 | 117 | 163 | 545 | 1,824 | 1,026 | 395 | 238 | 186 | 5,106 | |
| 06309460 | Beaver Creek Above White Panther Ditch Near Barnum, WY | 603 | 555 | 539 | 513 | 479 | 566 | 1,040 | 2,191 | 1,524 | 876 | 673 | 595 | 10,154 | |
| 06311000 | North Fork Powder River Near Hazelton, WY | 305 | 230 | 190 | 148 | 127 | 143 | 546 | 3,946 | 3,634 | 1,076 | 481 | 347 | 11,173 | |
| 06313950 | North Fork Crazy Woman Creek Below Pole Creek Near Buffalo, WY | 670 | 487 | 403 | 316 | 261 | 305 | 1,062 | 5,365 | 5,452 | 1,909 | 946 | 698 | 17,873 | |
| 06314000 | North Fork Crazy Woman Creek Near Buffalo, WY | 681 | 494 | 412 | 327 | 273 | 313 | 1,079 | 5,238 | 5,249 | 1,878 | 934 | 700 | 17,577 | |
| 06314500 | North Fork Crazy Woman Creek Below Spring Draw Near Buffalo, WY | 581 | 430 | 358 | 268 | 229 | 273 | 1,081 | 7,809 | 7,212 | 2,176 | 946 | 671 | 22,032 | |
| 06315480 | Poison Creek Below Tetley Spring Near Mayoworth, WY | 224 | 179 | 155 | 129 | 114 | 128 | 321 | 1,133 | 1,112 | 490 | 290 | 233 | 4,508 | |
| 06315490 | Poison Creek Near Mayoworth, WY | 256 | 207 | 181 | 153 | 134 | 152 | 362 | 1,195 | 1,174 | 541 | 331 | 268 | 4,954 | |
| 06315500 | Middle Fork Crazy Woman Creek Near Greub, WY | 728 | 568 | 492 | 398 | 350 | 426 | 1,222 | 5,982 | 5,545 | 2,015 | 1,045 | 796 | 19,565 | |
| 06317300 | Sourdough Creek Near Buffalo, WY | 73 | 56 | 47 | 36 | 30 | 33 | 96 | 822 | 847 | 265 | 115 | 84 | 2,504 | |
| 06317340 | Little Sourdough Creek Near Buffalo, WY | 34 | 20 | 7 | 3 | 2 | 5 | 188 | 201 | 133 | 35 | 16 | 25 | 668 | |
| 06319470 | South Rock Creek at Forest Boundary Near Buffalo, WY | 461 | 353 | 296 | 234 | 199 | 220 | 818 | 5,550 | 5,256 | 1,631 | 730 | 520 | 16,268 | |
| 06319480 | South Rock Creek Above Red Canyon Near Buffalo, WY | 439 | 336 | 278 | 216 | 186 | 208 | 790 | 5,473 | 5,219 | 1,595 | 706 | 502 | 15,949 | |
| 06319500 | South Fork Rock Creek Near Buffalo, WY | 829 | 650 | 535 | 441 | 374 | 472 | 1,688 | 10,668 | 9,908 | 2,619 | 1,137 | 897 | 30,217 | |
Table III-7
Summary Of Wet Year Monthly And Annual Flows (1970 To 1999) -
Natural Flow Stations
| Basin | Station Number | Station Name | Average Streamflow for 1970-1999 in Acre-Feet | ||||||||||||
| Oct | Nov | Dec | Jan | Feb | Mar | Apr | May | Jun | Jul | Aug | Sep | Annual | |||
| Little Bighorn | |||||||||||||||
| 06288600 | Little Bighorn River Below Dayton Gulch Near Burgess Junction, WY | 404 | 293 | 265 | 246 | 199 | 212 | 299 | 3,733 | 10,128 | 2,551 | 981 | 538 | 19,851 | |
| 06288700 | Dry Fork Little Bighorn Below Lick Creek Near Burgess Junction, WY | 1,921 | 1,678 | 1,583 | 1,455 | 1,301 | 1,407 | 1,696 | 7,747 | 15,057 | 7,010 | 3,406 | 2,525 | 46,785 | |
| 06288960 | Little Bighorn River Near Parkman, WY | 4,222 | 3,588 | 3,245 | 3,076 | 2,707 | 2,977 | 3,723 | 21,474 | 45,028 | 18,889 | 8,210 | 5,703 | 122,841 | |
| 06288975 | Elkhorn Creek Above Fuller Ranch Ditch Near Parkman, WY | 118 | 102 | 95 | 89 | 81 | 92 | 136 | 715 | 1,125 | 327 | 159 | 157 | 3,196 | |
| 06288990 | West Fork Little Bighorn River Near Parkman, WY | 984 | 836 | 764 | 707 | 647 | 710 | 901 | 5,327 | 10,134 | 4,021 | 1,785 | 1,335 | 28,152 | |
| 06289000 | Little Bighorn River at State Line Near Wyola, MT | 5,667 | 4,890 | 4,467 | 4,217 | 3,748 | 4,120 | 5,097 | 26,348 | 54,728 | 23,118 | 10,465 | 7,502 | 152,367 | |
| 06289100 | Red Canyon Creek Near Parkman, WY | 55 | 48 | 40 | 44 | 36 | 66 | 346 | 1,002 | 424 | 109 | 51 | 42 | 2,263 | |
| 06289800 | East Pass Creek Near Parkman, WY | 464 | 387 | 372 | 344 | 313 | 330 | 455 | 2,223 | 3,454 | 1,392 | 706 | 557 | 10,995 | |
| 06291200 | Lodge Grass Creek at State Line Near Wyola, MT | 466 | 344 | 322 | 308 | 257 | 270 | 427 | 3,807 | 8,850 | 2,869 | 913 | 624 | 19,456 | |
| Tongue | |||||||||||||||
| 06297000 | South Fork Tongue River Near Dayton, WY | 1,479 | 1,030 | 923 | 856 | 690 | 786 | 1,288 | 14,366 | 39,809 | 11,430 | 3,358 | 1,954 | 77,970 | |
| 06297480 | Tongue River at Tongue Canyon Campground Near Dayton, WY | 5,280 | 4,056 | 3,710 | 3,440 | 3,012 | 3,311 | 4,758 | 29,952 | 68,799 | 25,483 | 9,988 | 6,407 | 168,195 | |
| 06298000 | Tongue River Near Dayton, WY | 5,301 | 3,998 | 3,673 | 3,465 | 2,930 | 3,237 | 4,697 | 30,887 | 68,594 | 25,504 | 10,027 | 6,591 | 168,904 | |
| 06298480 | Little Tongue River at Steamboat Point Near Dayton, WY | 139 | 97 | 84 | 74 | 62 | 72 | 194 | 2,648 | 5,358 | 1,124 | 339 | 177 | 10,367 | |
| 06298490 | Little Tongue River Above South Fork Little Tongue River Near Dayton, WY | 98 | 65 | 56 | 52 | 41 | 49 | 90 | 1,614 | 4,929 | 1,122 | 280 | 141 | 8,538 | |
| 06298500 | Little Tongue River Near Dayton, WY | 240 | 161 | 143 | 132 | 104 | 120 | 303 | 3,874 | 7,901 | 1,805 | 548 | 296 | 15,626 | |
| 06299480 | Wolf Creek Below Alden Creek Near Wolf, WY | 488 | 351 | 314 | 284 | 228 | 267 | 617 | 7,299 | 14,248 | 3,542 | 1,089 | 585 | 29,311 | |
| 06299490 | Wolf Creek Above Red Canyon Creek at Wolf, WY | 568 | 429 | 380 | 357 | 304 | 332 | 636 | 6,999 | 13,552 | 3,453 | 1,068 | 586 | 28,664 | |
| 06299500 | Wolf Creek at Wolf, WY | 568 | 412 | 369 | 336 | 272 | 317 | 683 | 6,843 | 13,155 | 3,405 | 1,153 | 657 | 28,171 | |
| 06300500 | East Fork Big Goose Creek Near Big Horn, WY | 471 | 342 | 254 | 217 | 169 | 187 | 320 | 5,517 | 16,433 | 6,483 | 1,155 | 587 | 32,133 | |
| 06301480 | Coney Creek Above Twin Lakes Near Big Horn, WY | 33 | 19 | 15 | 12 | 9 | 11 | 21 | 965 | 2,498 | 1,252 | 116 | 37 | 4,987 | |
| Powder | 06309200 | Middle Fork Powder River Near Barnum, WY | 543 | 561 | 427 | 373 | 329 | 497 | 1,886 | 13,410 | 11,223 | 1,624 | 703 | 542 | 32,117 |
| 06309260 | Buffalo Creek Above North Fork Buffalo Creek Near Arminto, WY | 38 | 40 | 27 | 22 | 19 | 33 | 194 | 1,984 | 1,426 | 194 | 58 | 36 | 4,070 | |
| 06309270 | North Fork Buffalo Creek Near Arminto, WY | 102 | 109 | 81 | 70 | 60 | 91 | 313 | 2,141 | 1,981 | 317 | 143 | 111 | 5,518 | |
| 06309280 | Buffalo Creek Below North Fork Buffalo Creek Near Arminto, WY | 0 | 0 | 0 | 0 | 0 | 0 | 7 | 2,947 | 2,525 | 133 | 1 | 0 | 5,612 | |
| 06309450 | Beaver Creek Below Bayer Creek Near Barnum, WY | 209 | 204 | 155 | 138 | 118 | 174 | 499 | 2,662 | 2,173 | 708 | 343 | 251 | 7,634 | |
| 06309460 | Beaver Creek Above White Panther Ditch Near Barnum, WY | 652 | 633 | 577 | 531 | 487 | 593 | 975 | 3,236 | 2,937 | 1,278 | 898 | 756 | 13,553 | |
| 06311000 | North Fork Powder River Near Hazelton, WY | 286 | 213 | 174 | 157 | 120 | 169 | 415 | 4,497 | 7,433 | 1,738 | 607 | 360 | 16,167 | |
| 06313950 | North Fork Crazy Woman Creek Below Pole Creek Near Buffalo, WY | 542 | 449 | 359 | 315 | 272 | 329 | 874 | 7,018 | 9,478 | 3,068 | 1,159 | 683 | 24,544 | |
| 06314000 | North Fork Crazy Woman Creek Near Buffalo, WY | 557 | 448 | 366 | 314 | 275 | 331 | 875 | 7,077 | 9,409 | 3,174 | 1,220 | 724 | 24,767 | |
| 06314500 | North Fork Crazy Woman Creek Below Spring Draw Near Buffalo, WY | 539 | 398 | 324 | 291 | 221 | 314 | 798 | 9,188 | 15,384 | 3,455 | 1,171 | 684 | 32,766 | |
| 06315480 | Poison Creek Below Tetley Spring Near Mayoworth, WY | 192 | 165 | 140 | 130 | 116 | 136 | 314 | 1,436 | 1,721 | 642 | 318 | 222 | 5,530 | |
| 06315490 | Poison Creek Near Mayoworth, WY | 222 | 191 | 167 | 153 | 139 | 165 | 350 | 1,485 | 1,805 | 704 | 365 | 253 | 5,997 | |
| 06315500 | Middle Fork Crazy Woman Creek Near Greub, WY | 692 | 540 | 460 | 422 | 338 | 447 | 903 | 6,697 | 10,221 | 3,060 | 1,289 | 838 | 25,906 | |
| 06317300 | Sourdough Creek Near Buffalo, WY | 66 | 50 | 41 | 37 | 29 | 40 | 94 | 953 | 1,555 | 379 | 137 | 83 | 3,462 | |
| 06317340 | Little Sourdough Creek Near Buffalo, WY | 65 | 39 | 13 | 5 | 3 | 9 | 359 | 373 | 242 | 62 | 28 | 43 | 1,242 | |
| 06319470 | South Rock Creek at Forest Boundary Near Buffalo, WY | 437 | 337 | 274 | 244 | 187 | 244 | 621 | 6,203 | 10,264 | 2,837 | 914 | 545 | 23,106 | |
| 06319480 | South Rock Creek Above Red Canyon Near Buffalo, WY | 417 | 325 | 262 | 238 | 180 | 232 | 599 | 6,175 | 10,222 | 2,742 | 882 | 516 | 22,788 | |
| 06319500 | South Fork Rock Creek Near Buffalo, WY | 763 | 595 | 490 | 422 | 353 | 437 | 1,450 | 11,665 | 17,560 | 4,334 | 1,506 | 916 | 40,490 | |
Table III-8
Summary of Dry Year Monthly and Annual Flows (1970 To 1999) -
Non-Natural Flow Stations
| Basin | Station Number | Station Name | Average Streamflow for 1970-1999 in Acre-Feet | ||||||||||||
| Oct | Nov | Dec | Jan | Feb | Mar | Apr | May | Jun | Jul | Aug | Sep | Annual | |||
| Little Bighorn | |||||||||||||||
| 06289600 | West Pass Creek Near Parkman, WY | 522 | 485 | 460 | 421 | 377 | 469 | 647 | 1,126 | 1,038 | 584 | 406 | 415 | 6,949 | |
| 06289820 | East Pass Creek Near Dayton, WY | 620 | 578 | 551 | 506 | 458 | 592 | 790 | 1,407 | 1,317 | 673 | 398 | 475 | 8,364 | |
| 06289870 | Twin Creek Near Parkman, WY | 71 | 64 | 81 | 213 | 155 | 472 | 573 | 664 | 160 | 93 | 70 | 59 | 2,676 | |
| Tongue | |||||||||||||||
| 06302000 | Big Goose Creek Near Sheridan, WY | 2,116 | 1,637 | 1,536 | 1,310 | 1,136 | 1,244 | 2,545 | 14,220 | 14,547 | 5,167 | 3,833 | 2,937 | 52,227 | |
| 06303500 | Little Goose Creek in Canyon Near Big Horn, WY | 1,738 | 1,352 | 1,271 | 1,087 | 945 | 1,033 | 2,160 | 9,517 | 7,440 | 5,127 | 3,802 | 2,395 | 37,866 | |
| 06305500 | Goose Creek Below Sheridan, WY | 6,048 | 5,421 | 4,763 | 4,009 | 3,664 | 6,136 | 6,965 | 20,947 | 16,605 | 3,094 | 2,118 | 2,882 | 82,651 | |
| 06305700 | Goose Creek Near Acme, WY | 6,185 | 5,536 | 4,858 | 4,084 | 3,730 | 6,277 | 7,133 | 21,677 | 17,157 | 3,147 | 2,146 | 2,927 | 84,857 | |
| 06306250 | Prairie Dog Creek Near Acme, WY | 2,437 | 1,924 | 1,611 | 1,129 | 2,253 | 5,008 | 2,043 | 1,678 | 1,279 | 878 | 1,552 | 1,928 | 23,719 | |
| 06306300 | Tongue River at State Line Near Decker, MT | 14,045 | 12,138 | 8,888 | 8,018 | 8,497 | 16,247 | 19,902 | 61,280 | 43,982 | 10,638 | 6,433 | 7,775 | 217,843 | |
| Powder | |||||||||||||||
| 06309500 | Middle Fork Powder River Above Kaycee, WY | 2,616 | 2,537 | 2,419 | 2,362 | 2,125 | 2,471 | 5,738 | 10,427 | 4,480 | 2,483 | 2,065 | 2,177 | 41,898 | |
| 06311060 | North Fork Powder River Below Bull Creek Near Hazelton, WY | 238 | 137 | 131 | 117 | 104 | 134 | 415 | 2,289 | 2,342 | 2,011 | 1,313 | 719 | 9,949 | |
| 06311400 | North Fork Powder River Below Pass Creek Near Mayoworth, WY | 1,348 | 1,128 | 1,160 | 1,145 | 1,008 | 1,105 | 1,672 | 3,450 | 2,843 | 2,598 | 2,122 | 1,548 | 21,128 | |
| 06312500 | Powder River Near Kaycee, WY | 3,984 | 5,116 | 5,210 | 4,358 | 5,231 | 6,568 | 7,052 | 18,405 | 10,431 | 643 | 850 | 1,268 | 69,116 | |
| 06313000 | South Fork Powder River Near Kaycee, WY | 86 | 118 | 116 | 102 | 1,136 | 3,680 | 2,856 | 5,383 | 1,170 | 269 | 1,000 | 6 | 15,923 | |
| 06313400 | Salt Creek Near Sussex, WY | 1,962 | 1,848 | 1,795 | 1,885 | 2,721 | 2,888 | 2,282 | 2,930 | 2,355 | 2,618 | 1,773 | 1,885 | 26,941 | |
| 06313500 | Powder River at Sussex, WY | 6,572 | 7,446 | 7,294 | 6,924 | 9,824 | 12,733 | 11,749 | 17,875 | 6,632 | 5,191 | 3,572 | 2,639 | 98,450 | |
| SEO Gage | Crazy Woman Creek at Trabing Bridge Near Buffalo, WY | 330 | 204 | 221 | 210 | 153 | 193 | 1,013 | 1,442 | 1,788 | 852 | 607 | 293 | 7,307 | |
| 06316400 | Crazy Woman Creek at Upper Station Near Arvada, WY | 1,073 | 1,174 | 1,125 | 1,024 | 1,198 | 1,904 | 2,181 | 3,773 | 2,521 | 792 | 423 | 278 | 17,466 | |
| 06317000 | Powder River at Arvada, WY | 7,643 | 8,622 | 7,085 | 7,065 | 10,102 | 18,663 | 13,967 | 21,182 | 9,420 | 5,767 | 2,810 | 2,314 | 114,639 | |
| 06318500 | Clear Creek Near Buffalo, WY | 1,806 | 1,397 | 1,062 | 778 | 621 | 912 | 2,633 | 9,770 | 11,330 | 5,321 | 2,680 | 1,977 | 40,287 | |
| SEO Gage | Clear Creek in Buffalo City Park Buffalo, WY | 1,168 | 1,174 | 1,195 | 949 | 1,419 | 1,700 | 2,507 | 6,059 | 5,297 | 1,360 | 525 | 600 | 23,951 | |
| 06320000 | Rock Creek Near Buffalo, WY | 826 | 623 | 581 | 489 | 419 | 461 | 1,248 | 5,991 | 4,429 | 2,886 | 2,113 | 990 | 21,055 | |
| SEO Gage | Rock Creek at Mouth Near Buffalo, WY | 1,054 | 1,042 | 961 | 822 | 1,067 | 1,851 | 1,141 | 3,790 | 1,495 | 616 | 506 | 708 | 15,052 | |
| 06320200 | Clear Creek Below Rock Creek Near Buffalo, WY | 3,157 | 2,766 | 2,312 | 1,853 | 2,020 | 3,282 | 4,667 | 9,945 | 7,571 | 2,407 | 1,211 | 1,518 | 42,708 | |
| SEO Gage | Clear Creek Below Healy Reservoir Near Buffalo, WY | 1,647 | 1,448 | 1,248 | 1,052 | 1,480 | 2,101 | 3,662 | 8,955 | 6,790 | 3,071 | 1,722 | 1,527 | 34,703 | |
| 06321000 | South Piney Creek Near Story, WY | 1,735 | 1,225 | 1,214 | 1,033 | 803 | 895 | 1,370 | 4,880 | 16,184 | 9,925 | 7,096 | 4,360 | 50,719 | |
| 06323000 | Piney Creek at Kearney, WY | 1,401 | 1,985 | 1,785 | 1,713 | 1,514 | 1,740 | 4,029 | 12,630 | 8,558 | 2,033 | 784 | 497 | 38,670 | |
| SEO Gage | Little Piney Creek, WY | 766 | 760 | 636 | 627 | 589 | 941 | 809 | 1,082 | 623 | 660 | 538 | 586 | 8,616 | |
| SEO Gage | Piney Creek Below Lake DeSmet Tunnel Intake Near Story, WY | 974 | 552 | 422 | 387 | 356 | 458 | 2,180 | 8,305 | 6,194 | 2,871 | 1,073 | 1,094 | 24,865 | |
| 06323500 | Piney Creek at Ucross, WY | 3,235 | 3,416 | 3,367 | 3,181 | 1,307 | 1,717 | 3,657 | 7,110 | 8,503 | 7,061 | 4,634 | 3,715 | 50,904 | |
| SEO Gage | Clear Creek at Double Crossing Near Clearmont, WY | 7,063 | 7,196 | 6,881 | 6,323 | 5,321 | 6,584 | 7,413 | 15,042 | 12,668 | 8,499 | 6,054 | 5,085 | 94,127 | |
| SEO Gage | Clear Creek Below P&F#3 Ditch Near Clearmont, WY | 10,045 | 7,190 | 3,181 | 3,300 | 7,712 | 9,831 | 10,268 | 38,389 | 61,603 | 13,948 | 5,051 | 4,132 | 174,649 | |
| 06324000 | Clear Creek Near Arvada, WY | 6,687 | 6,744 | 5,449 | 5,313 | 4,172 | 8,956 | 8,859 | 13,104 | 9,400 | 4,922 | 3,449 | 3,796 | 80,849 | |
| 06324500 | Powder River at Moorhead, MT | 15,447 | 16,172 | 10,265 | 11,567 | 13,510 | 27,822 | 22,040 | 33,420 | 20,735 | 10,368 | 6,822 | 5,603 | 193,770 | |
| Little Powder | 06324890 | Little Powder River Below Corral Creek Near Weston, WY | 2 | 12 | 16 | 22 | 89 | 278 | 41 | 296 | 39 | 63 | 9 | 0 | 868 |
| 06324925 | Little Powder River Near Weston, WY | 19 | 26 | 30 | 24 | 319 | 399 | 284 | 474 | 220 | 64 | 169 | 13 | 2,041 | |
| 06324970 | Little Powder River Above Dry Creek Near Weston, WY | 41 | 54 | 69 | 60 | 481 | 630 | 480 | 737 | 383 | 127 | 111 | 17 | 3,189 | |
| Belle Fourche |
06426500 | Belle Fourche River Below Moorcroft, WY | 26 | 70 | 61 | 41 | 464 | 1,460 | 299 | 443 | 212 | 1,189 | 183 | 71 | 4,517 |
Table III-9
Summary of Normal Year Monthly and Annual Flows (1970 To 1999) -
Non-Natural Flow Stations
| Basin | Station Number | Station Name | Average Streamflow for 1970-1999 in Acre-Feet | ||||||||||||
| Oct | Nov | Dec | Jan | Feb | Mar | Apr | May | Jun | Jul | Aug | Sep | Annual | |||
| Little Bighorn | |||||||||||||||
| 06289600 | West Pass Creek Near Parkman, WY | 504 | 467 | 437 | 411 | 417 | 498 | 799 | 2,160 | 2,006 | 825 | 529 | 501 | 9,554 | |
| 06289820 | East Pass Creek Near Dayton, WY | 596 | 562 | 544 | 528 | 542 | 635 | 982 | 2,882 | 2,855 | 883 | 494 | 512 | 12,016 | |
| 06289870 | Twin Creek Near Parkman, WY | 124 | 105 | 137 | 370 | 270 | 783 | 909 | 1,820 | 398 | 173 | 129 | 98 | 5,316 | |
| Tongue | |||||||||||||||
| 06302000 | Big Goose Creek Near Sheridan, WY | 2,326 | 1,735 | 1,570 | 1,430 | 1,194 | 1,339 | 2,282 | 12,149 | 25,660 | 7,537 | 4,754 | 3,721 | 65,698 | |
| 06303500 | Little Goose Creek in Canyon Near Big Horn, WY | 1,847 | 1,384 | 1,250 | 1,126 | 945 | 1,057 | 2,189 | 10,298 | 14,356 | 6,323 | 5,629 | 3,521 | 49,924 | |
| 06305500 | Goose Creek Below Sheridan, WY | 6,814 | 5,975 | 5,231 | 4,636 | 5,507 | 5,947 | 8,728 | 23,311 | 37,384 | 8,686 | 4,240 | 6,047 | 122,506 | |
| 06305700 | Goose Creek Near Acme, WY | 6,974 | 6,107 | 5,341 | 4,729 | 5,627 | 6,080 | 8,953 | 24,129 | 38,842 | 8,919 | 4,325 | 6,185 | 126,210 | |
| 06306250 | Prairie Dog Creek Near Acme, WY | 2,839 | 2,208 | 1,848 | 1,309 | 2,689 | 5,514 | 2,968 | 2,928 | 2,289 | 1,335 | 1,630 | 2,521 | 30,078 | |
| 06306300 | Tongue River at State Line Near Decker, MT | 16,788 | 14,097 | 12,116 | 12,437 | 15,327 | 19,950 | 22,686 | 66,751 | 92,276 | 27,317 | 11,874 | 14,461 | 326,123 | |
| Powder | |||||||||||||||
| 06309500 | Middle Fork Powder River Above Kaycee, WY | 2,833 | 2,582 | 2,475 | 2,381 | 2,258 | 2,727 | 5,709 | 15,043 | 9,203 | 3,998 | 2,751 | 2,576 | 54,536 | |
| 06311060 | North Fork Powder River Below Bull Creek Near Hazelton, WY | 240 | 178 | 167 | 130 | 119 | 141 | 363 | 3,099 | 3,867 | 1,850 | 1,470 | 1,096 | 12,720 | |
| 06311400 | North Fork Powder River Below Pass Creek Near Mayoworth, WY | 1,303 | 1,116 | 1,119 | 1,084 | 971 | 1,069 | 1,688 | 4,781 | 5,035 | 2,692 | 2,343 | 1,915 | 25,116 | |
| 06312500 | Powder River Near Kaycee, WY | 4,911 | 6,163 | 6,250 | 5,456 | 6,193 | 8,182 | 8,671 | 27,220 | 16,087 | 1,025 | 811 | 1,775 | 92,743 | |
| 06313000 | South Fork Powder River Near Kaycee, WY | 159 | 215 | 149 | 166 | 1,198 | 7,158 | 5,540 | 8,230 | 1,974 | 608 | 1,676 | 11 | 27,086 | |
| 06313400 | Salt Creek Near Sussex, WY | 2,235 | 1,706 | 1,580 | 1,726 | 2,412 | 3,985 | 3,012 | 4,564 | 4,661 | 2,916 | 1,876 | 1,750 | 32,423 | |
| 06313500 | Powder River at Sussex, WY | 8,804 | 8,411 | 7,030 | 6,999 | 11,096 | 18,936 | 19,424 | 33,736 | 24,225 | 8,661 | 4,715 | 5,703 | 157,741 | |
| SEO Gage | Crazy Woman Creek at Trabing Bridge Near Buffalo, WY | 324 | 221 | 215 | 186 | 144 | 182 | 1,589 | 8,734 | 10,816 | 2,724 | 959 | 1,084 | 27,177 | |
| 06316400 | Crazy Woman Creek at Upper Station Near Arvada, WY | 1,419 | 1,319 | 961 | 811 | 1,793 | 2,626 | 3,724 | 8,073 | 7,100 | 2,075 | 1,083 | 974 | 31,956 | |
| 06317000 | Powder River at Arvada, WY | 9,874 | 9,343 | 6,922 | 6,424 | 12,141 | 24,059 | 23,302 | 44,564 | 38,014 | 13,330 | 6,608 | 6,543 | 201,124 | |
| 06318500 | Clear Creek Near Buffalo, WY | 2,258 | 1,534 | 1,184 | 881 | 742 | 970 | 2,622 | 11,564 | 17,291 | 7,889 | 3,941 | 2,840 | 53,714 | |
| SEO Gage | Clear Creek in Buffalo City Park Buffalo, WY | 1,413 | 1,131 | 871 | 736 | 924 | 1,738 | 2,159 | 9,095 | 13,292 | 4,229 | 1,565 | 1,501 | 38,653 | |
| 06320000 | Rock Creek Near Buffalo, WY | 893 | 651 | 578 | 519 | 431 | 485 | 946 | 6,726 | 8,800 | 3,682 | 2,774 | 1,684 | 28,169 | |
| SEO Gage | Rock Creek at Mouth Near Buffalo, WY | 1,401 | 1,292 | 952 | 870 | 1,214 | 2,267 | 1,322 | 4,706 | 6,204 | 1,592 | 957 | 925 | 23,702 | |
| 06320200 | Clear Creek Below Rock Creek Near Buffalo, WY | 3,910 | 3,267 | 2,698 | 2,618 | 3,170 | 4,190 | 5,369 | 16,040 | 22,192 | 7,063 | 3,307 | 3,584 | 77,409 | |
| SEO Gage | Clear Creek Below Healy Reservoir Near Buffalo, WY | 1,916 | 1,373 | 996 | 831 | 1,044 | 2,262 | 3,532 | 13,057 | 19,113 | 7,319 | 3,615 | 3,025 | 58,083 | |
| 06321000 | South Piney Creek Near Story, WY | 2,011 | 1,524 | 1,491 | 1,217 | 908 | 968 | 1,493 | 5,891 | 19,901 | 11,386 | 8,790 | 5,621 | 61,201 | |
| 06323000 | Piney Creek at Kearney, WY | 1,866 | 2,259 | 2,118 | 1,854 | 1,603 | 2,138 | 4,087 | 15,123 | 22,767 | 4,996 | 1,897 | 1,497 | 62,203 | |
| SEO Gage | Little Piney Creek, WY | 744 | 722 | 580 | 549 | 707 | 950 | 954 | 1,428 | 1,428 | 803 | 584 | 718 | 10,166 | |
| SEO Gage | Piney Creek Below Lake DeSmet Tunnel Intake Near Story, WY | 1,463 | 1,057 | 713 | 642 | 595 | 861 | 1,678 | 9,173 | 18,866 | 4,704 | 2,047 | 1,432 | 43,231 | |
| 06323500 | Piney Creek at Ucross, WY | 3,045 | 3,150 | 2,126 | 1,851 | 1,543 | 2,979 | 3,926 | 12,380 | 17,789 | 5,885 | 4,958 | 3,896 | 63,527 | |
| SEO Gage | Clear Creek at Double Crossing Near Clearmont, WY | 7,147 | 6,939 | 5,087 | 4,263 | 5,128 | 9,624 | 9,332 | 24,775 | 37,299 | 11,948 | 7,645 | 7,449 | 136,634 | |
| SEO Gage | Clear Creek Below P&F#3 Ditch Near Clearmont, WY | 6,599 | 5,483 | 4,320 | 4,630 | 6,173 | 10,641 | 7,800 | 19,529 | 38,577 | 12,655 | 6,281 | 5,376 | 128,064 | |
| 06324000 | Clear Creek Near Arvada, WY | 6,461 | 6,176 | 4,147 | 3,680 | 5,852 | 10,041 | 10,320 | 23,374 | 34,407 | 9,106 | 5,364 | 6,169 | 125,097 | |
| 06324500 | Powder River at Moorhead, MT | 16,672 | 14,954 | 10,739 | 10,319 | 20,648 | 36,869 | 31,922 | 62,461 | 71,190 | 23,837 | 11,879 | 12,535 | 324,023 | |
| Little Powder | 06324890 | Little Powder River Below Corral Creek Near Weston, WY | 8 | 14 | 21 | 60 | 187 | 713 | 138 | 837 | 84 | 296 | 41 | 0 | 2,399 |
| 06324925 | Little Powder River Near Weston, WY | 283 | 144 | 65 | 405 | 1,109 | 1,553 | 1,119 | 1,970 | 1,683 | 625 | 309 | 246 | 9,511 | |
| 06324970 | Little Powder River Above Dry Creek Near Weston, WY | 450 | 254 | 142 | 548 | 1,493 | 2,209 | 1,519 | 2,318 | 2,026 | 812 | 453 | 360 | 12,582 | |
| Belle Fourche |
06426500 | Belle Fourche River Below Moorcroft, WY | 846 | 276 | 205 | 494 | 1,513 | 3,406 | 2,128 | 2,920 | 1,675 | 804 | 418 | 376 | 15,059 |
Table III-10
Summary of Wet Year Monthly and Annual Flows (1970 To 1999) -
Non-Natural Flow Stations
| Basin | Station Number | Station Name | Average Streamflow for 1970-1999 in Acre-Feet | ||||||||||||
| Oct | Nov | Dec | Jan | Feb | Mar | Apr | May | Jun | Jul | Aug | Sep | Annual | |||
| Little Bighorn | |||||||||||||||
| 06289600 | West Pass Creek Near Parkman, WY | 580 | 489 | 427 | 437 | 397 | 554 | 790 | 2,821 | 3,336 | 1,121 | 468 | 608 | 12,027 | |
| 06289820 | East Pass Creek Near Dayton, WY | 710 | 600 | 520 | 549 | 484 | 684 | 1,035 | 3,727 | 4,598 | 1,411 | 517 | 721 | 15,555 | |
| 06289870 | Twin Creek Near Parkman, WY | 201 | 171 | 218 | 631 | 444 | 1,621 | 1,779 | 3,801 | 735 | 309 | 233 | 170 | 10,314 | |
| Tongue | |||||||||||||||
| 06302000 | Big Goose Creek Near Sheridan, WY | 2,438 | 1,792 | 1,633 | 1,532 | 1,276 | 1,423 | 1,844 | 15,206 | 43,642 | 15,021 | 5,115 | 4,027 | 94,948 | |
| 06303500 | Little Goose Creek in Canyon Near Big Horn, WY | 1,998 | 1,477 | 1,349 | 1,267 | 1,059 | 1,178 | 1,681 | 13,765 | 23,622 | 8,813 | 5,493 | 4,168 | 65,872 | |
| 06305500 | Goose Creek Below Sheridan, WY | 6,969 | 5,930 | 5,088 | 4,932 | 4,673 | 7,138 | 8,270 | 43,156 | 71,740 | 21,424 | 5,397 | 6,955 | 191,672 | |
| 06305700 | Goose Creek Near Acme, WY | 7,133 | 6,062 | 5,193 | 5,033 | 4,767 | 7,306 | 8,477 | 44,499 | 75,198 | 22,253 | 5,480 | 7,142 | 198,542 | |
| 06306250 | Prairie Dog Creek Near Acme, WY | 3,018 | 2,448 | 2,050 | 1,394 | 2,556 | 7,069 | 3,027 | 8,112 | 3,531 | 2,223 | 2,239 | 2,309 | 39,972 | |
| 06306300 | Tongue River at State Line Near Decker, MT | 16,527 | 14,165 | 11,352 | 10,340 | 10,940 | 21,038 | 21,378 | 108,313 | 172,233 | 55,478 | 16,727 | 15,543 | 473,035 | |
| Powder | |||||||||||||||
| 06309500 | Middle Fork Powder River Above Kaycee, WY | 2,946 | 2,927 | 2,605 | 2,432 | 2,273 | 2,817 | 5,514 | 18,856 | 15,840 | 5,414 | 3,479 | 3,002 | 68,105 | |
| 06311060 | North Fork Powder River Below Bull Creek Near Hazelton, WY | 241 | 175 | 161 | 139 | 133 | 159 | 332 | 4,356 | 6,662 | 2,508 | 1,899 | 1,134 | 17,899 | |
| 06311400 | North Fork Powder River Below Pass Creek Near Mayoworth, WY | 1,370 | 1,215 | 1,178 | 1,153 | 1,048 | 1,133 | 1,330 | 6,663 | 9,603 | 3,500 | 2,898 | 2,293 | 33,386 | |
| 06312500 | Powder River Near Kaycee, WY | 6,596 | 8,318 | 8,443 | 7,304 | 8,391 | 10,965 | 11,653 | 35,264 | 20,683 | 1,310 | 1,157 | 2,323 | 122,407 | |
| 06313000 | South Fork Powder River Near Kaycee, WY | 277 | 394 | 234 | 331 | 1,879 | 12,398 | 9,830 | 14,619 | 3,052 | 854 | 2,431 | 15 | 46,315 | |
| 06313400 | Salt Creek Near Sussex, WY | 2,618 | 2,134 | 1,994 | 2,179 | 2,928 | 6,372 | 3,697 | 10,353 | 4,264 | 3,944 | 2,299 | 2,130 | 44,913 | |
| 06313500 | Powder River at Sussex, WY | 17,455 | 10,548 | 8,768 | 8,082 | 9,846 | 19,191 | 17,354 | 73,310 | 51,299 | 14,882 | 4,663 | 4,747 | 240,144 | |
| SEO Gage | Crazy Woman Creek at Trabing Bridge Near Buffalo, WY | 342 | 248 | 227 | 213 | 167 | 205 | 2,705 | 16,980 | 32,197 | 7,031 | 2,723 | 1,346 | 64,382 | |
| 06316400 | Crazy Woman Creek at Upper Station Near Arvada, WY | 3,113 | 1,647 | 1,174 | 970 | 1,556 | 2,802 | 3,577 | 20,742 | 21,055 | 3,967 | 2,082 | 646 | 63,330 | |
| 06317000 | Powder River at Arvada, WY | 18,455 | 11,577 | 8,322 | 7,527 | 11,060 | 27,253 | 22,005 | 105,460 | 90,540 | 25,422 | 8,175 | 5,057 | 340,852 | |
| 06318500 | Clear Creek Near Buffalo, WY | 2,683 | 1,917 | 1,485 | 1,122 | 948 | 1,224 | 3,052 | 17,066 | 25,968 | 14,208 | 5,142 | 3,249 | 78,065 | |
| SEO Gage | Clear Creek in Buffalo City Park Buffalo, WY | 4,025 | 2,420 | 1,881 | 1,577 | 2,194 | 2,946 | 3,054 | 15,386 | 25,177 | 9,248 | 1,853 | 1,168 | 70,930 | |
| 06320000 | Rock Creek Near Buffalo, WY | 964 | 688 | 622 | 579 | 474 | 535 | 878 | 9,368 | 14,881 | 5,068 | 3,209 | 1,747 | 39,012 | |
| SEO Gage | Rock Creek at Mouth Near Buffalo, WY | 2,602 | 1,694 | 1,311 | 1,205 | 1,650 | 2,571 | 1,691 | 9,391 | 15,501 | 3,386 | 1,269 | 1,104 | 43,372 | |
| 06320200 | Clear Creek Below Rock Creek Near Buffalo, WY | 3,474 | 3,091 | 2,449 | 2,224 | 2,341 | 4,567 | 5,969 | 27,998 | 41,149 | 14,336 | 4,037 | 3,100 | 114,733 | |
| SEO Gage | Clear Creek Below Healy Reservoir Near Buffalo, WY | 5,612 | 3,084 | 2,263 | 1,852 | 2,658 | 3,530 | 4,435 | 26,501 | 39,607 | 14,794 | 4,335 | 3,255 | 111,926 | |
| 06321000 | South Piney Creek Near Story, WY | 2,333 | 1,720 | 1,708 | 1,457 | 1,168 | 1,244 | 1,749 | 6,581 | 22,873 | 17,609 | 10,733 | 5,829 | 75,004 | |
| 06323000 | Piney Creek at Kearney, WY | 2,432 | 2,775 | 2,159 | 2,103 | 1,710 | 2,037 | 4,070 | 20,980 | 41,967 | 13,590 | 3,830 | 1,340 | 98,991 | |
| SEO Gage | Little Piney Creek, WY | 925 | 830 | 582 | 642 | 833 | 1,030 | 1,054 | 2,734 | 2,540 | 1,336 | 722 | 707 | 13,933 | |
| SEO Gage | Piney Creek Below Lake DeSmet Tunnel Intake Near Story, WY | 2,259 | 1,558 | 1,144 | 1,004 | 927 | 1,280 | 2,549 | 17,464 | 38,497 | 10,973 | 3,374 | 1,762 | 82,791 | |
| 06323500 | Piney Creek at Ucross, WY | 4,880 | 4,201 | 3,459 | 3,078 | 2,221 | 4,190 | 4,203 | 18,650 | 42,300 | 14,719 | 6,525 | 3,190 | 111,616 | |
| SEO Gage | Clear Creek at Double Crossing Near Clearmont, WY | 13,916 | 9,888 | 8,067 | 6,929 | 8,629 | 11,825 | 10,678 | 47,150 | 86,491 | 28,773 | 8,955 | 6,602 | 247,901 | |
| SEO Gage | Clear Creek Below P&F#3 Ditch Near Clearmont, WY | 5,842 | 5,553 | 2,924 | 2,797 | 4,373 | 12,829 | 12,513 | 17,547 | 3,355 | 2,034 | 589 | 1,452 | 71,807 | |
| 06324000 | Clear Creek Near Arvada, WY | 9,179 | 7,200 | 3,891 | 4,404 | 7,135 | 10,514 | 11,838 | 45,277 | 78,252 | 26,470 | 7,949 | 5,007 | 217,115 | |
| 06324500 | Powder River at Moorhead, MT | 24,643 | 19,325 | 9,172 | 12,118 | 19,360 | 42,163 | 31,243 | 146,877 | 162,267 | 53,775 | 16,330 | 9,263 | 546,537 | |
| Little Powder | 06324890 | Little Powder River Below Corral Creek Near Weston, WY | 11 | 27 | 37 | 83 | 261 | 2,693 | 233 | 3,385 | 225 | 387 | 58 | 1 | 7,400 |
| 06324925 | Little Powder River Near Weston, WY | 2,316 | 180 | 143 | 562 | 9,553 | 16,317 | 6,268 | 9,079 | 2,733 | 377 | 279 | 53 | 47,860 | |
| 06324970 | Little Powder River Above Dry Creek Near Weston, WY | 2,722 | 485 | 375 | 1,195 | 7,548 | 14,241 | 2,977 | 13,336 | 3,498 | 1,177 | 553 | 323 | 48,430 | |
| Belle Fourche |
06426500 | Belle Fourche River Below Moorcroft, WY | 850 | 118 | 70 | 577 | 3,802 | 11,643 | 4,656 | 16,641 | 5,432 | 1,384 | 1,138 | 208 | 46,519 |
Table III-11
Summary of Dry Year Monthly and Annual Flows (1970 To 1999) -
Ungaged Natural Flow Nodes
| Basin | Station Name | Estimated Average Streamflow for 1970-1999 in Acre-Feet | ||||||||||||
| Oct | Nov | Dec | Jan | Feb | Mar | Apr | May | Jun | Jul | Aug | Sep | Annual | ||
| Tongue | Rapid Creek Just Below Little Rapid Creek in Section 32, T55N, R85W | 90 | 67 | 63 | 52 | 44 | 49 | 201 | 1,031 | 723 | 260 | 123 | 87 | 2,792 |
| Beaver Creek at Bottom of Section 26, T55N, R85W | 25 | 19 | 17 | 14 | 12 | 14 | 56 | 285 | 200 | 72 | 34 | 24 | 771 | |
| Soldier Creek at Right Edge of Section 28, T56N, R85W | 55 | 41 | 38 | 32 | 27 | 30 | 123 | 628 | 441 | 158 | 75 | 53 | 1,702 | |
| Prairie Dog Creek Just Above Dutch Creek in Section 34, T57N, R83W | 462 | 1,322 | 3,269 | 2,125 | 1,827 | 1,432 | 1,401 | 1,314 | 1,134 | 748 | 612 | 610 | 16,255 | |
| Powder | Red Fork Powder River Just Below North & South Forks Red Fork Powder River in Section 29, T44N, R84W | 24 | 24 | 19 | 20 | 15 | 23 | 118 | 335 | 105 | 33 | 18 | 17 | 752 |
| Kelly Creek at Top of Section 21, T49N, R82W | 49 | 37 | 28 | 22 | 18 | 21 | 173 | 531 | 330 | 106 | 56 | 41 | 1,414 | |
| Little North Fork Crazy Woman Creek Just Below Grossett Canyon in Section 14, T49N, R83W | 156 | 123 | 97 | 74 | 60 | 68 | 428 | 1,210 | 787 | 292 | 155 | 117 | 3,568 | |
| Muddy Creek at Diversion Near East Side of Section 35, T49N, R83W | 143 | 113 | 89 | 68 | 55 | 63 | 393 | 1,111 | 723 | 269 | 143 | 108 | 3,277 | |
| Billy Creek at Diversion to O.Malley Draw in Section 13, T48N, R83W | 2,116 | 1,637 | 1,536 | 1,310 | 1,136 | 1,244 | 2,545 | 14,220 | 14,547 | 5,167 | 3,833 | 2,937 | 52,227 | |
| Little Piney Creek Just Below Bear Gulch in Section 28, T53N, R83W | 332 | 336 | 601 | 616 | 820 | 626 | 564 | 407 | 341 | 245 | 309 | 282 | 5,480 | |
| North & South Forks Shell Creek (Combined), at Confluence of Little North Fork Shell Creek and North Fork Shell Creek in Section 11, and Confluence of Unnamed Tributary & South Fork Shell Creek in Section 14; all in T52N, R83W | 52 | 38 | 30 | 23 | 19 | 22 | 181 | 554 | 345 | 111 | 58 | 43 | 1,475 | |
| Johnson Creek at Top of Section 22, T51N, R83W | 49 | 37 | 28 | 22 | 18 | 21 | 173 | 531 | 330 | 106 | 56 | 41 | 1,414 | |
| French Creek at Penrose Ditch Diversion in Section 27, T51N, R83W | 119 | 88 | 68 | 53 | 43 | 51 | 416 | 1,275 | 793 | 256 | 134 | 99 | 3,395 | |
Table III-12
Summary of Normal Year Monthly and Annual Flows (1970 To 1999) -
Ungaged Natural Flow Nodes
| Basin | Station Name | Estimated Average Streamflow for 1970-1999 in Acre-Feet | ||||||||||||
| Oct | Nov | Dec | Jan | Feb | Mar | Apr | May | Jun | Jul | Aug | Sep | Annual | ||
| Tongue | Rapid Creek Just Below Little Rapid Creek in Section 32, T55N, R85W | 99 | 74 | 65 | 58 | 51 | 55 | 151 | 991 | 1,382 | 386 | 170 | 114 | 3,596 |
| Beaver Creek at Bottom of Section 26, T55N, R85W | 27 | 20 | 18 | 16 | 14 | 15 | 42 | 274 | 382 | 107 | 47 | 32 | 994 | |
| Soldier Creek at Right Edge of Section 28, T56N, R85W | 60 | 45 | 39 | 36 | 31 | 33 | 92 | 604 | 843 | 235 | 104 | 70 | 2,192 | |
| Prairie Dog Creek Just Above Dutch Creek in Section 34, T57N, R83W | 559 | 1,529 | 3,372 | 2,321 | 2,368 | 2,074 | 1,852 | 1,470 | 1,202 | 1,066 | 830 | 752 | 19,396 | |
| Powder | Red Fork Powder River Just Below North & South Forks Red Fork Powder River in Section 29, T44N, R84W | 34 | 31 | 25 | 27 | 23 | 41 | 215 | 515 | 238 | 64 | 32 | 28 | 1,272 |
| Kelly Creek at Top of Section 21, T49N, R82W | 55 | 42 | 35 | 27 | 23 | 26 | 99 | 685 | 654 | 200 | 88 | 63 | 1,998 | |
| Little North Fork Crazy Woman Creek Just Below Grossett Canyon in Section 14, T49N, R83W | 177 | 128 | 107 | 85 | 71 | 81 | 280 | 1,360 | 1,363 | 488 | 243 | 182 | 4,563 | |
| Muddy Creek at Diversion Near East Side of Section 35, T49N, R83W | 162 | 118 | 98 | 78 | 65 | 75 | 257 | 1,249 | 1,252 | 448 | 243 | 182 | 4,563 | |
| Billy Creek at Diversion to O.Malley Draw in Section 13, T48N, R83W | 2,326 | 1,735 | 1,570 | 1,430 | 1,194 | 1,339 | 2,282 | 12,149 | 25,660 | 7,537 | 4,754 | 3,721 | 65,698 | |
| Little Piney Creek Just Below Bear Gulch in Section 28, T53N, R83W | 298 | 422 | 610 | 672 | 1,086 | 1,143 | 678 | 483 | 465 | 271 | 309 | 264 | 6,691 | |
| North & South Forks Shell Creek (Combined), at Confluence of Little North Fork Shell Creek and North Fork Shell Creek in Section 11, and Confluence of Unnamed Tributary & South Fork Shell Creek in Section 14; all in T52N, R83W | 57 | 44 | 36 | 28 | 24 | 27 | 103 | 715 | 682 | 208 | 92 | 66 | 2,084 | |
| Johnson Creek at Top of Section 22, T51N, R83W | 55 | 42 | 35 | 27 | 23 | 26 | 99 | 685 | 654 | 200 | 88 | 63 | 1,998 | |
| French Creek at Penrose Ditch Diversion in Section 27, T51N, R83W | 132 | 101 | 84 | 65 | 56 | 63 | 237 | 1,646 | 1,570 | 480 | 212 | 151 | 4,797 | |
Table III-13
Summary of Wet Year Monthly and Annual Flows (1970 To 1999) -
Ungaged Natural Flow Nodes
| Basin | Station Name | Estimated Average Streamflow for 1970-1999 in Acre-Feet | ||||||||||||
| Oct | Nov | Dec | Jan | Feb | Mar | Apr | May | Jun | Jul | Aug | Sep | Annual | ||
| Tongue | Rapid Creek Just Below Little Rapid Creek in Section 32, T55N, R85W | 103 | 75 | 67 | 61 | 50 | 58 | 124 | 1,246 | 2,396 | 620 | 210 | 210 | 5,130 |
| Beaver Creek at Bottom of Section 26, T55N, R85W | 29 | 21 | 19 | 17 | 14 | 16 | 34 | 344 | 662 | 171 | 58 | 33 | 1,418 | |
| Soldier Creek at Right Edge of Section 28, T56N, R85W | 63 | 46 | 41 | 37 | 30 | 35 | 76 | 760 | 1,460 | 378 | 128 | 73 | 3,127 | |
| Prairie Dog Creek Just Above Dutch Creek in Section 34, T57N, R83W | 439 | 1,090 | 3,718 | 2,241 | 6,284 | 3,382 | 2,637 | 1,896 | 1,423 | 845 | 733 | 657 | 25,344 | |
| Powder | Red Fork Powder River Just Below North & South Forks Red Fork Powder River in Section 29, T44N, R84W | 50 | 44 | 36 | 41 | 33 | 60 | 316 | 925 | 390 | 100 | 46 | 39 | 2,081 |
| Kelly Creek at Top of Section 21, T49N, R82W | 52 | 41 | 33 | 30 | 23 | 29 | 75 | 773 | 1,280 | 343 | 110 | 65 | 2,854 | |
| Little North Fork Crazy Woman Creek Just Below Grossett Canyon in Section 14, T49N, R83W | 145 | 116 | 95 | 81 | 71 | 86 | 227 | 1,837 | 2,442 | 824 | 317 | 188 | 6,429 | |
| Muddy Creek at Diversion Near East Side of Section 35, T49N, R83W | 133 | 107 | 87 | 75 | 66 | 79 | 209 | 1,687 | 2,243 | 757 | 291 | 173 | 5,905 | |
| Billy Creek at Diversion to O.Malley Draw in Section 13, T48N, R83W | 2,438 | 1,792 | 1,633 | 1,532 | 1,276 | 1,423 | 1,844 | 15,206 | 43,642 | 15,021 | 5,115 | 4,027 | 94,948 | |
| Little Piney Creek Just Below Bear Gulch in Section 28, T53N, R83W | 351 | 505 | 664 | 740 | 1,979 | 1,982 | 1,190 | 741 | 604 | 411 | 397 | 271 | 9,837 | |
| North & South Forks Shell Creek (Combined), at Confluence of Little North Fork Shell Creek and North Fork Shell Creek in Section 11, and Confluence of Unnamed Tributary & South Fork Shell Creek in Section 14; all in T52N, R83W | 54 | 42 | 34 | 31 | 24 | 30 | 78 | 807 | 1,336 | 358 | 115 | 67 | 2,978 | |
| Johnson Creek at Top of Section 22, T51N, R83W | 52 | 41 | 33 | 30 | 23 | 29 | 75 | 773 | 1,280 | 343 | 110 | 65 | 2,854 | |
| French Creek at Penrose Ditch Diversion in Section 27, T51N, R83W | 125 | 98 | 79 | 71 | 54 | 70 | 180 | 1,857 | 3,074 | 825 | 265 | 155 | 6,854 | |
Spreadsheet Model Development and Calibration
Water availability spreadsheet models were developed for the following six sub-basins within the Powder/Tongue River Basin planning area:
The models developed for this plan are intended to simulate water use and availability under existing conditions. For each Powder/Tongue River sub-basin, three models were developed, reflecting each of the three hydrologic conditions (dry, normal, and wet years). The models each represent one calendar year of flows, on a monthly time step. Streamflow, estimated actual diversions, full supply diversions, irrigation returns, and reservoir conditions are the basic input data to the models. For all of these data, average values drawn from the dry, normal, or wet years of the study period were computed for use in the spreadsheets.
Theoretical Maximum Diversion Requirements were calculated using the acreage of irrigated lands mapped through this study and the consumptive irrigation requirements (CIR) provided by Dr. Larry Pochop. The historical diversion records were then compared to the Theoretical Maximum Diversions yielding mathematical relationships used to calculate the Estimated Actual Diversions and the Full Supply Diversion Requirements for all modeled irrigated lands. A more detailed discussion of this process is offered in the .Agricultural Use. technical memorandum.
Development of the model and the model inputs (primarily streamflows, estimated actual diversions and the interrelated irrigation efficiencies and irrigation return flows) progressed somewhat concurrently in order to achieve calibration. The model representation of the physical system and the various model inputs were adjusted as necessary through a trial and error process until the models were reasonably well calibrated.
To mathematically represent each sub-basin, the river system was divided into reaches based primarily upon the location of major tributary confluences. Each reach was then sub-divided by identifying a series of individual nodes representing diversions, reservoirs, tributary confluences, gages, or other significant water resources features. The resulting network is a simplified representation of actual conditions. Figures III-9 through III-14 present node diagrams of the sub-basin models developed for the planning area.
Historical or virgin flow for each month is supplied to the model at the uppermost node. Where available, upper basin gages were selected as the uppermost model nodes; in their absence, flow at the ungaged headwater point was estimated as discussed in a preceding section. For each reach, incremental stream gains (e.g., ungaged tributaries, ground water inflow, and inflow resulting from man-induced but unmodeled processes) and losses (e.g. seepage, evaporation, and unspecified diversions) are computed by the spreadsheet. These are calculated by adding the net modeled effects (diversions and increases in storage less return flows and decreases in storage) within the basin back into the difference between the upstream and downstream historical gage flows.
At each node, a water budget computation is completed to determine the amount of water that bypasses the node. At non-storage nodes, the difference between inflow, including upstream inflows, return flows, imports and basin gains, and outflows, including diversions, basin losses and exports, is the amount of flow available to the next node downstream. For storage nodes, an additional loss calculation for evaporation and the change in storage is evaluated. Also at storage nodes, any uncontrolled spill that occurs is added to the scheduled release to determine total outflow. Diverted amounts at diversion nodes are the minimum of demand (the full supply diversion at the structure) and physically available streamflow. The mass balance, or water budget calculations, is performed for all nodes in a reach.
Model output includes the full-supply diversion demand and model simulated diversions at each of the diversion points, and streamflow at each of the Powder/Tongue River sub-basin model nodes. Estimates of impacts associated with various water projects can be analyzed by changing input data, as decreases in available streamflow or as changes to diversions occur. New storage projects that alter the timing of streamflows or shortages may also be evaluated.
Model Development and Structure
The model was developed using Microsoft® Excel 97. The workbooks contain macros written in the Microsoft® Visual Basic for Applications programming language. The primary function of the macros is to facilitate navigation within the workbook.
Each of the Powder/Tongue River sub-basin models is a workbook consisting of numerous individual pages (worksheets). Each worksheet is a component of the model and completes a specific task required for execution of the model. There are five basic types of worksheets:
Determination of Available Surface Water
The estimated amount of water flowing through each of the various model reaches, as previously described, provides the primary basis for determining how much water is physically available for future development. Reaches are typically defined by gages or confluences, and represent tributary basins or subsections of the mainstem. A Reach Outflow worksheet is provided in each model, summarizing the monthly flow at the downstream end of each reach. The information provided in these summaries is used for this analysis.
While simulated flow at the reach terminus indicates the estimated amount of water physically present, it does not fully reflect availability. Downstream demands relying on the water physically available at any given location must first be accounted for. These downstream demands fall into three general categories:
To determine how much of the physical supply is actually available in excess of existing demands, .available flow. at each reach terminus is defined as the minimum of the physically available flow at that point, and the .available flow. at all downstream reaches. Thus available flow must be defined first at the most downstream point, with upstream availability calculated in stream order. These calculations are made on a monthly basis, and annual water availability is computed as the sum of monthly values.
Instream Flow Constraints
Instream flow rights exert a demand on the river but do not affect physical supply, because the water is not removed from the stream. Sufficient flow must be bypassed through upstream reaches to satisfy downstream instream flow requirements. The available flow for reaches located upstream from permitted instream flows are determined as the minimum of physical flow at that point, and available flow in excess of existing diversion demands less the instream flow requirement at the downstream reach.
With only one exception, all of the six instream flow rights within the planning area are located above the most upstream reach explicitly simulated in the model. The available flow for future development reported herein, therefore, is downstream from most of these instream flow constraints. The exception is a 9.86-mile long reach of the Middle Fork Powder River with a 1987 priority instream flow requirement of 12 to 25 cfs. The available flow in Reach 2 of the Powder River sub-basin was calculated taking this instream flow demand into consideration.
The reach by reach results of the monthly available flow determination, accounting for the instream flow constraints, are provided in Tables III-15 through III-32 for each of the six sub- basins and for each of the three hydrologic conditions (wet, normal, and dry years). The total annual available flow is summarized in Table III-14 for each sub-basin and hydrologic condition. The locations of these available flows are also shown graphically on Figures III-15 through III- 20 for the limiting dry year conditions.
Table III-14
Total Annual Available Flow
| Subbasin | Hydrologic Condition | ||
| Wet Years | Normal Years | Dry Years | |
| Little Bighorn River | 152,000 | 113,000 | 81,000 |
| Tongue River | 473,000 | 326,000 | 218,000 |
| Clear Creek | 213,000 | 124,000 | 80,000 |
| Crazy Woman Creek | 69,000 | 32,000 | 16,000 |
| Powder River | 547,000 | 324,000 | 194,000 |
| Little Powder River | 48,000 | 12,000 | 3,000 |
Table III-15
Available Flow for Little Bighorn Basin (Acre-Feet) -
Wet Year Hydrologic Conditions
| Reach | Reach Name | Jan | Feb | Mar | Apr | May | Jun | Jul | Aug | Sep | Oct | Nov | Dec | Annual |
| 1 | East Pass Cr below USGS gage 06289800 | 549 | 484 | 684 | 1,035 | 3,727 | 4,598 | 1,411 | 517 | 721 | 710 | 600 | 210 | 15,555 |
| 2 | East Pass Cr below USGS gage 06289820 | 568 | 496 | 690 | 1,035 | 3,741 | 4,636 | 1,458 | 573 | 788 | 760 | 638 | 549 | 15,931 |
| 3 | Elkhorn Creek below USGS gage 06288975 | 89 | 81 | 92 | 136 | 711 | 1,115 | 315 | 147 | 150 | 118 | 102 | 95 | 3,153 |
| 4 | 'Red Canyon Creek below USGS gage 06289100 | 46 | 37 | 66 | 346 | 1,001 | 421 | 105 | 48 | 44 | 60 | 52 | 42 | 2,268 |
Table III-16
Available Flow for Little Bighorn Basin (Acre-Feet) -
Normal Year Hydrologic Conditions
| Reach | Reach Name | Jan | Feb | Mar | Apr | May | Jun | Jul | Aug | Sep | Oct | Nov | Dec | Annual |
| 1 | East Pass Cr below USGS gage 06289800 | 528 | 542 | 635 | 982 | 2,882 | 2,855 | 883 | 494 | 512 | 596 | 562 | 544 | 12,016 |
| 2 | East Pass Cr below USGS gage 06289820 | 549 | 556 | 643 | 988 | 2,906 | 2,902 | 937 | 556 | 589 | 654 | 605 | 575 | 12,461 |
| 3 | Elkhorn Creek below USGS gage 06288975 | 86 | 75 | 88 | 137 | 464 | 592 | 174 | 124 | 114 | 116 | 101 | 92 | 2,164 |
| 4 | 'Red Canyon Creek below USGS gage 06289100 | 29 | 24 | 43 | 213 | 544 | 238 | 61 | 29 | 28 | 40 | 35 | 28 | 1,313 |
Table III-17
Available Flow for Little Bighorn Basin (Acre-Feet) -
Dry Year Hydrologic Conditions
| Reach | Reach Name | Jan | Feb | Mar | Apr | May | Jun | Jul | Aug | Sep | Oct | Nov | Dec | Annual |
| 1 | East Pass Cr below USGS gage 06289800 | 506 | 458 | 592 | 790 | 1,407 | 1,317 | 673 | 398 | 475 | 620 | 578 | 551 | 8,364 |
| 2 | East Pass Cr below USGS gage 06289820 | 527 | 472 | 600 | 804 | 1,455 | 1,387 | 743 | 470 | 565 | 688 | 628 | 586 | 8,926 |
| 3 | Elkhorn Creek below USGS gage 06288975 | 81 | 70 | 83 | 141 | 317 | 246 | 133 | 109 | 91 | 104 | 97 | 90 | 1,562 |
| 4 | 'Red Canyon Creek below USGS gage 06289100 | 23 | 17 | 24 | 125 | 258 | 101 | 32 | 20 | 23 | 29 | 28 | 22 | 702 |
Table III-18
Available Flow for Tongue River Basin (Acre-Feet) -
Wet Year Hydrologic Conditions
| Reach | Reach Name | Jan | Feb | Mar | Apr | May | Jun | Jul | Aug | Sep | Oct | Nov | Dec | Annual |
| 1 | Tongue River above Little Tongue River | 3,493 | 3,099 | 4,101 | 5,652 | 34,863 | 69,125 | 25,201 | 8,354 | 5,454 | 5,369 | 4,132 | 3,715 | 172,557 |
| 2 | Little Tongue River | 132 | 109 | 151 | 334 | 4,235 | 7,620 | 1,320 | 56 | 0 | 238 | 164 | 143 | 14,502 |
| 3 | Tongue River above Wolf Creek | 3,826 | 3,343 | 4,325 | 5,986 | 39,098 | 76,744 | 26,521 | 8,410 | 5,454 | 6,123 | 4,689 | 4,156 | 188,675 |
| 4 | Wolf Creek | 507 | 395 | 456 | 736 | 7,343 | 12,285 | 2,000 | 0 | 10 | 1,014 | 765 | 630 | 26,141 |
| 5 | Tongue River above Goose Creek | 4,443 | 3,889 | 4,866 | 6,723 | 46,441 | 89,029 | 28,521 | 8,410 | 5,464 | 7,481 | 5,891 | 4,915 | 216,074 |
| 6 | Big Goose Creek above Rapid Creek | 904 | 1,286 | 2,907 | 3,434 | 20,500 | 45,977 | 15,058 | 2,911 | 3,258 | 1,898 | 1,341 | 1,169 | 100,643 |
| 7 | Rapid Creek | 69 | 73 | 140 | 48 | 622 | 1,269 | 914 | 0 | 0 | 113 | 91 | 79 | 3,418 |
| 8 | Big Goose Creek above Beaver Creek | 1,124 | 1,461 | 3,103 | 3,483 | 21,123 | 47,246 | 15,972 | 2,911 | 3,258 | 2,218 | 1,725 | 1,471 | 105,095 |
| 9 | Beaver Creek | 93 | 60 | 52 | 73 | 492 | 715 | 180 | 88 | 71 | 220 | 186 | 142 | 2,373 |
| 10 | Big Goose Creek above Little Goose Creek | 1,400 | 1,633 | 3,209 | 3,561 | 21,649 | 48,030 | 16,152 | 2,998 | 3,329 | 2,438 | 2,037 | 1,704 | 108,141 |
| 11 | Little Goose Creek | 2,224 | 2,093 | 3,152 | 3,297 | 17,881 | 21,368 | 4,782 | 1,962 | 3,047 | 3,462 | 2,966 | 2,478 | 68,712 |
| 12 | Goose Creek above Soldier Creek | 3,931 | 3,983 | 6,542 | 7,735 | 41,796 | 70,136 | 20,934 | 4,960 | 6,376 | 5,901 | 5,002 | 4,182 | 181,477 |
| 13 | Soldier Creek | 975 | 690 | 596 | 535 | 1,360 | 1,604 | 490 | 436 | 579 | 1,013 | 928 | 806 | 10,013 |
| 14 | Goose Creek below Soldier Creek | 4,906 | 4,767 | 7,306 | 8,477 | 44,499 | 75,198 | 22,253 | 5,480 | 7,142 | 6,914 | 6,062 | 4,988 | 197,990 |
| 15 | Goose Creek above Tongue River | 4,906 | 5,011 | 9,233 | 10,526 | 51,560 | 78,270 | 24,483 | 5,480 | 7,566 | 6,914 | 6,182 | 4,988 | 215,479 |
| 16 | Tongue River above Prairie Dog Creek | 9,349 | 8,940 | 14,121 | 17,249 | 98,002 | 167,299 | 53,003 | 14,251 | 13,030 | 14,395 | 12,185 | 9,903 | 431,727 |
| 17 | Prairie Dog Creek above USGS gage 06306250 | 991 | 1,816 | 5,423 | 3,027 | 8,112 | 3,531 | 2,223 | 2,239 | 2,303 | 2,132 | 1,815 | 1,449 | 35,063 |
| 18 | Prairie Dog Creek above Tongue River | 991 | 1,909 | 6,853 | 3,768 | 9,419 | 3,687 | 2,475 | 2,476 | 2,513 | 2,132 | 1,851 | 1,449 | 39,522 |
| 19 | Tongue River above State Line | 10,340 | 10,940 | 21,038 | 21,378 | 108,313 | 171,233 | 55,478 | 16,727 | 15,543 | 16,527 | 14,165 | 11,352 | 473,035 |
Table III-19
Available Flow for Tongue River Basin (Acre-Feet) -
Normal Year Hydrologic Conditions
| Reach | Reach Name | Jan | Feb | Mar | Apr | May | Jun | Jul | Aug | Sep | Oct | Nov | Dec | Annual |
| 1 | Tongue River above Little Tongue River | 4,097 | 3,785 | 4,287 | 6,797 | 31,196 | 40,228 | 14,135 | 5,834 | 4,768 | 5,298 | 4,087 | 3,729 | 128,239 |
| 2 | Little Tongue River | 153 | 146 | 167 | 389 | 2,860 | 3,579 | 524 | 0 | 0 | 224 | 162 | 140 | 8,344 |
| 3 | Tongue River above Wolf Creek | 4,440 | 4,054 | 4,518 | 7,186 | 34,055 | 43,806 | 14,659 | 5,834 | 4,768 | 6,046 | 4,654 | 4,166 | 138,186 |
| 4 | Wolf Creek | 549 | 469 | 459 | 779 | 4,696 | 6,156 | 603 | 0 | 66 | 1,000 | 763 | 615 | 16,155 |
| 5 | Tongue River above Goose Creek | 5,203 | 4,663 | 5,051 | 7,965 | 38,751 | 49,962 | 15,262 | 5,834 | 5,061 | 7,484 | 5,868 | 5,113 | 156,217 |
| 6 | Big Goose Creek above Rapid Creek | 1,167 | 1,996 | 2,534 | 3,506 | 12,104 | 24,197 | 4,773 | 2,016 | 1,844 | 1,864 | 1,365 | 1,191 | 58,558 |
| 7 | Rapid Creek | 71 | 105 | 122 | 0 | 0 | 1,735 | 104 | 0 | 0 | 99 | 90 | 76 | 2,402 |
| 8 | Big Goose Creek above Beaver Creek | 1,383 | 2,196 | 2,705 | 3,506 | 12,104 | 25,933 | 4,877 | 2,016 | 2,077 | 2,219 | 1,758 | 1,491 | 62,264 |
| 9 | Beaver Creek | 98 | 71 | 51 | 62 | 292 | 386 | 117 | 74 | 132 | 247 | 207 | 154 | 1,890 |
| 10 | Big Goose Creek above Little Goose Creek | 1,663 | 2,378 | 2,808 | 3,568 | 12,431 | 26,426 | 5,152 | 2,090 | 2,604 | 2,466 | 2,129 | 1,877 | 65,590 |
| 11 | Little Goose Creek | 2,131 | 2,441 | 2,613 | 3,370 | 9,008 | 9,619 | 1,226 | 1,802 | 2,081 | 3,388 | 2,962 | 2,569 | 43,210 |
| 12 | Goose Creek above Soldier Creek | 3,957 | 4,959 | 5,472 | 8,222 | 22,407 | 36,483 | 8,086 | 3,892 | 5,273 | 5,854 | 5,091 | 4,446 | 114,140 |
| 13 | Soldier Creek | 679 | 548 | 475 | 507 | 905 | 901 | 600 | 348 | 774 | 960 | 884 | 786 | 8,366 |
| 14 | Goose Creek below Soldier Creek | 4,729 | 5,627 | 6,080 | 8,953 | 24,129 | 38,824 | 8,919 | 4,325 | 6,185 | 6,832 | 6,107 | 5,341 | 126,069 |
| 15 | Goose Creek above Tongue River | 5,712 | 7,430 | 8,224 | 10,623 | 24,604 | 39,850 | 9,845 | 4,327 | 6,513 | 6,832 | 6,107 | 5,341 | 135,408 |
| 16 | Tongue River above Prairie Dog Creek | 10,970 | 12,129 | 13,293 | 18,588 | 63,356 | 89,813 | 25,107 | 10,161 | 11,574 | 14,317 | 12,091 | 10,471 | 291,870 |
| 17 | Prairie Dog Creek above USGS gage 06306250 | 1,174 | 2,419 | 4,913 | 2,968 | 2,928 | 2,289 | 1,335 | 1,630 | 2,521 | 2,471 | 1,977 | 1,644 | 28,268 |
| 18 | Prairie Dog Creek above Tongue River | 1,418 | 3,193 | 6,645 | 3,535 | 3,000 | 2,364 | 1,511 | 1,713 | 2,727 | 2,471 | 1,977 | 1,644 | 32,198 |
| 19 | Tongue River above State Line | 12,437 | 15,372 | 19,950 | 22,686 | 66,751 | 92,276 | 27,317 | 11,874 | 14,461 | 16,788 | 14,097 | 12,116 | 326,123 |
Table III-20
Available Flow for Tongue River Basin (Acre-Feet) -
Dry Year Hydrologic Conditions
| Reach | Reach Name | Jan | Feb | Mar | Apr | May | Jun | Jul | Aug | Sep | Oct | Nov | Dec | Annual |
| 1 | Tongue River above Little Tongue River | 3,004 | 2,653 | 3,226 | 7,848 | 31,008 | 19,377 | 5,581 | 3,057 | 2,722 | 4,730 | 3,749 | 3,259 | 90,215 |
| 2 | Little Tongue River | 107 | 90 | 113 | 353 | 2,579 | 1,392 | 0 | 0 | 0 | 193 | 143 | 122 | 5,092 |
| 3 | Tongue River above Wolf Creek | 3,111 | 2,773 | 3,408 | 8,201 | 33,587 | 20,768 | 5,581 | 3,057 | 2,722 | 5,505 | 4,368 | 3,381 | 96,462 |
| 4 | Wolf Creek | 394 | 313 | 348 | 606 | 4,271 | 2,173 | 0 | 0 | 26 | 969 | 747 | 503 | 10,350 |
| 5 | Tongue River above Goose Creek | 3,505 | 3,086 | 3,840 | 8,807 | 37,857 | 22,941 | 5,581 | 3,057 | 3,017 | 6,474 | 5,283 | 3,884 | 107,333 |
| 6 | Big Goose Creek above Rapid Creek | 1,019 | 1,132 | 2,622 | 2,573 | 13,498 | 9,327 | 84 | 0 | 0 | 1,631 | 1,265 | 1,154 | 34,305 |
| 7 | Rapid Creek | 64 | 64 | 123 | 0 | 0 | 584 | 0 | 0 | 0 | 74 | 87 | 76 | 1,073 |
| 8 | Big Goose Creek above Beaver Creek | 1,216 | 1,276 | 2,789 | 2,573 | 13,498 | 9,911 | 97 | 102 | 202 | 1,773 | 1,656 | 1,281 | 36,374 |
| 9 | Beaver Creek | 52 | 29 | 37 | 0 | 282 | 192 | 48 | 12 | 0 | 174 | 175 | 100 | 1,101 |
| 10 | Big Goose Creek above Little Goose Creek | 1,312 | 1,341 | 2,868 | 2,573 | 13,779 | 10,333 | 373 | 376 | 526 | 1,947 | 1,831 | 1,381 | 38,641 |
| 11 | Little Goose Creek | 1,661 | 1,581 | 2,723 | 1,357 | 6,347 | 1,038 | 887 | 932 | 1,042 | 2,661 | 2,468 | 1,789 | 24,485 |
| 12 | Goose Creek above Soldier Creek | 2,973 | 2,922 | 5,636 | 6,367 | 20,126 | 15,795 | 2,242 | 1,502 | 2,100 | 4,607 | 4,299 | 3,170 | 71,738 |
| 13 | Soldier Creek | 602 | 514 | 501 | 598 | 821 | 810 | 671 | 379 | 649 | 909 | 861 | 638 | 7,952 |
| 14 | Goose Creek below Soldier Creek | 3,575 | 3,436 | 6,277 | 7,133 | 21,677 | 17,157 | 2,912 | 1,880 | 2,749 | 5,517 | 5,160 | 3,808 | 81,280 |
| 15 | Goose Creek above Tongue River | 3,575 | 3,436 | 7,041 | 7,615 | 21,726 | 17,598 | 2,912 | 1,880 | 2,749 | 5,517 | 5,160 | 3,808 | 83,018 |
| 16 | Tongue River above Prairie Dog Creek | 7,080 | 6,522 | 10,881 | 16,422 | 59,584 | 40,540 | 8,494 | 4,938 | 5,765 | 11,990 | 10,443 | 7,692 | 190,351 |
| 17 | Prairie Dog Creek above USGS gage 06306250 | 938 | 1,975 | 4,793 | 2,043 | 1,678 | 1,279 | 878 | 1,496 | 1,928 | 2,055 | 1,695 | 1,196 | 21,953 |
| 18 | Prairie Dog Creek above Tongue River | 938 | 1,975 | 5,366 | 2,208 | 1,696 | 1,335 | 878 | 1,496 | 1,928 | 2,055 | 1,695 | 1,196 | 22,765 |
| 19 | Tongue River above State Line | 8,018 | 8,497 | 16,247 | 19,902 | 61,280 | 43,982 | 10,638 | 6,433 | 7,775 | 14,045 | 12,138 | 8,888 | 217,843 |
Table III-21
Available Flow for Clear Creek Basin (Acre-Feet) -
Wet Year Hydrologic Conditions
| Reach | Reach Name | Jan | Feb | Mar | Apr | May | Jun | Jul | Aug | Sep | Oct | Nov | Dec | Annual |
| 1 | North Piney Creek | 225 | 215 | 333 | 1,155 | 10,872 | 16,085 | 2,167 | 415 | 182 | 556 | 400 | 225 | 32,862 |
| 2 | South Piney Creek | 779 | 712 | 947 | 1,393 | 6,134 | 20,952 | 8,806 | 2,959 | 1,158 | 1,702 | 1,158 | 889 | 47,589 |
| 3 | Piney Creek below North & South Piney Creeks | 1,004 | 927 | 1,280 | 2,549 | 17,006 | 37,038 | 10,973 | 3,374 | 1,340 | 2,259 | 1,558 | 1,444 | 80,451 |
| 4 | Piney Creek below USGS gage 06323000 | 1,004 | 927 | 1,280 | 2,549 | 17,006 | 37,038 | 10,973 | 3,374 | 1,762 | 2,259 | 1,558 | 1,444 | 80,873 |
| 5 | Piney Creek below Lake DeSmet Intake Tunnel | 1,655 | 1,142 | 2,336 | 3,204 | 17,006 | 37,038 | 12,311 | 4,386 | 1,852 | 2,655 | 2,529 | 1,150 | 87,264 |
| 6 | Little Piney Creek above SEO gage | 642 | 833 | 1,030 | 904 | 1,426 | 2,311 | 1,336 | 722 | 707 | 925 | 830 | 582 | 12,246 |
| 7 | Little Piney Creek above Piney Creek | 1,058 | 960 | 1,786 | 904 | 1,426 | 2,311 | 1,434 | 939 | 743 | 1,087 | 1,346 | 585 | 14,578 |
| 8 | Piney Creek below Little Piney Creek | 2,712 | 2,191 | 4,172 | 4,108 | 18,431 | 39,348 | 13,745 | 5,325 | 2,595 | 3,742 | 4,072 | 1,736 | 102,179 |
| 10 | Piney Creek below Box Elder Creek | 2,712 | 2,221 | 4,190 | 4,203 | 18,431 | 39,348 | 13,745 | 5,325 | 2,595 | 3,742 | 4,072 | 1,736 | 102,322 |
| 11 | Piney Creek above Clear Creek | 2,712 | 3,224 | 5,689 | 5,198 | 18,431 | 39,348 | 13,745 | 5,325 | 2,595 | 3,742 | 4,072 | 1,736 | 105,819 |
| 12 | Rock Creek | 524 | 815 | 1,408 | 1,274 | 8,173 | 12,220 | 2,799 | 769 | 615 | 1,008 | 863 | 330 | 30,798 |
| 13 | Johnson Creek | 48 | 50 | 83 | 38 | 326 | 456 | 0 | 0 | 0 | 122 | 134 | 45 | 1,304 |
| 14 | Rock Creek below Johnson Creek | 573 | 865 | 1,491 | 1,451 | 9,102 | 12,676 | 2,799 | 769 | 615 | 1,130 | 997 | 376 | 32,844 |
| 15 | Rock Creek above Clear Creek | 573 | 865 | 1,491 | 1,451 | 9,102 | 12,676 | 2,799 | 769 | 615 | 1,130 | 997 | 376 | 32,844 |
| 16 | French Creek | 73 | 53 | 57 | 55 | 1,135 | 1,981 | 1,672 | 182 | 0 | 118 | 141 | 55 | 5,523 |
| 17 | Clear Creek above City of Buffalo | 1,046 | 1,423 | 1,982 | 2,929 | 15,386 | 21,221 | 8,254 | 1,672 | 1,168 | 2,226 | 1,945 | 756 | 60,007 |
| 18 | Clear Creek above French Creek | 1,046 | 1,423 | 1,982 | 2,929 | 15,449 | 21,221 | 8,254 | 1,672 | 1,168 | 2,226 | 1,945 | 756 | 60,070 |
| 19 | Clear Creek above Rock Creek | 1,119 | 1,476 | 2,039 | 2,984 | 16,584 | 23,202 | 9,926 | 1,854 | 1,398 | 2,344 | 2,086 | 811 | 65,823 |
| 20 | Clear Creek below Rock Creek | 1,691 | 2,341 | 3,530 | 4,435 | 25,686 | 35,878 | 12,725 | 2,624 | 2,014 | 3,474 | 3,084 | 1,186 | 98,668 |
| 21 | Clear Creek above Healy Reservoir | 1,691 | 2,658 | 3,530 | 4,435 | 25,686 | 35,878 | 12,725 | 2,624 | 2,014 | 4,444 | 3,084 | 1,186 | 99,955 |
| 23 | Clear Creek above Piney Creek | 1,691 | 3,911 | 4,824 | 5,374 | 25,686 | 35,878 | 12,725 | 2,624 | 2,014 | 4,444 | 3,128 | 1,186 | 103,486 |
| 24 | Clear Creek above Double Crossing | 4,404 | 7,135 | 10,514 | 10,678 | 44,118 | 75,227 | 26,470 | 7,949 | 4,609 | 8,186 | 7,200 | 2,922 | 209,410 |
| 25 | Clear Creek below Double Crossing | 4,404 | 7,135 | 10,514 | 10,929 | 44,118 | 75,227 | 26,470 | 7,949 | 4,609 | 8,186 | 7,200 | 2,922 | 209,661 |
| 26 | Clear Creek above USGS gage 06324000 | 4,404 | 7,135 | 10,514 | 10,929 | 44,118 | 75,227 | 26,470 | 7,949 | 4,609 | 8,186 | 7,200 | 2,922 | 209,661 |
| 27 | Clear Creek above Powder River | 4,440 | 7,568 | 11,728 | 10,929 | 44,118 | 75,227 | 27,431 | 8,047 | 4,609 | 8,186 | 7,345 | 2,922 | 212,547 |
| 28 | Powder River above Clear Creek | 7,589 | 11,731 | 30,400 | 20,315 | 102,759 | 87,040 | 26,344 | 8,276 | 4,655 | 16,458 | 11,810 | 6,250 | 333,625 |
| 29 | Powder River above State Line | 12,118 | 19,360 | 42,163 | 31,243 | 146,877 | 162,267 | 53,775 | 16,330 | 9,263 | 24,643 | 19,325 | 9,172 | 546,537 |
Table III-22
Available Flow for Clear Creek Basin (Acre-Feet) -
Normal Year Hydrologic Conditions
| Reach | Reach Name | Jan | Feb | Mar | Apr | May | Jun | Jul | Aug | Sep | Oct | Nov | Dec | Annual |
| 1 | North Piney Creek | 171 | 173 | 282 | 891 | 5,910 | 5,342 | 714 | 217 | 197 | 427 | 316 | 188 | 14,829 |
| 2 | South Piney Creek | 472 | 422 | 578 | 788 | 3,263 | 10,730 | 3,104 | 1,680 | 1,235 | 1,036 | 741 | 525 | 24,574 |
| 3 | Piney Creek below North & South Piney Creeks | 642 | 595 | 861 | 1,678 | 9,173 | 16,073 | 3,818 | 1,897 | 1,432 | 1,463 | 1,057 | 713 | 39,403 |
| 4 | Piney Creek below USGS gage 06323000 | 642 | 595 | 861 | 1,678 | 9,173 | 16,073 | 3,818 | 2,047 | 1,432 | 1,463 | 1,057 | 713 | 39,552 |
| 5 | Piney Creek below Lake DeSmet Intake Tunnel | 914 | 656 | 1,389 | 2,465 | 9,915 | 16,073 | 3,818 | 2,631 | 1,858 | 1,463 | 1,668 | 1,036 | 43,887 |
| 6 | Little Piney Creek above SEO gage | 549 | 707 | 950 | 954 | 904 | 828 | 652 | 584 | 718 | 744 | 722 | 580 | 8,892 |
| 7 | Little Piney Creek above Piney Creek | 781 | 781 | 1,533 | 1,339 | 904 | 828 | 652 | 750 | 931 | 744 | 1,139 | 842 | 11,224 |
| 8 | Piney Creek below Little Piney Creek | 1,823 | 1,524 | 2,971 | 3,804 | 10,819 | 16,901 | 4,470 | 3,504 | 3,595 | 3,045 | 3,091 | 2,080 | 57,629 |
| 10 | Piney Creek below Box Elder Creek | 1,851 | 1,543 | 2,979 | 3,926 | 10,819 | 16,901 | 4,470 | 3,504 | 3,595 | 3,045 | 3,150 | 2,126 | 57,910 |
| 11 | Piney Creek above Clear Creek | 2,483 | 2,956 | 5,419 | 4,932 | 10,819 | 16,901 | 4,470 | 3,504 | 3,595 | 3,823 | 4,018 | 2,659 | 65,579 |
| 12 | Rock Creek | 283 | 441 | 1,061 | 766 | 3,283 | 4,820 | 954 | 479 | 439 | 545 | 417 | 297 | 13,787 |
| 13 | Johnson Creek | 28 | 32 | 62 | 0 | 0 | 0 | 0 | 0 | 0 | 86 | 74 | 42 | 324 |
| 14 | Rock Creek below Johnson Creek | 311 | 474 | 1,123 | 1,203 | 3,283 | 4,820 | 954 | 479 | 514 | 631 | 491 | 339 | 14,623 |
| 15 | Rock Creek above Clear Creek | 311 | 474 | 1,123 | 1,203 | 3,283 | 4,820 | 954 | 479 | 514 | 631 | 491 | 339 | 14,623 |
| 16 | French Creek | 63 | 45 | 49 | 67 | 552 | 1,022 | 619 | 0 | 0 | 170 | 125 | 94 | 2,805 |
| 17 | Clear Creek above City of Buffalo | 457 | 526 | 1,090 | 2,159 | 6,836 | 11,079 | 3,063 | 1,339 | 1,501 | 1,115 | 757 | 563 | 30,483 |
| 18 | Clear Creek above French Creek | 457 | 526 | 1,090 | 2,261 | 6,836 | 11,079 | 3,063 | 1,339 | 1,501 | 1,115 | 757 | 563 | 30,586 |
| 19 | Clear Creek above Rock Creek | 520 | 571 | 1,138 | 2,329 | 7,388 | 12,101 | 3,682 | 1,339 | 1,614 | 1,285 | 882 | 656 | 33,504 |
| 20 | Clear Creek below Rock Creek | 831 | 1,044 | 2,262 | 3,532 | 10,670 | 16,921 | 4,636 | 1,818 | 2,127 | 1,916 | 1,373 | 996 | 48,127 |
| 21 | Clear Creek above Healy Reservoir | 831 | 1,044 | 2,262 | 3,532 | 10,670 | 16,921 | 4,636 | 1,818 | 2,127 | 1,916 | 1,373 | 996 | 48,127 |
| 23 | Clear Creek above Piney Creek | 1,197 | 2,062 | 4,148 | 4,253 | 10,670 | 16,921 | 4,636 | 1,818 | 2,127 | 2,638 | 1,933 | 1,364 | 53,768 |
| 24 | Clear Creek above Double Crossing | 3,680 | 5,128 | 9,624 | 9,332 | 21,489 | 33,822 | 9,106 | 5,322 | 5,723 | 6,461 | 5,951 | 4,023 | 119,660 |
| 25 | Clear Creek below Double Crossing | 3,680 | 5,673 | 9,946 | 9,798 | 21,489 | 33,822 | 9,106 | 5,322 | 5,723 | 6,461 | 5,951 | 4,023 | 120,994 |
| 26 | Clear Creek above USGS gage 06324000 | 3,680 | 5,852 | 10,041 | 9,798 | 21,489 | 33,822 | 9,106 | 5,322 | 6,083 | 6,461 | 5,951 | 4,023 | 121,630 |
| 27 | Clear Creek above Powder River | 3,734 | 6,701 | 10,850 | 9,798 | 21,489 | 33,822 | 9,635 | 5,322 | 6,083 | 6,523 | 5,951 | 4,023 | 123,932 |
| 28 | Powder River above Clear Creek | 6,519 | 13,902 | 25,996 | 22,124 | 40,971 | 37,368 | 14,105 | 6,557 | 6,452 | 9,968 | 9,003 | 6,715 | 199,680 |
| 29 | Powder River above State Line | 10,319 | 20,648 | 36,869 | 31,922 | 62,461 | 71,190 | 23,837 | 11,879 | 12,535 | 16,672 | 14,954 | 10,739 | 324,023 |
Table III-23
Available Flow for Clear Creek Basin (Acre-Feet) -
Dry Year Hydrologic Conditions
| Reach | Reach Name | Jan | Feb | Mar | Apr | May | Jun | Jul | Aug | Sep | Oct | Nov | Dec | Annual |
| 1 | North Piney Creek | 102 | 96 | 127 | 1,422 | 3,684 | 1,116 | 263 | 77 | 61 | 294 | 179 | 116 | 7,536 |
| 2 | South Piney Creek | 284 | 260 | 331 | 758 | 2,029 | 4,195 | 1,770 | 707 | 436 | 680 | 373 | 306 | 12,129 |
| 3 | Piney Creek below North & South Piney Creeks | 387 | 356 | 458 | 2,180 | 5,713 | 5,311 | 2,033 | 784 | 497 | 974 | 552 | 422 | 19,666 |
| 4 | Piney Creek below USGS gage 06323000 | 387 | 356 | 458 | 2,180 | 5,713 | 5,311 | 2,871 | 1,073 | 1,094 | 974 | 552 | 422 | 21,391 |
| 5 | Piney Creek below Lake DeSmet Intake Tunnel | 1,168 | 464 | 548 | 2,517 | 5,713 | 5,311 | 3,138 | 1,668 | 1,621 | 974 | 1,305 | 1,262 | 25,688 |
| 6 | Little Piney Creek above SEO gage | 627 | 589 | 941 | 809 | 263 | 534 | 660 | 538 | 586 | 766 | 760 | 636 | 7,708 |
| 7 | Little Piney Creek above Piney Creek | 1,894 | 768 | 1,128 | 934 | 263 | 534 | 721 | 836 | 868 | 766 | 1,799 | 1,901 | 12,411 |
| 8 | Piney Creek below Little Piney Creek | 3,181 | 1,307 | 1,717 | 3,451 | 5,976 | 5,845 | 3,859 | 3,013 | 2,522 | 3,235 | 3,416 | 3,176 | 40,699 |
| 10 | Piney Creek below Box Elder Creek | 3,181 | 1,307 | 1,717 | 3,657 | 5,976 | 5,845 | 3,859 | 3,013 | 2,522 | 3,235 | 3,416 | 3,176 | 40,905 |
| 11 | Piney Creek above Clear Creek | 3,670 | 1,828 | 2,931 | 3,810 | 5,976 | 5,845 | 3,859 | 3,013 | 2,522 | 4,247 | 4,579 | 3,176 | 45,456 |
| 12 | Rock Creek | 315 | 485 | 904 | 173 | 2,269 | 617 | 0 | 0 | 0 | 409 | 379 | 342 | 5,890 |
| 13 | Johnson Creek | 28 | 30 | 47 | 0 | 0 | 0 | 0 | 0 | 0 | 59 | 60 | 39 | 263 |
| 14 | Rock Creek below Johnson Creek | 343 | 515 | 951 | 905 | 2,269 | 617 | 146 | 97 | 111 | 467 | 439 | 381 | 7,241 |
| 15 | Rock Creek above Clear Creek | 343 | 515 | 951 | 905 | 2,269 | 617 | 146 | 97 | 111 | 467 | 439 | 381 | 7,241 |
| 16 | French Creek | 66 | 47 | 44 | 0 | 410 | 161 | 240 | 0 | 0 | 180 | 138 | 90 | 1,376 |
| 17 | Clear Creek above City of Buffalo | 643 | 919 | 1,106 | 2,403 | 4,118 | 2,681 | 530 | 339 | 322 | 1,000 | 871 | 776 | 15,707 |
| 18 | Clear Creek above French Creek | 643 | 919 | 1,106 | 2,403 | 4,118 | 2,681 | 530 | 339 | 322 | 1,000 | 871 | 776 | 15,707 |
| 19 | Clear Creek above Rock Creek | 709 | 966 | 1,150 | 2,403 | 4,528 | 2,841 | 769 | 339 | 322 | 1,180 | 1,009 | 867 | 17,082 |
| 20 | Clear Creek below Rock Creek | 1,052 | 1,480 | 2,101 | 3,308 | 6,797 | 3,458 | 915 | 436 | 433 | 1,647 | 1,448 | 1,248 | 24,323 |
| 21 | Clear Creek above Healy Reservoir | 1,052 | 1,480 | 2,101 | 3,308 | 6,797 | 3,458 | 915 | 436 | 433 | 1,647 | 1,448 | 1,248 | 24,323 |
| 23 | Clear Creek above Piney Creek | 1,294 | 2,120 | 3,625 | 3,308 | 6,797 | 3,458 | 915 | 436 | 433 | 2,440 | 2,165 | 1,287 | 28,278 |
| 24 | Clear Creek above Double Crossing | 4,964 | 3,949 | 6,584 | 7,413 | 12,773 | 9,303 | 4,774 | 3,449 | 2,955 | 6,687 | 6,744 | 4,462 | 74,056 |
| 25 | Clear Creek below Double Crossing | 4,964 | 3,949 | 8,902 | 8,139 | 12,773 | 9,303 | 4,774 | 3,449 | 2,955 | 6,687 | 6,744 | 4,462 | 77,102 |
| 26 | Clear Creek above USGS gage 06324000 | 4,964 | 3,949 | 8,956 | 8,554 | 12,773 | 9,400 | 4,774 | 3,449 | 3,482 | 6,687 | 6,744 | 4,462 | 78,194 |
| 27 | Clear Creek above Powder River | 4,964 | 3,949 | 9,016 | 8,554 | 12,773 | 10,282 | 4,774 | 3,698 | 3,482 | 7,125 | 7,038 | 4,462 | 80,118 |
| 28 | Powder River above Clear Creek | 6,602 | 9,561 | 18,787 | 13,486 | 20,647 | 10,304 | 5,594 | 3,013 | 2,122 | 8,145 | 8,998 | 5,803 | 113,062 |
| 29 | Powder River above State Line | 11,567 | 13,510 | 27,822 | 22,040 | 33,420 | 20,735 | 10,368 | 6,822 | 5,603 | 15,447 | 16,172 | 10,265 | 193,770 |
Table III-24
Available Flow for Crazy Woman Creek Basin (Acre-Feet) -
Wet Year Hydrologic Conditions
| Reach | Reach Name | Jan | Feb | Mar | Apr | May | Jun | Jul | Aug | Sep | Oct | Nov | Dec | Annual |
| 1 | Kelly Creek | 10 | 8 | 8 | 98 | 679 | 731 | 180 | 95 | 20 | 17 | 13 | 11 | 1,870 |
| 2 | Little North Fork Crazy Woman Creek | 22 | 18 | 19 | 214 | 1,499 | 1,602 | 371 | 182 | 36 | 38 | 29 | 25 | 4,055 |
| 3 | North Fork Crazy Woman Creek | 79 | 57 | 69 | 761 | 7,592 | 10,292 | 1,619 | 714 | 143 | 141 | 98 | 87 | 21,650 |
| 4 | N Fk Crazy Woman Cr bel. Kelly & Little N Fk | 111 | 84 | 96 | 1,073 | 9,769 | 12,626 | 2,170 | 990 | 199 | 195 | 139 | 124 | 27,575 |
| 5 | Muddy Creek | 17 | 14 | 16 | 198 | 1,347 | 1,398 | 318 | 150 | 19 | 27 | 20 | 18 | 3,541 |
| 6 | Billy Creek | 10 | 9 | 12 | 137 | 443 | 401 | 93 | 77 | 16 | 12 | 10 | 10 | 1,230 |
| 7 | N Fk Crazy Woman Cr bel. Muddy & Billy Cr | 137 | 107 | 123 | 1,408 | 11,559 | 14,425 | 2,581 | 1,217 | 234 | 234 | 169 | 152 | 32,346 |
| 8 | Middle Fork Crazy Woman Creek | 75 | 60 | 82 | 885 | 5,421 | 6,630 | 1,386 | 865 | 177 | 108 | 79 | 75 | 15,842 |
| 9 | Crazy Woman Cr above S Fk Crazy Woman Cr | 213 | 167 | 205 | 2,293 | 16,980 | 21,055 | 3,967 | 2,082 | 411 | 342 | 248 | 227 | 48,189 |
| 10 | Crazy Woman Cr above Trabing Bridge | 213 | 167 | 205 | 2,705 | 16,980 | 21,055 | 3,967 | 2,082 | 411 | 342 | 248 | 227 | 48,600 |
| 11 | Crazy Woman Cr above Upper Station | 792 | 1,494 | 2,802 | 3,472 | 20,742 | 21,055 | 3,967 | 2,082 | 411 | 2,439 | 1,522 | 720 | 61,498 |
Table III-25
Available Flow for Crazy Woman Creek Basin (Acre-Feet) -
Normal Year Hydrologic Conditions
| Reach | Reach Name | Jan | Feb | Mar | Apr | May | Jun | Jul | Aug | Sep | Oct | Nov | Dec | Annual |
| 1 | Kelly Creek | 9 | 7 | 8 | 64 | 279 | 283 | 86 | 37 | 20 | 17 | 11 | 11 | 831 |
| 2 | Little North Fork Crazy Woman Creek | 21 | 15 | 17 | 136 | 598 | 587 | 160 | 65 | 32 | 39 | 26 | 25 | 1,720 |
| 3 | North Fork Crazy Woman Creek | 67 | 49 | 58 | 538 | 3,544 | 3,251 | 780 | 279 | 133 | 128 | 87 | 82 | 8,995 |
| 4 | N Fk Crazy Woman Cr bel. Kelly & Little N Fk | 97 | 71 | 83 | 739 | 4,421 | 4,120 | 1,025 | 380 | 185 | 184 | 124 | 117 | 11,546 |
| 5 | Muddy Creek | 16 | 12 | 14 | 125 | 511 | 470 | 87 | 26 | 0 | 28 | 18 | 18 | 1,325 |
| 6 | Billy Creek | 9 | 8 | 10 | 74 | 179 | 143 | 39 | 39 | 8 | 12 | 9 | 9 | 539 |
| 7 | N Fk Crazy Woman Cr bel. Muddy & Billy Cr | 122 | 91 | 107 | 937 | 5,111 | 4,734 | 1,151 | 445 | 193 | 224 | 151 | 144 | 13,410 |
| 8 | Middle Fork Crazy Woman Creek | 64 | 53 | 75 | 652 | 2,684 | 2,366 | 667 | 344 | 90 | 100 | 70 | 70 | 7,235 |
| 9 | Crazy Woman Cr above S Fk Crazy Woman Cr | 186 | 144 | 182 | 1,589 | 7,795 | 7,100 | 1,818 | 789 | 283 | 324 | 221 | 215 | 20,645 |
| 10 | Crazy Woman Cr above Trabing Bridge | 186 | 144 | 182 | 1,589 | 7,795 | 7,100 | 2,075 | 959 | 812 | 324 | 221 | 215 | 21,602 |
| 11 | Crazy Woman Cr above Upper Station | 656 | 1,679 | 2,626 | 3,560 | 7,795 | 7,100 | 2,075 | 1,016 | 812 | 1,321 | 1,184 | 786 | 30,610 |
Table III-26
Available Flow for Crazy Woman Creek Basin (Acre-Feet) -
Dry Year Hydrologic Conditions
| Reach | Reach Name | Jan | Feb | Mar | Apr | May | Jun | Jul | Aug | Sep | Oct | Nov | Dec | Annual |
| 1 | Kelly Creek | 10 | 7 | 8 | 39 | 57 | 54 | 0 | 0 | 0 | 17 | 11 | 12 | 215 |
| 2 | Little North Fork Crazy Woman Creek | 24 | 16 | 19 | 79 | 121 | 99 | 0 | 0 | 0 | 38 | 24 | 27 | 446 |
| 3 | North Fork Crazy Woman Creek | 71 | 47 | 58 | 365 | 620 | 511 | 0 | 0 | 0 | 124 | 74 | 79 | 1,949 |
| 4 | N Fk Crazy Woman Cr bel. Kelly & Little N Fk | 105 | 71 | 84 | 483 | 798 | 663 | 0 | 0 | 0 | 179 | 109 | 118 | 2,610 |
| 5 | Muddy Creek | 19 | 14 | 17 | 68 | 104 | 33 | 0 | 0 | 0 | 30 | 19 | 20 | 325 |
| 6 | Billy Creek | 11 | 9 | 12 | 39 | 38 | 4 | 0 | 0 | 0 | 13 | 9 | 10 | 145 |
| 7 | N Fk Crazy Woman Cr bel. Muddy & Billy Cr | 135 | 94 | 114 | 590 | 941 | 700 | 0 | 0 | 0 | 222 | 137 | 148 | 3,080 |
| 8 | Middle Fork Crazy Woman Creek | 76 | 59 | 79 | 423 | 501 | 453 | 0 | 0 | 0 | 108 | 67 | 73 | 1,839 |
| 9 | Crazy Woman Cr above S Fk Crazy Woman Cr | 210 | 153 | 193 | 1,013 | 1,442 | 1,153 | 0 | 0 | 0 | 330 | 204 | 221 | 4,918 |
| 10 | Crazy Woman Cr above Trabing Bridge | 210 | 153 | 193 | 1,013 | 1,442 | 1,788 | 532 | 168 | 123 | 330 | 204 | 221 | 6,377 |
| 11 | Crazy Woman Cr above Upper Station | 836 | 1,031 | 1,904 | 2,113 | 3,540 | 2,361 | 532 | 168 | 123 | 1,022 | 1,135 | 754 | 15,520 |
Table III-27
Available Flow for Powder River Basin (Acre-Feet) -
Wet Year Hydrologic Conditions
| Reach | Reach Name | Jan | Feb | Mar | Apr | May | Jun | Jul | Aug | Sep | Oct | Nov | Dec | Annual |
| 1 | Buffalo Creek | 195 | 181 | 273 | 618 | 3,342 | 1,414 | 0 | 0 | 0 | 202 | 255 | 208 | 6,687 |
| 2 | Middle Fork Powder River1 | 51 | 85 | 362 | 1,601 | 11,430 | 6,449 | 418 | 268 | 600 | 117 | 242 | 85 | 21,707 |
| 3 | Middle Fork Powder River below Buffalo Creek | 913 | 974 | 1,395 | 2,874 | 14,771 | 7,863 | 418 | 268 | 600 | 1,221 | 1,403 | 819 | 33,518 |
| 4 | Beaver Creek | 1,063 | 1,113 | 1,311 | 1,181 | 2,657 | 1,489 | 258 | 263 | 641 | 1,022 | 1,079 | 889 | 12,967 |
| 5 | Beaver Creek below Blue Creek | 1,063 | 1,187 | 1,355 | 1,181 | 2,657 | 1,489 | 258 | 263 | 641 | 1,212 | 1,283 | 889 | 13,479 |
| 6 | Middle Fork Powder River below Beaver Creek | 1,975 | 2,273 | 2,817 | 4,055 | 17,429 | 9,352 | 676 | 531 | 1,241 | 2,432 | 2,927 | 1,708 | 47,417 |
| 7 | Middle Fk Powder River above Red Fk Powder | 1,975 | 2,466 | 2,997 | 4,055 | 17,429 | 9,352 | 676 | 531 | 1,241 | 2,432 | 2,928 | 1,708 | 47,791 |
| 8 | Red Fork Powder River | 1,940 | 2,358 | 2,799 | 3,040 | 12,699 | 6,977 | 536 | 404 | 926 | 2,465 | 2,883 | 1,709 | 38,738 |
| 9 | Middle Fk Powder River above N Fk Powder | 3,915 | 4,824 | 5,796 | 7,095 | 30,128 | 16,330 | 1,212 | 935 | 2,167 | 4,898 | 6,001 | 3,418 | 86,718 |
| 10 | North Fork Powder River | 1,145 | 1,291 | 1,288 | 716 | 5,136 | 4,353 | 98 | 48 | 156 | 1,698 | 1,822 | 1,004 | 18,757 |
| 11 | Powder River below N & Middle Fks Powder | 5,060 | 6,115 | 7,085 | 7,811 | 35,264 | 20,683 | 1,310 | 983 | 2,323 | 6,596 | 7,823 | 4,422 | 105,474 |
| 12 | Powder River above South Fork Powder | 5,060 | 6,115 | 7,805 | 7,811 | 42,733 | 37,477 | 3,051 | 983 | 2,323 | 9,932 | 7,823 | 4,422 | 134,816 |
| 13 | South Fork Powder River | 229 | 1,369 | 8,011 | 6,589 | 17,715 | 5,530 | 1,989 | 2,067 | 15 | 418 | 370 | 123 | 44,427 |
| 14 | Powder River above Salt Creek | 5,290 | 7,484 | 15,096 | 14,400 | 60,729 | 43,564 | 5,694 | 3,051 | 2,642 | 10,350 | 8,193 | 4,544 | 181,036 |
| 15 | Salt Creek | 1,452 | 2,090 | 4,095 | 2,469 | 12,546 | 7,727 | 9,183 | 1,613 | 1,638 | 3,694 | 1,879 | 993 | 49,377 |
| 16 | Powder River below Salt Creek | 6,741 | 9,573 | 19,191 | 16,870 | 73,310 | 51,299 | 14,882 | 4,663 | 4,280 | 14,044 | 10,072 | 5,537 | 230,461 |
| 17 | Powder River above Crazy Woman Creek | 6,741 | 9,573 | 23,790 | 16,870 | 80,197 | 61,924 | 20,283 | 5,915 | 4,280 | 14,044 | 10,072 | 5,537 | 259,255 |
| 18 | Crazy Woman Creek above Powder River | 785 | 1,487 | 3,459 | 3,445 | 22,562 | 25,117 | 5,101 | 2,206 | 375 | 2,414 | 1,505 | 712 | 69,167 |
| 19 | Powder River below Crazy Woman Creek | 7,527 | 11,060 | 27,253 | 20,315 | 102,759 | 87,040 | 25,422 | 8,175 | 4,655 | 16,458 | 11,577 | 6,250 | 328,489 |
Note: 1 Constrained by Instream Flow Rights of 12 cfs (July 1 - March 31) and 25 cfs (April 1 - June 30).
Table III-28
Available Flow for Powder River Basin (Acre-Feet) -
Normal Year Hydrologic Conditions
| Reach | Reach Name | Jan | Feb | Mar | Apr | May | Jun | Jul | Aug | Sep | Oct | Nov | Dec | Annual |
| 1 | Buffalo Creek | 202 | 190 | 267 | 694 | 2,090 | 100 | 0 | 0 | 0 | 236 | 231 | 214 | 4,226 |
| 2 | Middle Fork Powder River1 | 0 | 0 | 0 | 280 | 6,819 | 2,957 | 0 | 0 | 0 | 0 | 0 | 0 | 10,056 |
| 3 | Middle Fork Powder River below Buffalo Creek | 745 | 968 | 1,324 | 3,152 | 10,841 | 6,385 | 399 | 261 | 570 | 881 | 1,085 | 821 | 27,431 |
| 4 | Beaver Creek | 964 | 1,244 | 1,384 | 1,175 | 1,729 | 1,474 | 233 | 240 | 553 | 956 | 1,228 | 988 | 12,166 |
| 5 | Beaver Creek below Blue Creek | 964 | 1,290 | 1,402 | 1,175 | 1,729 | 1,566 | 233 | 240 | 553 | 956 | 1,228 | 988 | 12,322 |
| 6 | Middle Fork Powder River below Beaver Creek | 1,709 | 2,258 | 2,727 | 4,327 | 12,569 | 8,716 | 632 | 500 | 1,123 | 1,837 | 2,312 | 1,809 | 40,519 |
| 7 | Middle Fk Powder River above Red Fk Powder | 1,709 | 2,525 | 3,423 | 4,327 | 12,569 | 8,716 | 632 | 500 | 1,123 | 1,837 | 2,312 | 1,809 | 41,483 |
| 8 | Red Fork Powder River | 1,658 | 2,396 | 3,155 | 3,347 | 7,408 | 4,935 | 393 | 310 | 647 | 1,790 | 2,277 | 1,788 | 30,105 |
| 9 | Middle Fk Powder River above N Fk Powder | 3,367 | 4,922 | 6,579 | 7,674 | 19,977 | 13,651 | 1,025 | 811 | 1,770 | 3,627 | 4,589 | 3,597 | 71,587 |
| 10 | North Fork Powder River | 971 | 1,272 | 1,451 | 997 | 2,629 | 1,918 | 0 | 0 | 5 | 1,284 | 1,500 | 1,119 | 13,145 |
| 11 | Powder River below N & Middle Fks Powder | 4,338 | 6,193 | 8,029 | 8,671 | 22,606 | 16,087 | 1,025 | 811 | 1,775 | 4,911 | 6,089 | 4,716 | 85,251 |
| 12 | Powder River above South Fork Powder | 4,338 | 6,653 | 8,029 | 9,371 | 22,606 | 17,055 | 1,908 | 821 | 2,730 | 5,790 | 6,089 | 4,716 | 90,107 |
| 13 | South Fork Powder River | 132 | 1,287 | 7,025 | 5,987 | 6,835 | 2,093 | 1,132 | 1,699 | 17 | 188 | 213 | 112 | 26,720 |
| 14 | Powder River above Salt Creek | 4,470 | 7,940 | 15,054 | 15,358 | 29,441 | 19,403 | 3,580 | 3,010 | 3,353 | 6,189 | 6,302 | 4,828 | 118,929 |
| 15 | Salt Creek | 1,306 | 2,532 | 3,882 | 3,239 | 3,750 | 4,823 | 5,081 | 1,705 | 2,350 | 2,399 | 1,540 | 1,114 | 33,722 |
| 16 | Powder River below Salt Creek | 5,776 | 10,472 | 18,936 | 18,597 | 33,192 | 24,225 | 8,661 | 4,715 | 5,703 | 8,588 | 7,842 | 5,943 | 152,650 |
| 17 | Powder River above Crazy Woman Creek | 5,776 | 10,472 | 21,140 | 18,597 | 33,192 | 29,159 | 11,002 | 5,572 | 5,732 | 8,588 | 7,842 | 5,943 | 163,014 |
| 18 | Crazy Woman Creek above Powder River | 648 | 1,669 | 2,919 | 3,526 | 7,779 | 8,209 | 2,328 | 985 | 720 | 1,286 | 1,162 | 773 | 32,004 |
| 19 | Powder River below Crazy Woman Creek | 6,424 | 12,141 | 24,059 | 22,124 | 40,971 | 37,368 | 13,330 | 6,557 | 6,452 | 9,874 | 9,003 | 6,715 | 195,018 |
Note: 1 Constrained by Instream Flow Rights of 12 cfs (July 1 - March 31) and 25 cfs (April 1 - June 30).
Table III-29
Available Flow for Powder River Basin (Acre-Feet) -
Dry Year Hydrologic Conditions
| Reach | Reach Name | Jan | Feb | Mar | Apr | May | Jun | Jul | Aug | Sep | Oct | Nov | Dec | Annual |
| 1 | Buffalo Creek | 187 | 169 | 214 | 298 | 909 | 0 | 0 | 0 | 0 | 167 | 206 | 197 | 2,347 |
| 2 | Middle Fork Powder River1 | 0 | 0 | 0 | 425 | 3,840 | 0 | 0 | 0 | 0 | 0 | 0 | 0 | 4,265 |
| 3 | Middle Fork Powder River below Buffalo Creek | 633 | 799 | 1,072 | 2,985 | 6,625 | 2,576 | 240 | 219 | 360 | 586 | 829 | 597 | 17,521 |
| 4 | Beaver Creek | 921 | 1,164 | 1,365 | 961 | 943 | 830 | 199 | 248 | 405 | 820 | 1,096 | 817 | 9,767 |
| 5 | Beaver Creek below Blue Creek | 921 | 1,164 | 1,399 | 961 | 943 | 846 | 199 | 248 | 405 | 820 | 1,096 | 817 | 9,817 |
| 6 | Middle Fork Powder River below Beaver Creek | 1,553 | 1,964 | 2,471 | 3,946 | 7,568 | 3,421 | 438 | 467 | 765 | 1,407 | 1,925 | 1,414 | 27,338 |
| 7 | Middle Fk Powder River above Red Fk Powder | 1,553 | 1,964 | 2,651 | 3,946 | 7,568 | 3,421 | 438 | 467 | 765 | 1,407 | 1,925 | 1,414 | 27,518 |
| 8 | Red Fork Powder River | 1,544 | 1,892 | 2,451 | 2,332 | 3,262 | 1,603 | 205 | 268 | 358 | 1,487 | 1,903 | 1,435 | 18,740 |
| 9 | Middle Fk Powder River above N Fk Powder | 3,097 | 3,856 | 5,101 | 6,278 | 10,831 | 5,024 | 643 | 735 | 1,123 | 2,894 | 3,828 | 2,849 | 46,258 |
| 10 | North Fork Powder River | 919 | 1,089 | 1,278 | 385 | 1,069 | 0 | 0 | 0 | 0 | 1,090 | 1,288 | 917 | 8,036 |
| 11 | Powder River below N & Middle Fks Powder | 4,016 | 4,945 | 6,379 | 6,662 | 11,900 | 5,024 | 643 | 735 | 1,123 | 3,984 | 5,116 | 3,766 | 54,294 |
| 12 | Powder River above South Fork Powder | 4,016 | 4,945 | 6,379 | 6,662 | 11,900 | 5,024 | 900 | 735 | 1,123 | 4,159 | 5,229 | 3,766 | 54,840 |
| 13 | South Fork Powder River | 94 | 1,074 | 3,574 | 2,698 | 3,480 | 564 | 377 | 864 | 6 | 90 | 121 | 84 | 13,026 |
| 14 | Powder River above Salt Creek | 4,110 | 6,019 | 9,953 | 9,360 | 15,380 | 5,588 | 1,886 | 1,599 | 1,129 | 4,674 | 5,648 | 3,850 | 69,196 |
| 15 | Salt Creek | 1,660 | 2,515 | 2,780 | 2,108 | 1,851 | 1,044 | 3,197 | 1,054 | 924 | 1,898 | 1,799 | 1,206 | 22,035 |
| 16 | Powder River below Salt Creek | 5,770 | 8,534 | 12,733 | 11,468 | 17,231 | 6,632 | 5,083 | 2,652 | 2,053 | 6,572 | 7,446 | 5,056 | 91,231 |
| 17 | Powder River above Crazy Woman Creek | 5,770 | 8,534 | 16,245 | 11,468 | 17,231 | 7,179 | 5,083 | 2,652 | 2,053 | 6,655 | 7,507 | 5,056 | 95,434 |
| 18 | Crazy Woman Creek above Powder River | 832 | 1,028 | 2,418 | 2,018 | 3,415 | 2,241 | 551 | 158 | 69 | 988 | 1,114 | 747 | 15,539 |
| 19 | Powder River below Crazy Woman Creek | 6,602 | 9,561 | 18,663 | 13,486 | 20,647 | 9,420 | 5,594 | 2,810 | 2,122 | 7,643 | 8,622 | 5,803 | 110,973 |
Note: 1 Constrained by Instream Flow Rights of 12 cfs (July 1 - March 31) and 25 cfs (April 1 - June 30).
Table III-30
Available Flow for Little Powder River Basin (Acre-Feet) -
Wet Year Hydrologic Conditions
| Reach | Reach Name | Jan | Feb | Mar | Apr | May | Jun | Jul | Aug | Sep | Oct | Nov | Dec | Annual |
| 1 | Little Powder River above USGS gage 06324925 | 562 | 7,548 | 14,241 | 2,860 | 9,079 | 2,733 | 377 | 279 | 53 | 2,316 | 180 | 143 | 40,372 |
| 2 | Little Powder River above USGS gage 06324970 | 1,195 | 7,548 | 14,241 | 2,860 | 13,237 | 3,354 | 1,044 | 426 | 226 | 2,722 | 485 | 375 | 47,714 |
| 3 | Little Powder River above State Line | 1,203 | 7,553 | 14,243 | 2,860 | 13,237 | 3,354 | 1,044 | 426 | 226 | 2,782 | 520 | 391 | 47,838 |
Table III-31
Available Flow for Little Powder River Basin (Acre-Feet) -
Normal Year Hydrologic Conditions
| Reach | Reach Name | Jan | Feb | Mar | Apr | May | Jun | Jul | Aug | Sep | Oct | Nov | Dec | Annual |
| 1 | Little Powder River above USGS gage 06324925 | 405 | 1,109 | 1,553 | 1,119 | 1,970 | 1,683 | 625 | 309 | 246 | 283 | 144 | 65 | 9,511 |
| 2 | Little Powder River above USGS gage 06324970 | 548 | 1,493 | 2,209 | 1,396 | 2,190 | 1,894 | 674 | 337 | 268 | 450 | 254 | 142 | 11,853 |
| 3 | Little Powder River above State Line | 556 | 1,497 | 2,210 | 1,396 | 2,190 | 1,894 | 674 | 337 | 268 | 504 | 289 | 159 | 11,974 |
Table III-32
Available Flow for Little Powder River Basin (Acre-Feet) -
Dry Year Hydrologic Conditions
| Reach | Reach Name | Jan | Feb | Mar | Apr | May | Jun | Jul | Aug | Sep | Oct | Nov | Dec | Annual |
| 1 | Little Powder River above USGS gage 06324925 | 24 | 319 | 399 | 284 | 474 | 220 | 64 | 74 | 13 | 19 | 26 | 30 | 1,946 |
| 2 | Little Powder River above USGS gage 06324970 | 60 | 481 | 630 | 344 | 560 | 239 | 105 | 74 | 17 | 41 | 54 | 69 | 2,674 |
| 3 | Little Powder River above State Line | 63 | 482 | 630 | 344 | 560 | 239 | 105 | 74 | 43 | 53 | 69 | 75 | 2,737 |
The yield potential of each of these basins is limited by the dry year conditions. Further, the timing of these available flows does not necessarily match the timing of the demand for this water. For example of the 218,000 acre feet of available flow from the Tongue River during a typical dry year, 65 percent of this occurs during the spring runoff months of March through June. Reservoir storage would be required to store this excess flow to satisfy demands throughout the year. The available flow presented in Table III-14 does not include the constraints of the Yellowstone River Compact. This will be discussed in the next section.
Compact Constraints
A determination of the amount of water available to Wyoming for future development is not complete without an evaluation of the constraints imposed by interstate compacts. The Yellowstone River Compact of 1950 governs the allocation of the waters in the Powder River and Tongue River between the States of Montana and Wyoming.
The following is a brief summary of the rules for dividing the waters according to the Yellowstone River Compact:
The unappropriated or unused total divertible flow of each tributary after needs for supplemental supply for existing rights are met, is allocated to Wyoming and Montana on a percentage basis
Nothing contained in the Compact is to be construed to adversely affect any rights to the use of the waters of the Yellowstone River by or for Indians, Indian tribes, and their reservations.
Tongue River
The allocable flows of the Tongue River drainage are to be divided between the two States in accordance with the following percentages per the Yellowstone River Compact:
Wyoming 40%The State of Montana sponsored a study in 1990/1991 to determine the amount of water available for storage in the, then proposed, enlargement of Tongue River Reservoir. The State of Wyoming also made a determination of Wyoming.s supplemental water needs for pre-1950 water rights during this same time frame. Information from both sources was utilized in evaluating Wyoming.s share of Tongue River water.
Montana 60%
This evaluation is based on the following assumptions:
In a letter sent to the State of Montana in 1990, Wyoming has claimed a need for 18,702 acre- feet of additional water to supplement the supply of pre-1950 rights. To fully supply these needs, additional reservoir storage with pre-1950 storage rights would likely be required.
The work sponsored by the State of Montana in 1990/1991 makes the assumption that the following four adjustments should be made to the streamflow at Miles City to account for unused pre-1950 rights or supplemental supplies to pre-1950 rights.
In order to represent the wide range of possible interpretations, two estimates were made of Wyoming.s remaining allocation of Tongue River water per the Yellowstone River Compact (a conservative estimate and a liberal estimate) as summarized in Table III-33. For the liberal estimate, the flow at Miles City is only adjusted to reflect increased depletions for supplemental supply to pre-1950 rights in Wyoming. For the conservative estimate, all of the aforementioned adjustments are included. The actual remaining allocation, to finally be determined at some undefined time in the future, will likely fall somewhere in the middle of this range of estimates.
Table III-33
Wyoming.s Remaining Allocation of Available Flow per Yellowstone River Compact
| Hydrologic Condition | Tongue River Basin | Powder River Basin | |
| Conservative Estimate |
Liberal Estimate | ||
| Wet Years | 163,000 | 189,000 | 211,500 |
| Normal Years | 90,000 | 117,000 | 131,100 |
| Dry Years | 40,000 | 67,000 | 74,300 |
Additional detail of the determination of available flows is provided in the .Available Surface Water Determination. technical memorandum. For comparative purposes, the Wyoming Water Planning Program estimated Wyoming.s average annual unused and unappropriated portion of the Tongue River to be 96,400 acre-feet for the 1948 through 1968 study period.
Powder River
The allocable flows of the Powder River drainage are to be divided between the two States in accordance with the following percentages per the Yellowstone River Compact:
Wyoming 42%Wyoming.s allocation of the Powder River is based on the estimate reported in the previous water plan as directed by the SEO. This estimate has, however, been adjusted to reflect the current study period. The water availability presented in the 1972 water plan was based on the 21-year study period of 1948 through 1968; whereas, the current study utilizes the 30-year period 1970 through 1999. The average annual flow of the Powder River near Locate for the 1948 . 1968 study period is 377,100. The corresponding average for the 1970 . 1999 study period is 424,400. Wyoming.s average annual unused and unappropriated portion of the Powder River, estimated through the earlier study is 120,700 acre-feet. This value is adjusted upwards by 12.5% to 135,800 to reflect the somewhat wetter average annual flow during the current study period. Wyoming.s allocation of the available flows of the Powder River is summarized in Table III-33 for each of the three hydrologic conditions.
Montana 58%
B. Ground WaterA qualitative summary of the ground water resources of the Powder and Tongue River basins of northeastern Wyoming is presented herein. Collectively, these basins and the study area are referred to as the Powder/Tongue River Basin (planning area).
Study Objectives
The first objective of this task was to inventory and catalog the Wyoming State Engineer's Office (SEO) ground water permit database for various categories of ground water uses in the planning area, and incorporate the extracted information into six GIS data themes. This was accomplished through a cooperative effort of personnel of the SEO and Wyoming Water Development Commission (WWDC). GIS data layers prepared from information on file with the SEO as of December 31, 2000 included:
The second objective of this task was to inventory and document existing published data on ground water studies and ground water planning documents for the planning area. All of the planning area is located within the Powder River Structural Basin (PRSB). Some of the existing ground water studies and ground water planning documents overlap the geographic boundaries of the planning area and include the drainage basins of the Little Missouri, Belle Fourche, Cheyenne and Niobrara Rivers.
Other objectives are as follows:
Study Methods
There were no original investigations performed as part of this task. The work consisted of performing an inventory, compilation, and review of published literature on the geology and ground water resources of the planning area.
There is a wealth of published and unpublished reports of investigations on the geology and ground water resources of the planning area. The geology of the PRSB has been the subject of investigation and exploration as a result of interest in the development of energy and natural resources for at least the last 40 to 50 years. Resources of interest have included oil and gas, coal, uranium, coalbed methane and water.
A bibliography of published ground water studies and ground water planning documents for the Basin Plan is included in the .Available Ground Water Determination. technical memorandum. The references included in the bibliography, provide sources for an overview of ground water resources, and of some of the interests and concerns that have arisen as a result of the various stages of development of energy and natural resources in the planning area.
Additional information in specific geographic areas within the planning area is available through the U.S. Geological Survey (USGS) and other federal agencies. Two additional federal agencies active in ground water related issues in the PRSB include the Bureau of Land Management (BLM) and the U. S. Environmental Protection Agency (USEPA).
Several Wyoming State agencies have site specific information available in the planning area. These agencies include the Department of Environmental Quality (Land Quality and Water Quality Divisions), the State Engineer's Office, the United States Geological Survey, the Oil and Gas Conservation Commission and the Water Development Commission.
Overview
The planning area lies in the central and northcentral part of the state and includes all or part of six Wyoming counties (Figure I-1). The planning area includes all of Sheridan and Johnson Counties, about sixty percent of Campbell County (north, centralwest and southwest) and a small portion of northeastern Natrona County. Very small parts of west and southeast Converse and Washakie Counties are also within the planning area. Figure III-21 shows the general location of the planning area with respect to regional structural elements in northcentral and northeastern Wyoming.
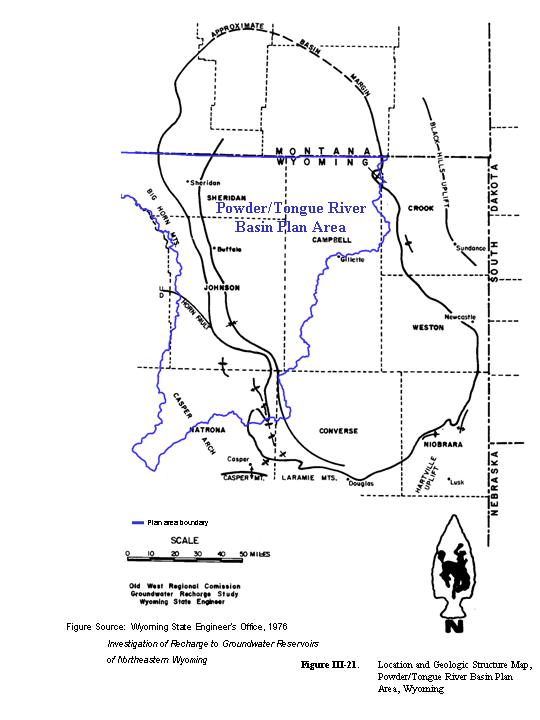
Major communities in Sheridan and Johnson Counties include Arvada, Ucross, Clearmont, Dayton, Ranchester, Sheridan, Buffalo and Kaycee. Edgerton and Midwest are the primary towns in Natrona County. Gillette in Campbell County lies on the eastern edge of the planning area.
Regionally, the planning area lies within the Missouri River drainage system and covers an area of approximately 11,261 square miles in central and northcentral Wyoming. The principal surface water systems within the planning area include the Tongue, Powder, and Little Bighorn Rivers and their respective tributaries. These drainage systems form the boundary of the Basin Plan.
Altitudes are variable in the planning area and generally range from 3,460 feet where the Tongue River crosses the State line into Montana in Sheridan County to 13,165 feet at the summit of Cloud Peak in Johnson County. East of the Mountains in Johnson County, relief is about 2,000 feet with altitudes ranging from 3,700 feet to an average of about 5,700 feet in the foothills at the base of the Bighorn Mountains. Altitudes in Natrona County range from 9,800 feet in the northwest part of the County to 4,800 feet near Midwest.
Climate is typical of the northern High Plains with low precipitation, high evaporation and wide ranges of temperatures. Annual precipitation varies from 13 to 15 inches in the majority of the planning area (Figure I-2). Generally, about forty to fifty percent of the precipitation in the planning area occurs between April and June.
Geologic Setting
Geologic formations in the planning area range in geologic time from Precambrian crystalline rocks to recent alluvial and eolian deposits generally consisting of clays, silts, sands and gravels. The PRSB has over 17,000 feet of sedimentary strata. These sedimentary rocks have been divided into about 11,000 feet of Cambrian to Cretaceous pretectonic deposits and up to 7,000 feet of Tertiary deposits associated with the deformation of the PRSB.
The older strata, which are exposed only in the western part of the planning area, are economically important for oil production. The Tertiary deposits contain significant coal reserves and are subject to mining and coalbed methane development. Both the Early Cretaceous Fall River Formation and the Early Tertiary Wasatch Formation have been important as uranium deposit sources in the Black Hills and the PRSB outside the planning area. Figure III- 22 presents a generalized geologic section of the PRSB typical of the planning area.
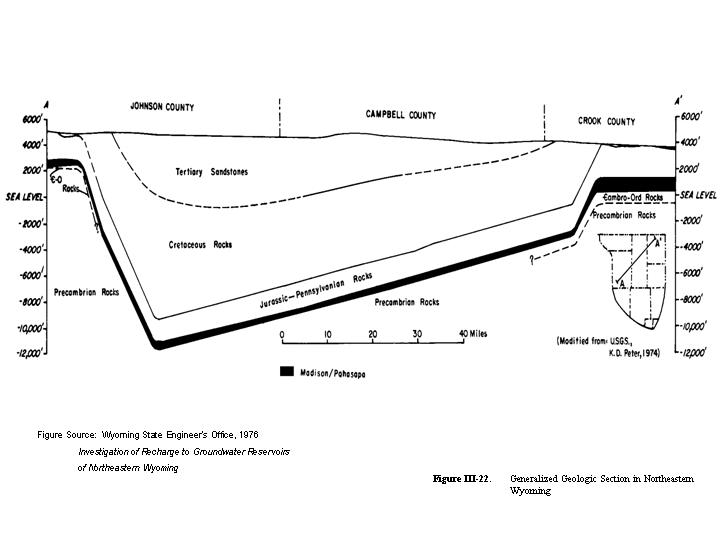
The Powder/Tongue River Basin encompasses several tectonic elements that influence the geology, and the occurrence and availability ground water. These structural features include the PRSB, mountain uplifts (Bighorn Mountains, the Laramie Range and Black Hills (outside and east of planning area)) and broad uplifts of lesser magnitude (Casper Arch and Hartville Hills).
Figures III-23 and III-24 present the generalized surficial and bedrock geology of the planning area.
Geologic Units and Ground Water
A geologic formation is a body or group of rock strata that consist dominantly of a certain lithologic type or combination of types. A general definition of an aquifer is a geologic formation or group of formations that are capable of yielding a significant quantity of water to wells or springs.
There are more than 30 geologic formations exposed on the western margin of the planning area. For this report, the formations were grouped into five principal aquifer systems that have historically been the major ground water sources of interest in the planning area. The grouping was based on that presented in the 1981 report on the "Occurrence And Characteristics of Ground Water in The Powder River Basin, Wyoming", by the Water Resources Research Institute (WWRI) of Wyoming. Figure III-25 graphically summarizes the geologic formations and their hydrogeologic role in the PRSB.
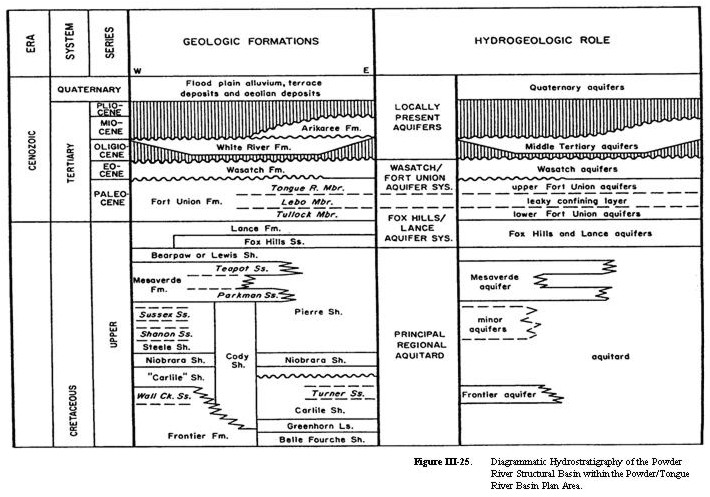
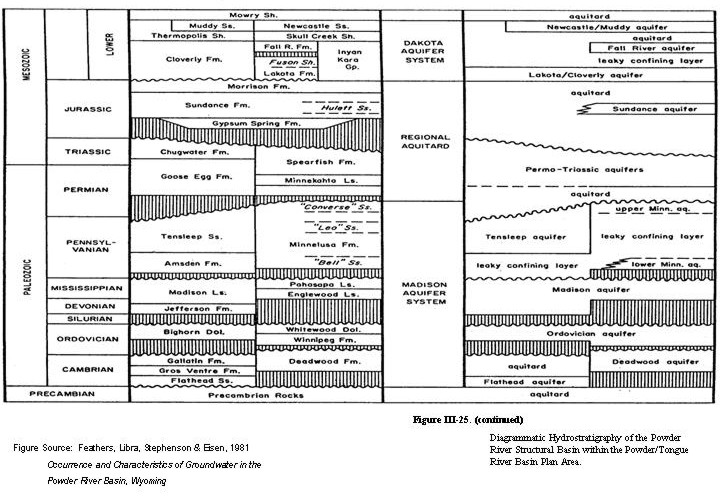
The WWRI aquifer system division and the grouping used herein were based on aquifer hydrogeologic similarity and aquitard identification. The grouping allows for a simplified presentation of the principal sources of ground water in the planning area. The five major aquifer systems within the planning area are (oldest to youngest):
Ground Water Quality
Ground water quality data contained in USGS ground water reports for the planning area were reviewed and provide an overview of the general quality of water from the aquifer systems within the planning area.
The review included selected USGS analyses available from USGS data files as of March 26,1982 (Larson and Daddow, 1984). The 2000 USGS publication on water co-produced with coalbed methane in the PRSB was also reviewed (Rice, Ellis and Miller, Water Co-produced with Coalbed Methane in the Powder River Basin, Wyoming: Preliminary Data).
1984 USGS Report
Information used in the 1984 report did not include all of the data available in USGS files at the time. Constituents were selected by USGS on the basis of their relative abundance and their inclusion in water quality criteria at the time. Water quality data available from the 1984 USGS report included: specific conductance, pH, temperature, dissolved-solids (TDS) concentration and concentrations of the major ions (calcium, magnesium, sodium, potassium, alkalinity (as bicarbonate), sulfate, chloride, fluoride, and nitrate, plus silica, boron, and iron). This data was from 748 ground water sites in the PRSB and adjacent areas.
Information on selected dissolved trace metals were reported for 220 ground water sites in the PRSB and adjacent areas in the 1984 USGS report. Data were reported for nine trace metals (arsenic, barium, cadmium, chromium, copper, lead, mercury, selenium, zinc) in the 1982 selection.
Radiochemical data was listed for 65 ground water sites in the PRSB and adjacent areas in the 1984 USGS report. The data included eight radiochemical analyses for each site (gross alpha- dissolved, gross alpha-suspended, gross beta-dissolved, gross beta-suspended, radium 226 dissolved radon method, radium 226 dissolved precipitation method, uranium-dissolved extraction method, uranium-dissolved direct fluorometric method).
2000 USGS Report
The 2000 USGS publication on water co-produced with coalbed methane in the PRSB contained data from 47 ground water sites in the PRSB. Approximately 15 of the sites were located within the planning area. The remaining 32 were located in the Northeast Wyoming River Basins Plan Area.
Water quality data available from the 2000 USGS report included: pH, temperature, dissolved- solids (TDS) concentration and concentrations of the major ions and minor ions (fluoride, chloride, sulfate, bromine, alkalinity, ammonia, calcium, potassium, magnesium, sodium, barium, iron plus silica, strontium, and sodium-adsorption-ratio (SAR)). Data were also reported for seventeen trace elements (silver, aluminum, arsenic, boron, beryllium, bismuth, cadmium, cerium, cobalt, chromium, caesium, copper, mercury, lanthanum, lithium, manganese, nickel).
Water Quality Standards and Suitability for Use
The State of Wyoming has identified the following standards for different classes of ground water:
The fact that ground water is and has been successfully used for the above uses is a general, practical indicator of ground water quality in the planning area. A general, qualitative evaluation and comparison of ground water produced from the six aquifer systems was performed. The results of the evaluation, including a general characterization of water co-produced with coalbed methane, are summarized in Table III-34 along with the availability and development potential for each aquifer system in the planning area.
Table III-34
Summary of Ground Water Availability/Development Potential of Major Aquifer Systems,
Central and Western Flanks of the Powder River Structural Basin
| Major Aquifer System | Geologic Unit | Thicknes (Feet) |
Lithologic Character | Hydrological CharacterA,B | General Water Quality | Availability / Development PotentialC | Remarks |
| Quaternary Alluvial Aquifer System | Alluvium and Terrace Deposits |
0-100+ | Silt, sand and gravel; unconsolidated and interbedded; present along most streams. | Yield of 50 to 300 gpm may be possible, often through induced recharge. Terraces topographically high and often drained. Specific capacity, 0.3-7 gpm/ft; permeability, 380 and 1100 gpd/ft2 and transmissivity, 9700 and 20300 gpd/ft from two tests in Sheridan County (Lowry and Cummings, 1966). Coarser deposits have better aquifer properties. | TDS content generally range from about 100 to >4000 mg/l. Chemical characteristics of water differ geographically. Chemical type and mineralization of the water can be expected to vary depending on underlying rock types and the nature and degree of interconnection with surface water. Alluvial deposits in the western part of the planning area generally contain water of better quality than alluvial deposits in the eastern part. Suitability for municipal / public, domestic, irrigation and stock is variable and dependent on location and above factors. | Historical source for municipal / public, domestic and stock use. Production has ranged up to 250 gpm with induced infiltration of surface water. Ground water development potential generally better in coarse-grained deposits and poorer in fine-grained materials. Moderate to high yields might be possible to optimally located and properly designed wells if induced infiltration from surface water can be tolerated in the upper reaches of Powder River, Piney, Clear and Crazy Woman Creeks. Moderate supplies may be able to be developed in thicker deposits of coarse material in the alluvuim of Prairie Dog Creek as well as the alluvium of the Tongue River and Dutch Creek. (Lowry and Cummings, 1966), (Whitcomb, Cummings and McCullough, 1966) | Quaternary alluvial aquifers generally in hydraulic connection with all bedrock aquifers in outcrop areas and also with surface waters. Alluvial aquifers in larger valleys provide hydraulic interconnection between otherwise hydraulically isolated bedrock aquifers (Whitcomb, 1965). Alluvial aquifers also serve as interchange point and storage for ground water in the hydrologic cycle (Davis and Rechard, 1977), (Davis, 1976). Induced recharge from surface waters is probable in areas of extensive development. |
| Fort Union / Wasatch Aquifer System | Wasatch Formation | 500 to 2000± | Fine- to coarse-grained lenticular sandstones interbedded with shale and coal. Yields water from, lenticular sandstone and to a lesser extent from jointed coal and clinker beds (Hodson, Pearl and Druse, 1977). Divided into two conglomeratic members (Kingsbury and Moncrief Members) near the Bighorn Mountains (Lowry and Cummings, 1966). | Yields generally <15 gpm. Specific capacity of Wasatch wells and those completed in the coarse grained facies of the Wasatch Formation in Sheridan County averaged 0.33 and 1.0 gpm/ft respectivley; permeability, 6.5 gpd/ft2 (one test - coal, Sheridan County); transmissivity, 520 gpd/ft (one test - coal, Sheridan County) and 2200 gpd/ft (one test - sandstone, Sheridan County). (Lowry and Cummings, 1966) | TDS content of waters is variable and ranges from 141 to 6620 mg/l (Larson, 1984). Sulfate and Iron content range from 0.6 - 4080 mg/l and 0 - 25 mg/l respectively and water varies from soft to very hard. Dominant cations generally are Sodium, Calcium and Magnesium, Sodium and Calcium, or Sodium and Magnesium. (Lowry and Cummings, 1966), (Whitcomb, Lowry and McCullough) | Important local source for domestic and stock water supply. Yields from fine grained facies generally small and barely adequate for stock and domestic use and generally can be expected to be < 15 gpm. Wells completed in the Kingsbury Conglomerate and Moncrief Members may have potential for higher production. Water quality generally suitable for domestic supplies although undesireable constituents may make other water sources more attractive if available. Water quality suitability for stock ranges from poor to good. Generally unsuitable for irrigation due to high salinity and sodium content. | Kingsbury Conglomerate and Moncrief Members located at the base of the mountains in Sheridan Counties. |
| Fort Union Formation | 1200-3900 | Sandstone, fine- to medium-grained, lenticular, interbedded with siltstone, coal and shale. "Clinker" associated with coal outcrops. | Flowing yields of 1-60 gpm reported where confined. Pumped yields up to 250 gpm with several hundred feet of drawdown (eastern Campbell County, east of planning area). Specific capacity for 85 wells in Sheridan County averaged 0.42 gpm/ft; permeability (2.5 and 7.9 gpd/ft2), transmissivity (10 and 95 gpd/ft), and Storage coefficient (9.0 X 10⁻⁵ and 3.5 X 10⁻⁴) for tests performed on two wells in Sheridan County (Lowry and Cummings, 1966). Coal and clinker generally better aquifer properties than sandstones. Locally clinker transmissivity up to 3,000,000 gpd/ft; Anisotropy and leaky confining layers are common. | TDS content of waters is variable and ranges from 484 - 4630 mg/l (Larson, 1984). Sulfate and Iron content range from 0.3 - 1870 mg/l and 0.06 - 19 mg/l respectively. Water varies from soft to very hard and is generally a Sodium Bicarbonate type. (Lowry and Cummings, 1966), (Whitcomb, Cummings and McCullough, 1966) Water co-produced with coal bed methane is predominantly Sodium Bicarbonate type with TDS content and SAR (15 samples), of 540 - 2010 mg/l (mean of 1309 mg/l) and 7.7 - 32 (mean of 19.82) respectively in planning area. (Rice, Ellis & Bullock, 2000). BLM Wyodak EIS assumed average TDS concentration of 764 mg/l (USDI,BLM, 1999). | Important, extensively used relatively shallow (< 1000 feet depth) local source for domestic and stock supply. Low yields, generally less than 25 gpm can be expected. Four of the 12 municipal / public supply wells in service for the City of Gillette (east of planning area) as of 1994 had been tested at pumping rates ranging from 50 to 130 gpm (Wester -Wetstein and Associates, Inc., 1994). | Total of 6820 Coal Bed Methane wells permitted with WSEO in planning area as of 12/31/00. Maximum, minimum and mean depths and range of actual yields listed on permits were 92 -4100 (mean 637) feet below ground surface (bgs), and 1 - 60 (mean 49) gpm respectively. Range of depths to main water bearing zone listed on WSEO Permits were 58 - 3816 (mean 580) feet bgs. BLM Exxon Pistol Point EA assumed average water production for each CBM well to average between 30 and 45 gpm (USDI,BLM, 1992). BLM Lower Prairie Dog Creek EA assumed average water production for each CBM well to be 15 gpm (USDI,BLM, 1999). BLM Wyodak EIS assumed average expected water production to be 12 gpm over the estimated 12 year life of each CBM well (USDI,BLM, 1999). BLM Wyodak Drainage EA assumed average water production for each CBM well to be 11.1 gpm (USDI,BLM, 2000). | |
| Fox Hills/Lance Aquifer System | Lance Formation | 600-1900 (North) 1950-3000 (South) |
Sandstone, fine- to medium-grained, lenticular, interbedded with sandy siltstone, claystone and shale. | Generally yields less than 15 gpm with specific capacities, 0.03-.16 gpm/ft in planning area. Limited development due to uneconomical drilling depths. In eastern area of Powder River Structural Basin (PRSB), yields up to 350 gpm but with large drawdowns and long well completion intervals; permeability 34 gpd/ft2; transmissivity, 76-2100 gpd/ft for wells also completed in Fox Hills Sandstone. | TDS content in waters generally range from <500 - 3060 mg/l. Composition variable, mainly Sodium Sulfate or Calcium Sulfate. Variable iron ( 0 - 6.03 mg/l) and Sulfate (<100 - 1780 mg/l) content, SAR 1.9 - 39. Generally undesireable for domestic water source due to possible high Iron, Manganese and Sulfate content. Generally fair to poor for stock use. Unsuitable for irrigation due to high salinity and / or high SAR. | Historical source for domestic and stock supply. Generally yields less than 15 gpm in planning area. Development limited due to uneconomical drilling depths. Water quality generally suitable for domestic supplies although undesireable constituents may make other water sources more attractive if available. Water quality suitability for stock ranges from poor to good. Generally unsuitable for irrigation due to high salinity and / or Sodium content. | |
| Fox Hills Sandstone | 0-700 | Sandstone, fine-to medium-grained, interbedded with shale and siltstone. | Generally yields less than 15 gpm with specific capacities, 0.03-.37 gpm/ft in planning area. Transmissivity, 76-1600 gpd/ft for wells also completed in Lance Formation. Limited development due to uneconomical drilling depths. | Similar to Lance Formation. Water suitable for domestic use usually present only near outcrop. Water suitable for stock use generally found at depths of up to 1000 feet, away from outrop. The quality of water may be unsatisfactory for domestic and stock use where the the aquifer is is deeper than 1000 feet. (Crest and Lowry, 1972) | Historical source for municipal / public, domestic and stock supply. Generally yields less than 15 gpm in planning area. No more than 50 gpm can be expected from wells completed in wells in the planning area (Natrona County). Well for Town of Edgerton produced 25 gpm with a specific capacity of 0.037 gpm/ft. (Crist and Lowry, 1972) Development limited due to uneconomical drilling depths. Tested yields of Gillette municipal / public supply wells (east of planning area) have ranged from 85 to 705 gpm (Wester-Wetstein and Associates, Inc., 1994). | High Fluoride content may be of concern in eastern part of planning area. Has been used as municipal / public water supply source for Town of Edgerton. Has been used for oil well water flooding operations in eastern PRSB. | |
| Dakota Aquifer System | Muddy Sandstone (NewCastle Sandstone) |
0-40± | Light gray, fine-grained, lenticular sandstone and siltstone often termed a member of Thermopolis shale. | Minor unit of Dakota Aquifer System. Oil field data (PRSB): porosity, 5-20%; permeability, <7 gpd/ft2 ; transmissivity, <150 gpd/ft. | No data in planning area. | No data in planning area. Ground water possibilities in planning area generally not known. Probably capable of yielding small quantities of no more than 10 gpm water to wells. Deep drilling depths would probably preclude consideration other than at outcrops. Dakota Aquifer System historical source for domestic and stock use in eastern PRSB. | |
| Cloverly Formation | 140-150 | Interbedded dark shale and brown siltstone with 15-45 feet of basal, fine - to coarse-grained well sorted sandstone. | Flowing yields of 1-40 gpm, up to 250 gpm reported for pumped wells (south of planning area); specific capacity, 0.12-.2 gpm/ft. Oil field data: porosity, 15-18%; permeability, 0.4-4 gpd/ft2; transmissivity, 7-230 gpd/ft. | Water from Cloverly and Morrison Formations in Natrona County predominantly Sodium Bicarbonate type. Other types include Calcium Bicarbonate, Calcium Sulfate, Sodium Sulfate, and Calcium Sulfate. TDS content range between 300 and 3000 mg/l. | Generally deeply buried in planning area except at outcrops. Yields small supplies to springs at outcrops. Well yields of 5 to 20 gpm may be expected. Yields of greater than 100 gpm may be possible from complete section of rocks. | ||
| Madison Aquifer System | Tensleep Sandstone | 50-250 (Northwestern Basin) <500 (Southwestern Basin) |
Fine- to medium-grained, massive, crossbedded sandstone with occasional thin dolomite beds. | Unit of Madison Aquifer System. Flowing yields up to 400 gpm; Specific capacity, 1 gpm/ft. Oil field data: porosity, 0-24%; permeability, 0-21 gpd/ft2; transmissivity, 0-1900 gpd/ft. | Water type is variable ( Magnesium Carbonate, Calcium Magnesium Sulfate, Sodium Sulfate,Calcium Sodium Sulfate, Calcium Sulfate) and concentration of TDS varies directly to distance from the outcrop and generally ranges from<300 -3240 mg/l. Generally very hard but suitable for domestic, stock and irrigation use at or near outcrop. (Crist and Lowry, 1972), (Whitcomb, Cummings and McCullough, 1966) TDS content 204 - 2930 mg/l in six samples in Natrona County (Larson, 1984). | Sandstone generally well cemented, but primary permeability is sufficient at most locations to permit yields of 50 gpm to wells. There is potential for higher yields where secondary permeability is high. Yield of 600 gpm reported for an irrigation well at the foot of the Bighorn Mountains in Johnson County . Development may be limited economically due to deep drilling depths in Johnson County in outcrop area or in narrow belt generally less than about one mile paralleling the east margin of the outcrop. (Whitcomb, Lowry, and (McCullough 1966), (Crist and Lowry, 1972) | |
| Amsden Formation | 150-300 (Northwestern Basin) 0-200 (Southwestern Basin) |
Red and purple shale with some sandstone, cherty dolomite and limestone. | Aquitard unless fractured. | Generally deeply buried in planning area except at outcrops. Ground water possibility generally not known. | |||
| Madison Limestone | 1100± (Northwestern Basin) 200-400 (Southwestern Basin) |
Limestone, dolomitic limestone and dolomite, sandy at base | Principal unit of Madison Aquifer System. Flowing yields over 4000 gpm but highly variable; specific capacity. <1 to 50 but is flow-dependent; transmissivity, 500-90,000 gpd/ft or higher and highly variable. | Waters at Outcrop (TDS < 600mg/l, predominantly Calcium Magnesium Bicarbonate type water). TDS increase basinward to > 3,000 mg/l, Sodium Sufate Chloride predominating. Fluoride enrichment characteristic of Madison System waters throughout the PRSB basin. Concentrations of radionuclides could be of concern in some areas. | Probably most important high yield aquifer in Wyoming. Historical source for municipal / public water supply, industrial, irrigation and stock use in PRSB. Several fish hatcheries use Pahasapa / Madison aquifer as water source in northeastern part of PRSB. Yields variable geographically and dependent on secondary permeability. Drilling depths may inhibit development. | Total estimated recharge to the Madison Limestone in the PRSB in 1973 was about 75,000 acre feet/year. (WSEO, 1976) | |
| Bighorn Dolomite | 400-500 (Northwestern Basin) absent (Southwestern Basin) |
Massive dolomite, becoming thin-bedded at top and sandy at base | Generally deeply buried except in outcrop areas. Ground water possibilities generally not known. | Ground water possibilities generally not known. Probably would yield water to wells depending on secondary permeability. | |||
| Flathead Sandstone | 345± (Northwestern Basin) 90 (Southwestern Basin) |
Tan to reddish sandstone, locally conglomeratic, interbedded with green shale and siltstone. | Minor unit of Madison Aquifer System. Not exploited due to deep burial but a few wells yield water near outcrops. | Ground water possibilities generally not known. Probably would yield water to wells depending on secondary permeability. Generally deeply buried except in outcrop areas. Yields small quantities of water to springs from sandstone and conglomerate in the Bighorn Mountains. (McCullough 1966), (Crist and Lowry, 1972) |
AReported yields may reflect development needs rather than aquifer capability; higher yields canm sometimes be expected, with corresponding drawdown increases. Reported water well transmissivities or permeabilities may be for wells completed in two aquife
BOilfield (and USGS test) data are variously derivied resulting in internal inconsistencies in this compilation. Permeabilities are measured on cores or derived from other data and transmissitivities are from drill stem tests or calculated from permeability
CActual development potential will require site specific affice and field investigations to define aquifer capability and constraints unique to each project and site.
Take from: Feathers, Libra, Stephenson and Eisen, 1981, Occurance and Characteristics of Groundwater in the Powder River Basin, Wyoming
Aquifer Sensitivity/Vulnerability
The Wyoming Spatial Data and Visualization Center (SDVC . now known as the Wyoming Geographic Information Science Center or WyGISC) developed a system to assess the sensitivity and vulnerability of ground water to surface water contamination in Wyoming. The SDVC developed aquifer vulnerability maps to define the potential for surface contamination to impact ground water in the uppermost aquifer throughout Wyoming. The highest rated lands generally are located on alluvial deposits adjacent to rivers, streams, and lakes, and are associated with slope wash, colluvium, residium and eolian deposits or are on fractured bedrock areas.
Maps of aquifer vulnerability to contamination for the uppermost or shallowest aquifers were also developed by SDVC. Ground water is vulnerable in areas with high water tables, sandy soils, and areas of presumed pesticide application. The areas with the highest vulnerability are also generally located in the floodplains of the major streams and/or associated with slope wash, colluvium, residium and eolian deposits within the planning area.
The ground water sensitivity and vulnerability maps are provided in the .Available Ground Water Determination. memorandum.
Ground Water Development
Ground water is the major source of water for many uses within the planning area. All five aquifer systems are important water sources in the planning area for all uses. Ground water associated / co-produced with coalbed methane development although not a use, is very important due to withdrawal impacts on ground water levels and existing wells completed in the Fort Union/Wasatch Aquifer System.
Existing Development
Selected existing and historical uses of ground water from the five aquifer systems within the planning area are summarized in Table III-34. The significance of ground water in the planning area is demonstrated by the 16,432 active ground water permits (as of December 31, 2000) within the planning area. Because of the dynamic nature of CBM development, the inventory of permitted CBM wells was updated to reflect data as of December 31, 2001. The number of permits for each use category are summarized below:
Ground Water Monitoring Programs
Existing ground water monitoring programs will continue to be important in monitoring the status of ground water in the PRSB and the planning area for all activities. One such program is the Wyoming statewide USGS cooperative program operated by the SEO and other state, county, municipal and federal agencies.
The Gillette Area Groundwater Monitoring Organization (GAGMO) and the recently formed (April 1999) Powder River Basin Area Groundwater Monitoring Organization (PRAGMO) are for coal mining and coalbed methane development. GAGMO is operated by the coal mining industry and PRAGMO by the coalbed methane development operators. These programs provide a common database that satisfy federal and state agency requirements for the respective industries to track and evaluate impacts of their operations on ground water in the PRSB.
Other state and federal agencies have their own monitoring programs associated with their management and regulatory responsibilities. State agencies include SEO, Oil and Gas Conservation Commission and the Department of Environmental Quality. Federal agencies include the Bureau of Land Management and the Forest Service.
Agricultural, Municipal, Industrial and Misc., Domestic and Stock Uses and Ground Water
Out of a total of 16,432 active ground water permits inventoried as of December 31, 2000, for the basin plan, 9,612 of the permits were for WWDC categories other than coalbed methane development.
Reported well depths for the 111 active permitted agricultural wells with production rates greater than 49 gpm ranged from 3 to 4,689 feet and averaged 720 feet. Reported depths to the top of the "main water bearing zones" in the permit data ranged from 3 to 4,418 feet and averaged 657 feet. The maximum and average reported "actual yields" of these wells were 2700 gpm and 280 gpm.
There were a total of eight permitted active municipal wells with production rates greater than 49 gpm. Reported well depths ranged from 18 to 4,170 feet and averaged 1,282 feet. Reported depths to the top of the "main water bearing zones" in the permit data ranged from 11 to 2,680 feet and averaged 716 feet. Reported "actual yields" of these wells ranged from 70 to 990 gpm and averaged about 399 gpm.
There were a total of 301 permitted active industrial and miscellaneous wells with production rates greater than 49 gpm. Reported well depths ranged from 9 to 15,400 feet and averaged 1,987 feet. Reported depths to the top of the "main water bearing zones" in the permit data ranged from 4 to 9,722 feet and averaged 1,666 feet. Reported "actual yields" of these wells ranged from 50 to 9,479 gpm and averaged about 375 gpm.
A total of 4,646 permitted domestic wells were reported in the planning area. Reported domestic well depths ranged from 1 to 9,600 feet and averaged 216 feet. Reported depths to the top of the "main water bearing zones" in the permit data ranged from 1 to 4,070 feet and averaged 180 feet. Reported "actual yields" of these wells in the permit data files ranged from 1 to 1,800 gpm and averaged about 13 gpm.
A total of 4,546 permitted stock wells were reported in the data for the planning area. Reported stock well depths ranged from 1 to 9,537 feet and averaged 329 feet. Depths to the top of the "main water bearing zones" ranged from 1 to 6,533 feet and averaged 291 feet. Reported "actual yields" of these wells ranged from 1 to 2,700 gpm and averaged about 14 gpm.
The relative importance of each of the aquifer systems to each use category is summarized in Table III-34. This information together with the maps provided in the Available Ground Water Determination Technical Memorandum can be used to make further inferences at an initial level, as to the relative importance of each of the aquifer systems with respect to the five non-coalbed methane use categories in the planning area.
Impacts on Ground Water and Surface Water Supplies
Impacts to ground water will depend on local geologic and hydrologic conditions in the areas of development. Possible impacts to ground water could include:
Ground water development in any of these areas, irrespective of proposed use, will require detailed investigations that also address the possibility and degree of surface and ground water interconnection. Depending on proposed ground water use, the existing SEO permitting process should be able to address the issue. The Wyoming Department of Environmental Quality, Water Quality Division (WDEQ/WQD) might also be involved in the permitting process with respect to surface / ground water interconnection under provisions of the USEPA Safe Drinking Water Act (Ground Water Under the Direct Influence of Surface Water).
The SEO permitting process for ground water has historically addressed these issues. New legislation would be required to establish ground water control zones for any ground water use other than agricultural use. The potential problem in conjunction with coalbed methane development has also been recognized (depletion of aquifers and wells), and responsible state and federal agencies are attempting to address related ground water impacts.
For ease of reference, the main coal seam that is the target of coalbed methane development in the PRSB and within the planning area is referred to as the Wyodak-Anderson coal zone. Methane gas is trapped in micropores and cleat fracture systems within the coal, and is maintained in that state by the natural pressure of ground water. The gas is extracted using wells that are completed in the coal to remove water and lower the water pressure responsible for holding the gas. The gas moves out of the coal as the water pressure is lowered, and is recovered from the well along with the water.
As previously noted, a total of 9,393 coalbed methane wells (December 31, 2001) were identified through the SEO data query for the Basin Plan. Reported coalbed methane well depths ranged from 92 to 15,220 feet and averaged 712 feet. Reported depths to the top of the "main water bearing zones" in the permit data ranged from 58 to 3816 feet and averaged 653 feet. Reported "actual yields" of coalbed methane wells in the permit data files averaged 37 gpm.
The BLM has recently used 12 gpm (USDI, 1999, Wyodak Coalbed Methane Project Final Environmental Impact Statement) and 11.1 gpm (USDI, 2000, Wyodak Drainage Coalbed Methane Environmental Assessment) for average production rates of coalbed methane wells in the preparation of Environmental Impact statements for coalbed methane development within the planning area. The actual ground water production rate is typically variable throughout the life of each well. As an example, BLM projected the initial ground water production rates of the wells for the Lighthouse Coalbed Methane Project to be 11 gpm, with an interim average of 7 gpm and a final rate of less than 3 gpm per well (USDI, 1995, Lighthouse Coalbed Methane Project Environmental Assessment).
The USGS, in cooperation with BLM and coalbed methane production companies, is conducting multidisciplinary studies in the PRSB in an effort to provide a better understanding of coalbed methane resources and associated water. A USGS report for one of the studies in progress provides preliminary compositional data on water from 47 coalbed methane wells sampled between June, 1999 and May, 2000. Water co-produced with coalbed methane is generally a sodium bicarbonate type. Of the 47 wells sampled by USGS, 15 are located within the area of the Powder/Tongue River Basin Plan and 32 are located within the Northeast Wyoming River Basins Plan Area. Total dissolved solids content (TDS) of all 47 samples ranged from 270 to 2010 and averaged 850 mg/l. Values of the sodium adsorption ratio ((SAR), which is a relative measure of the suitability of water for irrigation due to sodium content) for the 47 samples ranged from 5.7 to 32 and averaged 12. For comparison, an SAR of roughly 13 would generally be considered the upper limit for field crops in clayey soils.
TDS and SAR of the 15 samples from coalbed methane wells in the planning area ranged from 540 to 2010 mg/l (mean 1309 mg/l) and 7.7 to 32 (mean 19.82) respectively. TDS and SAR of the 32 samples from coalbed methane wells in the Northeast Wyoming River Basins Plan Area ranged from 270 to 1170 mg/l (mean 653 mg/l) and 5.7 to 12 (mean 7.85) respectively. The results of the USGS samples indicated that TDS and SAR in waters in the Wyodak-Anderson coal zone generally increase in the PRSB from south to north and from east to west.
Concentrations of most of the 17 trace elements analyzed by USGS in samples of water from the 47 coalbed methane wells were below detection limits. All the concentrations of trace elements were below the maximum contaminant levels of the Primary Drinking Water Standards of the USEPA. The USGS reported that there were no noticeable trends in trace element concentrations in the samples from the 47 wells.
Impacts on Ground Water and Surface Water Supplies
Potential impacts to ground and surface water have been identified by BLM in the preparation of environmental assessments (EA) and environmental impact statements (EIS) for numerous coalbed methane projects in the PRSB including the planning area. Impacts to ground water will depend on local geologic and hydrologic conditions in the areas of coalbed methane development. Possible impacts to ground water that have been identified include:
Future Development
The geology, drilling depths, hydrogeologic characteristics and ground water quality of aquifer systems vary throughout the planning area. All of the aquifer systems in the planning area previously discussed probably have some potential for development. Site specific investigations in conjunction with experience and common sense will be required to determine the opportunities available to develop ground water with wells of sufficient capacity for a specific use within the planning area.
Although there have been considerable hydrogeological investigations in the PRSB including the planning area, there have been few regional assessments of the annual recharge, storage and sustained yield capability of the major aquifer systems both in the PRSB and the planning area. General conclusions regarding ground water development potential of four of the five major aquifer systems in the planning area discussed in this report are summarized below: