Wyoming State Water Plan
Wyoming State Water Plan
Wyoming Water Development Office
6920 Yellowtail Rd
Cheyenne, WY 82002
Phone: 307-777-7626

Wyoming Water Development Office
6920 Yellowtail Rd
Cheyenne, WY 82002
Phone: 307-777-7626


A. OverviewThis chapter describes and quantifies the current water uses in the Powder/Tongue River Basin planning area. The quantification of current water consumption is used to evaluate the overall use of water in the Basin relative to Compact allotments, for comparing existing water use to existing water supplies, and as a basis for projecting future water demands by the various uses.
As with all chapters in this final plan report, explicit lists of references are not provided. Instead, all references to reports, maps, and personal communications are provided in the Technical Memoranda prepared for each category of water use. The reader is referred to the following technical memoranda for a more detailed description of each topic as well as the list of references:
B. Agricultural Water UseIntroduction
Irrigated agriculture in the planning area is primarily associated with forage production for the livestock industry. Ranchers depend on irrigated cropland to provide winter feed and summer grazing for a successful ranching enterprise. Early in Wyoming's history, ranchers had discovered that successful farming required irrigation. By the 1890's, many ranchers were taking advantage of cheap irrigation of bottomlands along the small tributary streams, but most of the water from the large rivers was being carried unused into other states. As the direct flow supply of the streams became fully appropriated, reservoirs were constructed, where suitable sites could be found, to store spring runoff for late-season irrigation uses. One of the earliest of these was Cloud Peak Reservoir. This reservoir began as a natural lake on the main stem of South Piney Creek. An earthen embankment and an outlet works were constructed to increase the storage regulation potential of this site. Today there are 14 significant storage facilities in the Powder/Tongue River Basin planning area, allowing for expanded irrigation use of the natural flows in the planning area
According to the 1972 Framework Water Plan, well over 80 percent of the water consumed by man's activities in the Northeastern corner of Wyoming is used for irrigation. An accurate estimate of current agricultural water use is, therefore central to a comprehensive water use inventory. Estimates of water use by agriculture can generally be divided into the following three components:
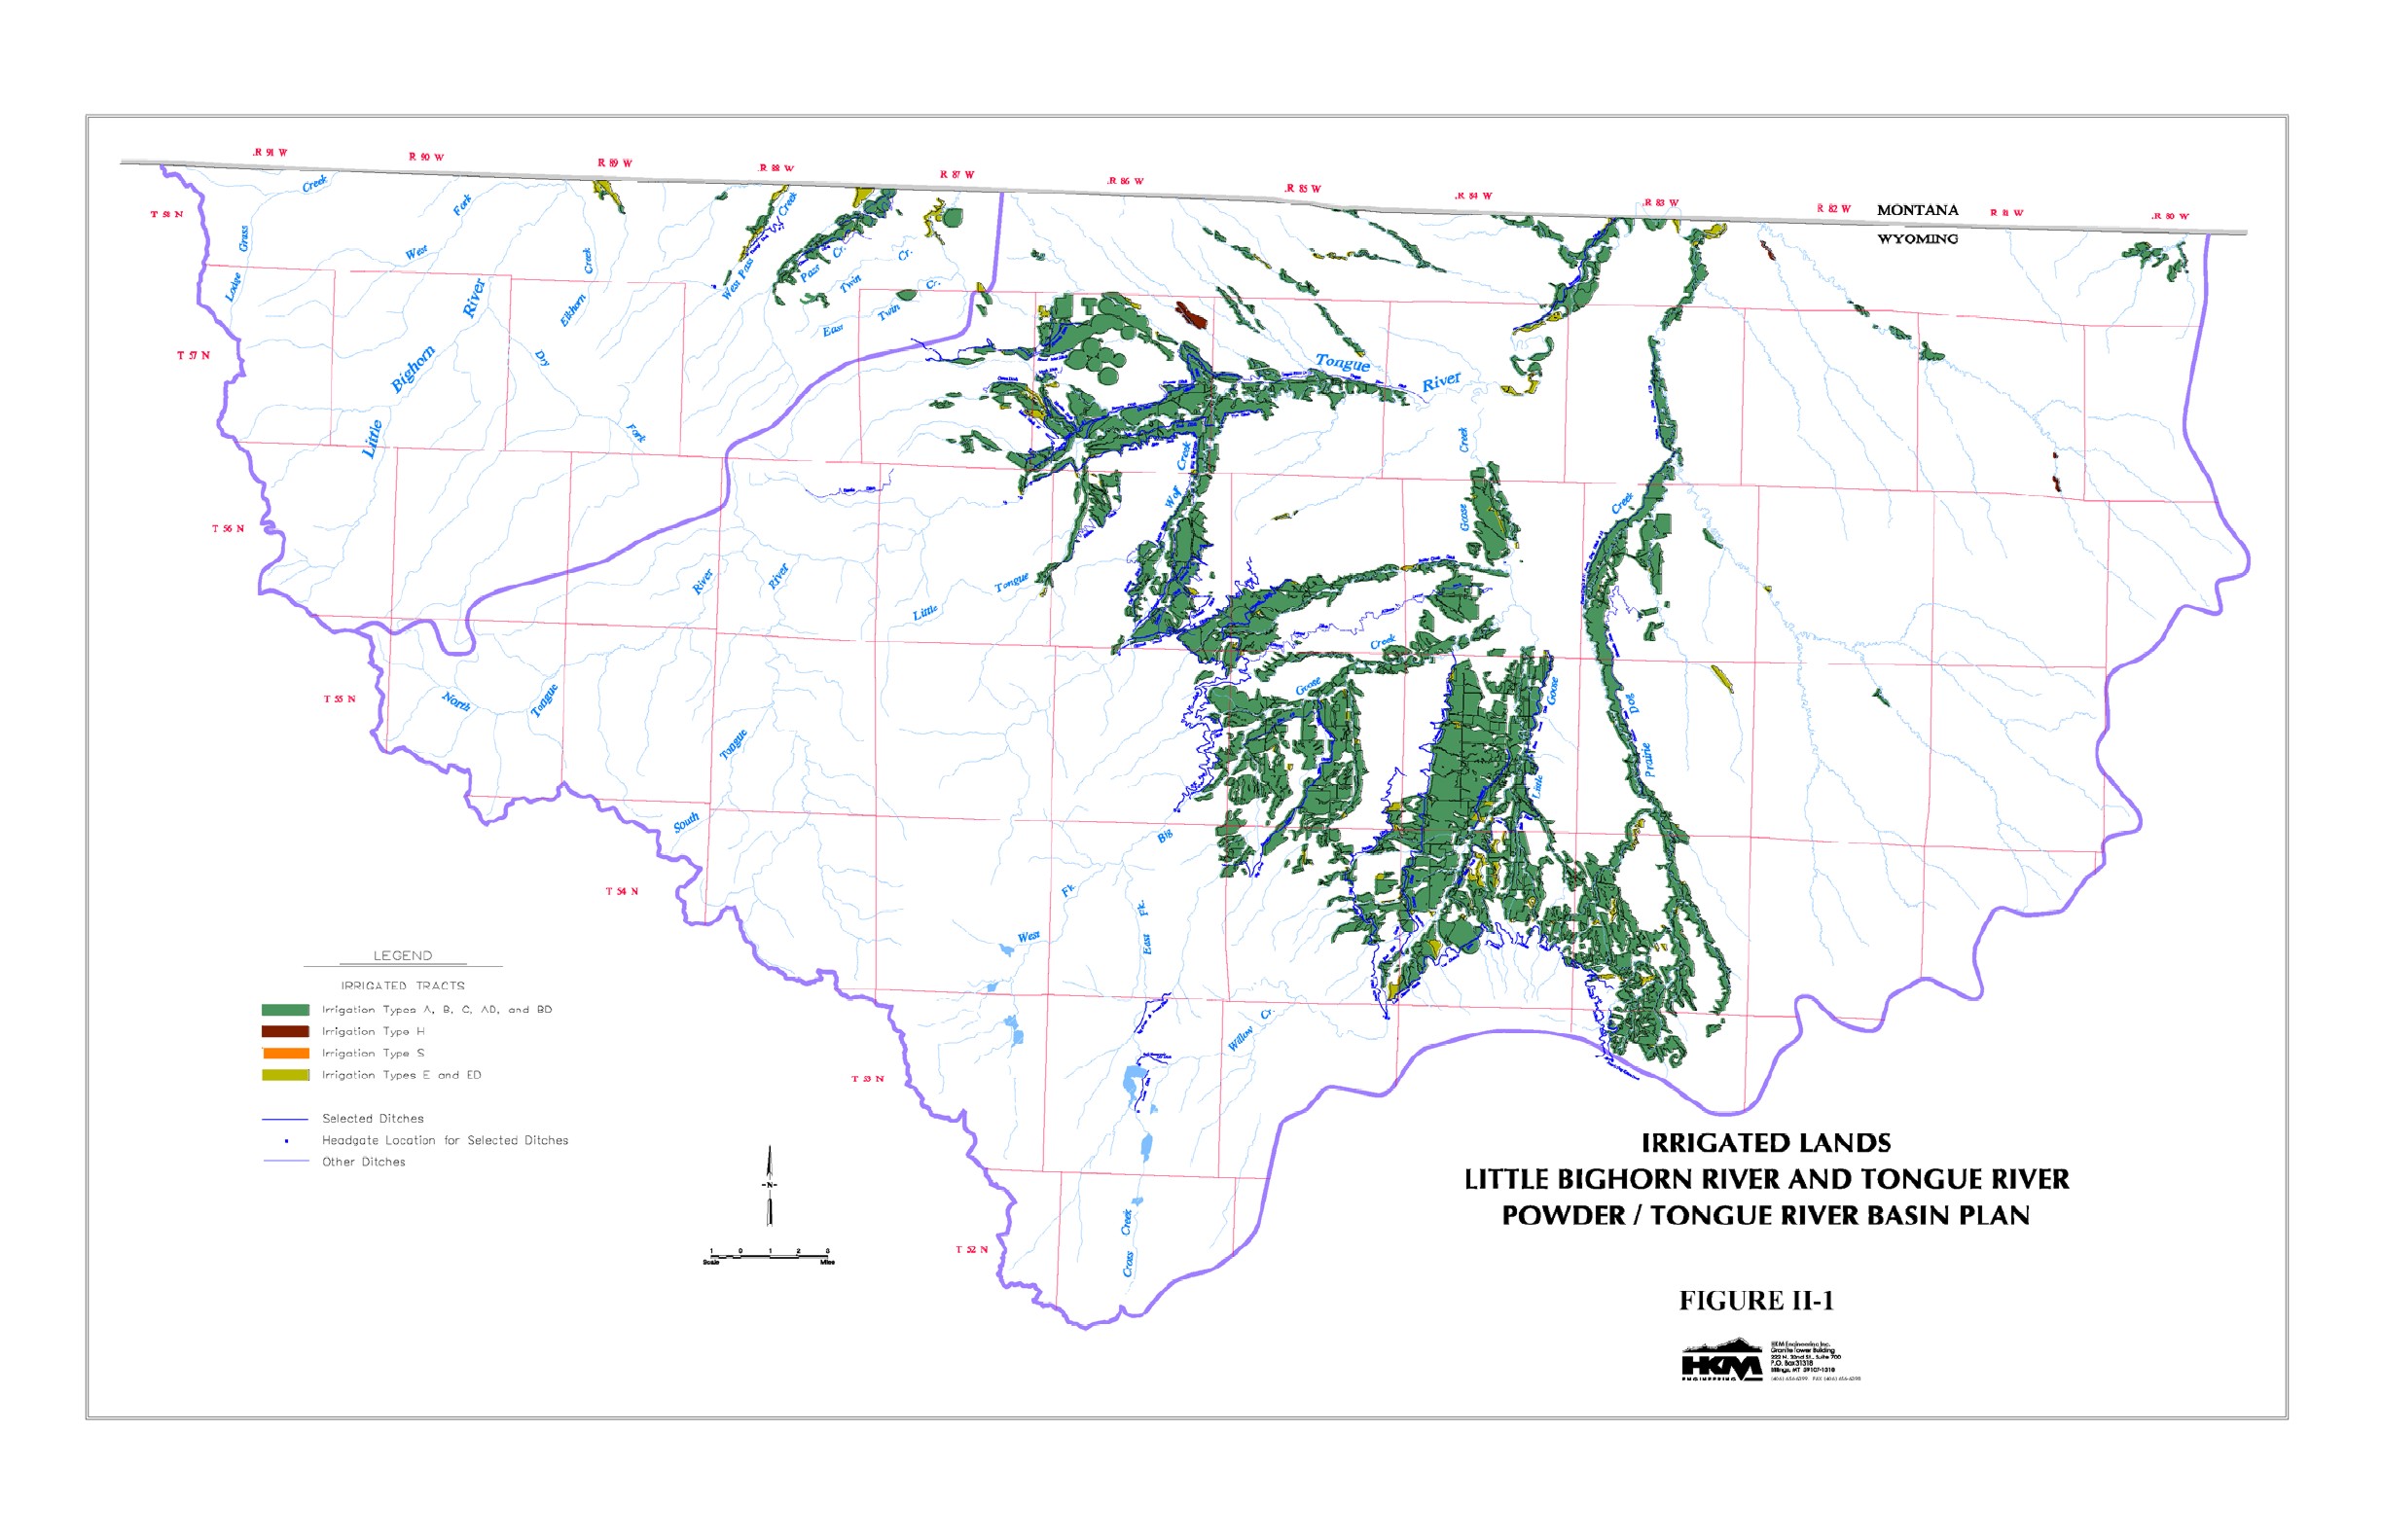
A 1:24,000 scale Geographic Information System (GIS) data theme was developed to represent the spatial extent and character of irrigated lands throughout the planning area. The most current (1994 to 1996) stereo aerial photography was used as the primary basis for mapping the irrigated lands. In addition to the 1994/1996 stereo aerial photography, 1983 Color Infrared (CIR) aerial photography, and 1979 black-and-white aerial photography available for portions of the planning area were utilized to verify the limits of irrigation. The Tabulation of Adjudication Surface Water Rights of the State of Wyoming, ditch plat maps, and irrigation wells data obtained from the State Engineer's Office were utilized to further double-check areas of prospective irrigation. Following the office mapping process, field verification of the mapping results was performed and the mapping was provided to the SEO Division 2 field personnel for further verification. All man induced irrigation or subirrigation was delineated and irrigated lands were divided into the following categories:
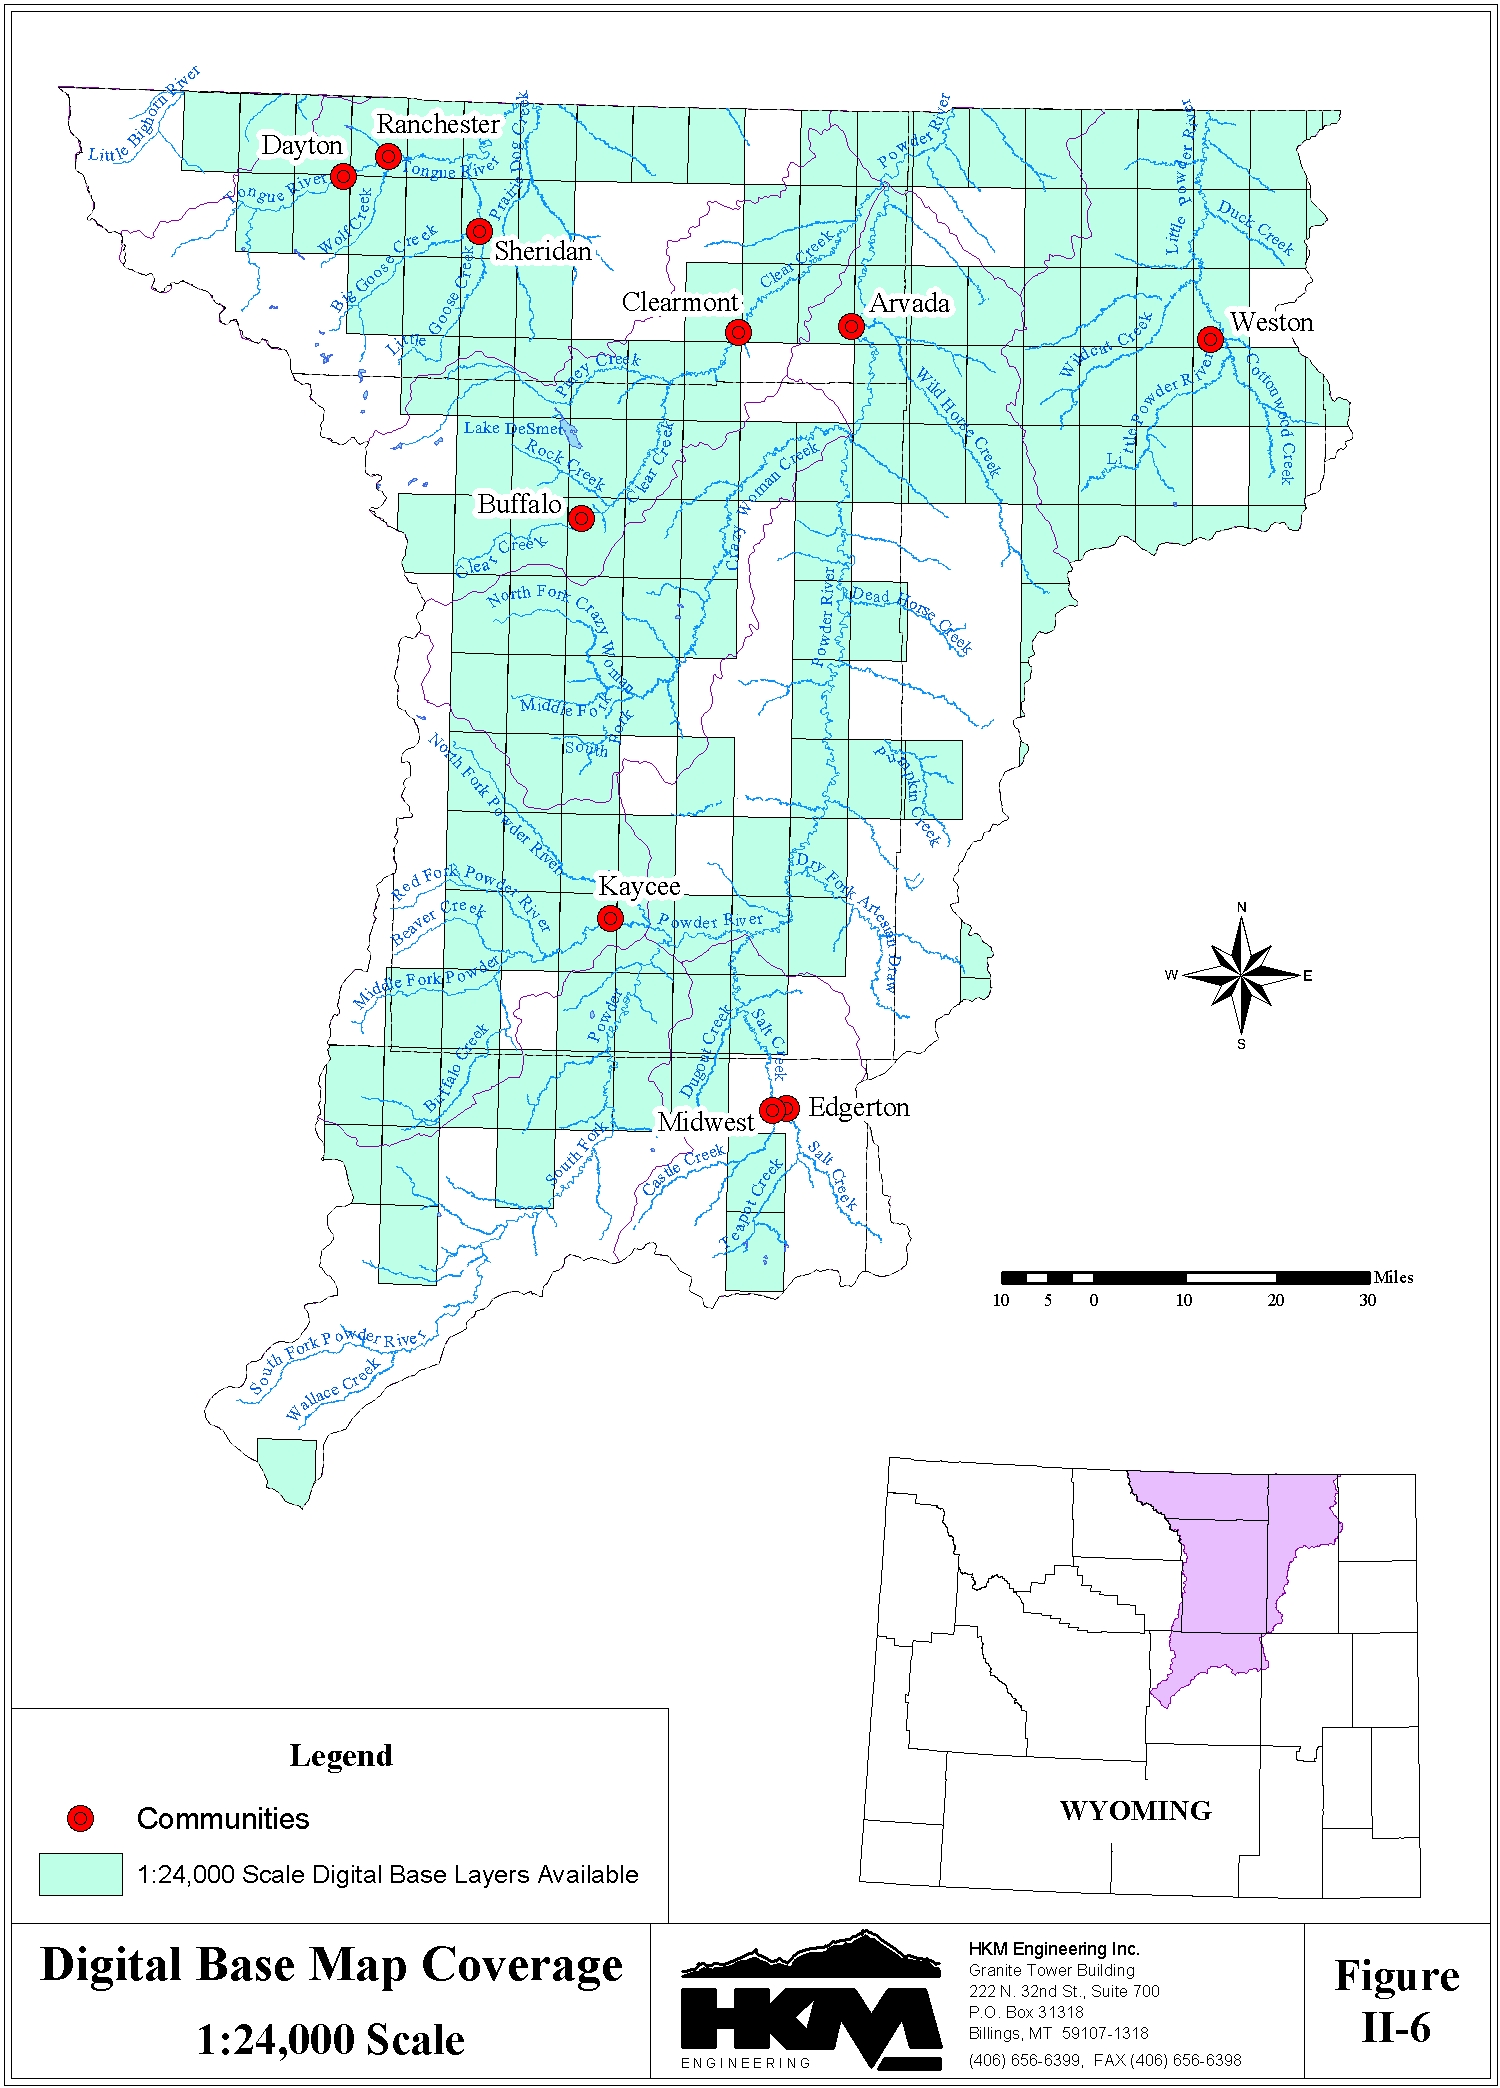
A - Full service irrigation (typically receives a full water supply);The irrigated lands were grouped together into Service Areas, defined as lands served by a common supply ditch. A Point of Diversion GIS data theme was developed to identify the point of diversion for lands served within each service area. Vectorized digital base mapping developed from USGS quadrangle maps was obtained for this Basin Plan to provide perspective in the areas of irrigation.
B - Partial service irrigation (typically receives a reduced water supply due to limited water availability or the inability to provide complete field coverage);
C - Man induced subirrigation (beneficial use resulting from incidental irrigation such as ditch seepage to areas below a canal);
E - Idle irrigation (lands not currently receiving water, typically due to nonfunctional delivery facilities);
S - Spreader dike irrigation (dikes constructed across ephemeral streams to spread infrequent flows over the land to increase beneficial use);
H - Minor beneficial use, (lands that receive some beneficial use on occasion such as lands served by "kick-out" ditches on ephemeral streams).
AD, BD, and ED . A, B, or E lands that have underwent or are currently undergoing residential development.
A database of the water rights associated with the mapped irrigation was also developed. This database, when linked to the irrigated lands polygons through the Geographic Information System (GIS), allows for identification of the water rights attached to the polygons of irrigated land.
For a more detailed description of the attributes provided for the Irrigated Lands and Point of Diversion spatial data themes and the Water Rights tabular database, as well as the digital base maps and other associated data themes, see the "Irrigated Lands and Water Rights Data" technical memorandum.
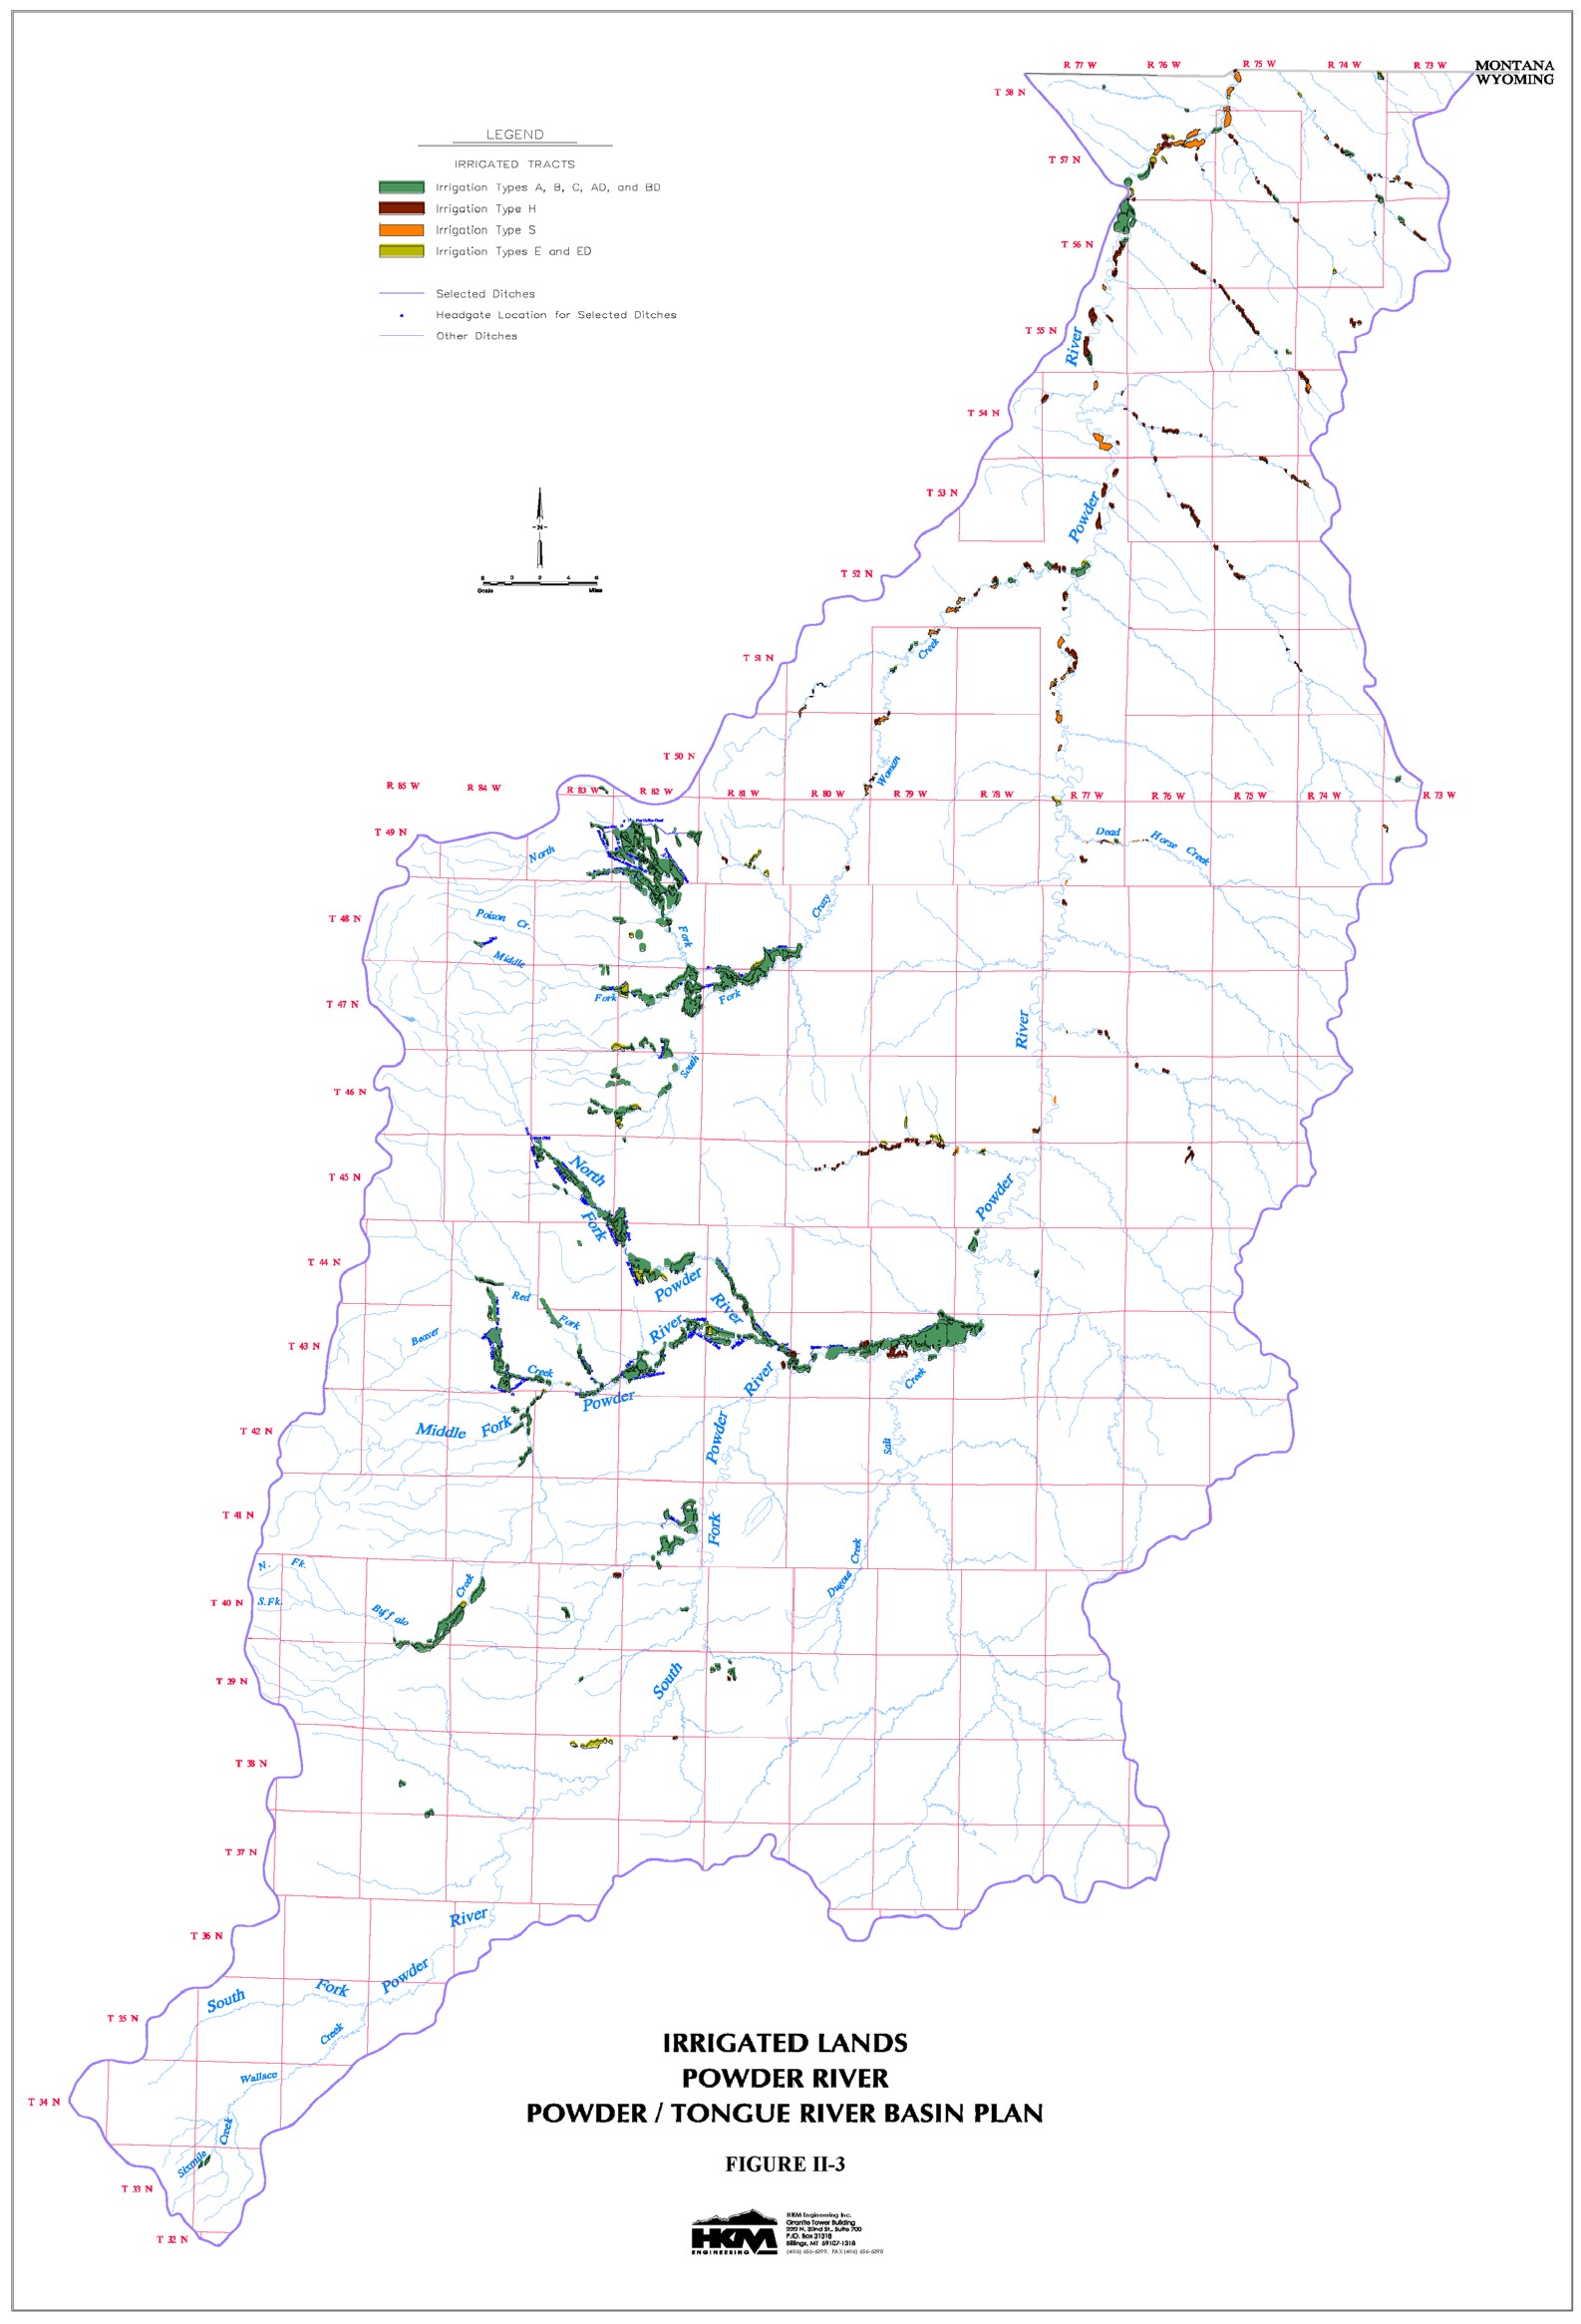
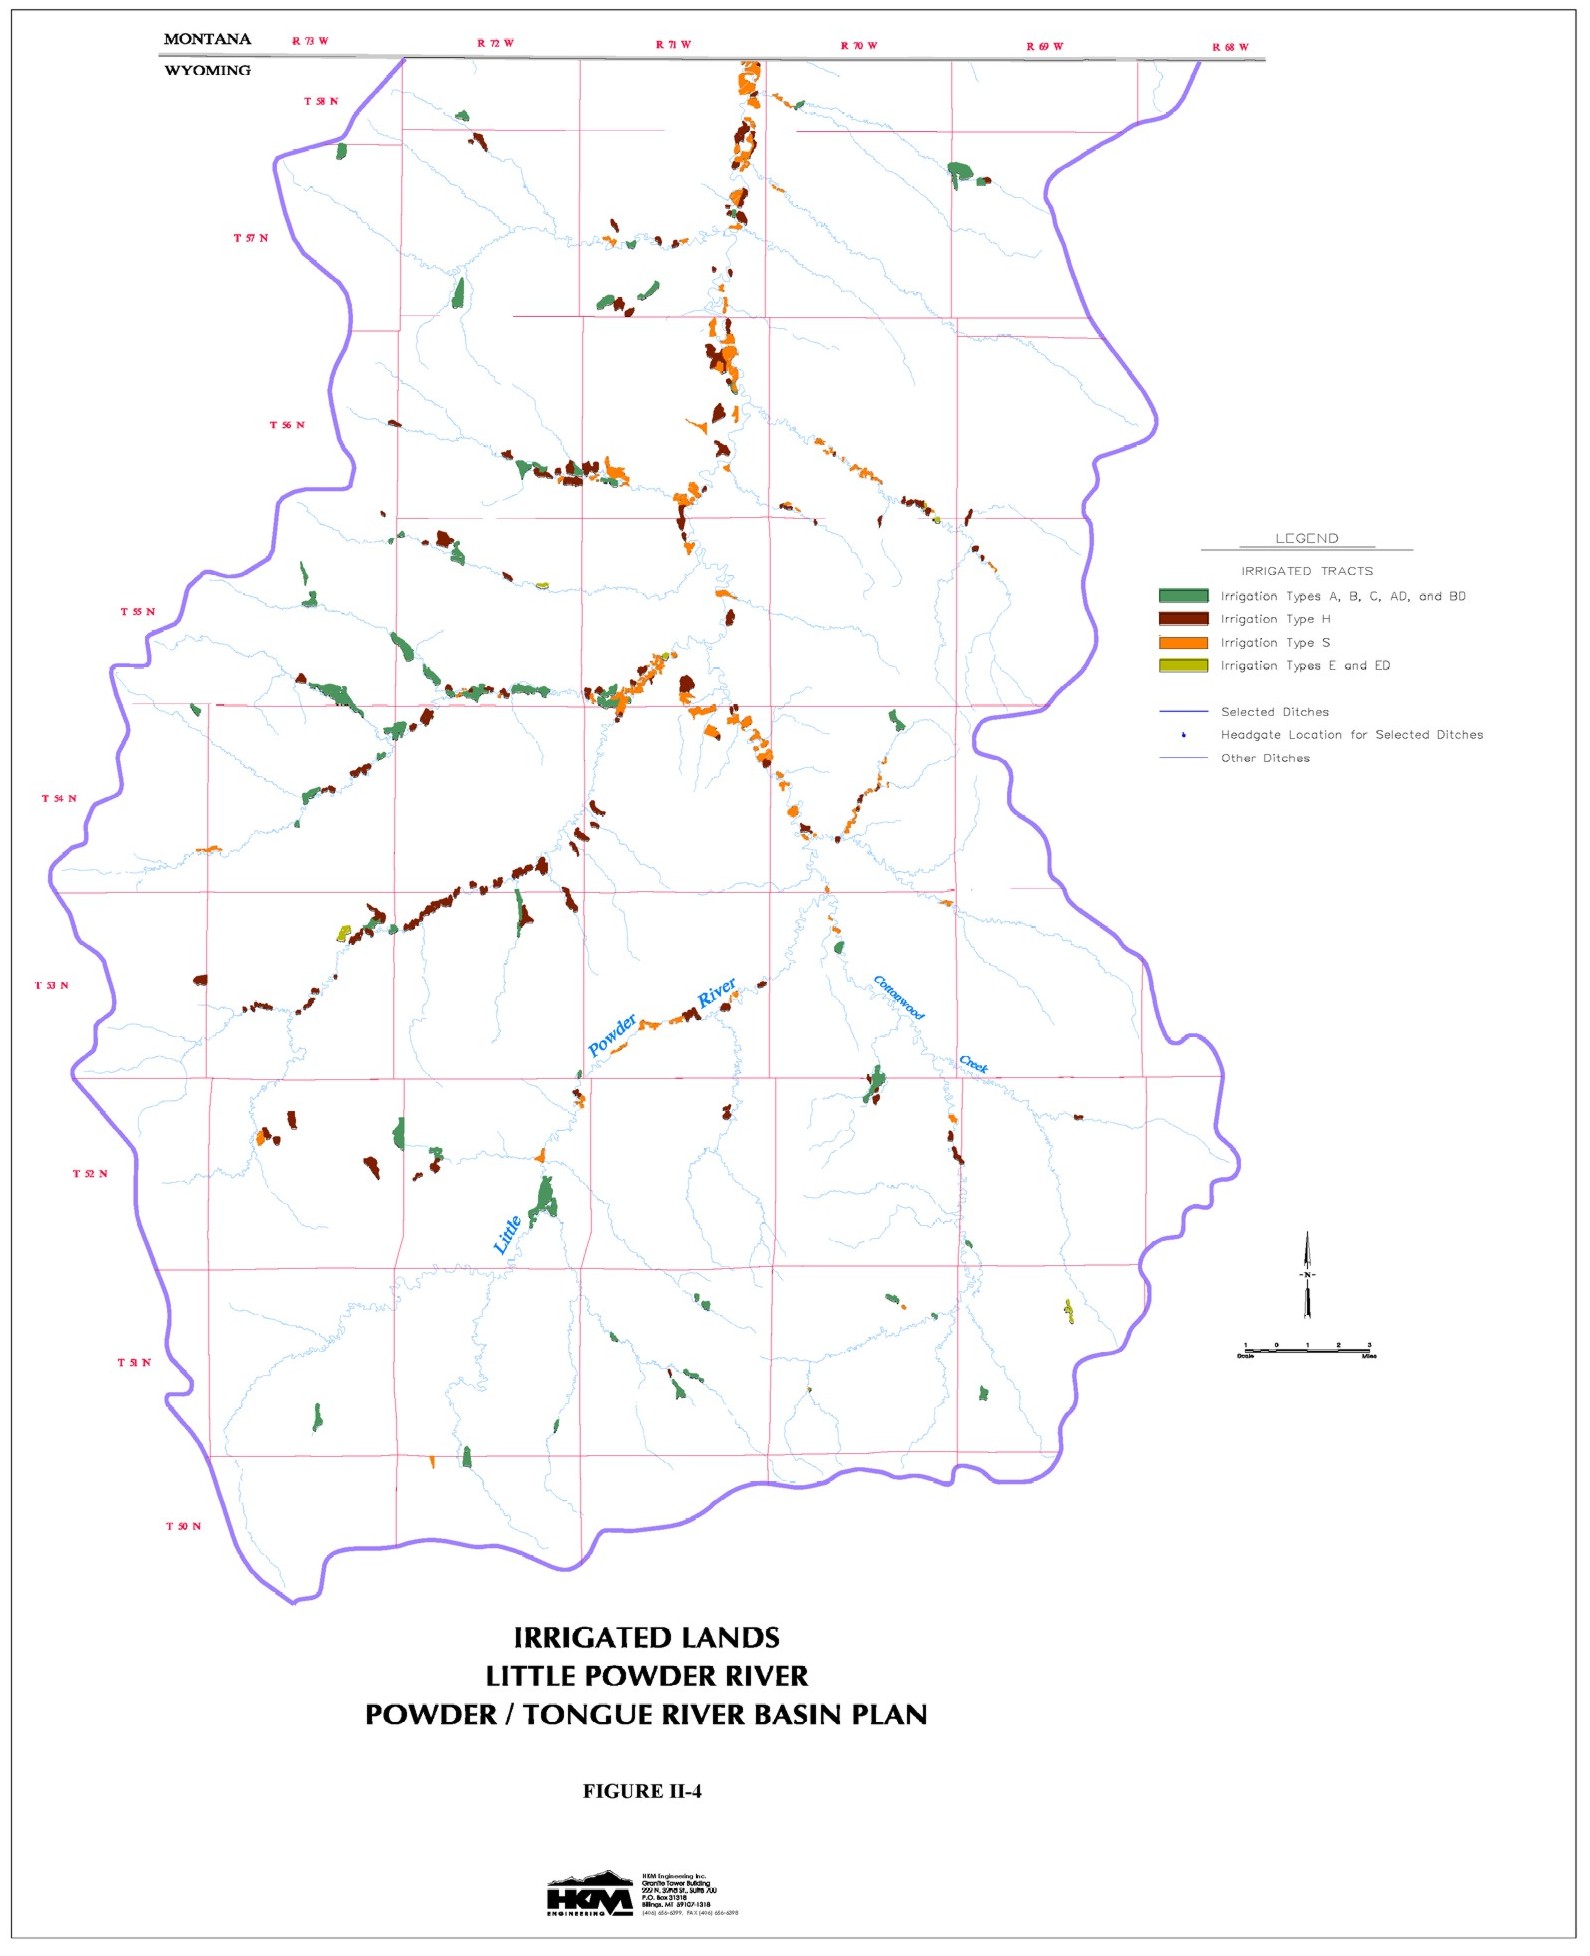
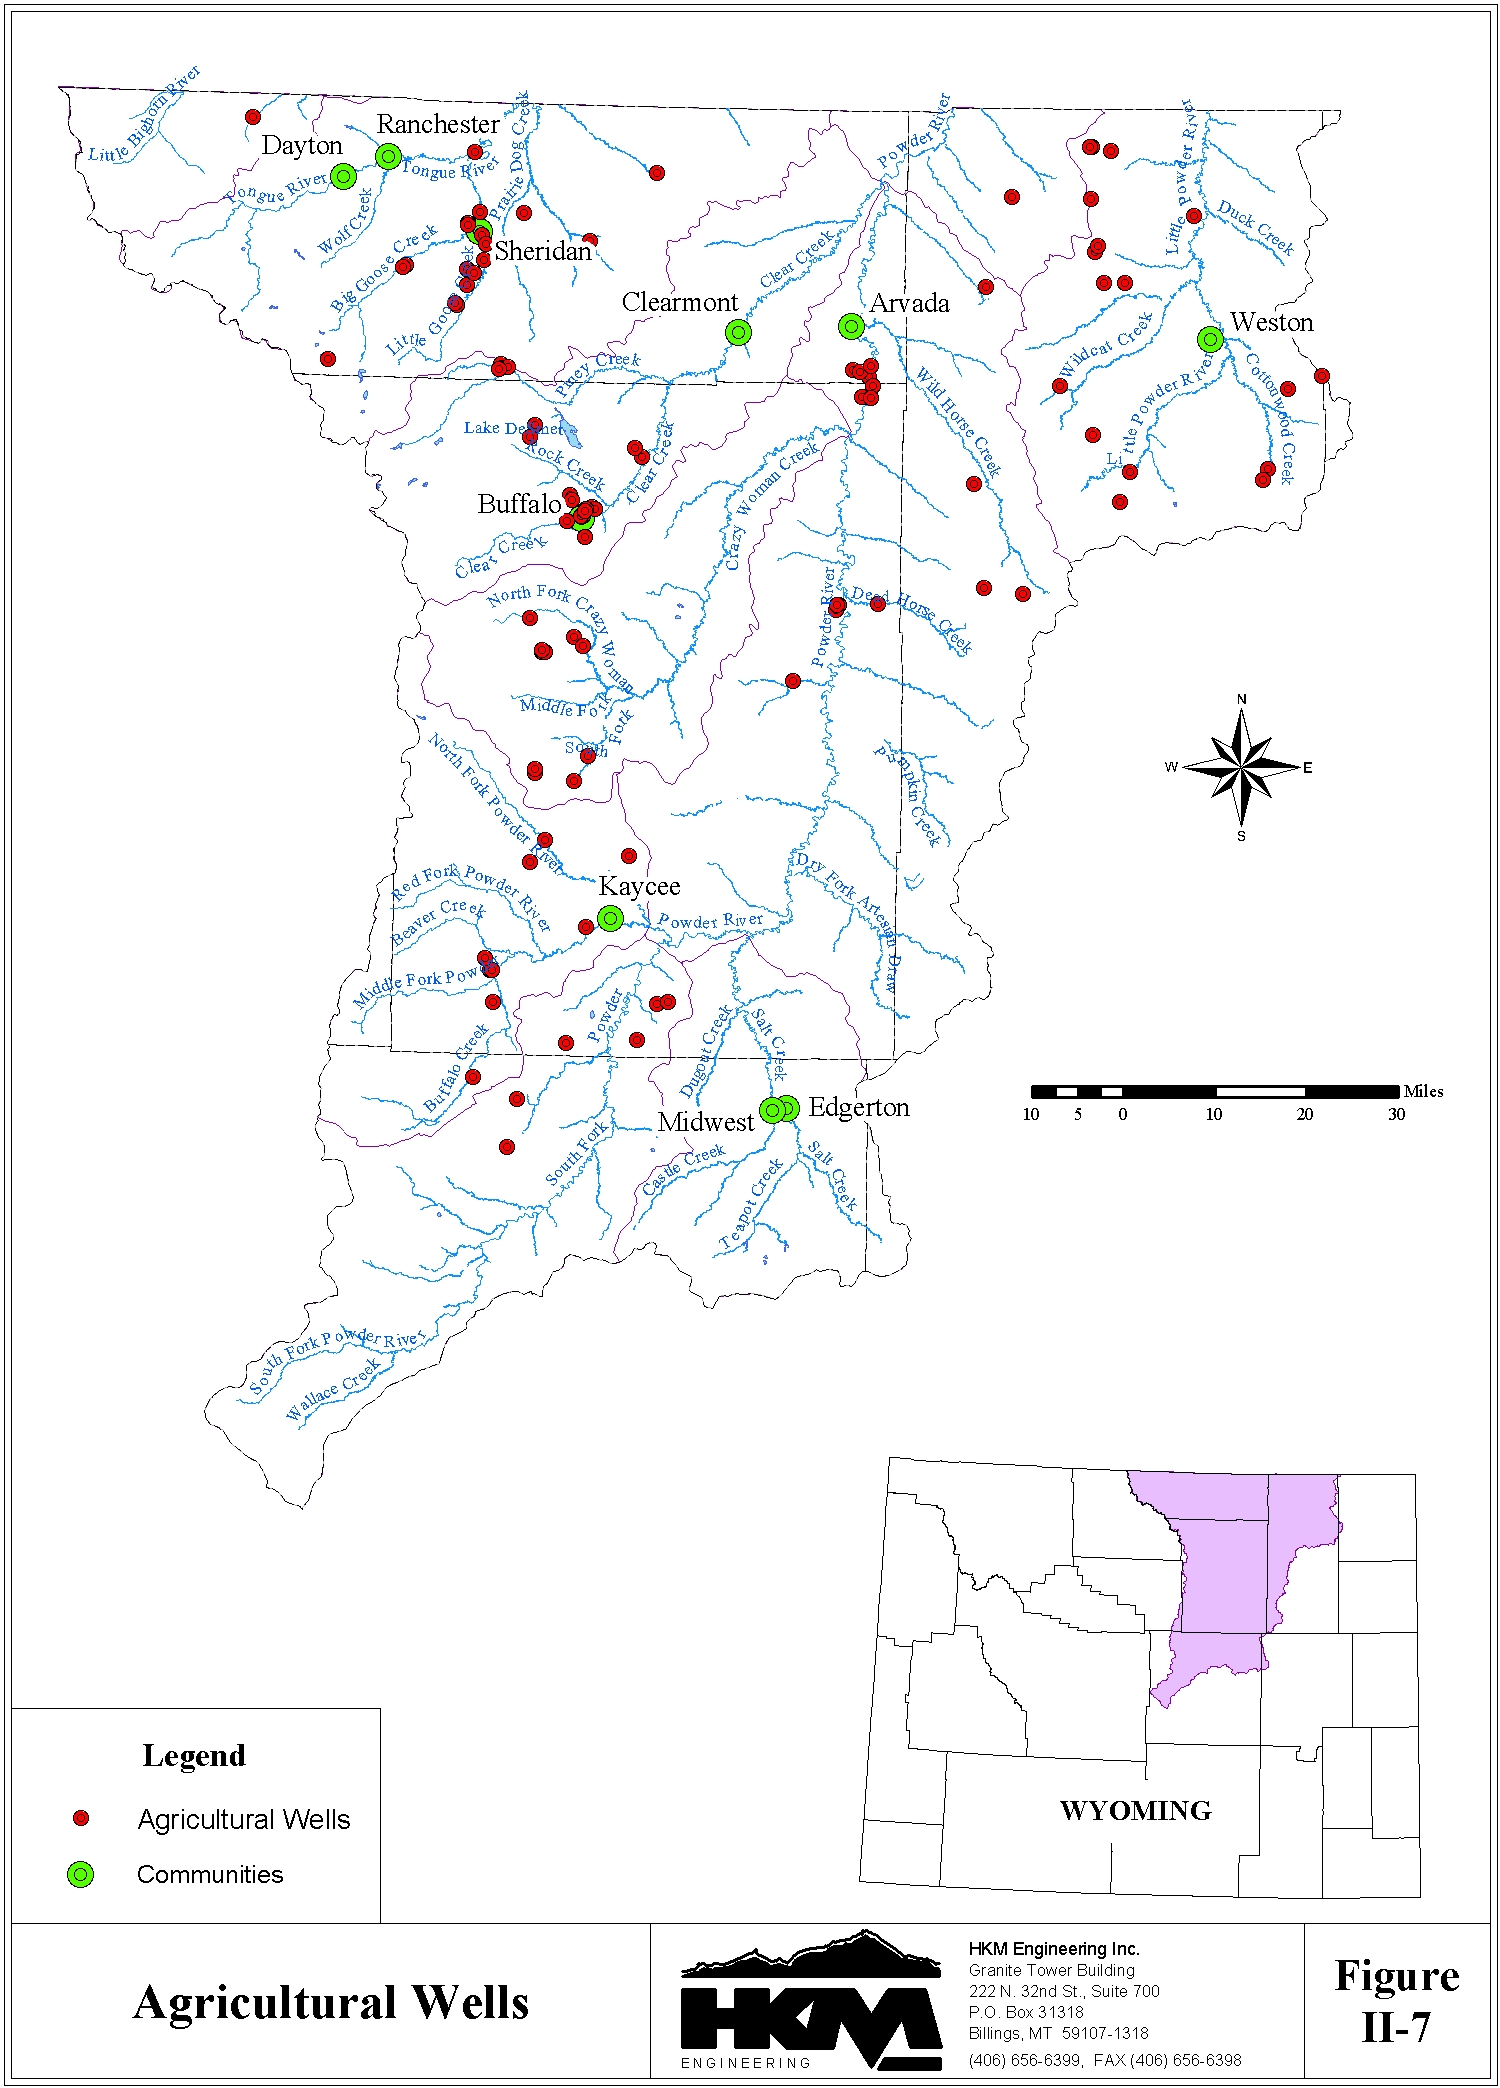
The extent of irrigated land within the planning area is shown on Figures II-1 through II-4. A typical area of irrigated lands mapping is illustrated on Figure II-5. The extent of the digital base map coverage is shown on Figure II-6 and the Agricultural Wells with yields of at least 50 gpm are shown on Figure II-7.
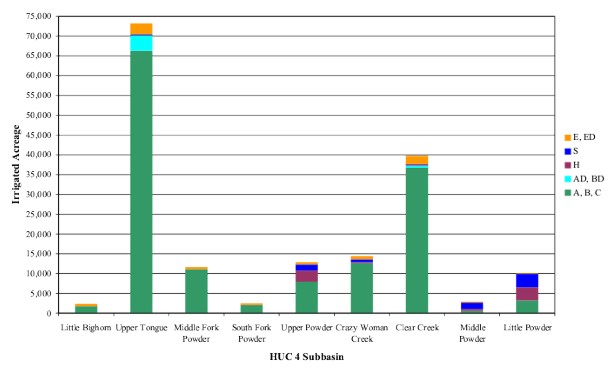
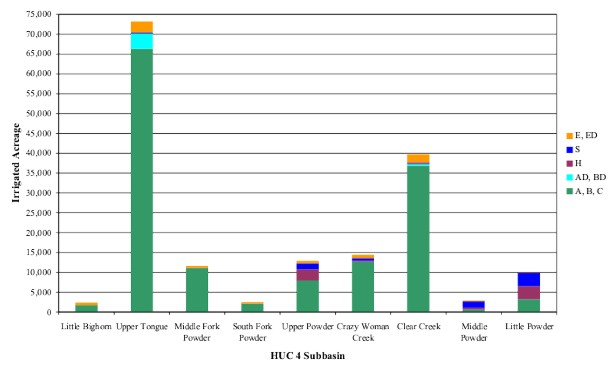
A summary of the quantity of irrigated lands is provided on Tables II-1 and II-2 and on Figure II- 8.
Table II-1
Summary of Irrigated Lands By Irrigation Classification (Acres)
| Subbasin Name |
HUC | Irrigation Classification | ||||||||||||||||
| A | B | C | AB | AC | BC | ABC | Total ABC |
AD | BD | Total AD, BD |
S | H | E | ED | Total E, ED |
Total | ||
| Little Bighorn | 10080016 | 635 | 685 | 16 | 340 | 61 | 0 | 0 | 1,737 | 7 | 0 | 7 | 0 | 0 | 632 | 0 | 632 | 2,376 |
| Upper Tounge | 10090101 | 22,085 | 12,294 | 655 | 16,099 | 4,808 | 906 | 9,487 | 66,334 | 1,926 | 1,881 | 3,807 | 245 | 52 | 2,757 | 25 | 2,782 | 73,220 |
| Middle Fork Powder |
10090201 | 2,866 | 3,156 | 0 | 2,179 | 871 | 20 | 2,031 | 11,123 | 0 | 0 | 0 | 0 | 0 | 512 | 0 | 512 | 11,635 |
| South Fork Powder |
10090203 | 645 | 734 | 91 | 561 | 0 | 0 | 0 | 2,031 | 0 | 0 | 0 | 0 | 72 | 383 | 0 | 383 | 2,486 |
| Upper Powder | 10090202 | 1,257 | 987 | 17 | 724 | 125 | 0 | 4,850 | 7,690 | 0 | 0 | 0 | 1,495 | 2,795 | 619 | 0 | 619 | 12,869 |
| Crazy Woman Creek |
10090205 | 2,351 | 2,993 | 32 | 2,007 | 568 | 0 | 4,669 | 12,620 | 0 | 0 | 0 | 688 | 254 | 843 | 0 | 843 | 14,405 |
| Clear Creek | 10090206 | 11,326 | 5,622 | 724 | 6,895 | 3,565 | 598 | 8,056 | 36,786 | 145 | 316 | 461 | 140 | 261 | 1,869 | 193 | 2,062 | 39,710 |
| Middle Powder | 10090207 | 0 | 581 | 0 | 0 | 0 | 0 | 0 | 581 | 0 | 0 | 0 | 1,553 | 484 | 275 | 0 | 275 | 2,893 |
| Little Powder | 10090208 | 163 | 2,950 | 49 | 0 | 0 | 38 | 0 | 3,200 | 0 | 0 | 0 | 3,363 | 3,312 | 172 | 0 | 172 | 10,047 |
| TOTAL | 41,328 | 30,002 | 1584 | 28,805 | 9,998 | 1562 | 29,093 | 142,372 | 2,078 | 2,197 | 4,275 | 7,484 | 7,230 | 8,062 | 218 | 8,280 | 169,641 | |
Table II-2
Summary of Irrigated Lands By Primary Source of Supply (Acres)
| Subbasin Name |
HUC | Primary Source of Water Supply | ||
| Ground Water | Surface Water | Total | ||
| Little Bighorn | 10080016 | 0 | 2,376 | 2,376 |
| Upper Tounge | 10090101 | 0 | 73,220 | 73,220 |
| Middle Fork Powder | 10090201 | 58 | 11,577 | 11,635 |
| South Fork Powder | 10090203 | 0 | 2,486 | 2,486 |
| Upper Powder | 10090202 | 45 | 12,824 | 12,869 |
| Crazy Woman Creek | 10090205 | 97 | 14,308 | 14,405 |
| Clear Creek | 10090206 | 20 | 39,690 | 39,710 |
| Middle Powder | 10090207 | 0 | 2,893 | 2,893 |
| Little Powder | 10090208 | 0 | 10,047 | 10,047 |
| TOTAL | 220 | 169,421 | 169,641 | |
Figue II-8
Acreage of Irrigated Land by Irrigation Classification
Irrigated Crops
Irrigated agriculture in the planning area is primarily associated with forage production for the livestock industry. Ranchers depend on irrigated cropland to provide winter feed and summer grazing for their stock. Alfalfa, grass hay, and pasture grass are the dominant crops grown in the planning area. Lesser amounts of small grains and corn are also produced.
Stereo aerial photography was used as a primary basis for determining the types of crop grown in the various portions of the planning area. A visual assessment of the condition of the fields and the foliage density was used as a primary means of distinguishing between alfalfa and grass hay or pasture. Row crops such as grain crops or corn were more easily distinguished visually although they were of much more limited extent. Following the office mapping process, field verification of the crop identifications was performed. Crop distributions from County Agricultural Statistics were used as a further crosscheck of the results.
The resulting distribution of irrigated crops is summarized in Table II-3 and on Figure III-9 by Hydrologic Unit Code (HUC4) subbasin.
Table II-3
Summary of Irrigated Crops (Acres)
| Subbasin Name |
HUC | Acreage | Total Active |
% Of Active Irrigated Acres | ||||||||
| Alfalfa | Grass | Grain | Corn | Idle | Total | Alfalfa | Grass | Grain | Corn | |||
| Little Bighorn | 10080016 | 591 | 1,030 | 86 | 38 | 632 | 2,377 | 1,745 | 34 | 59 | 5 | 2 |
| Upper Tounge | 10090101 | 45,981 | 15,050 | 6,596 | 2,812 | 2,782 | 73,221 | 70,439 | 65 | 21 | 10 | 4 |
| Middle Fork Powder |
10090201 | 6,345 | 3,479 | 916 | 383 | 512 | 11,635 | 11,123 | 57 | 31 | 8 | 4 |
| South Fork Powder |
10090203 | 1,289 | 550 | 186 | 78 | 383 | 2,486 | 2,103 | 61 | 26 | 9 | 4 |
| Upper Powder | 10090202 | 5,821 | 5,239 | 837 | 353 | 619 | 12,869 | 12,250 | 47 | 43 | 7 | 3 |
| Crazy Woman Creek |
10090205 | 8,337 | 3,512 | 1,192 | 521 | 843 | 14,405 | 13,562 | 61 | 26 | 9 | 4 |
| Clear Creek | 10090206 | 24,223 | 8,464 | 3,490 | 1,471 | 2,063 | 39,711 | 37,648 | 64 | 23 | 9 | 4 |
| Middle Powder | 10090207 | 155 | 2,430 | 21 | 11 | 275 | 2,892 | 2,617 | 6 | 93 | 1 | 0 |
| Little Powder | 10090208 | 342 | 9,471 | 60 | 0 | 172 | 10,045 | 9,873 | 3 | 96 | 1 | 0 |
| TOTAL | 93,084 | 49,225 | 13,384 | 5,667 | 8,281 | 169,641 | 161,360 | 58 | 30 | 8 | 4 | |
Figue II-9
Acreage of Irrigated Land by Crop
Irrigation Water Consumption
The depletion of water by irrigation is primarily dependent on the number of acres irrigated, the crop water demands, and the amount of water available to meet these demands.
Total crop water demands are dependent on the consumptive use of the crop. The crop consumptive use requirement is the maximum water use of a well-watered crop under optimum growing conditions. A portion of the total annual rainfall is available to meet this consumptive use requirement. Effective precipitation is defined as that part of the total rainfall during the growing season, which is available to meet the consumptive water requirements of the crops. The remaining consumptive use requirement, unmet by natural rainfall, is referred to as the Consumptive Irrigation Requirement (CIR).
Knowing the number of acres of irrigation within a Service Area (a grouping of lands served by a common supply ditch), the types of crops grown, and the climatic conditions, estimates of the theoretical maximum diversions can be made for all of the irrigated lands throughout the basin. In practice however, actual diversions commonly fall short of the amount necessary to meet the full CIR of the crops (the "theoretical maximum diversion requirement"). This is especially true with flood-irrigated, forage crops. Actual conditions seldom represent the optimum conditions necessary to achieve maximum water consumption.
Through the current planning effort, comparisons have been made between actual historic diversions for 70 key irrigation ditches and the theoretical maximum diversion to the lands served by these ditches (Service Areas). The relationships developed allow for estimation of actual diversions and depletions where records are unavailable. According to these relationships, the average proportion of actual historic diversions to theoretical maximum diversions is at a maximum in wet years (73 %), is somewhat lower in normal years (71 %), and is considerably lower in dry years (56 %). The ditches included in these averages serve a total of 79,046 acres and constitute 49 percent of the total active irrigated acreage in the planning area (161,360 acres). The climatic areas used in calculating the CIR and corresponding Theoretical Maximum Diversion Requirements are shown on Figure II-10.
Not all of the water diverted for irrigation goes to meeting the crop water demands, in fact, the crop water consumption often times represents only a minor portion of the total diversion amount. A significant portion of the diverted flow is lost to seepage from the main conveyance ditch, lateral ditches, and field ditches, headgate leakage, ditch tailwater waste, field wastewater, and deep percolation past the crop root zone. Much of this "water loss" ultimately returns back to stream system for reuse downstream. That portion of the estimated actual diversion volume that is consumed by the crop is defined here as the estimated actual depletion. The estimated actual depletions for wet, normal, and dry years total 194,000 acre-feet, 184,000 acre-feet, and 178,000 acre-feet respectively and are summarized in Table II-4. The estimated actual depletions for the lands supplied by surface water and ground water are provided in Tables II-5 and II-6 respectively.
Table II-4
Estimated Actual Depletions (Acre-Feet)
| Source of Supply |
Active Irrigation (Acres) |
Hydrologic Condition |
Jan | Feb | Mar | Apr | May | Jun | Jul | Aug | Sep | Oct | Nov | Dec | Annual |
| Little Bighorn Basin |
1,781 | Wet Normal Dry |
0 0 0 |
0 0 0 |
0 0 0 |
0 6 29 |
56 126 342 |
370 421 402 |
731 654 539 |
618 640 369 |
206 216 162 |
0 0 0 |
0 0 0 |
0 0 0 |
1,981 2,064 1,844 |
| Tounge River Basin |
62,760 | Wet Normal Dry |
0 0 0 |
0 0 0 |
0 0 0 |
27 189 1,049 |
1,994 4,614 11,422 |
12,268 15,398 14,764 |
24,914 22,463 21,219 |
20,365 21,741 14,108 |
9,461 6,960 5,458 |
2 3 8 |
0 0 0 |
0 0 0 |
69,031 71,369 68,028 |
| Powder River Basin - Surface Supply | 86,742 | Wet Normal Dry |
0 0 0 |
0 0 0 |
0 0 0 |
642 905 2,433 |
5,941 8,054 11,429 |
20,284 22,513 22,713 |
36,101 28,901 30,912 |
31,965 28,546 21,270 |
15,512 10,414 8,941 |
65 81 120 |
0 0 0 |
0 0 0 |
110,509 99,414 97,819 |
| Powder River Basin - Ground Water Supply | 203 | Wet Normal Dry |
0 0 0 |
0 0 0 |
0 0 0 |
0 0 3 |
17 13 18 |
49 42 40 |
91 58 68 |
83 64 47 |
39 18 18 |
0 0 0 |
0 0 0 |
0 0 0 |
279 194 194 |
| Little Powder River Basin |
9,873 | Wet Normal Dry |
0 0 0 |
0 0 0 |
0 0 0 |
655 591 580 |
939 1,119 1,678 |
2,339 2,142 1,982 |
3,435 3,039 2,814 |
3,183 2,763 2,048 |
1,611 1,325 825 |
24 21 17 |
0 0 0 |
0 0 0 |
12,186 10,999 9,943 |
| Total | 161,359 | Wet Normal Dry |
0 0 0 |
0 0 0 |
0 0 0 |
1,324 1,691 4,094 |
8,947 13,926 24,889 |
35,310 40,516 39,902 |
65,271 55,115 55,553 |
56,213 53,754 37,842 |
26,830 18,934 15,404 |
91 105 145 |
0 0 0 |
0 0 0 |
193,987 184,041 177,828 |
Table II-5
Estimated Actual Surface Water Depletions (Acre-Feet)
| Source of Supply |
Climate Stations1 |
Active Irrigation (Acres) |
Hydrologic Condition |
Jan | Feb | Mar | Apr | May | Jun | Jul | Aug | Sep | Oct | Nov | Dec | Annual |
| Little Bighorn Basin | Sheridan | 1,781 | Wet Normal Dry |
0 0 0 |
0 0 0 |
0 0 0 |
0 6 29 |
56 126 324 |
370 421 402 |
731 654 539 |
618 640 369 |
206 216 162 |
0 0 0 |
0 0 0 |
0 0 0 |
1,981 2,064 1,844 |
| Tounge River Basin | Sheridan | 62,760 | Wet Normal Dry |
0 0 0 |
0 0 0 |
0 0 0 |
27 189 1,049 |
1,994 4,614 11,422 |
12,268 15,398 14,764 |
24,914 22,463 21,219 |
20,365 21,741 14,108 |
9,461 6,960 5,458 |
2 3 8 |
0 0 0 |
0 0 0 |
69,031 71,369 68,028 |
| Upper Clear Creek | Buffalo | 39,176 | Wet Normal Dry |
0 0 0 |
0 0 0 |
0 0 0 |
18 148 825 |
1,606 4,023 6,202 |
8,482 11,228 11,096 |
15,170 13,811 13,418 |
13,273 13,489 9,207 |
6,295 5,201 3,755 |
4 5 8 |
0 0 0 |
0 0 0 |
44,847 47,906 44,511 |
| Lower Clear Creek | Buffalo & Weston |
7,174 | Wet Normal Dry |
0 0 0 |
0 0 0 |
0 0 0 |
27 56 203 |
329 735 1,325 |
1,491 2,065 1,924 |
2,915 2,528 2,488 |
2,443 2,431 1,656 |
1,202 991 713 |
3 4 6 |
0 0 0 |
0 0 0 |
8,409 8,812 8,315 |
| Upper Crazy Woman Creek |
Buffalo | 12,324 | Wet Normal Dry |
0 0 0 |
0 0 0 |
0 0 0 |
6 47 259 |
506 1,265 1,949 |
2,678 3,541 3,498 |
4,774 4,346 4,222 |
4,160 4,228 2,885 |
1,975 1,631 1,178 |
1 2 3 |
0 0 0 |
0 0 0 |
14,100 15,061 13,994 |
| Lower Crazy Woman Creek |
Buffalo & Weston |
1,418 | Wet Normal Dry |
0 0 0 |
0 0 0 |
0 0 0 |
54 66 96 |
130 173 184 |
278 326 302 |
498 423 403 |
447 394 305 |
213 173 138 |
5 6 9 |
0 0 0 |
0 0 0 |
1,624 1,561 1,438 |
| Upper Powder River Basin | Kaycee | 18,107 | Wet Normal Dry |
0 0 0 |
0 0 0 |
0 0 0 |
210 207 551 |
2,288 1,085 1,214 |
5,307 3,879 4,558 |
9,336 5,715 8,036 |
8,568 5,910 5,462 |
4,331 1,727 2,393 |
20 27 38 |
0 0 0 |
0 0 0 |
30,059 18,549 22,252 |
| South Fork Powder River | Kaycee & Midwest |
2,103 | Wet Normal Dry |
0 0 0 |
0 0 0 |
0 0 0 |
5 4 6 |
304 25 7 |
725 251 218 |
1,157 425 684 |
1,028 567 457 |
548 64 176 |
1 1 1 |
0 0 0 |
0 0 0 |
3,768 1,337 1,548 |
| Lower Powder River | Buffalo & Weston |
6,440 | Wet Normal Dry |
0 0 0 |
0 0 0 |
0 0 0 |
322 378 494 |
779 747 548 |
1,324 1,222 1,115 |
2,253 1,653 1,662 |
2,045 1,527 1,298 |
947 626 588 |
32 36 55 |
0 0 0 |
0 0 0 |
7,701 6,188 5,760 |
| Little Powder River Basin |
Weston | 9,873 | Wet Normal Dry |
0 0 0 |
0 0 0 |
0 0 0 |
655 591 580 |
939 1,119 1,678 |
2,339 2,142 1,982 |
3,435 3,039 2,814 |
3,183 2,763 2,048 |
1,611 1,325 825 |
24 21 17 |
0 0 0 |
0 0 0 |
12,186 10,999 9,943 |
| Total | 161,156 | Wet Normal Dry |
0 0 0 |
0 0 0 |
0 0 0 |
1,324 1,691 4,094 |
8,930 13,914 24,870 |
35,261 40,475 39,862 |
65,181 55,057 55,485 |
56,131 53,690 37,795 |
26,790 18,915 15,386 |
91 105 145 |
0 0 0 |
0 0 0 |
193,708 183,846 177,634 | |
Notes: 1 Where more than one climate stations were weighed 50-50.
Table II-6
Estimated Actual Ground Water Depletions (Acre-Feet)
| Source of Supply | Climate Stations1 | Active Irrigation (Acres) |
Hydrologic Condition | Jan | Feb | Mar | Apr | May | Jun | Jul | Aug | Sep | Oct | Nov | Dec | Annual |
| Upper Clear Creek | Buffalo | 20 | Wet Normal Dry |
0 0 0 |
0 0 0 |
0 0 0 |
0 0 0 |
1 2 3 |
4 6 6 |
8 7 7 |
7 7 5 |
3 3 2 |
0 0 0 |
0 0 0 |
0 0 0 |
23 25 23 |
| Upper Crazy Woman Creek |
Buffalo | 97 | Wet Normal Dry |
0 0 0 |
0 0 0 |
0 0 0 |
0 0 0 |
4 10 15 |
20 27 27 |
37 34 33 |
34 35 24 |
16 13 10 |
0 0 0 |
0 0 0 |
0 0 0 |
112 119 110 |
| Upper Powder River | Kaycee | 58 | Wet Normal Dry |
0 0 0 |
0 0 0 |
0 0 0 |
0 0 0 |
8 0 0 |
17 6 6 |
31 11 19 |
28 15 12 |
14 1 4 |
0 0 0 |
0 0 0 |
0 0 0 |
98 34 41 |
| Lower Powder River | Buffalo & Weston |
28 | Wet Normal Dry |
0 0 0 |
0 0 0 |
0 0 0 |
0 0 0 |
4 0 0 |
8 3 2 |
15 5 9 |
14 7 6 |
6 1 2 |
0 0 0 |
0 0 0 |
0 0 0 |
46 16 19 |
| Total | 203 | Wet Normal Dry |
0 0 0 |
0 0 0 |
0 0 0 |
0 0 3 |
17 13 18 |
49 42 40 |
91 58 68 |
83 64 47 |
39 18 18 |
0 0 0 |
0 0 0 |
0 0 0 |
279 194 194 | |
Notes: 1 Where more than one climate stations were weighed 50-50.
C. Municipal and Domestic UseMunicipal and domestic uses are described in this section of the report. For the purpose of this report municipal uses are defined as uses satisfied by a public water supply system. Domestic uses are those that are satisfied by individual wells and small water systems.
Municipal
There are twenty public water supply entities consisting of incorporated municipalities, districts, and privately owned water systems in the planning area. These entities are listed below along with an indication of whether their primary water source is surface water or ground water.
Table II-7 presents the monthly surface water depletions by Buffalo, Dayton, Ranchester, and Sheridan. Depletions, in million gallons (MG), are computed as the difference between the diversions from the stream and the amount of water returned to the stream through wastewater treatment facilities. Those months with negative depletions represent lagged return flows which exceed diversions for the given month. The municipalities of Midwest and Edgerton, and the Soldier Creek Water Company, although they use surface water, are not included in Table II-7. Midwest and Edgerton are supplied by the Casper area water system, which is outside the study area, and the Soldier Creek Water Company is served by the City of Sheridan.
Table II-7
Municipal Surface Water Use
(Million Gallons)
| Municipality | ||||
| Buffalo | Dayton | Ranchester | Sheridan | |
| Population 1 | 3,900 | 678 | 701 | 18,500 |
| GPCPD 2 | 325 | 234 | 300 | 260 |
| DEPLETIONS | ||||
| Water Source | Clear Creek | Tongue River | Tongue River | Big Goose Cr. |
| January | 1.20 | 0.26 | -0.20 | 18.84 |
| February | 0.29 | -0.31 | -0.80 | 18.84 |
| March | -0.62 | -0.04 | -0.43 | 29.22 |
| April | -1.99 | -0.03 | -0.57 | 27.49 |
| May | 6.67 | 1.02 | 1.13 | 56.90 |
| June | 27.19 | 2.34 | 3.20 | 98.42 |
| July | 49.54 | 5.62 | 8.01 | 139.94 |
| August | 48.63 | 5.36 | 6.83 | 150.32 |
| September | 19.44 | 3.95 | 1.13 | 93.23 |
| October | 5.76 | 0.35 | -0.94 | 25.76 |
| November | 4.39 | 0.08 | -0.72 | 13.65 |
| December | 3.48 | 0.45 | -1.02 | 17.11 |
| Total | 163.98 | 19.05 | 15.62 | 689.72 |
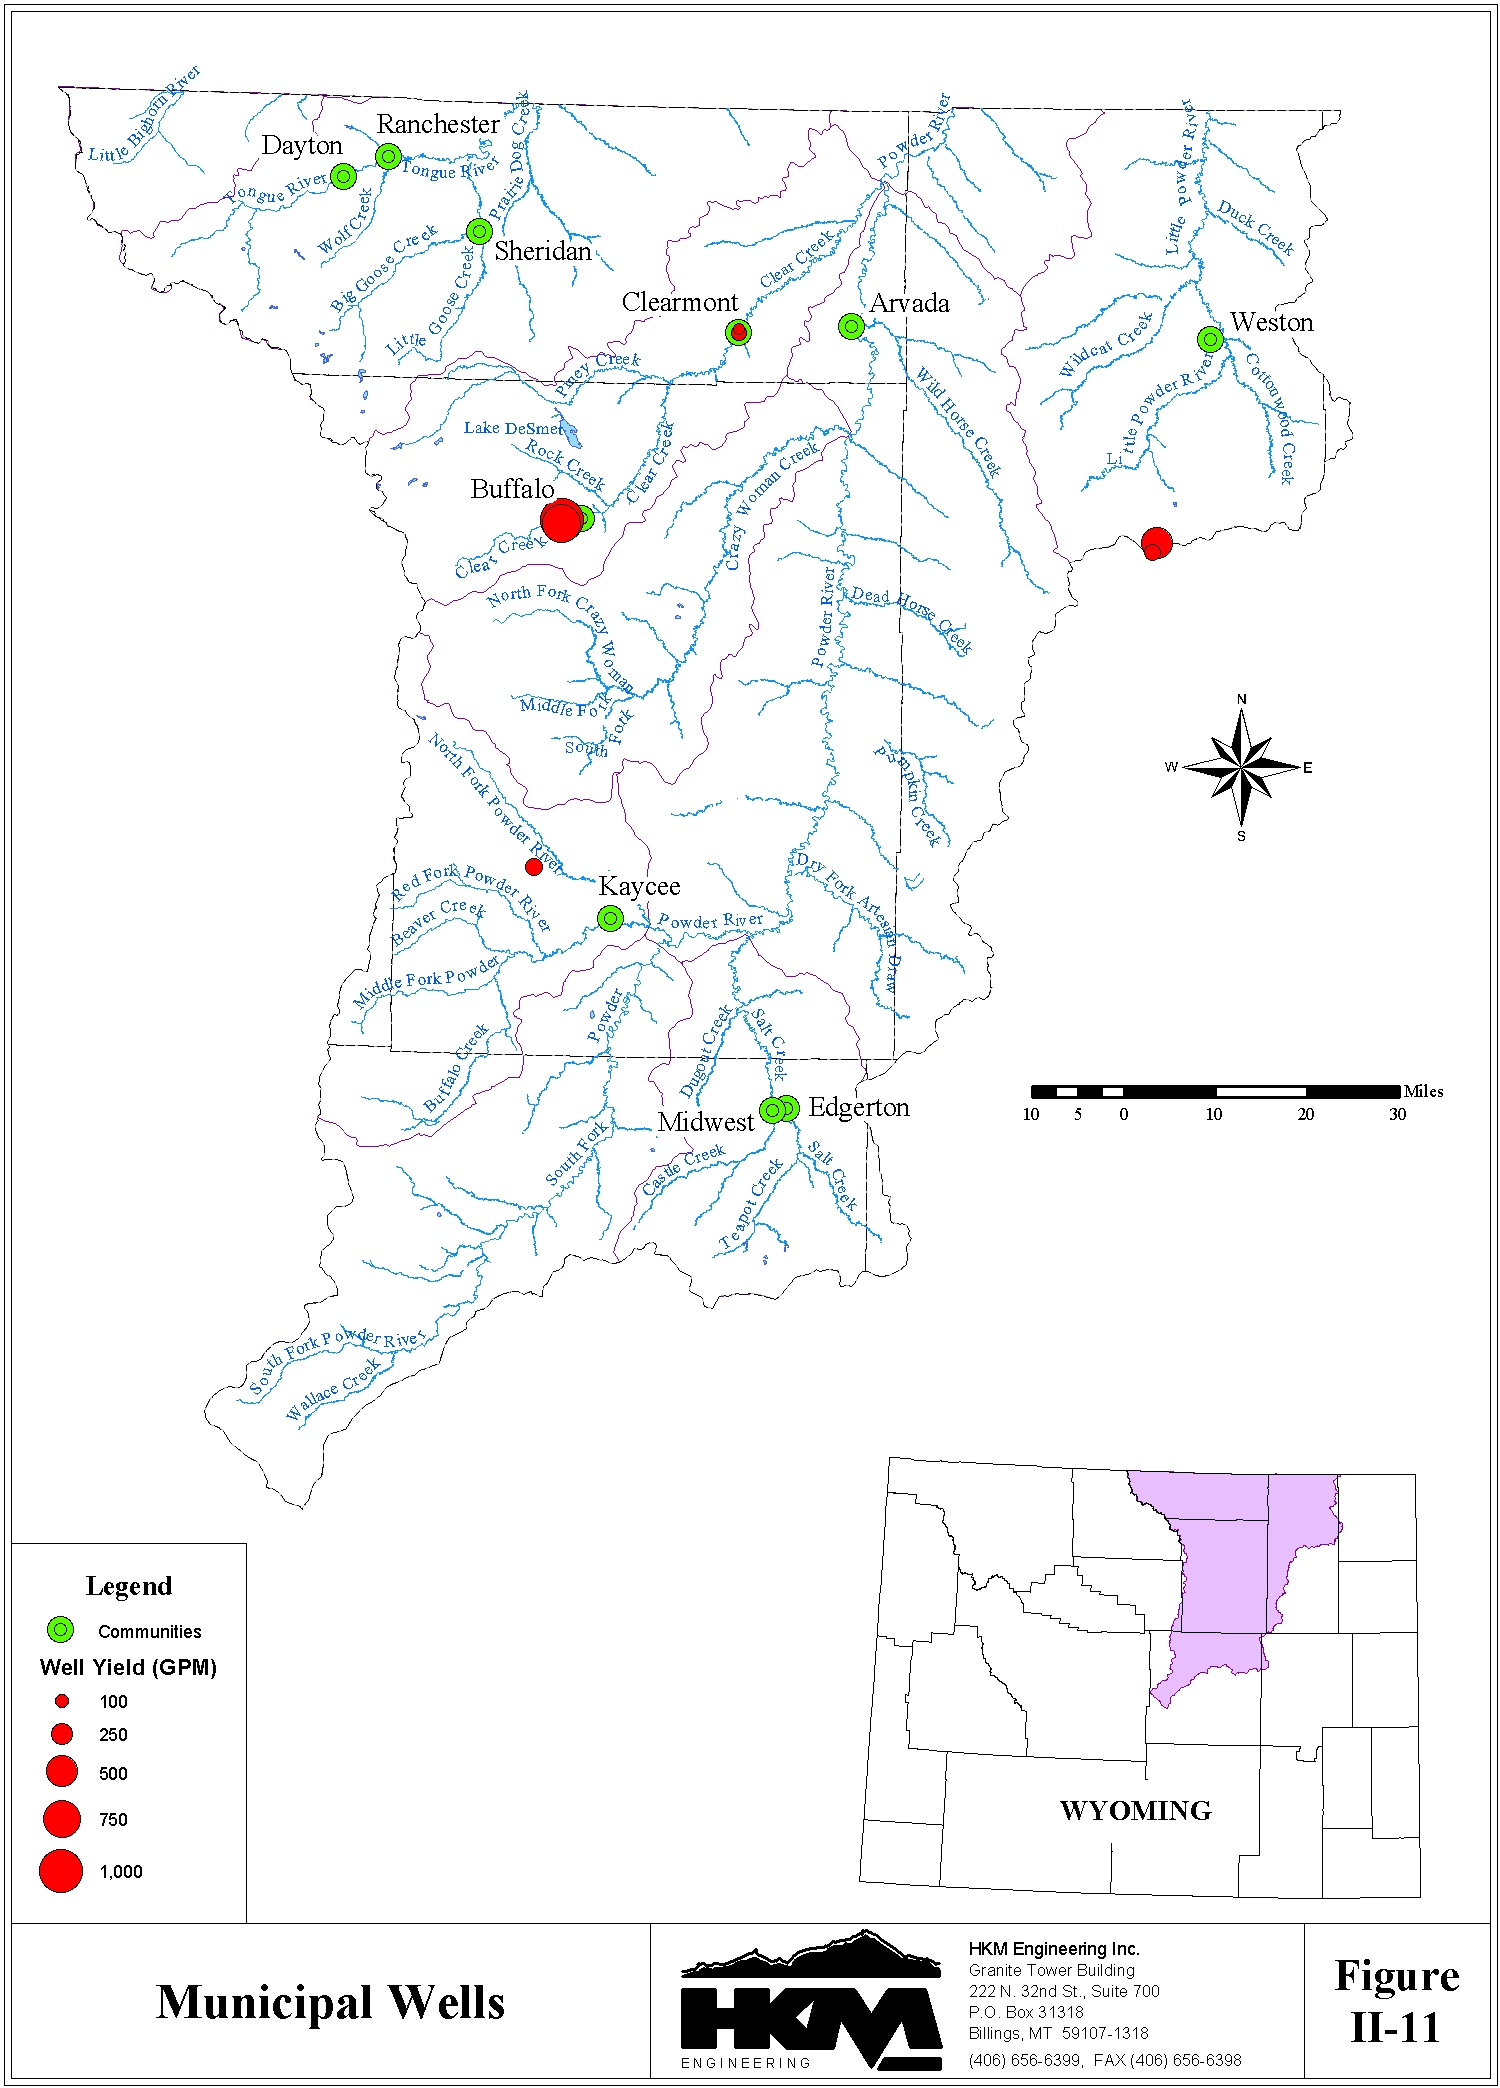
Table II-8 summarizes municipal ground water and Figure II-11 displays the location of municipal wells according to the records of the State Engineer's Office. Of the thirteen municipal ground water systems, only Kaycee discharges wastewater to surface water.
A comparison of existing municipal uses to the system capacity of the entity is presented in Table II-9. The general conclusion from this table is the municipal water systems in the Powder/Tongue River Basin have adequate capacity to meet existing needs. This conclusion assumes the only restriction on the amount of water supplied to the municipality is the water right, i.e. the permitted amount that can be diverted from the stream or withdrawn from a well. Hydrologic conditions, however, can also limit the amount of water available to a community. During dry years, such as 2001, water supply is not always adequate to satisfy all users and, consequently, diversions and withdrawals by entities with junior priority water rights are restricted in favor of senior appropriators.
Table II-8
Municipal Ground Water Use
(Million Gallons)
| Municipality | Population 1 | Gpcpd 2 | Annual Use |
| Anderson I&SD | Supplied by City of Gillette | ||
| Arvada WD | Individual wells, no central system | ||
| Town of Clearmont | 125 | 220 | 10.0 |
| Cook Road WD | 225 | N/A | |
| Countryside WUA | 250 | N/A | |
| Eight-Mile Subdivision | 90 | 140 | 4.6 |
| Green Valley Estates I&SD | 72 | N/A | |
| Heritage Village W&SD | 700 | 81 | 20.7 |
| Town of Kaycee | 300 | 210 | 23.0 |
| Linch Utility | 20 | N/A | |
| Means W&SD | 300 | 600 | 65.7 |
| Pine Butte I&SD | 100 | N/A | |
| Prairie View/Champion I&SD | Individual wells, no central system | ||
Table II-9
Comparison of Usage to System Capacity
| Municipality | Peak Day Demand (GMP) |
System Capacity (GPM) |
Water Right 1 (GPM) |
Raw Water Storage (Acre-Feet) |
| City of Buffalo | 2,220 | 5,380 | 5,848 | 1,647 |
| Town of Clearmont | 28 | 100 | None | |
| Cook Road WD | N/A | 120 | None | |
| Countryside WUD | N/A | 200 | 200 | None |
| Town of Dayton | 382 | 1,050 | None | |
| Town of Edgerton | 21 | 290 | None | None |
| Eight-Mile Subdivision | 14 | 73 | 100 | None |
| Green Valley Estates I&SD | N/A | 100 | 100 | None |
| Heritage Village W&SD | 205 | 370 | None | |
| Town of Kaycee | 132 | 165 | 165 | None |
| Linch Utility | 15 | None | ||
| Means W&SD | 200 | None | ||
| Town of Midwest | 130 | 290 | None | None |
| Pine Butte I&SD | None | |||
| Town of Ranchester | 475 | 700 | 7,180 | None |
| City of Sheridan | 7,200 | 12,850 | 7,180 | 3,604 |
Domestic
Domestic use includes water supplied for rural homes, subdivisions, small trailer courts, commercial establishments, parks, campgrounds, rural schools, domestic uses at coal mines, and other small water uses that are not supplied from a central public water system. These uses are almost exclusively supplied from ground water. A notable exception is that limited irrigation of lawns and gardens from a surface water source is practiced by many rural homes where a surface source is available. Figure II-12 displays the location of domestic wells according to the records of the State Engineer's Office
The population served by individual domestic systems is estimated to be 11,938. To estimate domestic water usage it is assumed individuals served by domestic systems consume between 150 and 300 gallons per day. At this usage rate the total daily domestic use in the study area is between 1.79 and 3.58 million gallons. On an annual basis, domestic use is estimated to be between 2,010 and 4,010 acre-feet.
Domestic use also includes consumption by two special types of systems:
Total domestic use, including permanent populations and the two special systems, is estimated to be between 2.09 and 3.88 million gallons per day, or between 2,350 and 4,350 acre-feet per year.
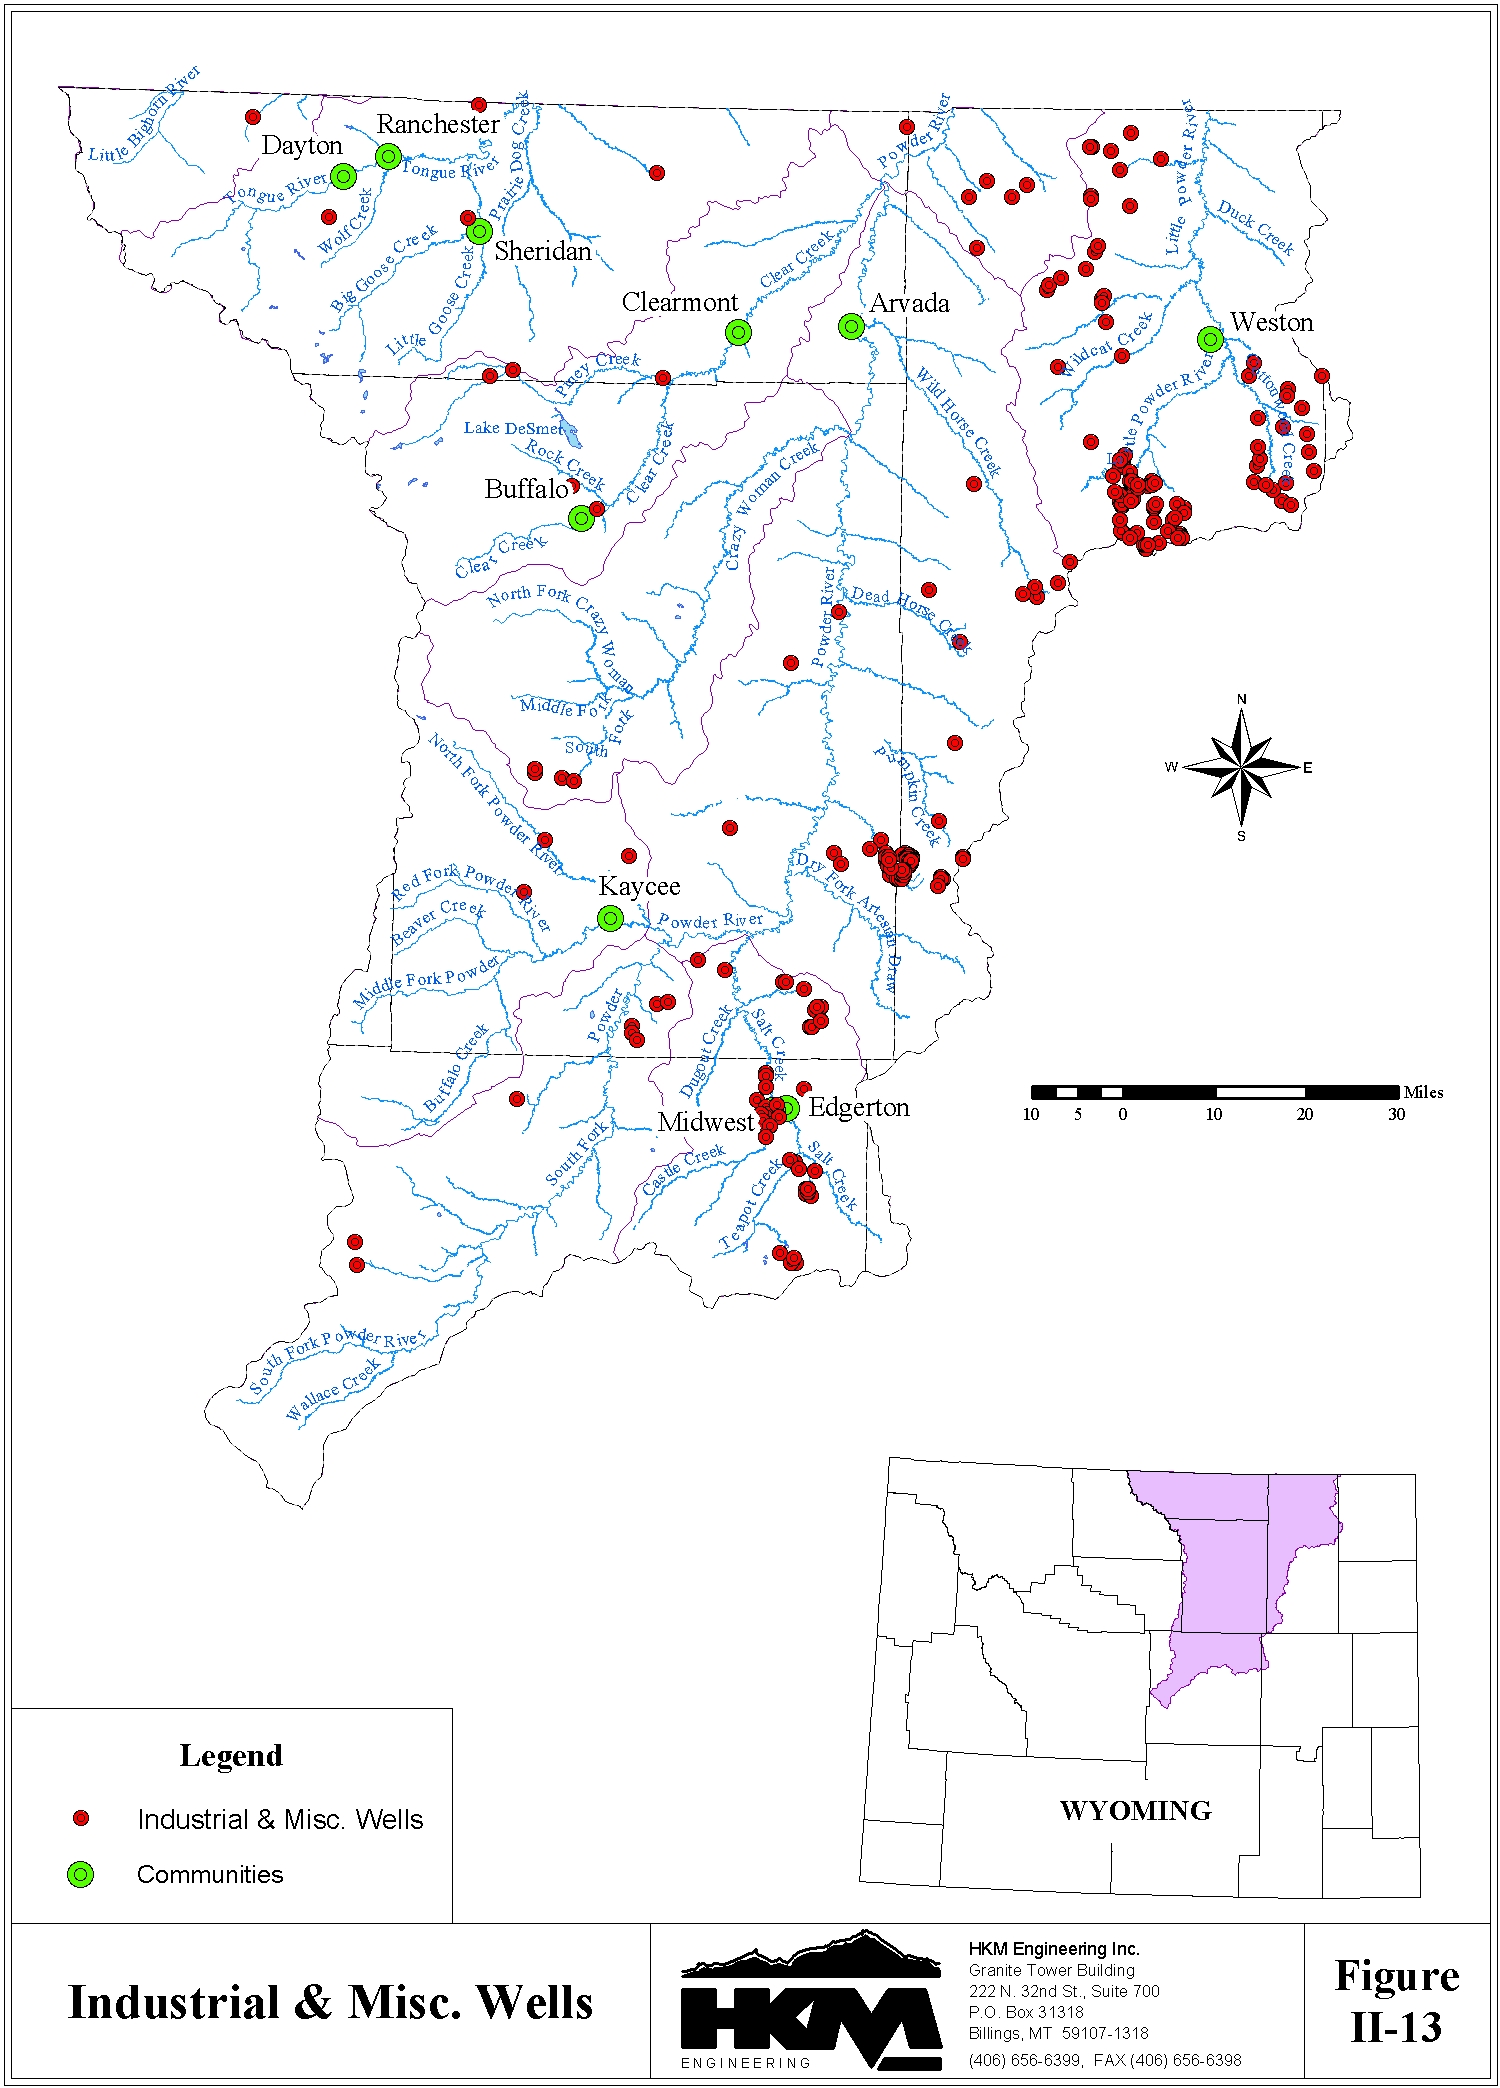
D. Industrial UseIndustrial water use in the Powder/Tongue River Basin, including electric power generation, coal mining, conventional oil and gas production, and coalbed methane production is described in this section. All current industrial use is from ground water. Figure II-13 displays the location of industrial water wells with capacities of at least 50 gpm according to the records of the State Engineer's Office. CBM wells are not shown on Figure II-13. One user, Lake DeSmet Energy Company, has developed a surface water supply to support future electric power generation, but this source has yet to be utilized.
The information reported here was obtained from individual water users, the Coalbed Methane Coordination Coalition (CBMCC), the Wyoming Oil & Gas Conservation Commission (OGCC), and the U.S. Bureau of Land Management (BLM).
No water is currently being used in the study area for electric power generation. Further, the one operational mine, Spring Creek, only uses minimal amounts of water for dust suppression and domestic use. Water production and consumption associated with the conventional oil and gas and coalbed methane industries are described in the remainder of this section.
Conventional Oil and Gas Production
Conventional oil and gas wells produce as well as consume ground water. Water is consumed by injection into the oil and gas aquifers to stimulate production. According to OGCC records for the year 2000, 2,343 wells produced approximately 44,000 acre-feet of water, and 1,593 injection wells consumed about 38,000 acre-feet.
Injection water comes from two sources: oil and gas produced water and wells drilled specifically to pump injection water supply. Produced water can also be discharged to the surface. Because no agency monitors the amounts of produced water injected or discharged, the net amount of water consumed by conventional oil and gas wells can't be quantified.
Coalbed Methane Production
There is little direct consumptive use of water in the CBM industry. However, the production of CBM gas results from lowering the water table over the coal seam and a significant amount of ground water is produced in this operation. OGCC records indicate approximately 24,300 acre- feet of water was pumped from the 6,184 CBM wells in the Powder/Tongue River Basin in 2001. Throughout the history of CBM production, which dates back to the 1970s, OGCC records indicate approximately 50,500 acre-feet has been pumped. The locations of the CBM wells on record with the Wyoming Oil and Gas Conservation Commission as of January 2002, by regions within the planning area are shown on Figure II-14.
There is little information available to quantify what happens to water pumped from CBM wells. The majority of this production water is discharged into existing drainages, and some is conveyed to small reservoirs where it either infiltrates or evaporates. A small portion of this water is reported to be used for irrigation.
E. Recreational UseRecreational uses associated with the water resources of the Powder/Tongue River Basin are described in this section of the report under the general headings of boating, fishing, and waterfowl hunting. Lake DeSmet as an important recreational resource in the basin is also discussed.
Water-based recreation is enhanced through minimum flow releases from reservoirs, minimum pool levels maintained in reservoirs, and instream flow water rights established on streams. These water administration topics are addressed in the environmental section of this chapter.
Data compiled for water-related recreational use is presented to the extent it is available. This report does not address the economic impacts of recreation in the planning area, although this data is presented in the Technical Memorandum prepared for this topic.
Boating
Many of the streams and lakes in the study area support boating activities, including whitewater, scenic, fishing, and water skiing. Boaters tend to use Dome Lake No. 1, Kearney, Lake DeSmet, Tie Hack, Twin Lakes, and Willow Park reservoirs, with Lake DeSmet getting the greatest share of motorized boating. Boating is a non-consumptive use because it depends on waters being maintained for other purposes.
Because permits are not required for boating anywhere in the planning area, usage numbers that could indicate capacity limits and pressures are not available from management agencies. The Bureau of Reclamation's default figure of one boat per ten surface acres of water is used to estimate capacities elsewhere, but until use numbers are generated in the study area to support this estimate that guideline cannot be used.
At present, no central agency monitors or controls float trips on the streams in the study area, although individuals do occasionally float the Powder River. No records are available to quantify this use of streams within the basin.
Fishing
Fishing represents the biggest recreation-related water use in the Powder/Tongue River Basin. This use is non-consumptive and, in most cases, is dependent on water devoted to other uses such as irrigation or municipal. A notable exception to this dependency is the instream flow water right program administered by the State of Wyoming. Instream flows are discussed later in this section of the report.
The State of Wyoming classifies trout streams under the five designations listed below:
The Wyoming Game and Fish Department (WGFD) maintains records of fishing activity. According to recent records, the 204 streams in the Powder/Tongue study area tracked by the WGFD experience about 121,000 angler-days annually. Standing water (ponds, lakes, reservoirs) see about 109,000 angler-days in a year. These WGFD estimates are not all current and do not include the lower reaches of many drainages in the planning area. Updated estimates of fishing activity were developed for this planning study to reflect current activity in the entire planning area. These estimates indicate that the Powder/Tongue River Basin experiences approximately 140,000 activity-days of stream fishing each year and 132,000 activity-days of fishing on standing waters.
Basin management plans developed by WGFD provide additional information on fishing in the study area. This data is summarized below:
Little Bighorn River Drainage
Streams----------------------- 7,039 angler-days/year
Standing Water---------------- 238 angler-days/year
Tongue River Drainage, excluding Goose Creek
| Streams----------------------- 57,111 angler-days/year Standing Water---------------- 10,204 angler-days/year |
Goose Creek Drainage
Streams----------------------- 15,266 angler-days/year
Standing Water---------------- 10,337 angler-days/year
Clear Creek Drainage
| Streams----------------------- 31,382 angler-days/year Standing Water*--------------- 57,280 angler-days/year Lake DeSmet------------------- 43,389 angler-days/year *excluding Lake DeSmet |
Crazy Woman Creek Drainage
| Streams----------------------- 11,046 angler-days/year Standing Water---------------- 4,262 angler-days/year |
Middle Fork Powder River Drainage
| Streams----------------------- 14,914 angler-days/year Standing Water---------------- 1,668 angler-days/year |
Little Powder River Drainage
| Streams----------------------- 2,573 angler-days/year Standing Water----------------- 518 angler-days/year |
Powder River Drainage, excluding Clear Creek, Crazy Woman Creek, Middle Fork Powder River, and Little Powder River
| Streams----------------------- 891 angler-days/year Standing Water---------------- 3,769 angler-days/year |
Waterfowl Hunting
The harvest of migratory waterfowl is a recreational pursuit affected by the presence or absence of water. Wetlands and open water are needed for breeding, nesting, rearing, feeding and isolation from land-based predators. In the Powder/Tongue River Basin, which represents the western extreme of the central flyway, waterfowl hunting is pursued where sufficient local or migratory populations are available.
Harvest objectives are not currently used (post-1993), because harvest is taken into account in the setting of season length and bag limits by the USFWS using the "Adaptive Harvest Management" concept. In effect, the desired harvest is a prospective number using past hunter success, population effects, and regulations in concert with current-year populations. With current duck populations and hunting pressure, it appears there is a sufficient resource to provide a quality duck hunting experience now and in the near future, with the existing water resources of the basin.
Similarly, goose hunting seasons and bag limits are set under guidelines from the USFWS, although states have more flexibility in setting bag and possession limits. Like duck populations, goose populations are strong and increasing. With approval from USFWS, states can set special seasons to allow depredation harvest from growing local flocks. According to historic estimates, the Rocky Mountain Population (RMP) of Canada geese has grown approximately four-fold since 1972. Since 1989, populations have increased at a rate of eight percent per year.
Lake DeSmet
Lake DeSmet, the biggest standing water recreation attraction in the Powder/Tongue River Basin, supports skiing, fishing, swimming, boating, and camping and has a long history of doing so, despite its history of ownership by private corporations. Named after an early Jesuit priest, the lake now hosts the annual Buffalo Lions Club annual Memorial Day Weekend fishing Derby, which draws 5,000 . 7,000 people.
The lake began as a 1,500-surface-acre natural lake and was developed into a reservoir with 3,265 surface acres at operational maximum. It has an average depth of 69 feet and a maximum depth of 120 feet at capacity. This supports what the Wyoming Game and Fish Department calls "the most important reservoir trout fishery in northeastern Wyoming." At least part of what makes the lake so valuable a fishery is its stable volume. The industrial rights for the lake are not developed at present, allowing the lake's level to be maintained within four to seven feet of capacity during most years. This also provides a stable base for boating under normal circumstances.
Recreation in the lake was permitted by Texaco, which allowed boat ramps and public toilets. Current facilities include 36 camping spots, two boat ramps, a subsidiary boat launching area, and three public toilets. In 2001 the lake underwent a change in ownership from Texaco to a coalition of Johnson, Sheridan, and Campbell counties. The coalition owns the water only. A little more than 30 acres were given to Johnson County as part of the transfer, but the area south of the main boat ramps, which was previously leased, will not be developed until funding becomes available.
Public access amenities, including restrooms, boat ramps, docks, picnic areas, and camping facilities, attract many visitors to Boat Dock Bay and Barkey Draw within the Mikesell-Potts access area. Texaco, Johnson County Recreation District, the Buffalo Lion's Club, and WGFD have provided resources for development and maintenance of public access. Estimates of public access and use are not available for Lake DeSmet. Although access fees have been collected since 1997, fee collection provides only a general indication of recreational use of the lake's facilities.
The WGFD stocks and maintains the fishery in Lake DeSmet primarily for the Eagle Lake Rainbow Trout, but a number of species have been caught or spotted in the lake in the past 10 years. Fishing pressure on the lake has been calculated to be 43,400 angler-days (13.3/acre) and 166,300 hours (51/acre) in a 1991 creel survey. It is estimated 90 percent of these anglers come from the three nearby counties of Johnson, Sheridan, and Gillette.
F. Environmental UseEnvironmental uses of water in the Powder/Tongue River Basin are largely non-consumptive. For instance, instream flows by definition maintain water in the channel to improve habitat.
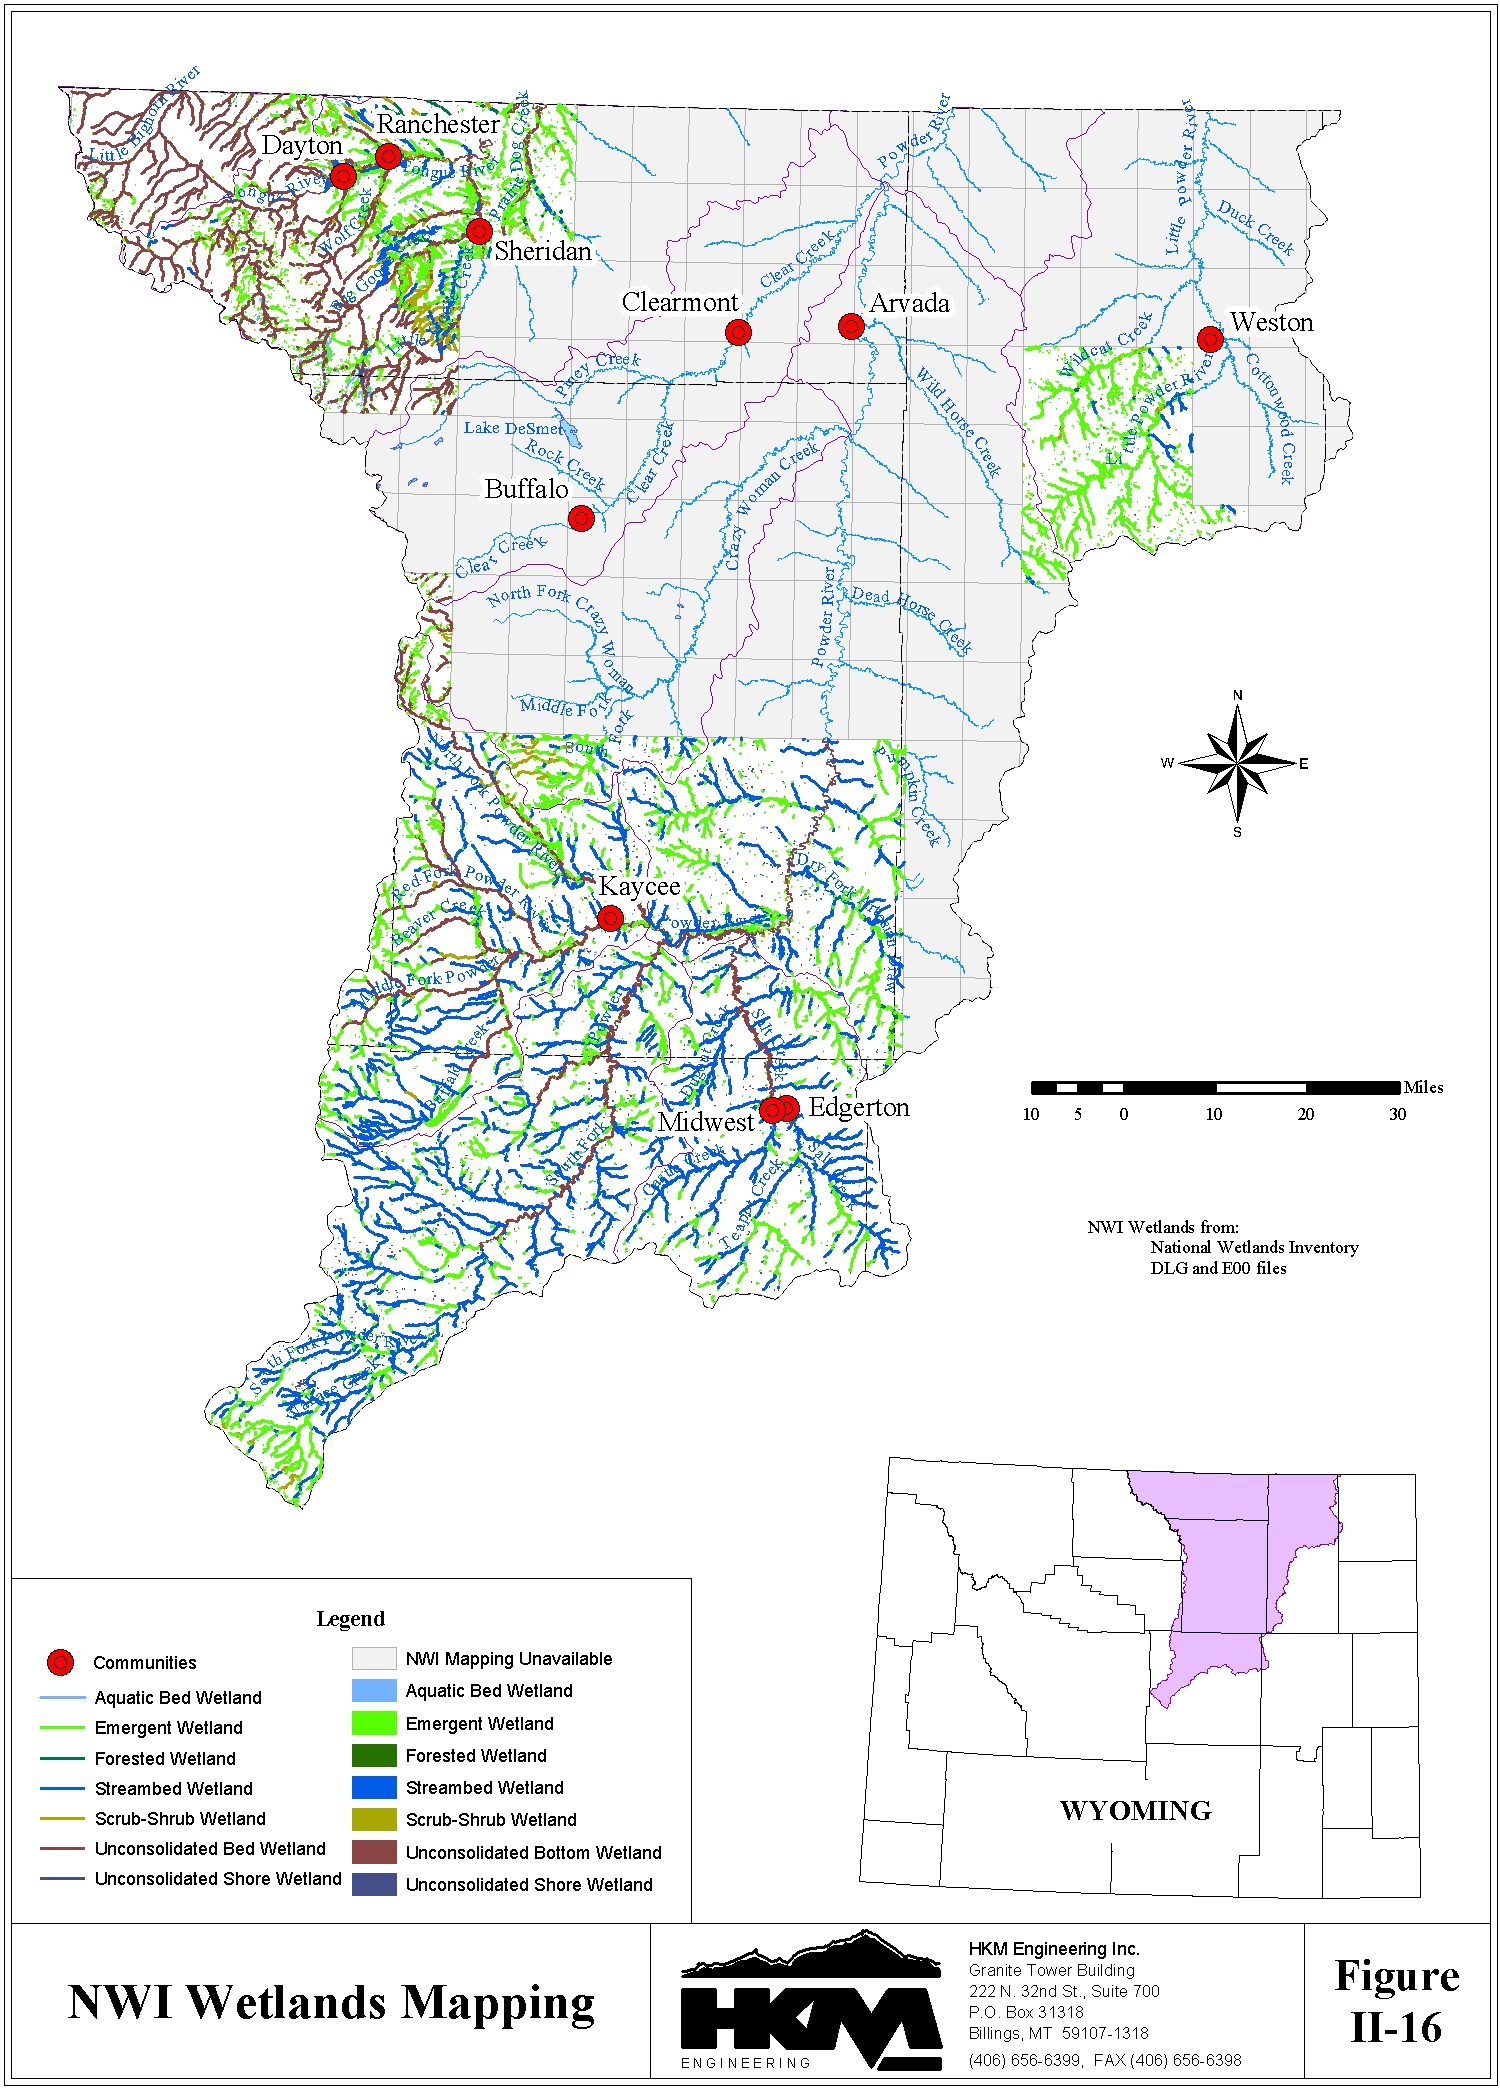
This section of the report discusses the water administration topics of minimum flow releases, minimum pool maintenance, and instream flow water rights. Other topics included in this section include environmental concerns associated with water produced by coalbed methane development, wetland mapping, and comments and concerns of groups with environmental interests.
Water Administration
Minimum flow releases from reservoirs, minimum pool levels maintained in reservoirs, and instream flow water rights established on streams are all intended to protect and enhance water- related habitat. A major and desired consequence of implementing these water administration criteria is the increase in recreational opportunities and use.
According to the WGFD, minimum flow releases and minimum reservoir pools have been integrated into the operating parameters of seven reservoirs in the Powder/Tongue River Basin. These reservoirs and the associated operating parameters are described in Table II-10.
Table II-10
Minimum Flow Releases and Minimum Conservation Pools
| Reservoir | Minimum Flow Release (CFS) |
Minimum Pool (Acre-Feet) |
| Park | 4.5 | 588 |
| Dull Knife | None | 100 |
| Willow Park | None | 325 |
| Kearney | None | Original Lake |
| Cloud Peak | None | Original Lake |
| Tie Hack | 6.0 | 780 |
| Twin Lake | Lesser of 2.5 or inflow |
None |
In 1986, the State of Wyoming enacted legislation defining "instream flow" as a beneficial use of water, and stipulated how instream flow water rights would be filed, evaluated, granted or denied, and ultimately regulated. Instream flow rights are filed with the Wyoming State Engineer's Office, held by the Wyoming Water Development Commission, and managed by Wyoming Game and Fish.
The law allows for instream flow water rights to be filed and granted on unappropriated water originating as natural flow or from storage in existing or new reservoirs. For natural flow sources, the flow amount is defined as the minimum needed to "maintain or improve existing fisheries." The language relating to stored water is slightly different, defining the minimum needed to "establish or maintain new or existing fisheries." Generally speaking, instream flow is considered a non-consumptive beneficial use.
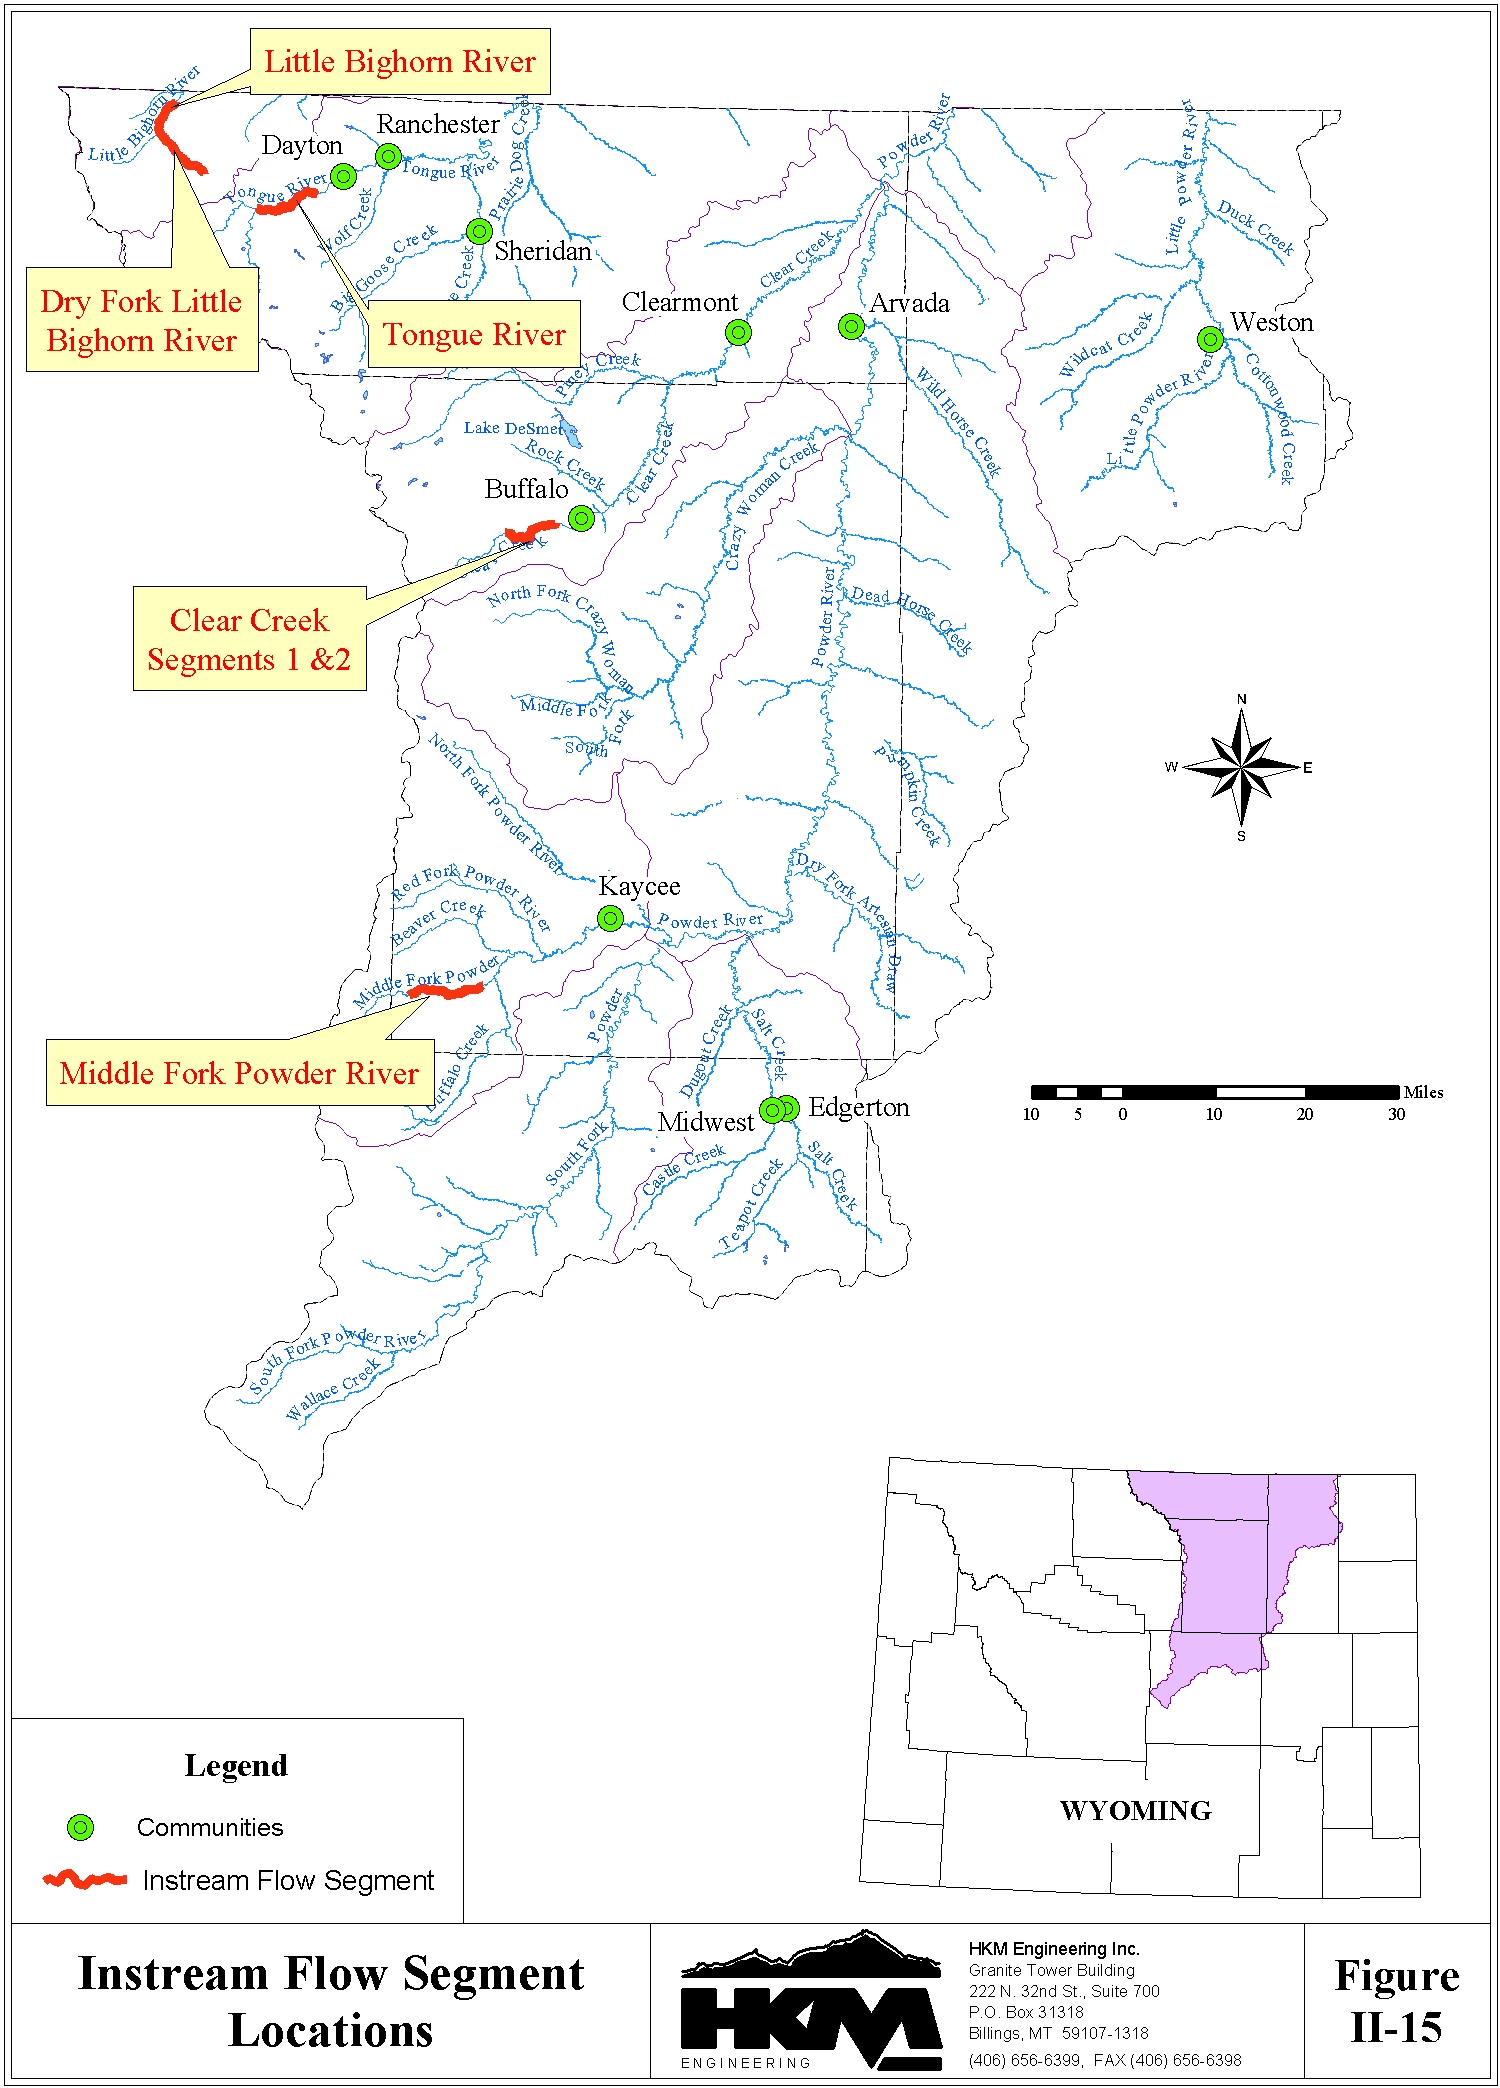
Instream flow segments in the Powder/Tongue River Basin are described in Table II-11 and shown on Figure II-15. Of the six instream flow applications, the Wyoming State Engineer's Office has granted water rights for the segments on the Little Bighorn River, Middle Fork Powder River, and Tongue River. Evaluation and action on the other segments are pending. In addition to the six segments described in Table II-11, WGFD is currently evaluating a number of streams in the Powder/Tongue River Basin as candidates for instream flow water right applications.
Table II-11
Instream Flow Water Rights
| Stream | Location | Flow/Timing | Priority |
| Little Bighorn River Drainage | |||
| Dry Fork 1 | Mouth of Garland Gulch (Section 35, T57N, R89W) to mouth of Dry Fork (NE ¼ of the NW ¼, Section 12, T57N, R90W) (7.4 miles long) | 20 cfs, Oct. 1 - March 31 25 cfs, April 1 - June 30 25 cfs, July 1 - Sept. 30 1 |
11/30/2000 |
| Little Bighorn River | Mouth of Dry Fork (NE ¼ of NW ¼, Section 12, T57N, R90W) to north boundary of SW ¼ of SW ¼, Section 20, T58N, R89W (4.40 miles long) | 60 cfs, Oct. 1 - Nov. 15 50 cfs, Nov. 16 - March 31 60 cfs, April 1 - June 30 62 cfs, July 1 - Sept. 30 |
3/6/1989 |
| Powder River Drainage | |||
| Clear Creek No. 1 | Confluence of North and South Clear Creek (NW ¼ of SE ¼ of Section 7, T50N, R83W) to the SE ¼ of NW ¼, Section 10, T50N, R83W (4.9 miles long) |
7.8 cfs, Oct. 1 - March 31 40 cfs, April 1 - June 30 30 cfs, July 1 - Sept. 30 | 10/6/1994 |
| Clear Creek No. 2 | Ending point of Clear Creek No. 1 to SE ¼ of NW ¼, Section 6, T50N, R82W, approximately 750 feet downstream of USGS Gage No. 06318500 (3.2 miles long) |
6 cfs, Oct. 1 - March 31 40 cfs, April 1 - June 30 25 cfs, July 1 - Sept. 30 |
10/6/1994 |
| Middle Fork Powder River | West side of Section 28, T42N, R85W to east boundary of NE ¼ of NE ¼, Section 22, T42N, R84W (9.96 miles long) |
12 cfs, July 1 - March 31 25 cfs, April 1 - June 30 |
2/2/1987 |
| Tongue River Drainage | |||
| Tongue River | USFS boundary upstream to the confluence of the South Fork of the Tongue. From the confluence of the North and South Forks (NE ¼ of NW ¼, Section 22, T56N, R88W) downstream to east section of Section 10, T56N, R87W (8.28 miles long) |
60 cfs, July 1 - March 31 80 cfs, April 1 - April 30 180 cfs, May 1 - June 30 |
6/16/1987 |
1 WGFD also recommends a channel maintenance flow as part of the instream flow allocation for the Dry Fork of the Little Bighorn River. This recommendation has not been approved by the State Engineer's Office.
Coalbed Methane Water Production
Coalbed methane (CBM) is produced by lowering the pressure over the coal seam through reducing the column of water in the coal aquifer. Environmental concerns related to the water produced from CBM wells fall into two categories: quantity and quality.
Environmental concerns about this quantity of ground water now flowing over the surface include: 1) increased sedimentation in streams; 2) increased erosion in everything from the draws and gullies collecting the discharges to main-stem rivers downstream; 3) constant presence of water over soils in areas historically watered only in brief episodes; and, 4) increased flooding.
Water quality concerns associated with CBM activity include: 1) the interaction of sodium- adsorption ratio (S.A.R.) in the produced water with soils downstream of the discharge; 2) the variable nature of potential pollutants like sodium, barium, iron, and manganese in produced waters; 3) the emergence of salt crusts on newly waterlogged clays; and, 4) the reaction of organisms (from microinvertebrates to fish to humans) to the produced waters in draws, ponds, or rivers.
The Wyoming Department of Environmental Quality (DEQ) has established a general permit for CBM discharge waters. Under this permit operators are required to monitor discharges following a specified schedule, and for specified parameters, to determine if the quality of the discharge is within allowable limits. The coverage of the operators under the general permit is dependent on staying within the limits established by DEQ.
Organizations outside the state government have been calling for more information to form the basis for regulation of CBM produced water. For instance, a memorandum distributed by the Coalbed Methane Coordination Coalition (CBMCC) assesses the need for further research on discharge alternatives:
Watershed-based water management plans and landowner associations are key to controlling impact and taking maximum advantage of produced water. Alternatives to discharge such as irrigation, storage and retrieval, dust control, and fire suppression all must be tested and evaluated. Consideration must be given to surface water, alluvial underflow, and ground water. The effects of recharge on alluvium are difficult to study yet very important as alluvial aquifers are important for agriculture. On the obverse of the coin, drawdown issues must be addressed in the deeper aquifers. Means to minimize and mitigate transboundary effects on downstream parties must be identified and implemented where appropriate.
Wetlands Mapping
Wetlands are transitional lands between terrestrial and aquatic systems where the water table is usually at or near the surface or the land is covered by shallow water. For purposes of the classification, wetlands must have one or more of the following three attributes:
Comments and Concerns
As part of this task, groups with environmental concerns were identified and contacted to solicit comments and concerns on environmental issues in this basin. Each of the groups were asked the following questions:
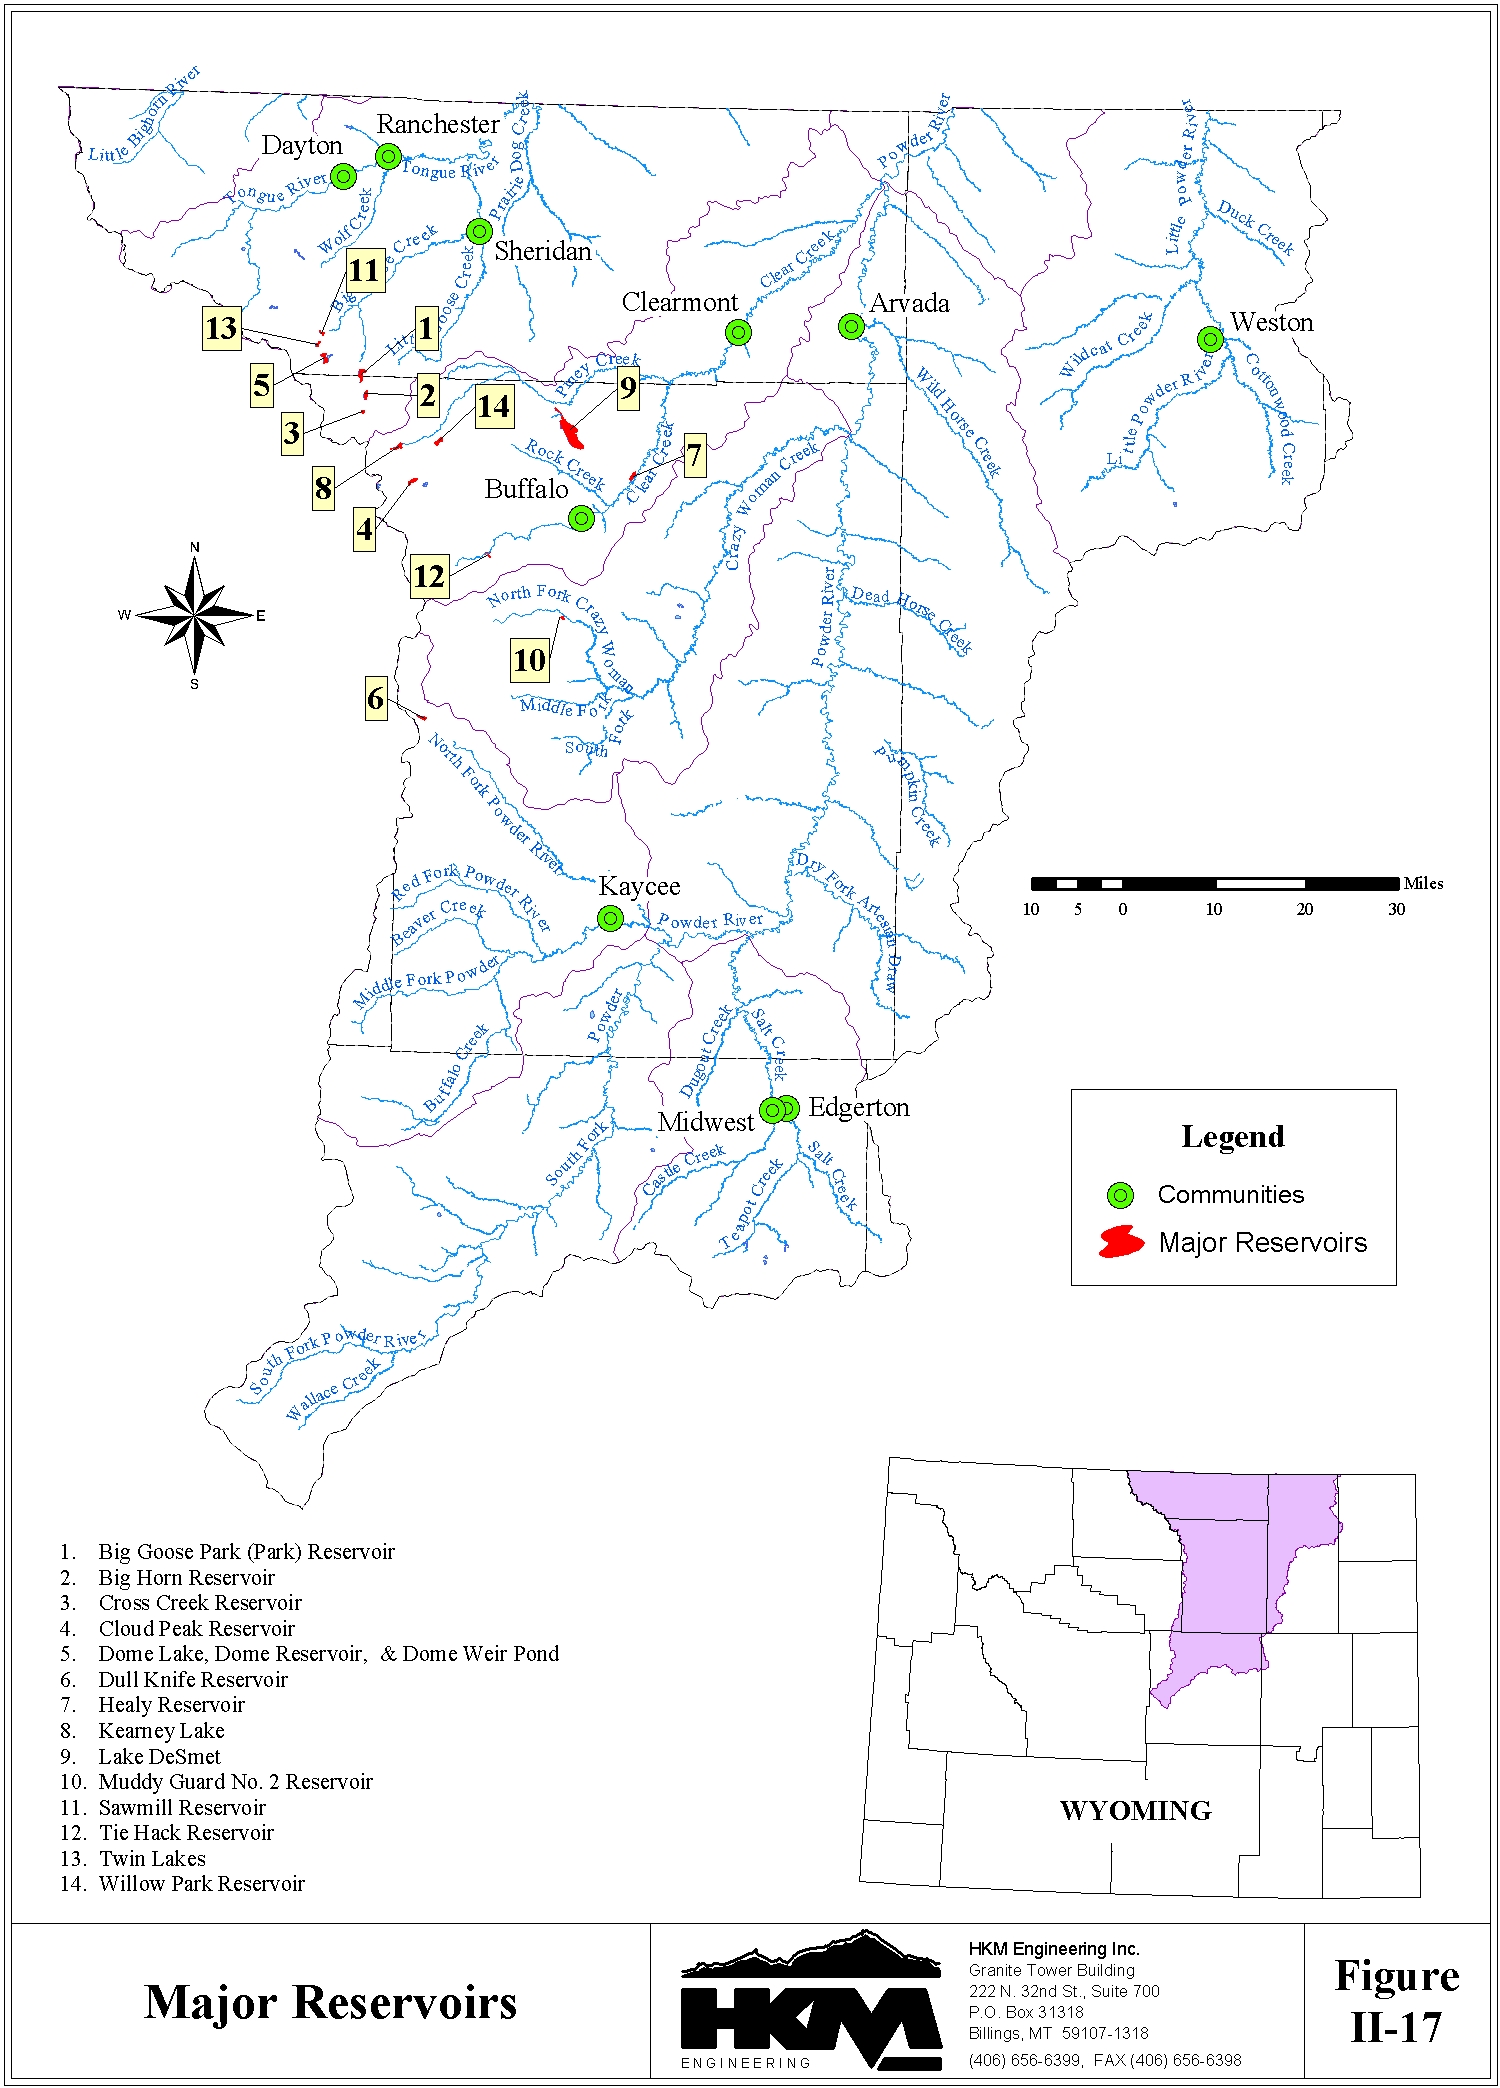
G. Reservoir EvaporationOperation data has been compiled for the key storage facilities within the planning area. The list of reservoirs, developed in coordination with the State Engineer's Office Division 2 personnel, primarily consists of reservoirs with capacities in excess of 1,000 acre-feet, although one smaller facility was included to provide a complete representation of the significant facilities. The majority of water use from storage reservoirs within the Powder/Tongue River Basin is for irrigation. However, Tie Hack and Twin Lakes Reservoirs primarily supply municipal uses and Lake DeSmet is primarily intended to supply industrial water demands. The diversion records compiled for this study and used to estimate actual irrigation diversions and depletions, reflect the use of this supplemental storage water. Table II-12 lists the key storage facilities in the planning area.
Table II-12
Key Storage Reservoirs
| Reservoir | Active Capacity (af) |
Dam Height (ft) |
Surface Area (acres) |
Annual Net Evap. Loss (af) |
| Big Goose Park | 10,362 | 85 | 318 | 557 |
| Big Horn | 4,624 | 45 | 179 | 296 |
| Cross Creek | 798 | 30 | 51 | 278 |
| Cloud Peak | 3,570 | 36 | 174 | 85 |
| Dome Lake No. 1 | 1,506 | 30 | 96 | 8,372 |
| Dull Knife | 4,345 | 80 | 130 | 170 |
| Healy | 5,140 | 50 | 246 | 205 |
| Kearney Lake | 6,324 | 67 | 193 | 556 |
| Lake Desmet | 111,827 | 80 | 2653 | 291 |
| Muddy Guard No. 2 | 1,934 | 57 | 48 | 113 |
| Sawmill | 1,275 | 38 | 75 | 136 |
| Tie Hack | 2,435 | 110 | 63 | 148 |
| Twin Lakes | 1,317 | 54 | 52 | 112 |
| Willow Park | 4,457 | 56 | 213 | N.A. |
The locations of these reservoirs are shown on Figure II-17. In addition to the detailed information compiled for these 14 key facilities, statistical data has also been compiled for 189 additional reservoirs with capacities in excess of 50 acre-feet or in excess of 20 feet in height.
Evaporation from man made storage reservoirs constitutes another consumptive use of water within the planning area. The net evaporation volume from the key storage reservoirs is determined by multiplying the net depth of evaporation (gross evaporation minus precipitation) by the water surface area of the respective reservoirs. Normal precipitation depths across the planning area were shown on Figure I-2.
End-of-month storage records are available for only four of the key reservoirs (Twin Lakes, Tie Hack, Healy, and Lake DeSmet). The average, monthly water surface area was determined for these four facilities using these records and when multiplied by the net monthly evaporation loss, yielded total evaporation volumes.
Relationships of average monthly end-of-month storage to total reservoir capacity were developed for the four facilities with historical records. These monthly proportions were averaged for the four reservoirs and applied to the total reservoir capacities of the remaining 10 facilities, in order to make reasonable estimates of monthly storage volumes and the corresponding water surface areas for these facilities as well. With this information, evaporation volumes for the remaining 10 facilities was determined. Total reservoir evaporation is estimated at 11,300 acre-feet for the 14 major reservoirs in the planning area (See Table II-12).
H. Basin Water Use SummaryTable II-13 summarizes the water consumption (depletions) for the various existing uses in the planning area.
Table II-13
Summary of Current Water Uses
| Water Use | Dry | Normal | Wet | |||
| (AF/Year) | ||||||
| Surface Water | Ground Water | Surface Water | Ground Water | Surface Water | Ground Water | |
| Agricultural | 178,000 | 200 | 184,000 | 200 | 194,000 | 300 |
| Municipal | 2,700 | 500 | 2,700 | 500 | 2,700 | 500 |
| Domestic | --- | 4,400 | --- | 4,400 | --- | 4,400 |
| Industrial1 | --- | 68,000 | --- | 68,000 | --- | 68,000 |
| Recreation | Non-consumptive | |||||
| Environmental | Non-consumptive | |||||
| Evaporation | 11,300 | 11,300 | 11,300 | |||
| TOTAL | 192,000 | 73,100 | 198,000 | 73,100 | 208,000 | 73,200 |