Wyoming State Water Plan
Wyoming State Water Plan
Wyoming Water Development Office
6920 Yellowtail Rd
Cheyenne, WY 82002
Phone: 307-777-7626

Wyoming Water Development Office
6920 Yellowtail Rd
Cheyenne, WY 82002
Phone: 307-777-7626


| SUBJECT: |
Appendix B Irrigated Crops |
| PREPARED BY: | HKM Engineering Inc. |
| DATE: | February 2002 |
INTRODUCTION
Irrigated agriculture represents the greatest consumption of water within the boundaries of the Northeast Wyoming River Basins planning area. An accurate estimate of existing irrigation water use is therefore central to a comprehensive water use inventory. Estimates of water use by irrigated agriculture can generally be divided into the following three components:
This memorandum summarizes the methodology used to determine the type and geographic distribution of crops grown on irrigated lands in the basin. The methodology used to map the extent and classification of the irrigated land is summarized in the memorandum "Irrigated Lands Mapping and Water Rights Data" (HKM, 2002). The methodology used to determine the amount of water consumed by irrigated agriculture is summarized in the memorandum "Agricultural Water Use" (HKM, 2002).
The 1972 Water Planning Program report "Water and Related Land Resources of Northeastern Wyoming" summarized the crop distribution for the study area encompassing the Tongue River, Powder River, Little Missouri River, Belle Fourche River, and Cheyenne River (SEO, 1972). Although the crop acreage is not subdivided by drainage, the total acreage and percentages are helpful for the purpose of comparison to the recent estimates. The total crop acreage from the 1972 water plan is summarized in Table 1.
|
TABLE 1 SUMMARY OF CROP DISTRIBUTION 1972 WATER PLAN REPORT | |||
| CROP | ACRES | DISTRIBUTION (% of Total) |
DISTRIBUTION (% of Active Irrigated Acres) |
| Alfalfa | 62,580 | 39.0 | 45.7 |
| Native Hay | 9,465 | 5.9 | 6.9 |
| Other Hay | 11,820 | 7.4 | 8.7 |
| Pasture | 41,055 | 25.6 | 30.0 |
| Barley | 2,690 | 1.7 | 2.0 |
| Oats | 7,600 | 4.7 | 5.6 |
| Sugar Beets | 415 | 0.3 | 0.3 |
| Corn Silage | 1,100 | 0.6 | 0.8 |
| Idle | 23,860 | 14.8 | NA |
| TOTAL | 160,585 (136, 725 active) |
100.0 | 100.0 |
As shown in the table above, forage crops (alfalfa, native hay, other hay, and pasture) dominated the crop distribution for Northeastern Wyoming in the early 1970s accounting for approximately 91 percent of the total crop acreage under active irrigation (124,920 acres out 136,725 total acres). The percentage of alfalfa and grass was evenly split.
COUNTY AGRICULTURAL STATISTICS
HKM obtained crop production records from the National Agricultural Statistics Service of the USDA (http://www.nass.usda.gov/) as another source of information regarding crop distributions. This information, summarized by county, is helpful as a crosscheck against the more site-specific information developed for this project. The data was collected for the years 1970 through 1999 consistent with the study period for the hydrology task described in the "Surface Water Hydrology" memorandum (HKM, 2002). The national agricultural statistics data was verified against the data from the Wyoming Agricultural Statistics Service for the years 1998 and 1999 (http://www.nass.usda.gov/wy/). No inconsistencies were found. The available data for 1970 . 1999 was used to calculate the average harvested acres and percentages of irrigated crops for the counties encompassed by the planning area. This information is summarized in Table 2.
| TABLE 2 SUMMARY OF CROP DISTRIBUTION 1970-1999 AGRICULTURAL STATISTICS | ||||||||||||
| COUNTY | ALFALFA | GRASS HAY | GRAIN | CORN | BEANS | TOTAL | ||||||
| Acres | % | Acres | % | Acres | % | Acres | % | Acres | % | Acres | % | |
| Campbell | 2,093 | 51 | 1,583 | 38 | 328 | 8 | 127 | 3 | 0 | 0 | 4,130 | 100 |
| Converse | 23,450 | 63 | 9,160 | 25 | 2,873 | 8 | 1,142 | 3 | 520 | 1 | 37,146 | 100 |
| Crook | 4,883 | 56 | 2,945 | 34 | 424 | 5 | 404 | 5 | 0 | 0 | 8,656 | 100 |
| Weston | 2,112 | 55 | 836 | 22 | 205 | 5 | 696 | 18 | 0 | 0 | 3,848 | 100 |
| Niobrara | 7,323 | 52 | 2,910 | 21 | 2,038 | 15 | 1,662 | 12 | 3 | 0 | 13,936 | 100 |
| TOTAL | 39,861 | 59 | 17,434 | 26 | 5,868 | 8 | 4,031 | 6 | 523 | 1 | 67,716 | 100 |
Similar to the results of the 1972 water plan, forage crops (alfalfa and grass hay) were still the dominant crops in the basin from 1970 through 1999, accounting for approximately 85 percent of the total crop acreage. However, in contrast to the 1972 water plan, the distribution between alfalfa and grass crops is now more heavily weighted towards alfalfa (59 percent vs. 26 percent).
AERIAL PHOTOGRAPHY INTERPRETATIONS
HKM obtained 1994/1996 National Aerial Photography Program (NAPP) black and white imagery as the primary basis for the mapping of irrigated lands. A total of approximately 1,250 images were acquired for the planning area. Mapping was performed by viewing the imagery 3-dimensionally, using a Lietz MS-27 three power track stereoscope.
In addition to mapping the irrigated lands and irrigation systems, HKM also utilized the stereo aerial photography as a primary basis for determining the types of crops grown in the various portions of the planning area. Consistent with the 1972 water plan and the agricultural statistics, the two primary crops grown in the basin are still alfalfa and grass (grass hay or pasture grass). HKM's certified photogrammetrist, made a visual assessment of the condition of the fields as well as the foliage density as a primary means of distinguishing between alfalfa and grass hay or pasture. Row crops such as grain crops or corn were more easily distinguished visually although they are of much more limited extent.
Each of the approximately 1800 parcels of irrigated land ("polygons") in the planning area was assigned a primary crop based on the visual assessment (either alfalfa or grass). Grain and corn crops were typically found within polygons where alfalfa was the dominant crop. Because these crops constitute a relatively small portion of the total irrigated acreage in the planning area, they were represented, as a generalized percentage of the polygons where alfalfa was the primary crop. Based on a review of the agricultural statistics together with field inspections, a generalized distribution of 5% corn, 12% grains, and 83% alfalfa was used for these polygons. This information is provided as a crop distribution attribute (% grass, % alfalfa, % grain, and % corn) in the Irrigated Lands GIS data theme ("NEIrr_dd27.shp").
FIELD VERIFICATIONS
HKM toured the basin in the company of local landowners to determine, among other things, the types of crops grown in the various basins of the planning area. The results of this work effort are summarized in the "Irrigation Diversion Operation and Description" memorandum (HKM, 2002).
SUMMARY OF RESULTS
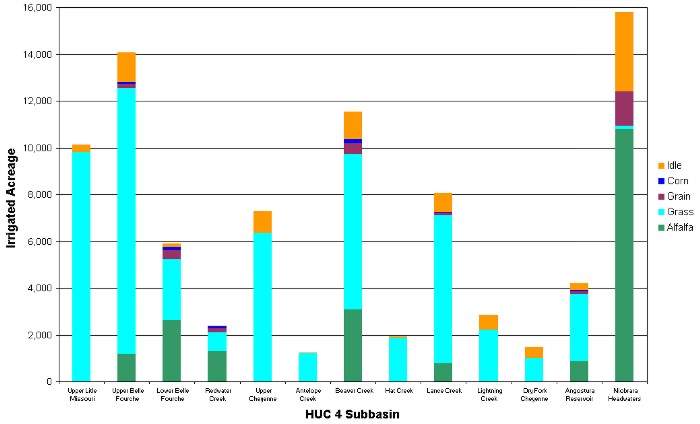
The resulting distribution of irrigated crops is summarized in Table 3 by HUC4 subbasin.
| TABLE 3 SUMMARY OF IRRIGATED CROPS (ACRES) | ||||||||||||
| SUBBASIN NAME |
HUC | ACREAGE | TOTAL ACTIVE |
% OF ACTIVE IRRIGATED ACRES | ||||||||
| ALFALFA | GRASS | GRAIN | CORN | IDLE | TOTAL | ALFALFA | GRASS | GRAIN | CORN | |||
| Upper Little Missouri | 10110201 | 0 | 9,801 | 0 | 0 | 339 | 10,140 | 9,801 | 0 | 100 | 0 | 0 |
| Upper Belle Fourche | 10120201 | 1,174 | 11,385 | 170 | 71 | 1,267 | 14,067 | 12,800 | 9 | 89 | 1 | 1 |
| Lower Belle Fourche | 10120202 | 2,633 | 2,598 | 381 | 159 | 131 | 5,902 | 5,771 | 46 | 45 | 7 | 2 |
| Redwater Creek | 10120203 | 1,292 | 807 | 187 | 78 | 12 | 2,376 | 2,364 | 55 | 34 | 8 | 3 |
| Upper Cheyenne | 10120103 | 0 | 6,357 | 0 | 0 | 914 | 7,271 | 6,357 | 0 | 100 | 0 | 0 |
| Antelope Creek | 10120101 | 0 | 1,199 | 0 | 0 | 51 | 1,250 | 1,199 | 0 | 100 | 0 | 0 |
| Beaver Creek | 10120107 | 3,092 | 6,648 | 447 | 186 | 1,175 | 11,548 | 10,373 | 30 | 64 | 4 | 2 |
| Hat Creek | 10120108 | 0 | 1,869 | 0 | 0 | 72 | 1,941 | 1,869 | 0 | 100 | 0 | 0 |
| Lance Creek | 10120104 | 790 | 6,309 | 114 | 48 | 801 | 8,062 | 7,261 | 11 | 87 | 1 | 1 |
| Lightning Creek | 10120105 | 0 | 2,211 | 0 | 0 | 643 | 2,854 | 2,211 | 0 | 100 | 0 | 0 |
| Dry Fork Cheyenne | 10120102 | 0 | 1,014 | 0 | 0 | 454 | 1,468 | 1,014 | 0 | 100 | 0 | 0 |
| Angostura Reservoir | 10120106 | 877 | 2,860 | 127 | 53 | 288 | 4,205 | 3,917 | 22 | 73 | 3 | 2 |
| Niobrara Headwaters | 10150002 | 10,795 | 146 | 1,472 | 0 | 3,384 | 15,797 | 12,413 | 87 | 1 | 12 | 0 |
| TOTAL | 20,653 | 53,204 | 2,898 | 595 | 9,531 | 86,881 | 77,350 | 26 | 69 | 4 | 1 | |
As shown in Table 3, in contrast to the agricultural statistics, HKM mapped a higher percentage of grass than alfalfa. This is likely because much of the irrigated grass land (grass hay or pasture), especially that associated with the more marginal irrigation in the planning area is not reported in the agricultural statistics. The crop acreage summarized here is used as the basis for determining irrigation water consumption in the planning area. The results are shown graphically on Figure 1.
REFERENCES
HKM Engineering Inc.. Agricultural Water Use, Technical Memorandum, Northeast Wyoming River Basins Plan, February 2002. Billings, Montana
HKM Engineering Inc. Irrigation Diversion Operation and Description, Technical Memorandum, Northeast Wyoming River Basins Plan, February 2002. Billings, Montana
HKM Engineering Inc. Irrigated Lands Mapping and Water Rights Data, Technical Memorandum, Northeast Wyoming River Basins Plan, February 2002. Billings, Montana
HKM Engineering Inc. Surface Water Hydrology, Technical Memorandum, Northeast Wyoming River Basins Plan, February 2002. Billings, Montana
Wyoming State Engineer's Office, Wyoming Water Planning Program, Report 10, Water & Related Land Resources of Northeastern Wyoming, April 1972. Cheyenne, Wyoming