Wyoming State Water Plan
Wyoming State Water Plan
Wyoming Water Development Office
6920 Yellowtail Rd
Cheyenne, WY 82002
Phone: 307-777-7626

Wyoming Water Development Office
6920 Yellowtail Rd
Cheyenne, WY 82002
Phone: 307-777-7626


Appendix C.1
Madison Aquifer System
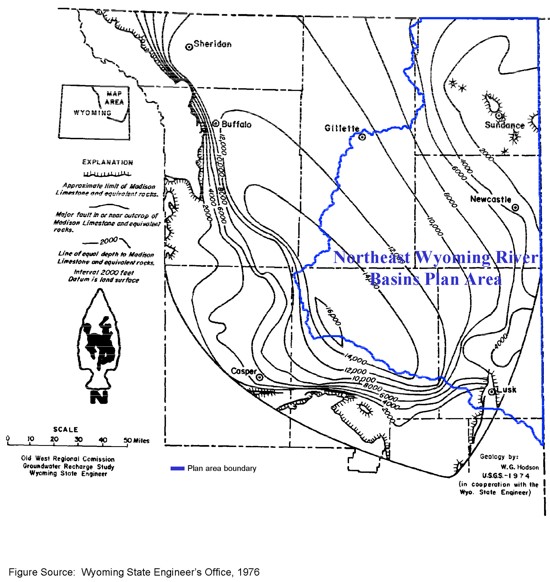
Figure C.1.1. Depth to the Madison Limestone and Equivalent Rocks
in the Powder River Structural Basin and Adjacent Areas.
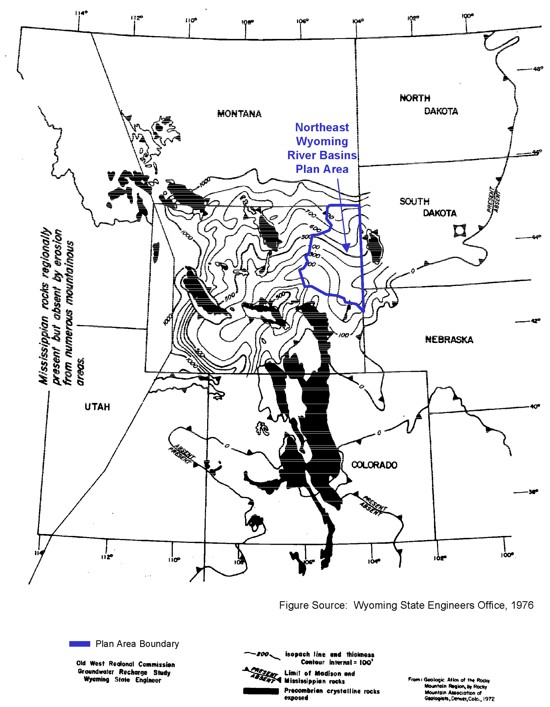
Figure C.1.2. Thickness of Madison Limestone in Wyoming and its Regional Limits.
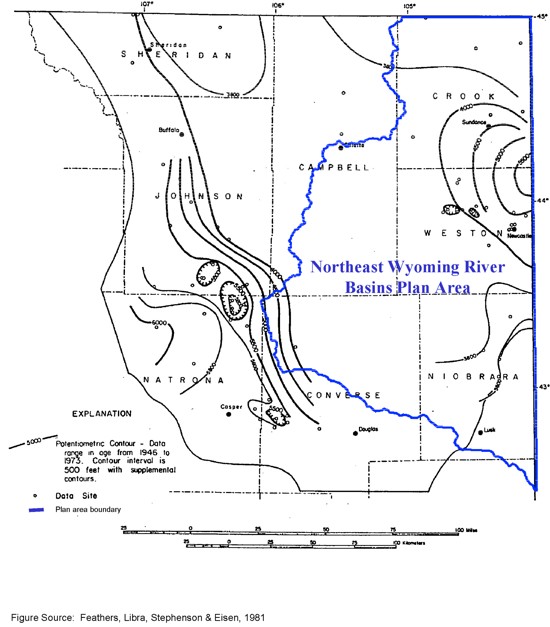
Figure C.1.3. Potentiometric Surface in the Madison Aquifer
(after Swenson and others, 1976).
Table C.1.1 Reported Transmissivities and Storage Coefficients for the Madison Aquifer in the Madison River Structural Basin, Wyoming
| Area | Transmissivity (gpd/ft) |
Storage Coefficient | Source | Method Used |
| USGS Test Well (57/65-15) | 3,000 - 21,000 | - | Blankennagel et al. 1977 | Drill stem tests |
| Gillette Well Field (51/66-6) | ||||
| Well CR-4 | 150,000 | 2 x 10⁻⁴ | Wyoming Water PlanningProgram, 1977 | Single well pump test |
| Well CR-4 | 150,000 - 300,000 | - | Montgomery, 1979 | 2-well pump test and other data |
| Well City #1 | ~10,000 | - | Montgomery, 1979 | 2-well pump test and other data |
| Newcastle Area | 5,000 - 15,000 | 10-4 | Wyo. St. Eng., 1974 | Estimate |
| 58,000 | 9 x 10⁻⁵ | Woodward-Clyde, 1980 | Flow and recovery, 2 wells | |
| Well # 45/61-28 | 29,920 | - | Swenson et al., 1976 | Specific capacity based estimate |
| Well # 45/61-20 | 11,000 | - | Woodward-Clyde, 1980 | Constant discharge test |
| Near Hartville Hills in S.E. | 1,000-3,000 | 1 x 10⁻⁴ - 5 x 10⁻⁵ | Wyo. St. Eng., 1974 | - |
| ETSI Wellfield (Niobrara Co.) | 1,000-3,000 | 5 x 10⁻⁵ | Stockdale, 1974, also Anderson and Kelly, 1974 |
Hantush method for leaky aquifers |
| 4,900-7,320 2,420-3,400 |
4.5 x 10⁻⁵ - 7.8 x 10⁻⁵ 7.7 x 10⁻⁴ - 9.2 x 10⁻⁵ |
Rahn, 1975 Rahn, 1975 |
Jacob Method Theis curve, no leakage | |
| Near Douglas, in South | 500-1,000 | 10-4 (est) | Wyo. St. Eng., 1974 | - |
| Midwest Area | 8,400 6,462-16,156 |
- - |
Konikow, 1976 Konikow, 1976 |
Flow net analysis Steady state model calibration |
| Near Bighorn Mts. in N.W. | 8,000-89,000 | 4.3 x 10⁻⁴ - 3.2 x 10⁻⁴ | Wyo. St. Eng., 1974 | - |
| Entire Basin Average | 6,460-25,850 6,460-23,260* |
- - |
Konikow, 1976 Konikow, 1976 |
Recharge based steady state Model calibration Potentiometric based steady state model calibration |
Table C.1.2 Calculated Specific Capacities (Yield Per Unit Drawdown) of
Madison Aquifer Wells,
Powder River Structural Basin, Northeast Wyoming River Basins Plan Area,
Wyoming
| Well # (T/R-Sec. ¼, ¼) |
Date | Test Duration (hrs) |
Drawdown (ft) |
Yield (gpm) |
Specific Capacity (gpm/ft) |
Data Source |
Remarks |
| CROOK COUNTY | |||||||
| 51/66-6 BCB | 5/8/79 | --- | 134 | 82 | 0.61 | 5 | -Step discharge test |
| --- | 223 | 128 | 0.57 | 5 | 30 min. steps | ||
| --- | 296 | 171 | 0.58 | 5 | pre acid frac | ||
| 22.75 | 301 | 166 | 0.55 | 5 | final step, 20 + hrs. | ||
| 6/28/79 | --- | 19 | 82 | 4.3 | 5 | -Step discharge test | |
| --- | 34 | 128 | 3.8 | 5 | 30 min. steps | ||
| --- | 49 | 171 | 3.5 | 5 | post acid frac. | ||
| --- | 93 | 280 | 3.0 | 5 | |||
| --- | 151 | 430 | 2.8 | 5 | |||
| --- | 242 | 590 | 2.4 | 5 | |||
| --- | 274 | 635 | 2.3 | 5 | |||
| 15.25 | 295 | 635 | 2.2 | 5 | final step, 12 + hrs. | ||
| +52/63-25 DC | -/-/71? | 1 | 58 | 175 | 3.0 | 1 | .Held for 24 hours. |
| 1 | 14 | 190 | 13.6 | 1 | .Held for 30 days. | ||
| -/-/72 | 24 | 74 | 200 | 2.7 | 2 | ||
| 53/65-18 BBD | 9/26/62 | 140 min. | 1 | 15 | 15.0 | 2 | -Step discharge and |
| 80 min. | 4 | 25 | 6.2 | 2 | recovery tests | ||
| 120 min. | 6 | 30 | 5.0 | 2 | |||
| 110 min. | 9 | 37 | 4.1 | 2 | |||
| 95 min. | 10 | 40 | 4.0 | 2 | |||
| 12 | 13 | 45 | 3.5 | 2 | |||
| 16 | 19 | 55 | 2.9 | 2 | |||
| 57/65-15 DAC | 10/20/76 | --- | --- | --- | 2.1 | 4 | From drill stem test (#15) |
| --- | --- | --- | 1.1 | 4 | From drill stem test (#16) | ||
| NIOBRARA COUNTY | |||||||
| +36/62-28 AB1 | -/-/74 | 24 | 95 | 57 | 0.60 | 1 | |
| 4/24/74 | 108 | 88 | 57 | 0.65 | 6 | ||
| +36/62-28 AB2 | -/-/74 | 3 | 370 | 170 | 0.46 | 1 | |
| 5/-/74 | 179 min. | 217 | 104 | 0.48 | 2 | ||
| 204 min. | 386 | 180 | 0.47 | 2 | |||
| 5/3/74 | 120 | 266 | 125 | 0.47 | 6 | ||
| 5/19/74 | 198? | 390 | 180 | 0.46 | 6 | -Discharge reduced after | |
| 24½ days | 330 | 150 | 0.45 | 6 | 8¼ days pumping | ||
| 8/28/74 | 96 | 370 | 170 | 0.46 | 6 | ||
| 9/7/74 | 48 | 370 | 170 | 0.46 | 6 | ||
| 39/62-2 AAB | -/-/62 | ? | 36 | 30 | 0.83 | 2, 3 | Swab test |
| 2/26/63 | 1 | 36 | 60 | 1.7 | 1 | ||
| WESTON COUNTY | |||||||
| 44/63-26 CAC | 6/6/67 | 5 | 23 | 250 | 10.9 | 1 | |
| 6/-/67 | 5 | 175 | 250 | 1.4 | 3 | ||
| 45/61-20 DCA | -/-/49 | ? | 462* | 1600 | 3.5 | 1 | |
| unk | ? | 173 | 600 | 3.5 | 3 | -Static water level pre- | |
| ? | 277 | 1000 | 3.6 | 3 | sumed equal to original | ||
| ? | 462 | 1500 | 3.2 | 3 | shut-in pressure (+462 ft) | ||
| unk | ? | 127 | 600 | 4.7 | 2 | -Static water level pre- | |
| ? | 231 | 1000 | 4.3 | 2 | sumed equal to 1962 shut- | ||
| ? | 416 | 1500 | 3.6 | 2 | in pressure (+416 ft) | ||
| 45/61-20 DCC | -/-/78 | ? | 381* | 640 | 1.7 | 1 | |
| 45/61-21 CBD | 4/-/66 | 72 | 200 | 460 | 2.3 | 3 | |
| 9/1/66 | 72 | 141? | 463 | 3.3 | 1 | -Reported drawdown may not | |
| include SIP component | |||||||
| unk | ? | 60* | 50 | 0.83 | 2 | ||
| +45/61-28 AB- | -/-/62? | 3 wks. | 270* | 1200 | 4.4 | 1, 2 | |
| 7/-/65 | ? | 18 | 276 | 15.3 | 3 | ||
| 45/61-29 CBB | 5/20/60 | 8 min. | 462* | 117 | 0.25 | 1 | |
| unk | ? | 346* | 120 | 0.35 | 2 | ||
| 45/61-30 ADB | 7/-/60? | ? | 300* | 650 | 2.2 | 2 | |
| 45/61-33 AB | 4/-/64? | ? | 323* | 290 | 0.90 | 1, 2 | .Restricted surface flow. |
| 46/63-10 CDA | 8/28/79 | 739 min. | 638? | 579 | 0.91 | 1 | |
| 46/63-15 BDC | -/-/51 | ? | 393* | 500 | 1.3 | 2 | |
| unk | ? | 393* | 190 | 0.48 | 2 | ||
| 46/63-17 CBC | -/-/69 | ? | 531* | 800 | 1.5 | 1 | .Flow through 2 inch hose. |
| -/-/69? | ? | 647* | 800 | 1.2 | 1, 2 | Different reported SIP | |
| 8/-/73 | ? | 427* | 800 | 1.9 | 2 | Flow may not be 1973 data | |
| 46/64-13 CCA | -/-/60? | ? | 92* | 30 | 0.33 | 2 | Yield may not be 1960 data |
| +46/64-19 BDC | -/-/56? | ? | 80 | 280 | 3.5 | 3 | Plugged, 1965 |
| 46/64-23 CCB | 3/5/65 | 6 | 65 | 70 | 1.1 | 1 | Swab test |
| 6/-/72 | Sev. Wks. | 293 | 308 | 1.1 | 3 | ||
| 46/65-20 CDD | 9/19/60 | 6 | 295? | 425 | 1.4 | 1 | |
| 46/65-23 BAD | 6/-/72 | 2 mos. | 76 | 225 | 3.0 | 3 | |
| unk | ? | 400 | 600 | 1.5 | 2 | ||
| 46/66-25 DBB | 4/16/62 | 1 | 30 | 354 | 11.8 | 1 | |
| 6/-/72 | 4 mos. | 211 | 360 | 1.7 | 3 | ||
| 47/60-4 AA | 8/9/65 | 36 | 5? | 8 | 1.6 | 1 | |
| 48/65-25 CBB | -/-/49 | 55 min. | 517 | 15.4 | 0.03 | 1 | |
| 6/-/72 | 6 | 110 | 210 | 1.9 | 3 | ||
| 48/65-35 CC- | 6/-/72 | 5 | 101 | 155 | 1.5 | 3 | 6 hrs. per source #2 |
Table Source:
Feathers, K.R., Libra, R., Stephenson and Eisen, C. 1981. Occurrence and characteristics of ground water in the Powder River Basin, Wyoming. Laramie, WY: University of Wyoming, Water Resources Research Institute, pp. 63-66.
Table C.1.3 Hydrologic Properties of Permo-Pennsylvanian Rocks of The Madison Aquifer System,
Powder River Structural Basin, Northeast Wyoming River Basins Plan Area, Wyoming
(Determined from Oil Field Data)
| Field | Approximate Location (T/R) |
Pay Thickness (ft) |
Porosity (%) |
Permeability* (md) |
Calculated. Transmissivity (gpd/ft) |
Data Source |
| Upper Minnelusa Fm. ("Converse" sands): | ||||||
| Basin | 47/70 | 24 | 14.7 | 61.8 | 27 | 5 |
| 30 | --- | 62 | 34 | 4 | ||
| 45 | --- | 46 | 38 | 4 | ||
| Basin Northwest | 47/70 | --- | 12.7 | 48.4 | --- | 5 |
| Bishop Ranch | 48/70 | 180 | --- | 100 | 328 | 4 |
| Bishop Ranch South | 48/70 | --- | 15.1 | 100 | --- | 5 |
| Deadman Creek | 53/67 | 18 | 17.6 | --- | --- | 5 |
| Dillinger Ranch | 47/69-70 | 30 | 16.8 | 100 | 55 | 5 |
| Duvall Ranch | 49/69 | --- | 17 | 88.8 | --- | 5 |
| Donkey Creek Area | 49-50/68 | 0-50 | 8-25 | 20-1000+ | <910 | 1 |
| Guthery | 51/68 | --- | 18.9 | 184 | --- | 5 |
| Halverson Ranch | 49/69 | 37 | 14.3 | 132 | 89 | 2 |
| --- | 13 | 56 | --- | 5 | ||
| Hamm | 51/69 | 35 | 19.7 | 239 | 152 | 5 |
| Kummerfeld | 50-51/68 | --- | 17 | 208 | --- | 5 |
| Lance Creek | 35-36/65 | 30 | 16 | 3 | 2 | 3,5 |
| Mellott Ranch | 52/68 | 25 | 16 | --- | --- | 5 |
| Pickrel Ranch | 48/69 | --- | 16.1 | 126 | --- | 5 |
| Pleasant Valley Ranch | 51/69 | --- | 11.1-14 | 29 | --- | 5 |
| Prong Creek | 50/67 | 36 | 8.6-24.6 | 13-936 | 9-613 | 2 |
| 26 | 18.5 | 411 | 194 | 2 | ||
| 45 | 23 | 834 | 683 | 2 | ||
| Rainbow Ranch | 49/71 | 10-35 | 17 | 170 | 31-108 | 2 |
| 20 | 16 | 90 | 33 | 2 | ||
| Raven Creek | 48/69 | 15-65 | <19 | <200 | <237 | 2 |
| 30 | 13 | 60 | 33 | 2 | ||
| 35 | 15 | 50-200 | 32-127 | 3 | ||
| 38 | 15 | 92 | 64 | 5 | ||
| Robinson Ranch | 50/67 | 18± | 14 | 200 | 66 | 3 |
| 22± | 21 | 440 | 176 | 3 | ||
| Rozet South | 50/70 | --- | 17.8 | 212 | --- | 5 |
| Stewart | 50-51/69 | --- | 5.8-14.8 | 10.7-134 | --- | 5 |
| Timber Creek | 49/70 | 40 | 16 | 80 | 58 | 2 |
| 20 | 16 | 80 | 29 | 2 | ||
| Whisler | 50-51/70 | 12.1 | 18.6 | 242.2 | --- | 5 |
| Middle Minnelusa Fm. ("Leo" sands): | ||||||
| Lance Creek | 35-36/65 | 100 | 8-23 | 0.5-324 | 1-590 | 3 |
Notes:
*Md x 18.2 x 10-3 = gpd/ft2, assuming fluid is water at 60ºF.
.Assuming fluid is water at 60ºF and pay thickness equals aquifer thickness.
| Date Sources: | 1 - Wyoming Geological Association, 1958 2 - Wyoming Geological Association, 1963 3 - Wyoming Geological Association, 1957 (supplemented, 1961) 4 - Wyoming State Oil and Gas Commission files 5 - Collentine and others, 1981 |
Table Source:
Feathers, K.R., Libra, R., Stephenson, T.R., and Eisen, C. 1981. Occurrence and characteristics
of ground water in the Powder River Basin, Wyoming. Laramie, WY: University of Wyoming,
Water Resources Research Institute. pp. 70-72.
Appendix C.2
Dakota Aquifer System
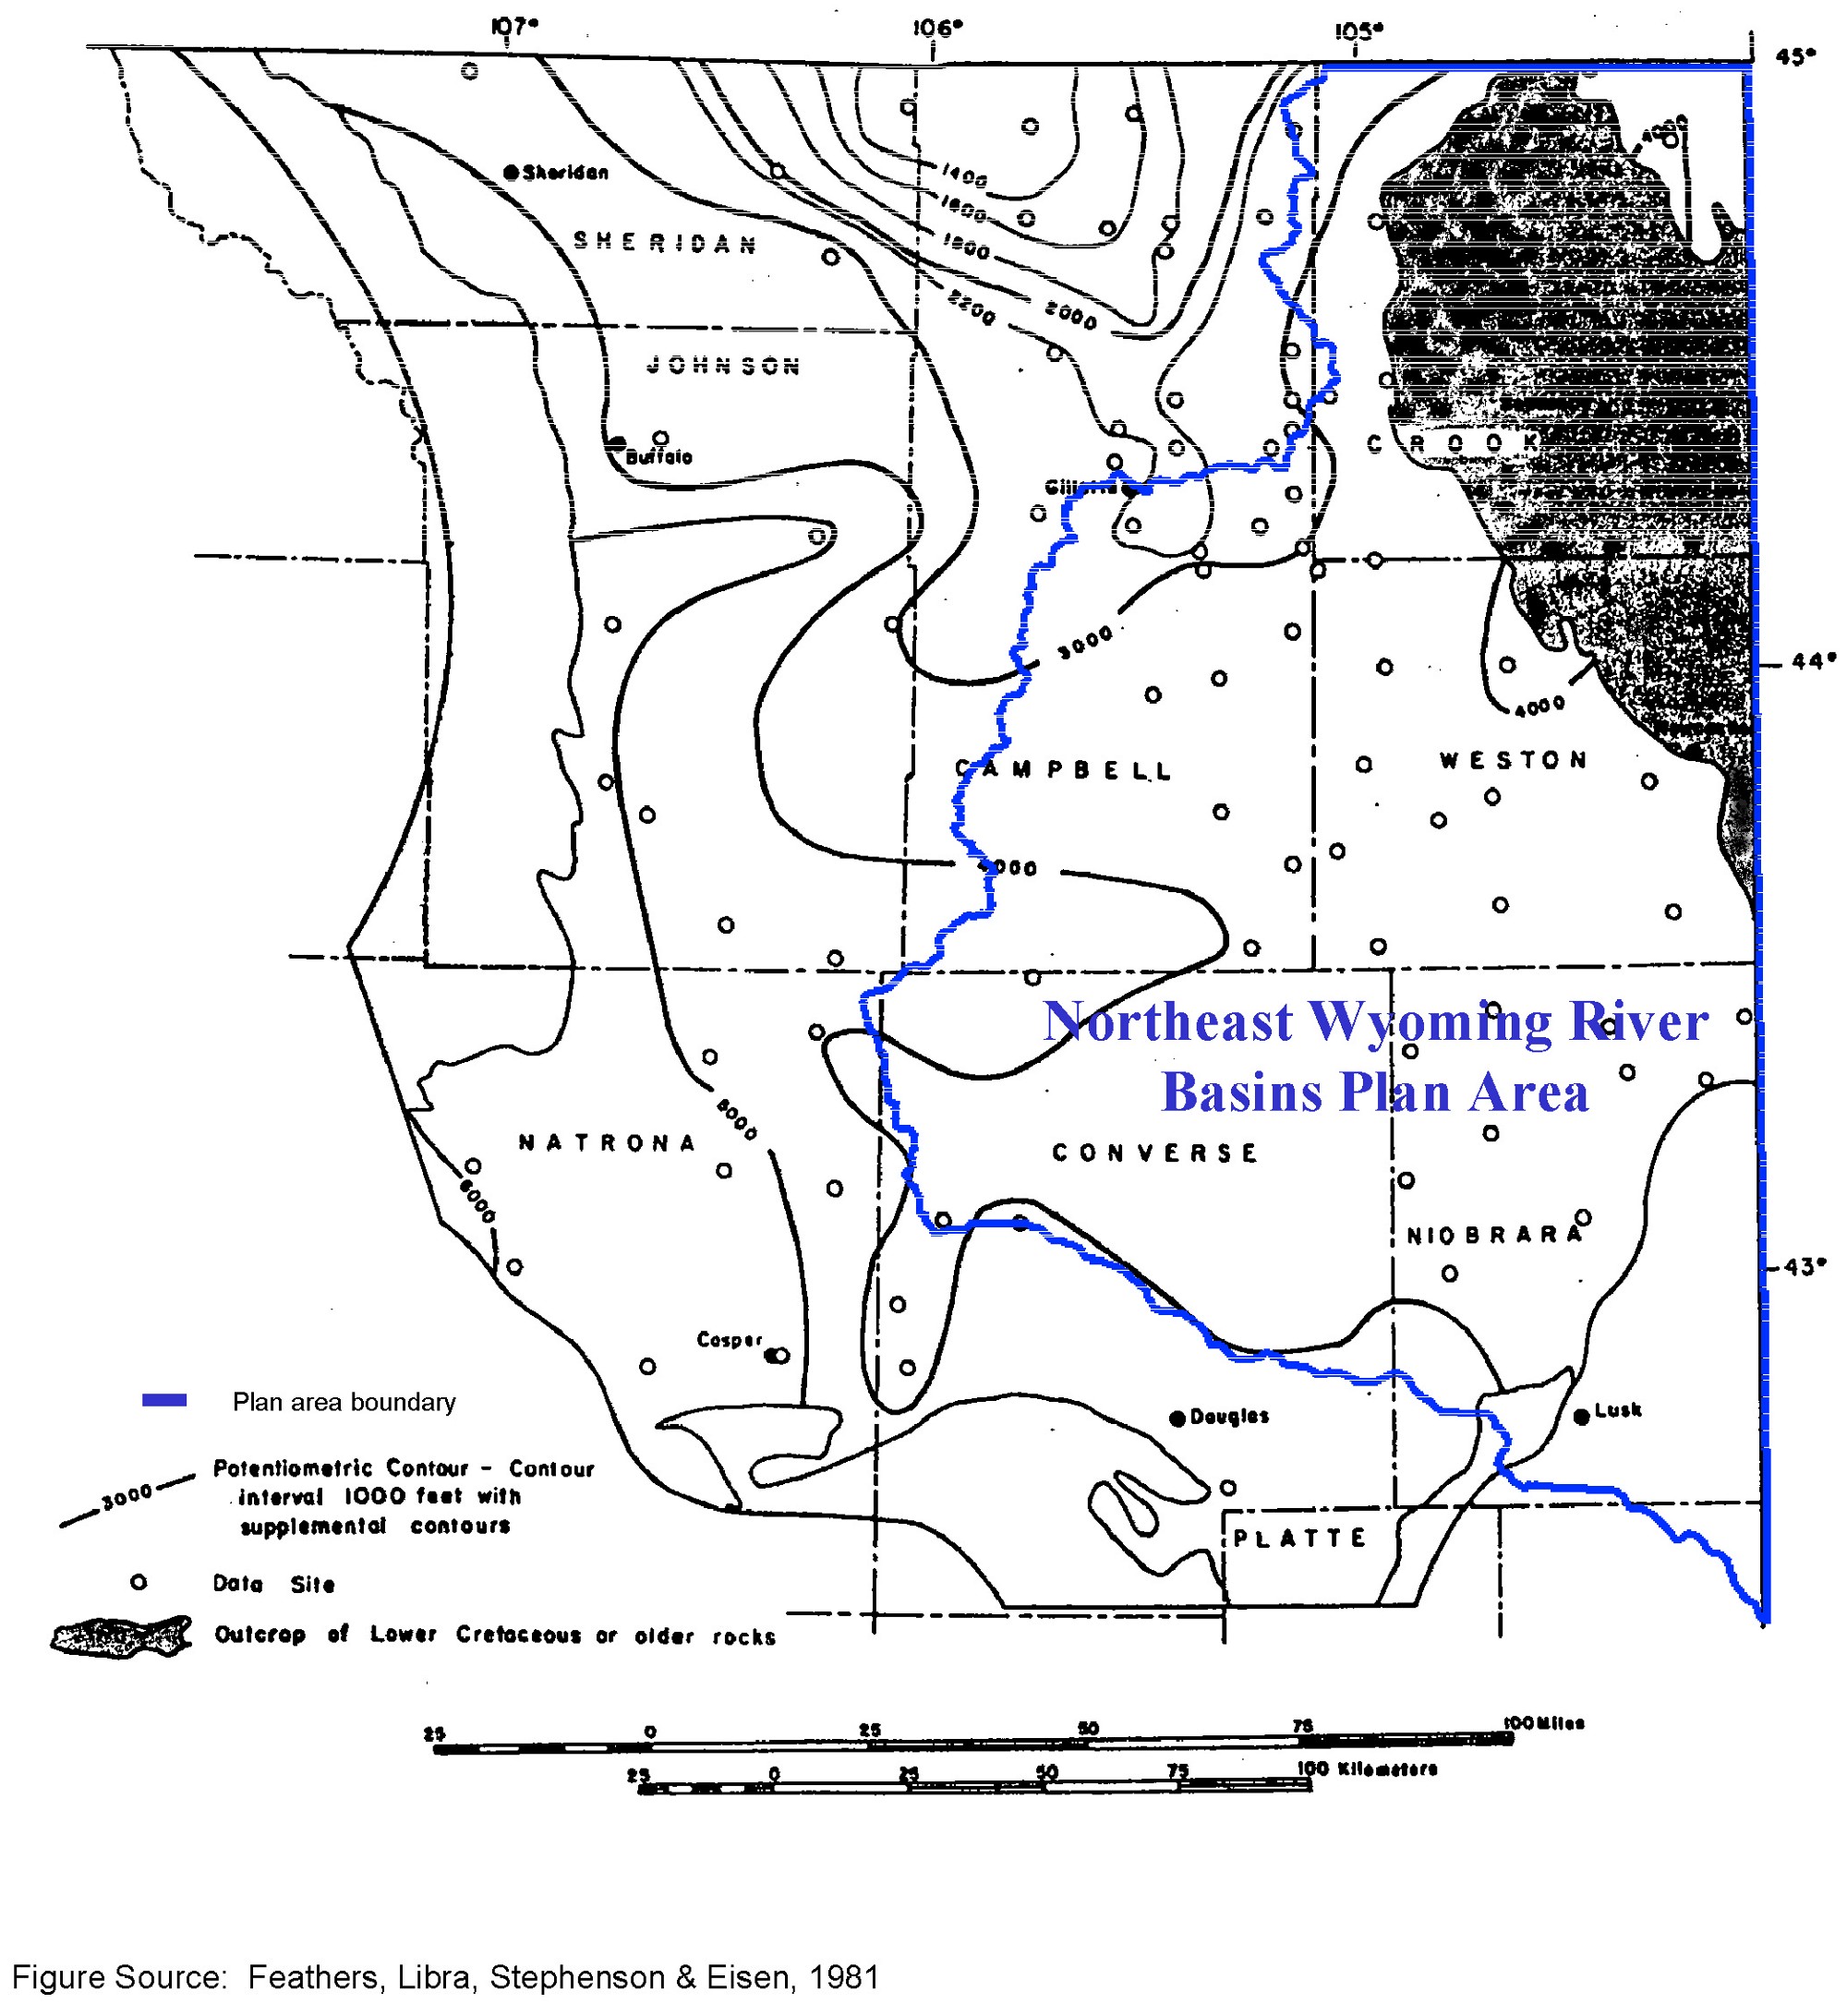
Figure C.2.1 Potentiometric Surface in the Dakota Aquifer System (from Lobmeyer, 1980).
Table C.2.1 Hydrologic Properties of Lower Cretaceous Rocks of The Dakota Aquifer System,
Powder River Structural Basin, Northeast Wyoming River Basins Plan Area, Wyoming
(Determined from Oil Field Data)
| Field | Approximate Location (T/R) |
Pay Thickness (ft) |
Porosity (%) |
Permeability* (md) |
Calculated. Transmissivity (gpd/ft) |
Data Source |
| Newcastle/ Muddy Ss.: | ||||||
| Bertha | 54/69 | 4 | 23 | 334 | 24 | 1 |
| Clareton | 42-43/65-66 | --- | 9.3 | 5 | --- | 7 |
| Fiddler Creek West | 45-46/65-67 | 5.8 | 20 | 1-18 | 0.1-2 | 7 |
| Fiddler Creek East | 46/64-65 | 50a | 18.6 | 3-6 | 3-5 | 7 |
| Hilight | 43-46/69-71 | --- | 20.3 | 104 | --- | 7 |
| Joe Creek | 47/72 | 29 | 12.2 | --- | --- | 7 |
| Kitty | 50/73 | 22 | 16 | 345 | 138 | 3 |
| Lance Creek | 35-36/65 | 10-20 | 17 | 20 | 4-7 | 7 |
| Lazy "B" | 49/73-74 | 100-300a | 13.6 | 14.1 | 26-77 | 7 |
| Lightning Creek | 35/65-66 | 0-12 | 19.5 | 10 | <2 | 7 |
| 6 | 21 | 13 | 1 | 1 | ||
| Lonetree Creek-Lodgepole Creek | 44-45/66-67 | 4 | --- | <1 | --- | 1 |
| Osage | 46/63-64 | 5 | 22.8 | 44.2 | 4 | 7 |
| --- | 23 | 25.9 | --- | 7 | ||
| 8 | 18.1 | 87.7 | 13 | 7 | ||
| --- | 21.1 | 51 | --- | 7 | ||
| 10 | 23.3 | 428 | 78 | 7 | ||
| 8 | 22 | 55 | 8 | 7 | ||
| 8-13 | 19.1 | 2-87.7 | 0.3-21 | 7 | ||
| Rozet East | 50/69 | --- | 15 | 63 | --- | 7 |
| Rozet | 50/69-70 | 10-45 | 20 | 58 | 11-48 | 1 |
| Skull Creek | 44-45/62 | 8-38 | 15.8 | 89 | 13-62 | 7 |
| Slattery | 49/69 | 4 | 20 | 15 | 1 | 1 |
| Springen Ranch | 50-51/71 | --- | 2-15 | 2.4-588 | --- | 7 |
| Steinle Ranch | 39/69-70 | 6 | 12.6 | 8.3 | 1 | 2 |
| 6 | 13.5 | 133.8 | 15 | 2 | ||
| Timber Creek | 49/70 | 20 | 20 | 100 | 36 | 4 |
| Fall River/Dakota Ss.: | ||||||
| Bridge Creek | 39/61 | 4 | 23.5 | 733 | 53 | 1 |
| Coyote Creek | 48-49/68 | 40 | 14.5 | 200 | 146 | 1 |
| Coyote Creek South | 48-49/68 | 60 | 18 | 200 | 218 | 3 |
| Donkey Creek Area | 49-50/68 | 20 | 16 | 150 | 55 | 1 |
| 0-20 | 15 | <10 | <4 | 5 | ||
| 0-20 | 15 | <5 | <2 | 5 | ||
| 0-50 | 13 | 10-1000 | <900 | 5 | ||
| Kummerfeld | 50-51/68 | 28 | 19 | 250 | 127 | 1 |
| >30 | 17 | 100-2000+ | --- | 4 | ||
| Lance Creek East | 36/64 | 30 | 15 | 0-302 | <165 | 1 |
| Lonetree Creek-Lodgepole Creek | 44-45/66-67 | 10 | 15 | 200 | 36 | 1 |
| Miller Creek | 51/68 | 26 | 18.5 | 200 | 95 | 1 |
| 35 | 18.5 | 200 | 127 | 4 | ||
| Lakota/Cloverly Fm.: | ||||||
| Sherwood | 40/77 | 15 | 16 | <25 | <7 | 5 |
Notes:
*Md x 18.2 x 10-3 = gpd/ft2, assuming fluid is water at 60ºF.
.Assuming fluid is water at 60ºF and pay thickness equals aquifer thickness.
aReported as gross formation thickness rather than net pay.
| Date Sources: | 1 - Wyoming Geological Association, 1957 (supplemented, 1961) 2 - Wyoming Geological Association, 1976 3 - Wyoming Geological Association, 1968 4 - Wyoming Geological Association, 1963 5 - Wyoming Geological Association, 1958 6 - Wyoming Geological Association, 1954 7 - Collentine and others, 1981 |
Table Source:
Feathers, K.R., Libra, R., Stephenson, T.R., and Eisen, C. 1981. Occurrence and characteristics of ground water in the Powder River Basin, Wyoming. Laramie, WY: University of Wyoming, Water Resources Research Institute. pp. 89-92.
Table C.2.2 Reported Specific Capacities (Yield Per Unit Drawdown) of Wells
in The Dakota Aquifer System, Powder River Structural Basin, Northeast Wyoming
River Basins Plan Area, Wyoming
| Well Location (T/R-Sec. ¼ ¼) |
Geologic Formation(s) |
Test Date |
Test Duration (hrs) |
Drawdown (ft) |
Discharge (gpm) |
Specific Capacity (gpm/ft) |
Data Source |
Remarks |
| CROOK COUNTY | ||||||||
| 55/61-8 DC | Kfr & Klk | 8/3/56 | 2 | 33.5 | 3.2 | 0.10 | 1 | Flowing well |
| 56/62-28 BB | Kfr & Klk | 7/21/56 | 4 | 21.2 | 9.2 | 0.47 | 1 | Flowing well |
| -29 DD | Klk | 7/21/56 | 2 | 12.3 | 2.9 | 0.24 | 1 | |
| 56/65-8 CC | Klk | 11/2/56 | ? | 20. | 25. | 1.2 | 1 | Flowing well |
| NIOBRARA COUNTY | ||||||||
| 34/65-1 BB | Kik | 10/-/59? | --- | 50 E | 60 | 1.2 | 3 | |
| -1 BC | Kik | 10/-/59? | --- | 50 E | 220 | 4.4 | 3 | |
| 35/65-35 AB | Kik | -/-/41 | --- | 35 | 140 | 4.0 | 3 | Flowing well test |
| 36/61-24 CC | Klk | 7/-/60? | 2 | 300 | 40 | 0.13 | 4 | |
| 37/62-1 BA | Klk | 6/17/71 | --- | 15 | 7 | 0.47 | 4 | Bailer test |
| 38/62-25 DC | Klk | 5/10/67 | 7 | 44 | 30 | 0.68 | 4 | |
| 40/60-29 BD | Klk | -/-/69 | 24 | 120 | 6 | 0.05 | 4 | |
| 40/61-25 CDD | Klk | 6/15/70 | 72 | 350 | 8 | 0.02 | 4 | |
| WESTON COUNTY | ||||||||
| 44/62-11 CC | Kfr & Klk | 1/15/70? | 4.5 | 350 | 66 | 0.19 | 4 | Pumped flowing well; drawdown may not include pressure head component |
| 45/62-22 CC | Klk | 1/13/73? | 2.5 | 300 | 88 | 0.29 | 4 | Swab test on flowing well; drawdown may not include pressure head component |
| 46/63-18 AD | Klk | 10/30/59 | 21 | 70 | 18.9 | 0.27 | 4,5 | Flowing well |
| 46/64-13 AA | Kfr & Klk | 8/15/77? | --- | 28 | 10 | 0.36 | 4 | Flowing well |
| -13 CCA | Klk | 8/-/59 | --- | 150 | 58 | 0.39 | 5 | Flow test |
| 6/16/59 | 1 | 150 | 210 | 1.4 | 4,5 | Flow test | ||
| 8/19/60 | ~9 mos. | 175 | 75 | 0.43 | 5 | Long term pumpage | ||
| -24 ADA | Klk | 2/1/46 | ? | 46 | 42 | 0.91 | 4,5 | Flow test |
| -24 ADA | Klk? | 7/9/77? | ? | 69 | 5 | 0.07 | 4 | Flow test |
| 47/63-30 CC | Klk | 9/25/60 | ? | 30 E | 8.5 | 0.28 | 5 | Flow test |
| 47/65-1 DAB | Klk | 5/1/76? | 2.5 | 400 | 4 | 0.01 | 4 | |
| 48/65-25 CAB | Klk | --- | 72 | 490 | 38 | 0.08 | 4 | |
| -35 AB | Kfr? | --- | 3 | 510 | 4.5 | 0.01 | 4 | |
| -35 CCB | Klk? | --- | 72 | 405 | 35 | 0.09 | 4 | |
| Abbreviations: | Kik = Inyan Kara Group Kfr = Fall River Formation Klk = Lakota Formation Kcv = Cloverly Formation E = Estimated |
| Date Sources: | 1 - Whitcomb and Morris,1964 2 - U.S. Department of the Interior, 1974 3 - Whitcomb, 1965 4 - Wyoming State Engineer's Office permit files 5 - Whitcomb, 1960 |
Table Source:
Feathers, K.R., Libra, R., Stephenson, T.R., and Eisen, C. 1981. Occurrence and characteristics of ground water in the Powder River Basin, Wyoming. Laramie, WY: University of Wyoming, Water Resources Research Institute. pp. 86-87.
Appendix C.3
Fox Hills/Lance Aquifer System
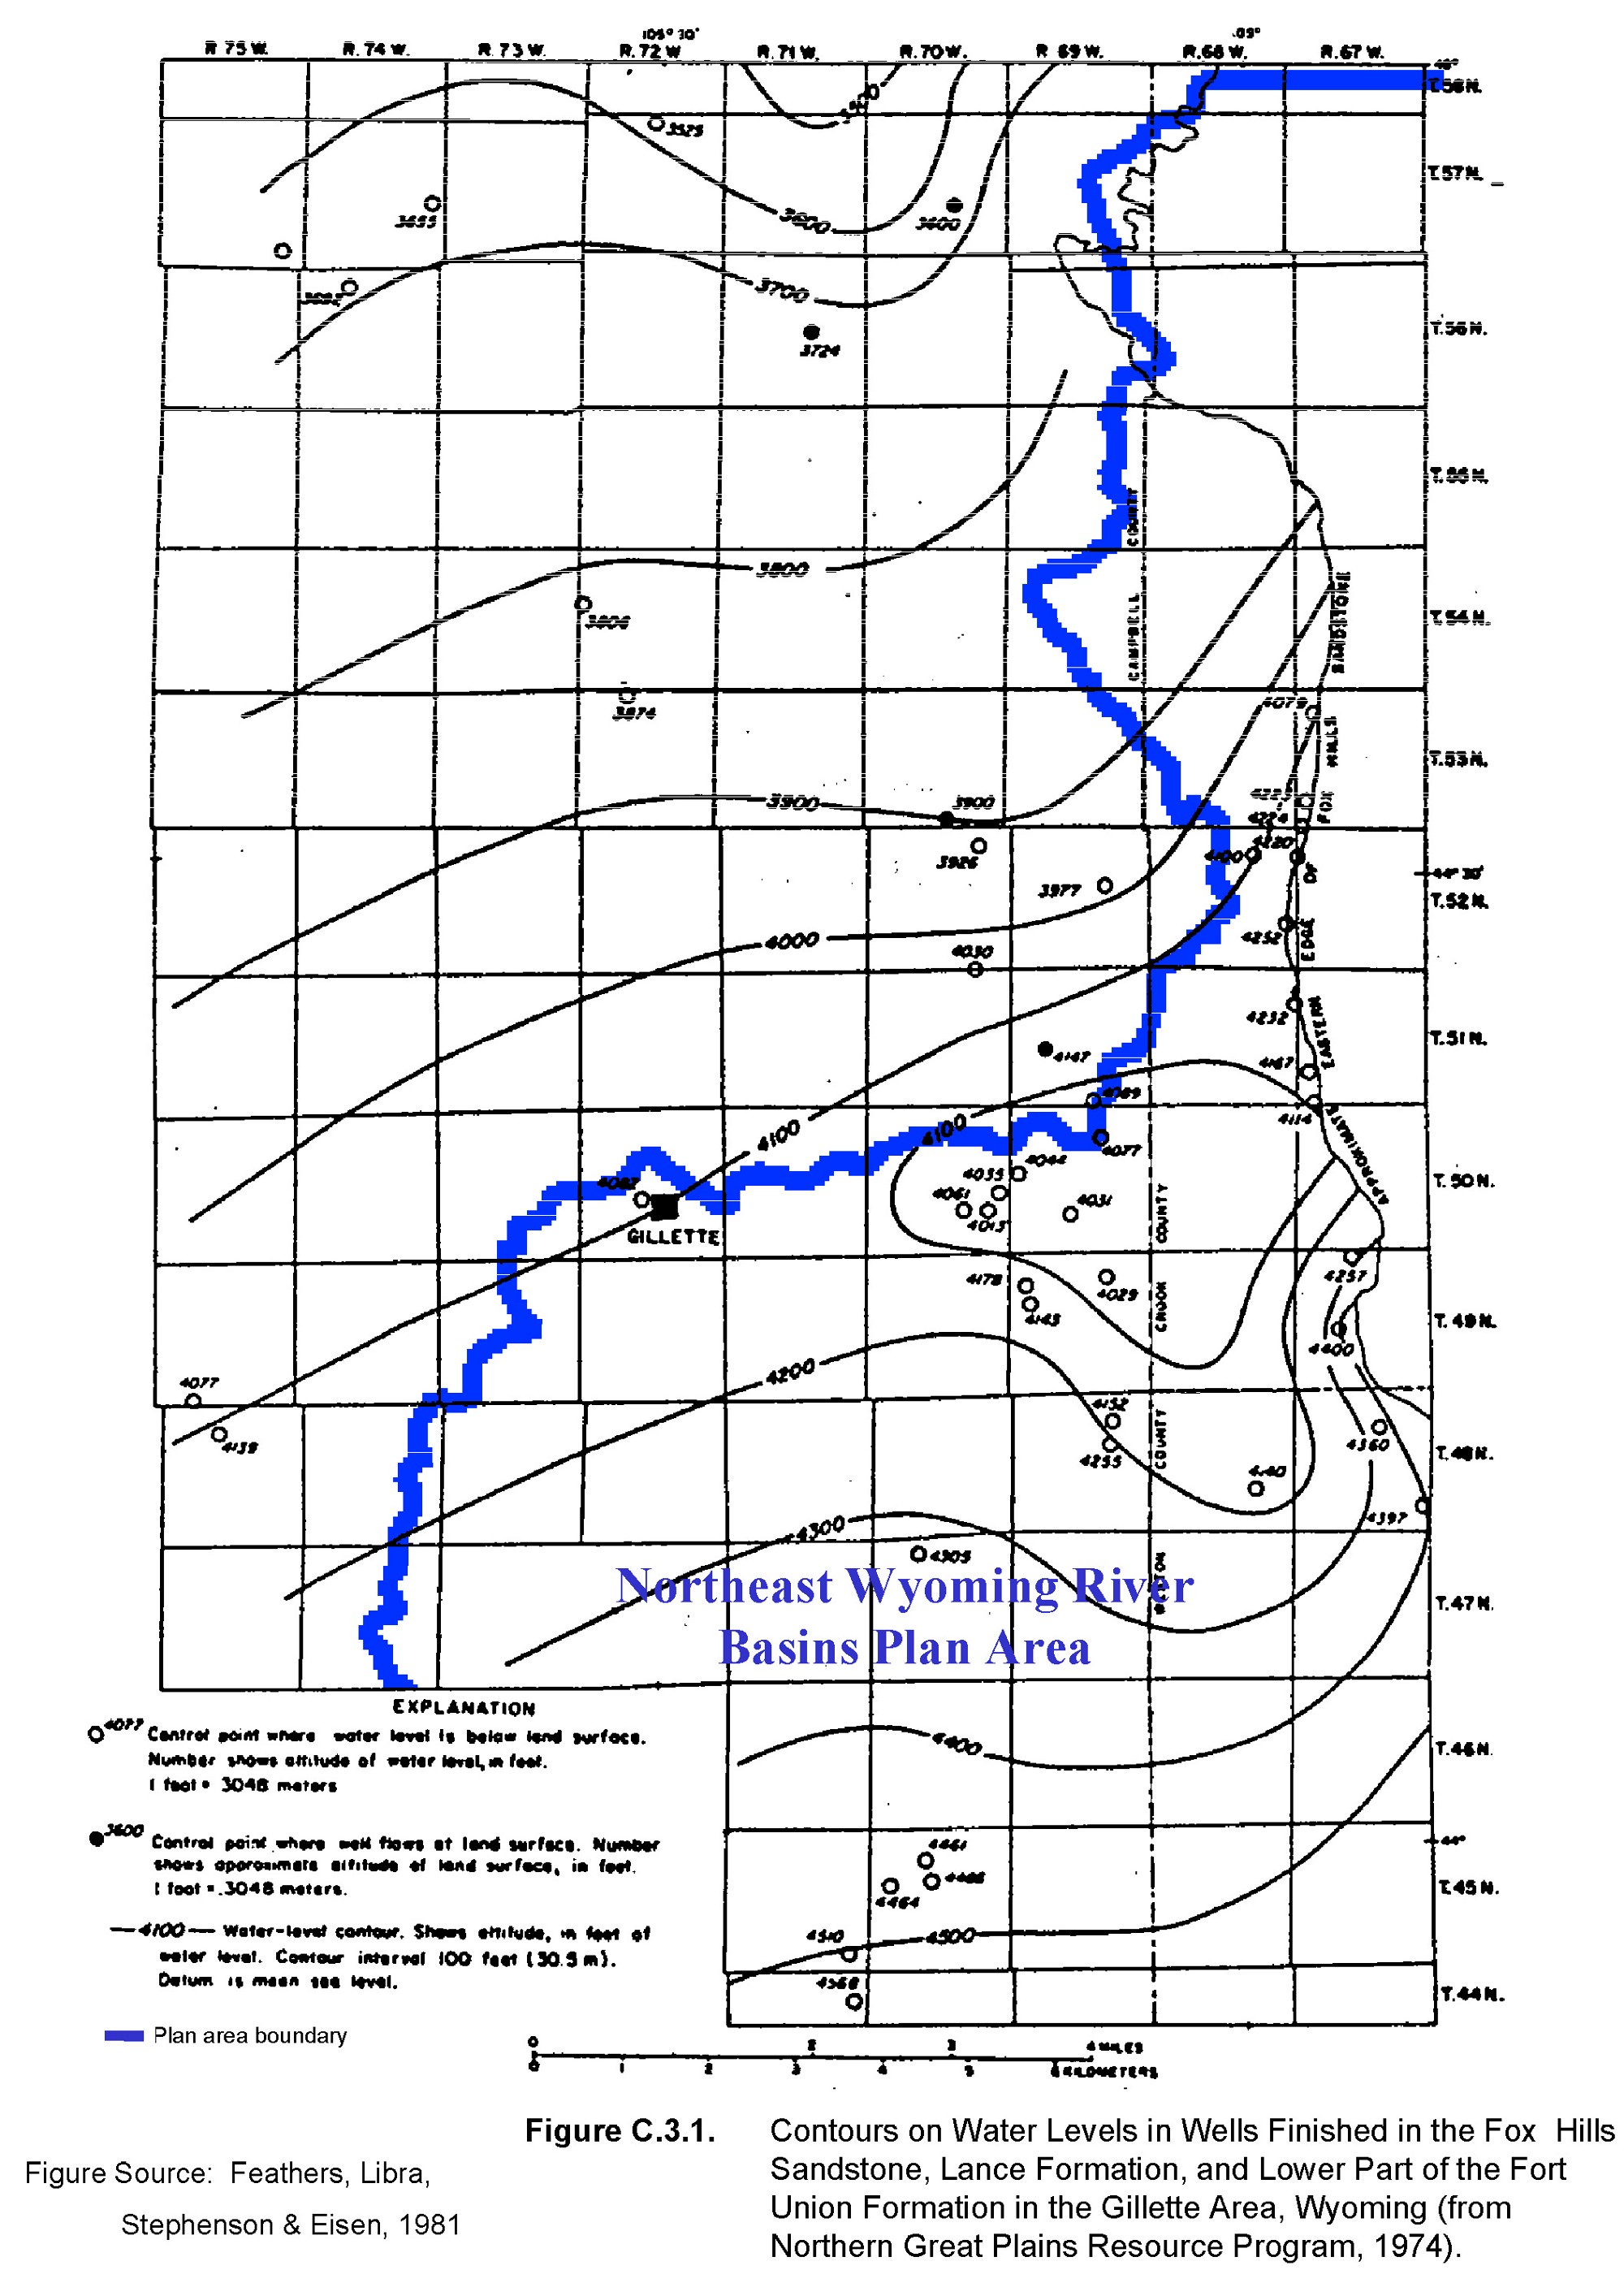
Figure C.3.1 Contours on Water Levels in Wells Finished in the Fox Hills Sandstone,
Lance Formation, and Lower Part of the Fort Union Formation in the Gillette Area, Wyoming
(from Northern Great Plains Resource Program, 1974).
Table C.3.1 Reported Transmissivities And Permeabilities for Wells in the Fox Hills/Lance Aquifer
System, Powder River Structural Basin, Northeast Wyoming River Basins Plan Area, Wyoming
| Well Location (T/R-Sec. ¼ ¼) |
Geologic Formation(s) |
Test Date |
Test Duration (hrs) |
Saturated Aquifer Thickness (ft) |
Transmissivity (gpm/ft) |
Calculated* Permeability (gpm/ft2) |
Data Source/Remarks |
| CROOK COUNTY | |||||||
| 49/68-36 DB | Lance | 6/19/56 | 2 | 29 | 170 | 6 | Whitcomb & Morris, 1964; order of magnitude estimate due to short test duration. |
| 50/68-14 CD | Lance | 6/21/56 | 2½ | 40 | 1060 | 26 | Same as above. |
| -24 CD | Lance | 6/21/56 | 2 | 60 | 2100 | 35 | Same as above. |
*Calculated by dividing transmissivity by the saturated aquifer thickness.
Table Source:
Feathers, K.R., Libra, R., Stephenson, T.R., and Eisen, C. 1981. Occurrence and characteristics of ground water in the Powder River Basin, Wyoming. Laramie, WY: University of Wyoming, Water Resources Research Institute. p. 105.Table C.3.2 Reported Specific Capacities (Yield Per Unit Drawdown) of Wells in The Fox Hills/Lance Aquifer System, Powder River Structural Basin, Northeast Wyoming River Basins Plan Area, Wyoming
| Well Location (T/R-Sec. ¼ ¼) |
Geologic Formation(s) |
Test Date |
Test Duration (hrs) |
Drawdown (ft) |
Discharge (gpm) |
Specific Capacity (gpm/ft) |
Data Source |
Remarks |
| CAMPBELL COUNTY | ||||||||
| 44/71-12 BB | Kfh, K1, Tft | 1728 | 309 | 0.18 | 1 | |||
| 45/70-8 BB | do | 1021 | 265 | 0.26 | 1 | |||
| -9 BD | do | 610 | 378 | 0.62 | 1 | |||
| -16 AB | do | 1050 | 356 | 0.34 | 1 | |||
| -18 AD | do | 584 | 379 | 0.65 | 1 | |||
| 45/71-14 DA | do | 1707 | 231 | 0.14 | 1 | |||
| -36 BB | do | 1428 | 251 | 0.18 | 1 | |||
| 46/71-34 AD | do | 1600 | 380 | 0.24 | 1 | |||
| -34 DD | do | 2200 | 357 | 0.16 | 1 | |||
| 50/72-21CC | Kfh | 240 | 90 | 0.38 | 2 | |||
| CROOK COUNTY | ||||||||
| 49/68-16 CA | Tft | 6/4/56 | --- | 4.1 | 2.3 | 0.56 | 4 | |
| -27 BC | Tft | 6/1/56 | --- | 17.3 | 3.2 | 0.18 | 4 | |
| -28 AB | Tft | 6/2/56 | --- | 12.2 | 5.0 | 0.41 | 4 | |
| -29 BC | Tft | 6/2/56 | --- | 14.0 | 1.3 | 0.09 | 4 | |
| -36 DB | K1 | 6/19/56 | 2 | 3.4 | 1.4 | 0.41 | 4 | Aquifer test |
| 50/68-14 CD | K1 | 6/21/56 | 2.5 | 2.6 | 4.4 | 1.7 | 4 | Aquifer test |
| -14 DD | K1 | 6/-/56 | --- | 28.6 | 4.4 | 0.15 | 3 | |
| -24 CD | K1 | 6/21/56 | 2 | 3.8 | 5.8 | 1.5 | 4 | Aquifer test |
| 53/67-8 BB | Kfh | 11/6/56 | 4 | 26.4 | 5.5 | 0.21 | 4 | Aquifer test |
| 53/68-15 CD | K1 | 11/2/56 | --- | 50. | 10. | 0.20 | 4 | |
| NIOBRARA COUNTY | ||||||||
| 36/64-18 CC | Kfh | 11/-/59 | 47.5 | 3 E | 0.06 | 7 | ||
| 36/63-2 BB | Kfh | 10/-/59 | 100 | 6 E | 0.06 | 7 | ||
| -13 CA | Kfh | 10/-/59 | 20 | 5 E | 0.25 | 7 | ||
| -13 CB | Kfh | 10/-/59 | 140 | 5 E | 0.04 | 7 | ||
| 38/63-25 BD | Kfh | 10/-/59 | 40 | 100 | 2.5 | 7 | ||
| 38/64-18 AC | K1 | 3/-/60 | 31 | 6 E | 0.19 | 7 | ||
| 39/62-3 AB | Kfh | 10/-/59 | 22 | 4 E | 0.18 | 7 | ||
| 39/64-32 DD | K1 | 10/-/59 | 25 | 30 | 1.2 | 7 | ||
| 40/64-15 CA | K1 | 9/-/59 | 70 | 30 | 0.43 | 7 | ||
| WESTON COUNTY | ||||||||
| 42/65-6 CA | Kfh | 8/-/60 | 200 | 47 | 0.24 | 3 | ||
| -30 BC | K1 | 10/-/68 | 0.5 | 30 | 60. | 3 | ||
| Abbreviations: | Kfh = Fox Hills Sandstone K1 = Lance Formation Tft = Tullock member of Fort Union Formation E = Estimated |
| Date Sources: | 1 - Lowry, 1972 2 - Littleton, 1950 3 - Northern Great Plains Resource Program, 1974 4 - Whitcomb and Morris, 1964 5 - Whitcomb and others, 1966 6 - Crist and Lowry, 1972 7 - Whitcomb, 1965 8 - Lowry and Cummings, 1966 |
Table Source:
Feathers, K.R., Libra, R., Stephenson, T.R., and Eisen, C. 1981. Occurrence and characteristics of ground water in the Powder River Basin, Wyoming. Laramie, WY: University of Wyoming, Water Resources Research Institute. pp. 101-103.
Appendix C.4
Fort Union/Wasatch Aquifer System
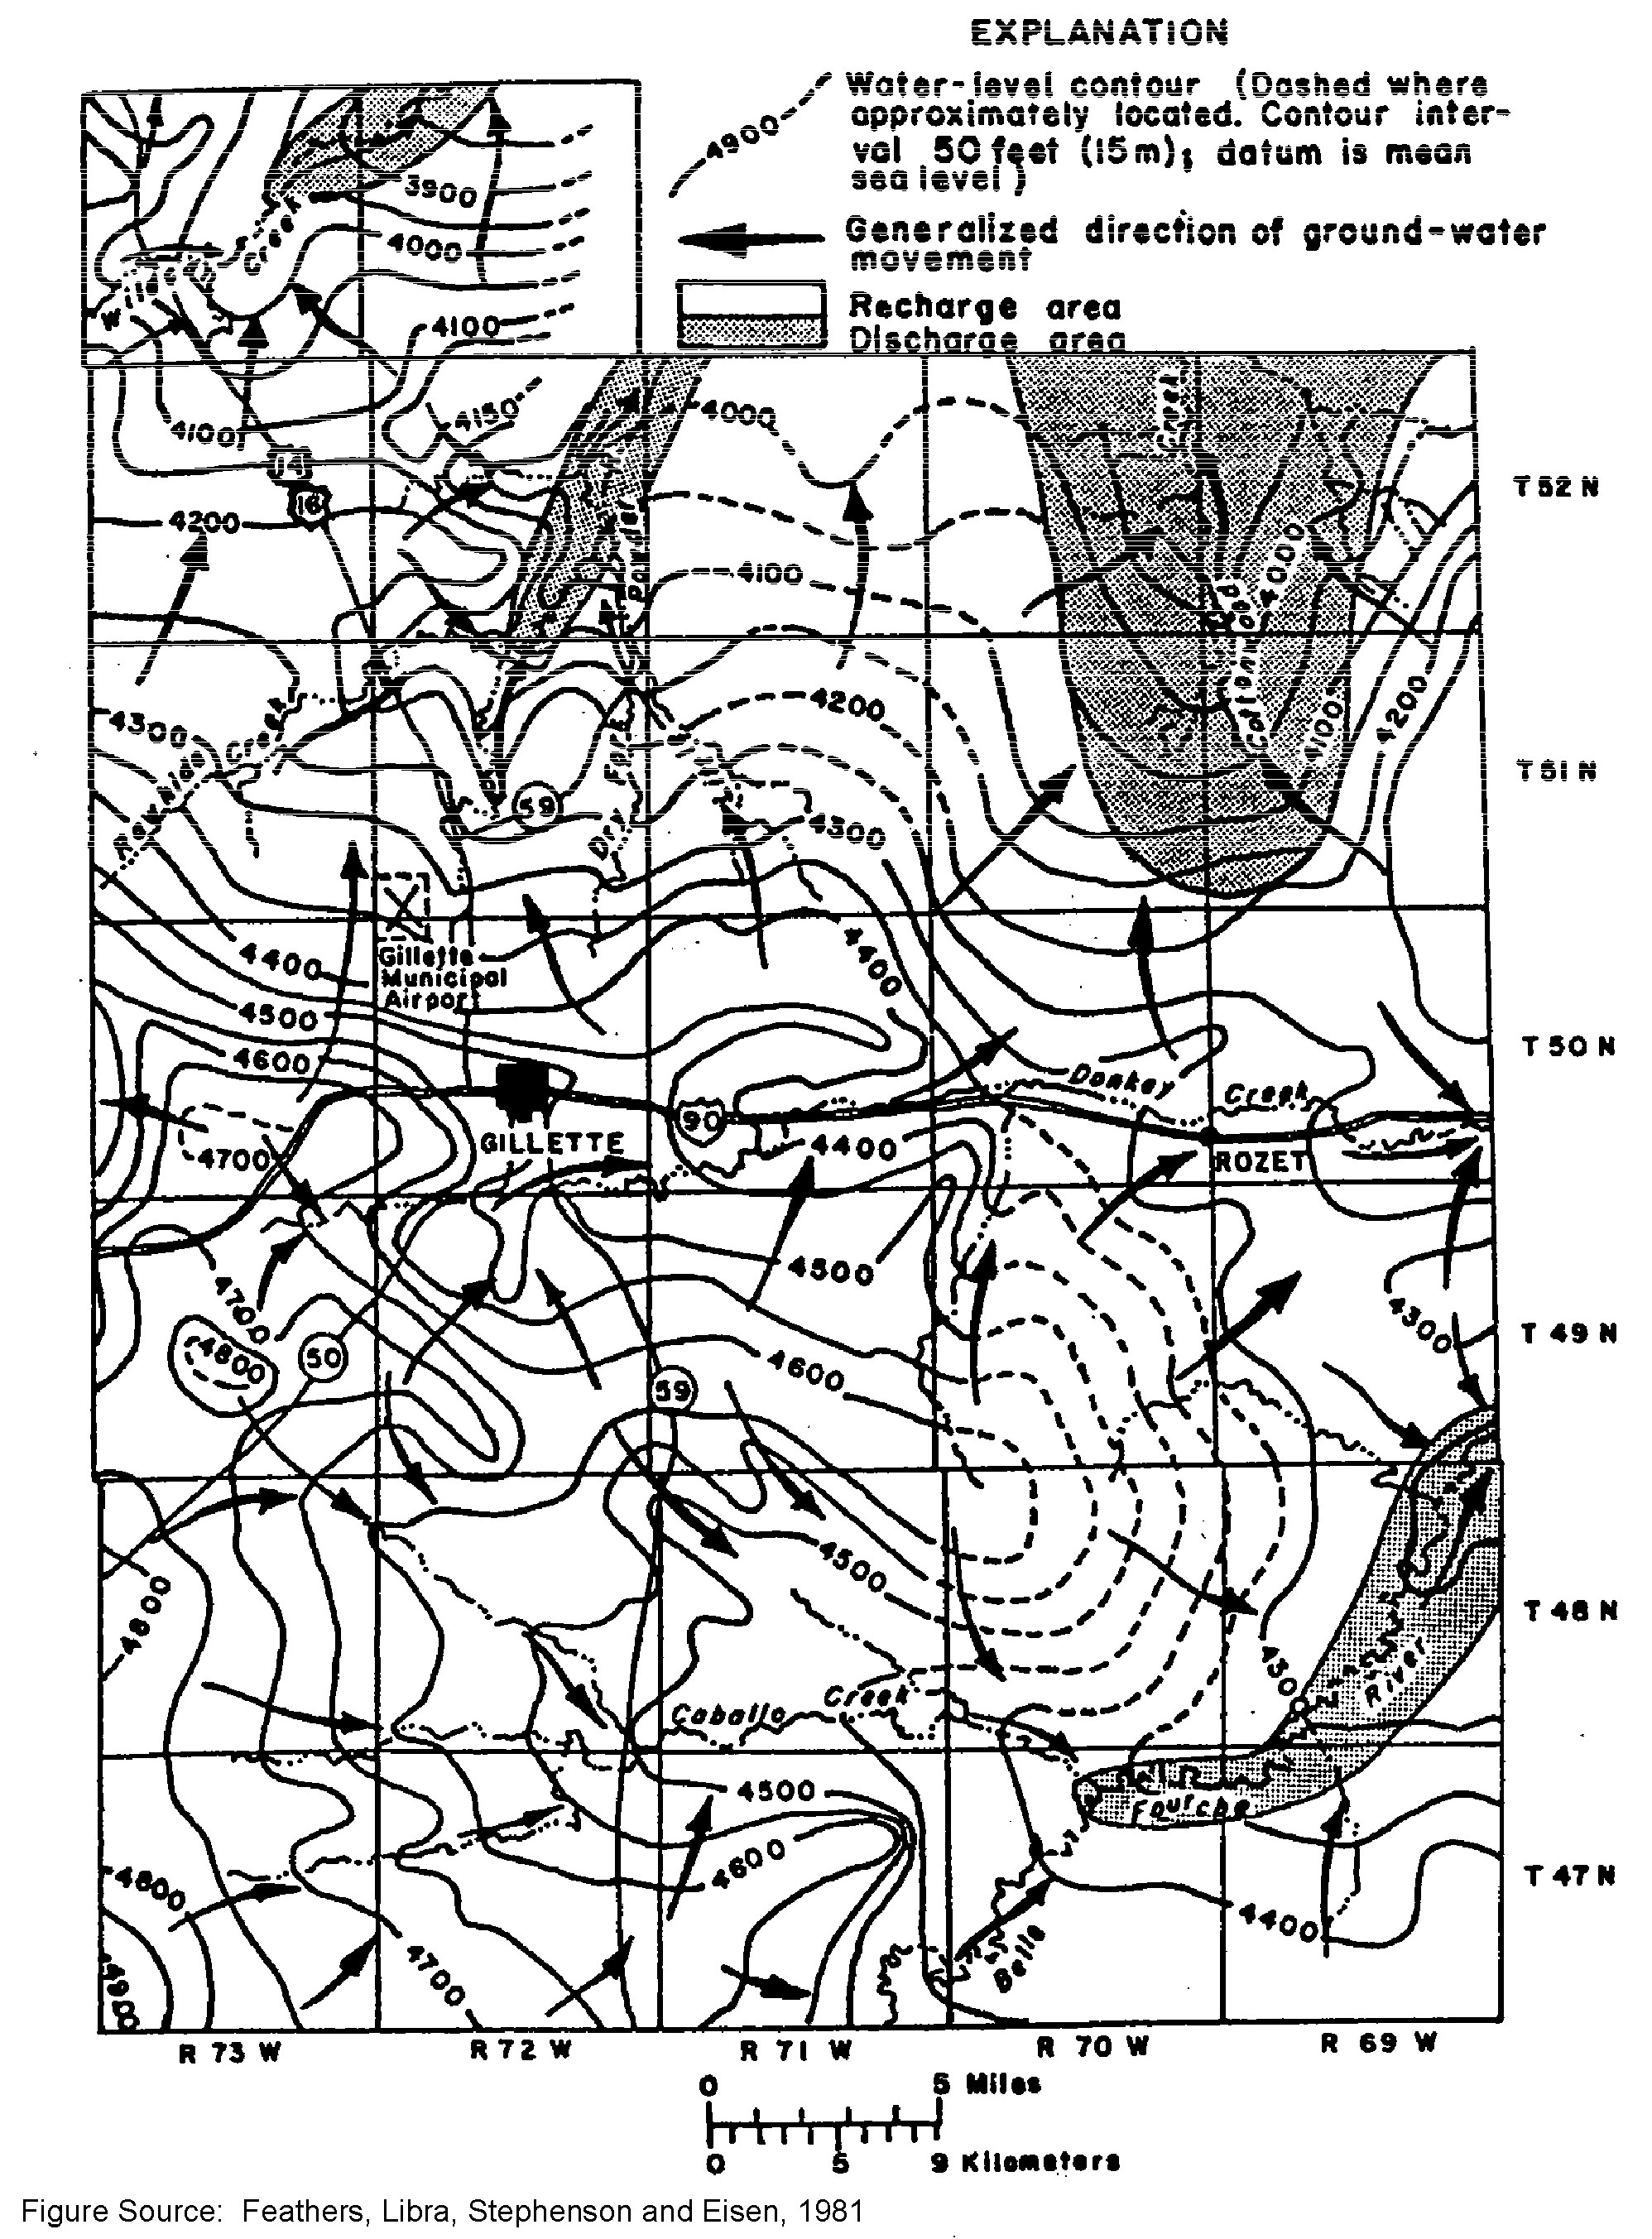
Figure C.4.1. Water Levels and Direction of Horizontal Movement of Ground Water
in the Fort Union and Wasatch Formations in the Gillette Area, Wyoming
(modified after King, 1974; from Northern Great Plains Resource Program, 1974).
Table C.4.1 Transmissivities of The Fort Union/Wasatch Aquifer System, Powder River Structural Basin,
Northeast Wyoming River Basins Plan Area, Wyoming
| Site Name | Location (T/R) |
Test Date |
Test Typea |
Tested Thickness (ft) |
Transmissivity (gpm/ft)b |
Permeabilityb (md) |
Storage Coefficient |
Data Source |
Remarks |
| Fort Union Formation | |||||||||
| Black Thunder Mine | 43/70 | --- | Pumped well & recovery | --- | 7200 | --- | --- | 1 | Jacob method, data skewed |
| Belle Ayr Mine | 48/71 | --- | Pump & recovery | 60 | 1528 | 2.2x10⁻³ | 2 | ||
| 10/6/76 | Slug | 20 | 100 | 5.0C | ~4x10⁻⁴ | 3 | |||
| 10/6/76 | Slug | 20 | --- | --- | --- | 3 | No recovery after 15 min. | ||
| 10/6/76 | Slug | 20 | --- | --- | --- | 3 | No recovery after 15 min. | ||
| USGS Tests | 49/68 | 6/21/56 | Pumped well | 30 | 160 | 6 | --- | 8 | 2.5 hour test |
| 6/22/56 | Pumped well | 87 | 430 | 5 | --- | 8 | 7 hour test | ||
| 6/22/56 | Pumped well | 107 | 60 | 0.5 | --- | 8 | 2 hour test | ||
| 6/27/56 | Pumped well | 70 | 30 | 0.5 | --- | 8 | 3 hour test | ||
| East Gillette Mine | 50/71 | 10/26/76 | Slug | 20 | 371 | 19.0C | 1x10⁻⁵ | 4 | Bad packer seal, shaley material in interval tested |
| City of Gillette | 2/1/77 | Pump | 150 | 1320 | 8.8C | 3.9x10⁻⁴ | 5 | Jacob method on pumped well | |
| 2750 | 18.3C | 2.1x10⁻⁴ | 5 | Jacob method on obs. well | |||||
| 2/14/77 | Pump | 150 | 1100 | 7.3C | 3.8x10⁻³ | 5 | Jacob method on pumped well | ||
| 3830 | 25.5C | 2.2x10⁻⁴ | 5 | Jacob method on obs. well | |||||
| Coal | |||||||||
| Black Thunder Mine | 43/70 | Pumped well & recovery | 3800 | 1 | Jacob method | ||||
| do | 5600 | 1 | Jacob method, data skewed | ||||||
| do | 3800 | 1 | Jacob method, data skewed | ||||||
| do | 4400 | 1 | Jacob method, data skewed | ||||||
| do | 4600? | 1 | Jacob method, data erratic | ||||||
| do | 4500 | 1 | Jacob method, data erratic | ||||||
| do | 450 | 1 | Jacob method, data erratic | ||||||
| do | 32 | 1 | Jacob method, data erratic | ||||||
| Recovery | 100? | 1 | Jacob method, data skewed | ||||||
| Recovery | 32 | 1 | Jacob method, data skewed | ||||||
| Recovery | 1300 | 1 | Jacob method, data erratic | ||||||
| Pump & recovery | 3400 | 4.4x1--4 | 1 | Leaky aquifer method | |||||
| Pump & recovery | 5600 | 2.5x10⁻⁴ | 1 | Theis method, slightly skewed data | |||||
| Pump & recovery | 650 | 1.5x10⁻⁶ | 1 | Theis method, poor curve fit | |||||
| 300 | 6.0x10⁻⁴ | 1 | Theis method, better fit than leaky | ||||||
| Pump | 25000 | 7.0x10⁻³ | 1 | Jacob method, slightly skewed data | |||||
| Pump | 750 | 2.0x10⁻³ | 1 | Jacob method | |||||
| Bell Ayr Mine | 48/71 | --- | Pump & recovery | 62 | 1353 | 0.01 | 2 | Excessive drawdown after 1 hr. at 1 gpm | |
| --- | Pump & recovery | 60 | 3542 | 3.8x10⁻³ | 2 | ||||
| 10/6/76 | Slug | 80 | >1000 | >13C | --- | 3 | Complete recovery <3 min. | ||
| 10/6/76 | Slug | 20 | 4.5 | 0.2C | ~4x10⁻⁵ | 3 | |||
| 10/6/76 | Slug | 20 | 5.3 | 0.3C | ~0.4 | 3 | |||
| 10/27/76 | Slug | 2 | >256 | >128C | --- | 3 | Complete recovery 2 min. | ||
| East Gillette Mine | 50/71 | 10/22/76 | Pump | --- | --- | --- | --- | 4 | Near "clinker" |
| 100 | 361 | 3.6C | 3.5x10⁻⁵ | ||||||
| 104 | 441 | 4.2C | 8.8x10⁻³ | ||||||
| 10/12/76 | Pump | --- | --- | --- | --- | 4 | Recharging image well effects | ||
| 105 | 13 | 0.12C | 1.4x10⁻³ | ||||||
| 105 | 63 | 0.60C | 1.2x10⁻³ | ||||||
| 11/3/76 | Pump | --- | --- | --- | --- | 4 | Recharging image well effects | ||
| 94 | 8730 | 93C | 0.33 | ||||||
| 100 | 1420 | 14C | 5.8x10⁻³ | Average of two obs. wells | |||||
| 10/29/76 | Pump | 100 | 392 | 3.9C | 1.2x10⁻³ | 4 | |||
| 8/7/76 | Pump | 80 | 1421-815 | --- | 7.3x10⁻⁴ | 4 | Analyzed for anistropy | ||
| 10/25/76 | Slug | 20 | 74 | 3.7C | 0.01 | 4 | |||
| 10/25/76 | Slug | 20 | 1 | 0.05C | 1x10⁻³ | 4 | |||
| 10/26/76 | Slug | 20 | 165 | 8.3C | 2x10⁻⁴ | 4 | |||
| 10/26/76 | Slug | 20 | 106 | 5.3C | 1x10⁻⁴ | 4 | |||
| 10/26/76 | Slug | 20 | 5 | 0.25C | 1x10⁻⁴ | 4 | |||
| 10/26/76 | Slug | 20 | 12 | 0.60C | 1x10⁻³ | 4 | |||
| "Clinker" | |||||||||
| East Gillette Mine | 50/71 | 1/19/76 | Pump | 14 | --- | --- | --- | 4 | Pumped well in coal/ clinker |
| 14 | >8500 | >610C | ~0.16 | Obs. well in coal | |||||
| 15 | 200 | 13C | ~0.35 | Obs. well in coal | |||||
| 10/22/76 | Pump | --- | --- | --- | --- | 4 | Pumped well in coal | ||
| 104? | --- | --- | --- | Obs. well in clinker, no drawdown | |||||
| 104? | 974 | 9.4C | --- | Obs. well in clinker | |||||
| 100 | 361 | 3.6C | 7.8x10⁻⁴ | Obs. well in coal/clinker | |||||
| Wasatch Formation | |||||||||
| Highland Mine | 36/72 | --- | Core analysis | 23 | 516C | 22.5 | --- | 4 | |
| --- | do | 22 | 412C | 18.7 | --- | 4 | |||
| --- | do | 23 | 340C | 14.8 | --- | 4 | |||
| --- | do | 31 | 768C | 24.8 | --- | 4 | |||
| --- | do | 25 | 366C | 14.7 | --- | 4 | |||
| --- | do | 15 | 274C | 18.3 | --- | 4 | |||
| --- | do | 24 | 554C | 23.1 | --- | 4 | |||
| Belle Ayr Mine | 48/71 | --- | Pump & recovery | 100 | 6175 | 62C | 1.8x10⁻³ | 2 | |
| --- | do | 54 | 3495 | 65C | 5.4x10⁻³ | 2 | |||
| 10/6/76 | Slug | 20 | 93 | 4.7C | ~0.20 | 3 | |||
| 10/6/76 | Slug | 10 | 82 | 8.2C | ~0.04 | 3 | |||
| East Gillette Mine | 50/71 | 12/6/76 | Slug | 20 | 38 | 1.9C | 3x10⁻³ | 4 | Shaley zone tested |
| Date Sources: | 1 - Bergman and Marcus, 1976 2 - Davis, 1975 3 - Davis and Rechard, 1977 4 - Wyoming Department of Environmental Quality mine plan files 5 - Wyoming Water Development Commission files 6 - Lowry and Cummings, 1966 7 - Whitcomb and others, 1966 8 - Whitcomb and Morris, 1964 |
Table Source:
Feathers, K.R., Libra, R., Stephenson, T.R., and Eisen, C. 1981. Occurrence and characteristics of ground water in the Powder River Basin, Wyoming. Laramie, WY: University of Wyoming, Water Resources Research Institute. pp. 111-114.
Appendix C.5
Middle Tertiary Aquifer
Table C.5.1 Specific Capacities of Wells Completed in Middle Tertiary Aquifers of The Powder River
Structural Basin, Northeast Wyoming River Basins Plan Area, Wyoming
| Location | Completion Date |
Total Depth (ft) |
Test Duration (hrs) |
Yield (gpm) |
Drawdown (ft) |
Specific Capacity (gpm/ft) |
Remarks |
| CONVERSE COUNTY | |||||||
| 34/67-8 | 7/-/62 | 415 | 3 | 10 | 75 | 0.13 | Flowing well |
| NIOBRARA COUNTY | |||||||
| 32/64-13 ac | -/-/47 | 122 | 24 | 30 | --- | --- | "Zero" draw-down |
| 32/64-13 ac | -/-/- | 145 | 24 | 200 | 41 | 4.9 | |
| 32/64-13 bd | -/-/80 | 100 | 48 | 20 | 10 | 2.0 | |
| 32/64-14 db | 8/26/77 | 140 | 6 | 25 | 40 | 0.62 | |
| 32/64-18 bd | -/-/- | 78 | 36 | 135 | --- | --- | Drawdown: "none" |
| 32/64-18 bd | -/-/49 | 110 | ? | 1000 | 14 | 71. | Whitcomb (1965) |
| 32/64-24 da | -/-/55 | 59 | ? | 650 | 2.8 | 232. | Whitcomb(1965) |
| 32/65-1 bc | -/-/- | 200 | ? | 125 | 4 | 31. | Whitcomb(1965) |
| 32/65-1 cb | -/-/50 | 108 | ? | 350 | 14 | 25. | Whitcomb (1965) |
| 32/65-13 ac | -/-/- | 260 | 12 | 90 | 10 | 9.0 | |
| 32/65-13 ac | -/-/- | 70 | 1 | 30 | --- | --- | "Total" draw-down |
| 33/65-17 dc | -/-/59 | 225 | ? | 5 | 20 | 0.25 | Whitcomb (1965) |
| 33/66-17 da | 12/18/59 | 100 | 2 | 40 | --- | --- | "Zero" drawdown |
| 33/67-25 ab | 11/10/74 | 268 | 1 | 9 | ? | --- | |
| 34/63-26 ca | -/-/- | 150 | ? | 7 | 15 | 0.47 | Whitcomb (1965) |
| 34/64-9 ac | -/-/52 | 100 | ? | 6 | 4 | 1.5 | Whitcomb (1965) |
| 34/64-9 db | 11/8/47 | 130 | 12 | 10 | 40 | 0.25 | |
| 34/66-25 db | 2/23/67 | 85 | 120 | 25 | 2 | 12.5 | |
| 35/65-28 dd | 5/29/77 | 98 | 0.25 | 10 | 60 | 0.17 | |
Data Source: Data from Wyoming State Engineer's Office permit files unless otherwise specified under "Remarks."
Table Source:
Feathers, K.R., Libra, R., Stephenson, T.R., and Eisen, C. 1981. Occurrence and characteristics of ground water in the Powder River basin, Wyoming. Laramie, WY: University of Wyoming, Water Resources Research Institute. pp. 120-122.