Wyoming State Water Plan
Wyoming State Water Plan
Wyoming Water Development Office
6920 Yellowtail Rd
Cheyenne, WY 82002
Phone: 307-777-7626

Wyoming Water Development Office
6920 Yellowtail Rd
Cheyenne, WY 82002
Phone: 307-777-7626


A. Overview
This chapter describes and quantifies the current water uses in the Northeast Wyoming River Basins planning area. The quantification of current water consumption is used to evaluate the overall use of water in the Basin relative to Compact allotments, for comparing existing water use to existing water supplies, and as a basis for projecting future water demands by the various uses.
As with all chapters in this final plan report, explicit lists of references are not provided. Instead, all references to reports, maps, and personal communications are provided in the Technical Memoranda prepared for each category of water use. The reader is referred to the following technical memoranda for a more detailed description of each topic as well as the list of references:
B. Agricultural Water UseIntroduction
Irrigated agriculture in the planning area is primarily associated with forage production for the livestock industry. Ranchers depend on irrigated cropland to provide winter feed and summer grazing for a successful ranching enterprise. Early in Wyoming's history, ranchers had discovered that successful farming required irrigation. By the 1890's, many ranchers were taking advantage of cheap irrigation of bottomlands along the small tributary streams, but most of the water from the larger streams was being carried unused into other states. As the direct flow supply of the streams became fully appropriated, reservoirs were constructed, where suitable sites could be found, to store spring runoff for late-season irrigation uses. One of the most significant of these to the planning area is Keyhole Reservoir with and active capacity of roughly 190,000 acre-feet. This reservoir which was completed in 1952 provides supplemental storage for irrigated lands predominately located in South Dakota. Ten percent of the reservoir capacity, however, is reserved for the Crook County Irrigation District and Shattuck Hills in Wyoming in accordance with the Belle Fourche River Compact. There are a total of 6 significant storage facilities in the Northeast Wyoming River Basins planning area with capacities in excess of roughly 1000 acre-feet as well as many smaller facilities, allowing for expanded irrigation use of the natural flows in the planning area.
According to the 1972 Framework Water Plan, well over 80 percent of the water consumed by man's activities in the Northeastern corner of Wyoming is used for irrigation. An accurate estimate of current agricultural water use is, therefore central to a comprehensive water use inventory. Estimates of water use by agriculture can generally be divided into the following three components:
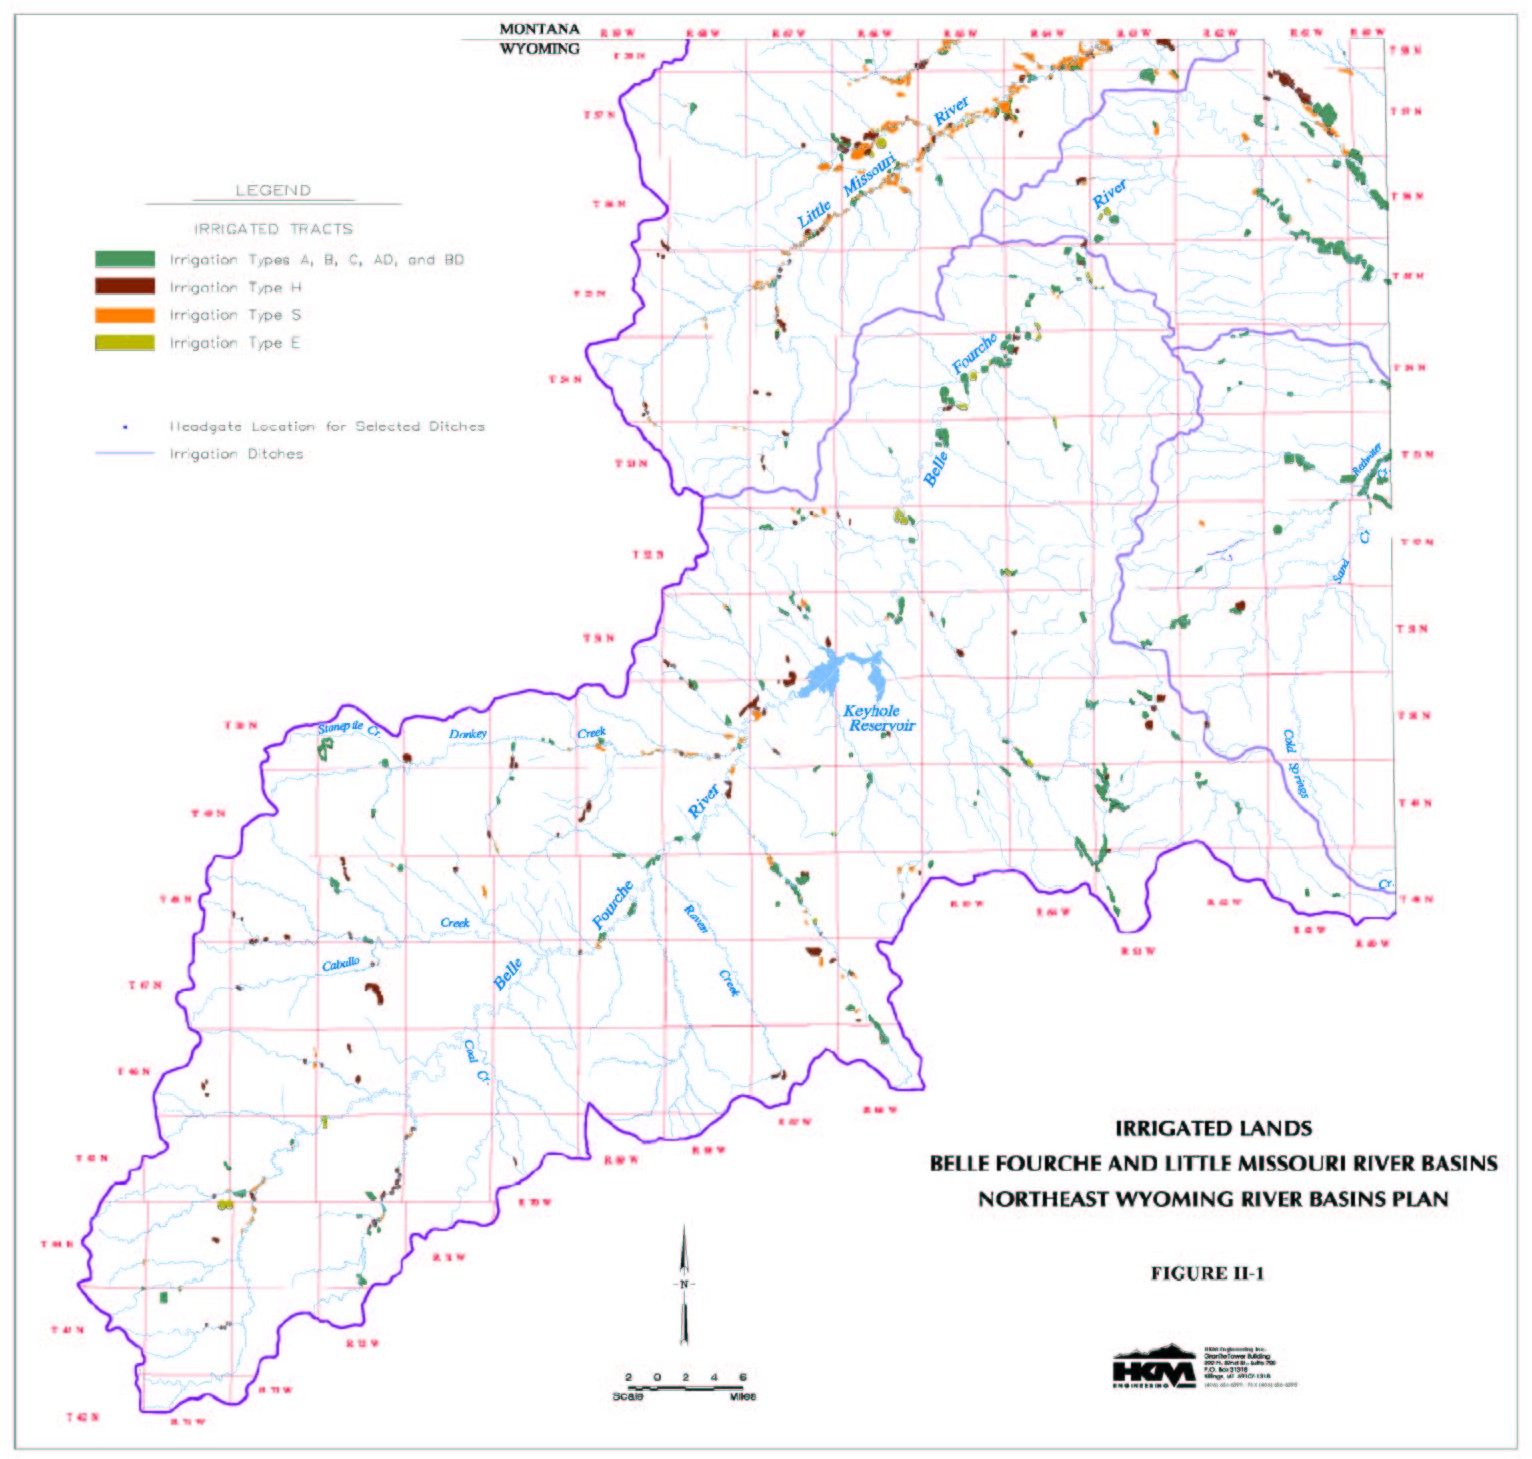
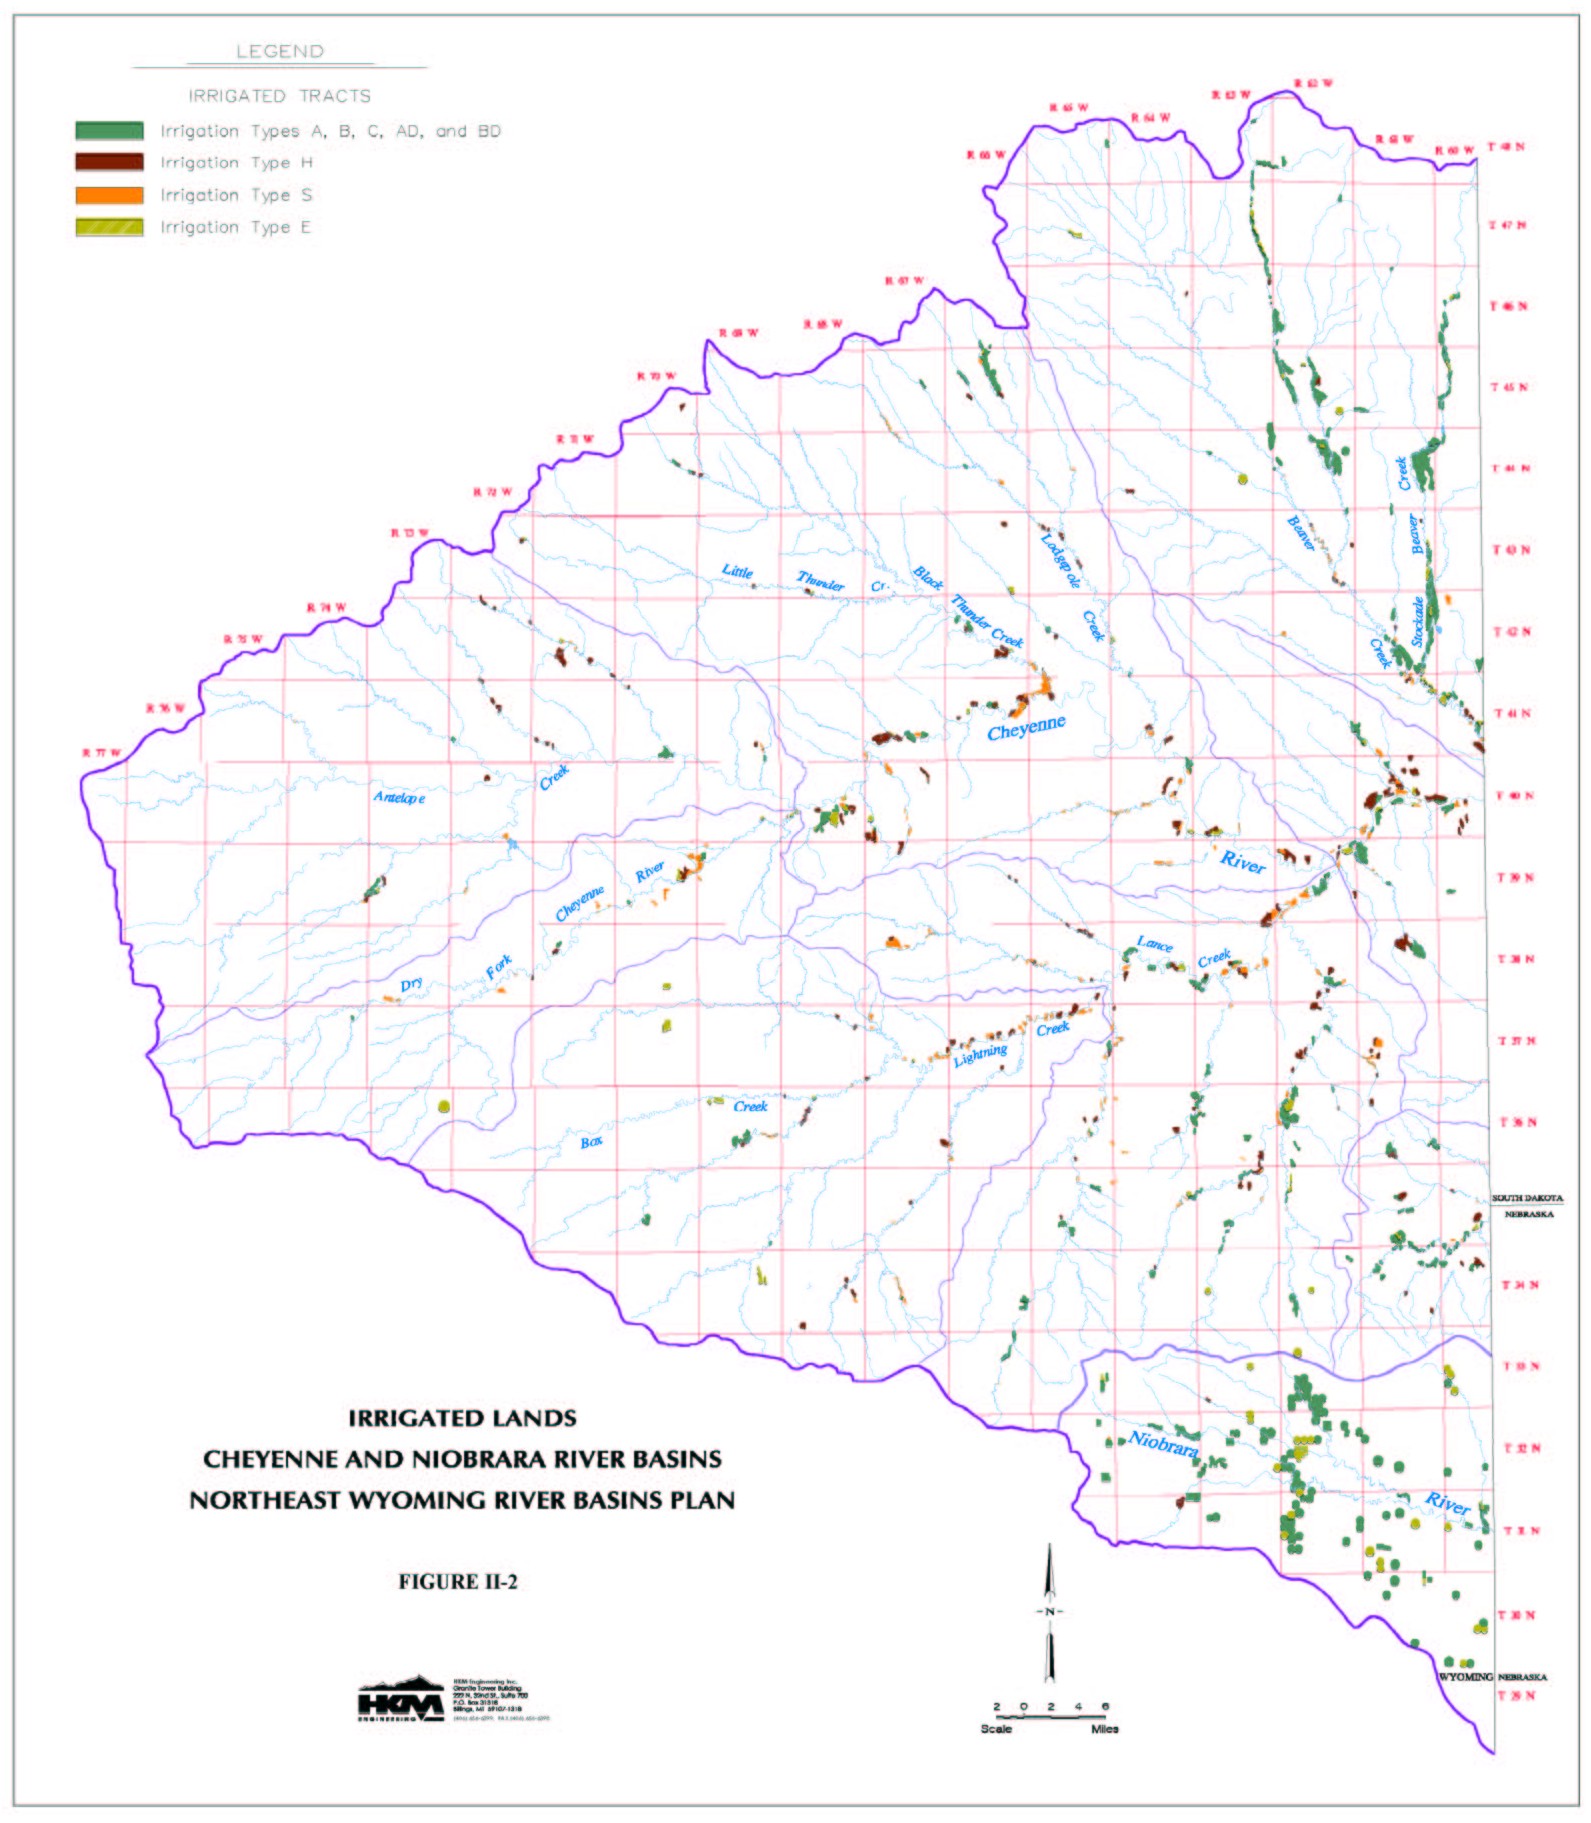
A 1:24,000 scale Geographic Information System (GIS) data theme was developed to represent the spatial extent and character of irrigated lands throughout the planning area. The most current (1994 to 1996) stereo aerial photography was used as the primary basis for mapping the irrigated lands. In addition to the 1994/1996 stereo aerial photography, 1983 Color Infrared (CIR) aerial photography available for portions of the planning area was utilized to verify the limits of irrigation. The Tabulation of Adjudication Surface Water Rights of the State of Wyoming, ditch plat maps, and irrigation wells data obtained from the State Engineer's Office were utilized to further double-check areas of prospective irrigation. The mapping was provided to the SEO Division 2 field personnel for further verification. All man induced irrigation or subirrigation was delineated and irrigated lands were divided into the following categories:
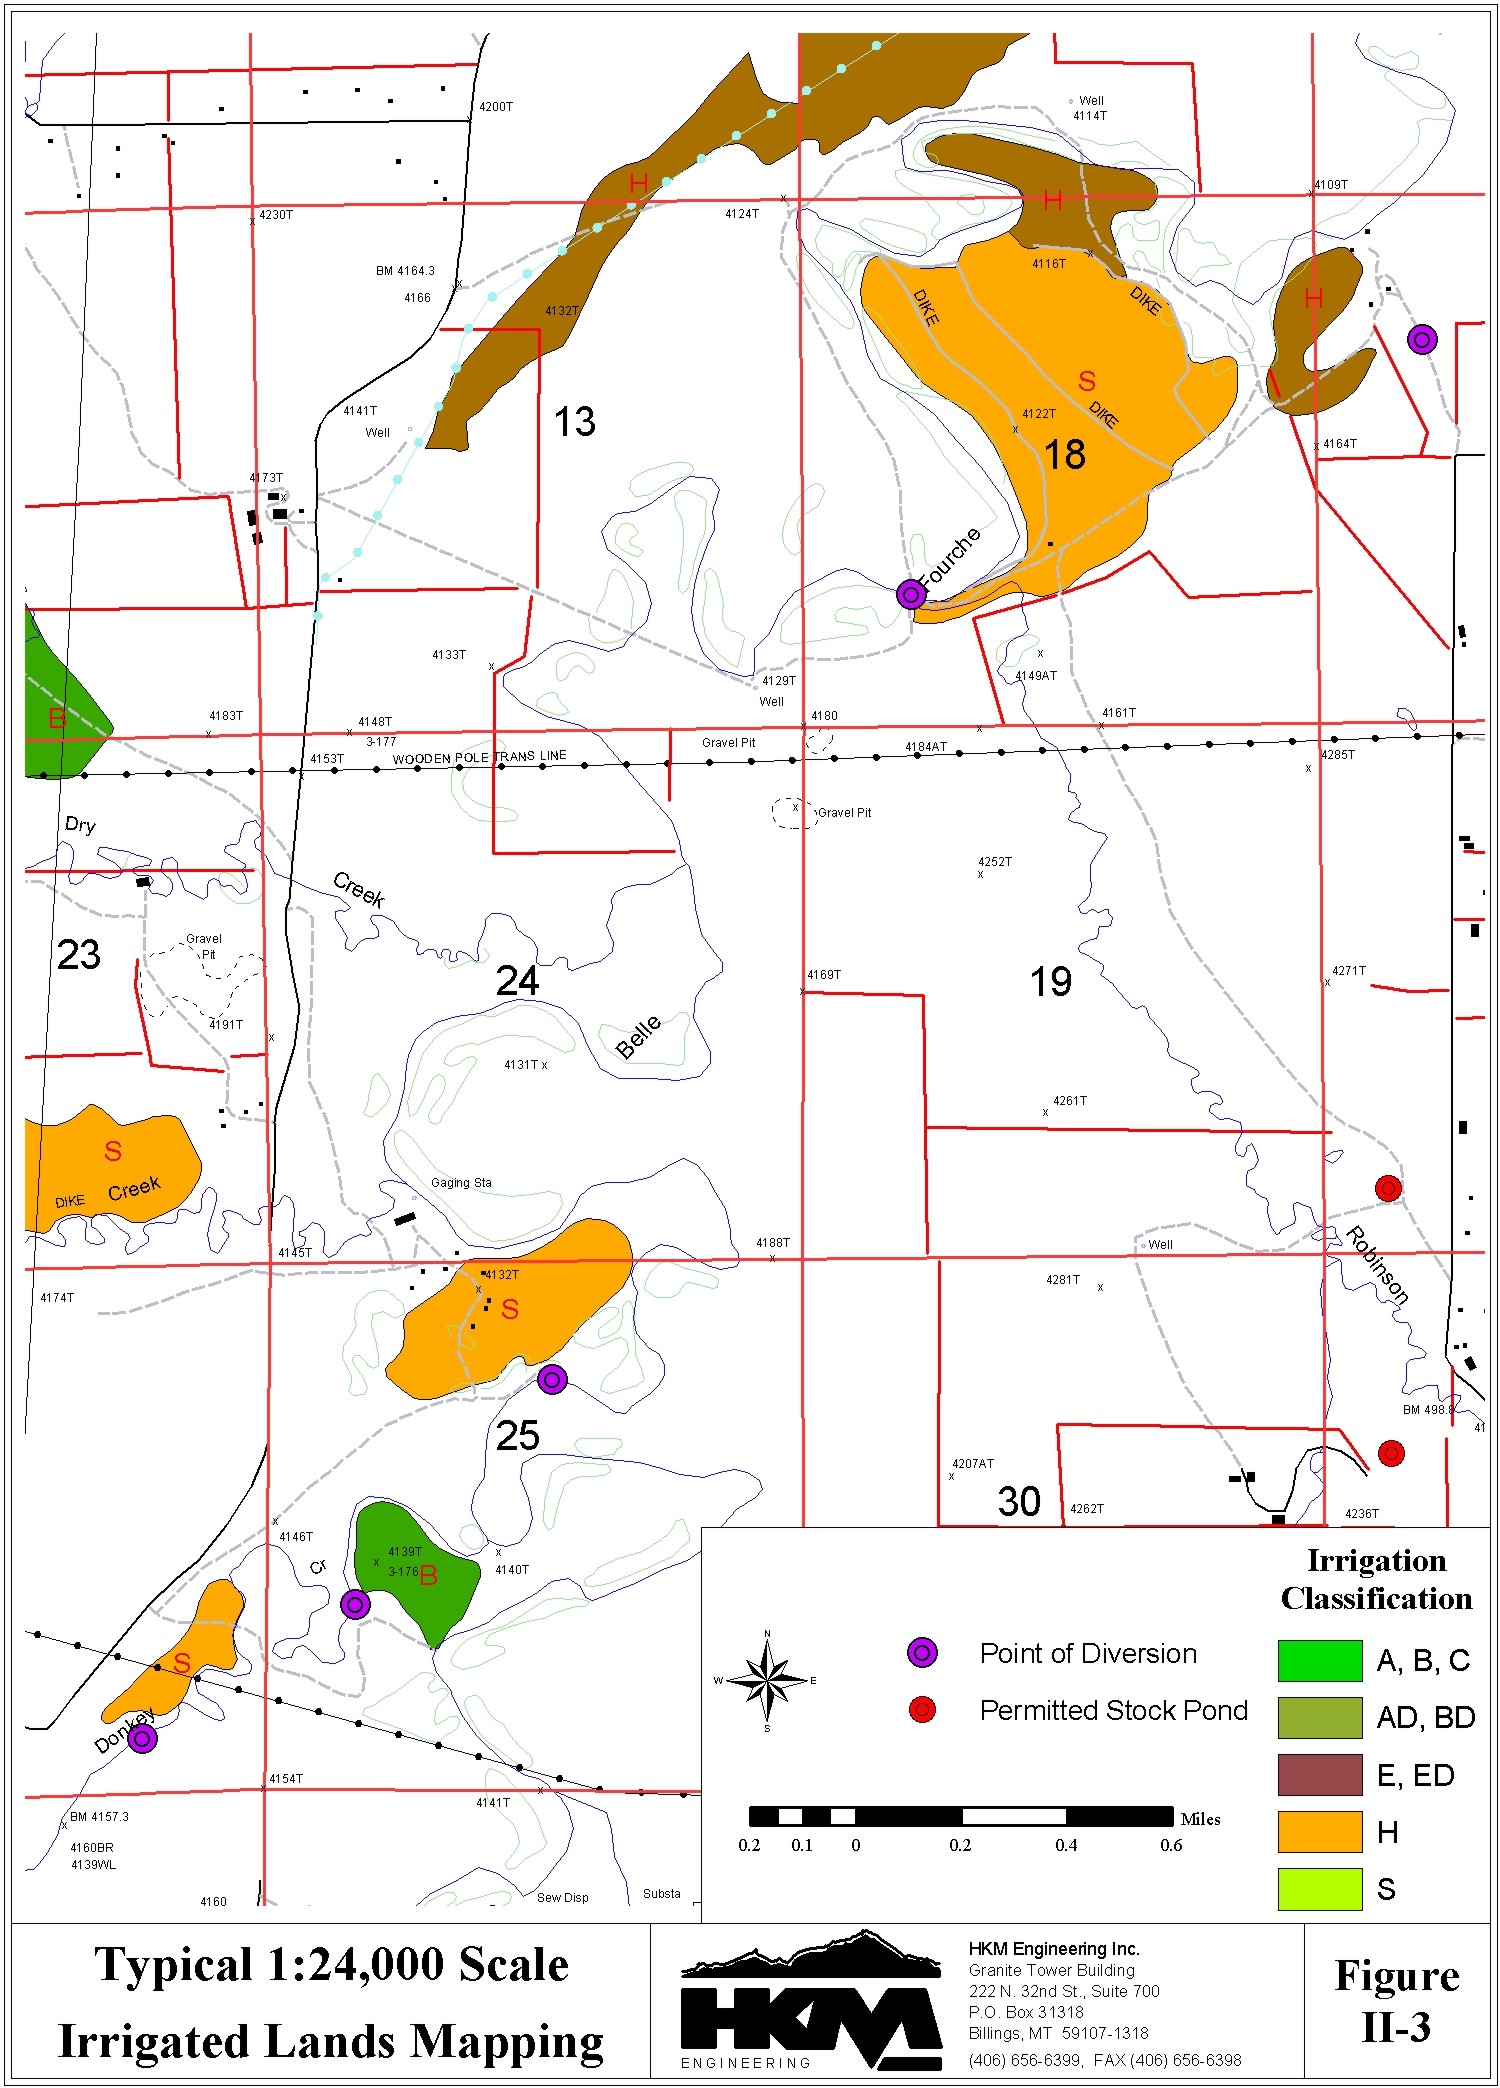
A - Full service irrigation (typically receives a full water supply);The irrigated lands were grouped together into Service Areas, defined as lands served by a common supply ditch or pump. A Point of Diversion GIS data theme was developed to identify the point of diversion for lands served within each service area. Vectorized digital base mapping developed from USGS quadrangle maps was obtained for this Basin Plan to provide perspective in the areas of irrigation.
B - Partial service irrigation (typically receives a reduced water supply due to limited water availability or the inability to provide complete field coverage);
C - Man induced subirrigation (beneficial use resulting from incidental irrigation such as ditch seepage to areas below a canal);
E - Idle irrigation (lands not currently receiving water, typically due to nonfunctional delivery facilities);
S - Spreader dike irrigation (dikes constructed across ephemeral streams to spread infrequent flows over the land to increase beneficial use);
H - Minor beneficial use, (lands that receive some beneficial use on occasion such as lands served by "kick-out" ditches on ephemeral streams).
AD, BD, and ED . A, B, or E lands that have underwent or are currently undergoing residential development.
A database of the water rights associated with the mapped irrigation was also developed. This database, when linked to the irrigated lands polygons through the Geographic Information System (GIS), allows for identification of the water rights attached to the polygons of irrigated land.
For a more detailed description of the attributes provided for the Irrigated Lands and Point of Diversion spatial data themes and the Water Rights tabular database, as well as the digital base maps and other associated data themes, see the "Irrigated Lands and Water Rights Data" technical memorandum.
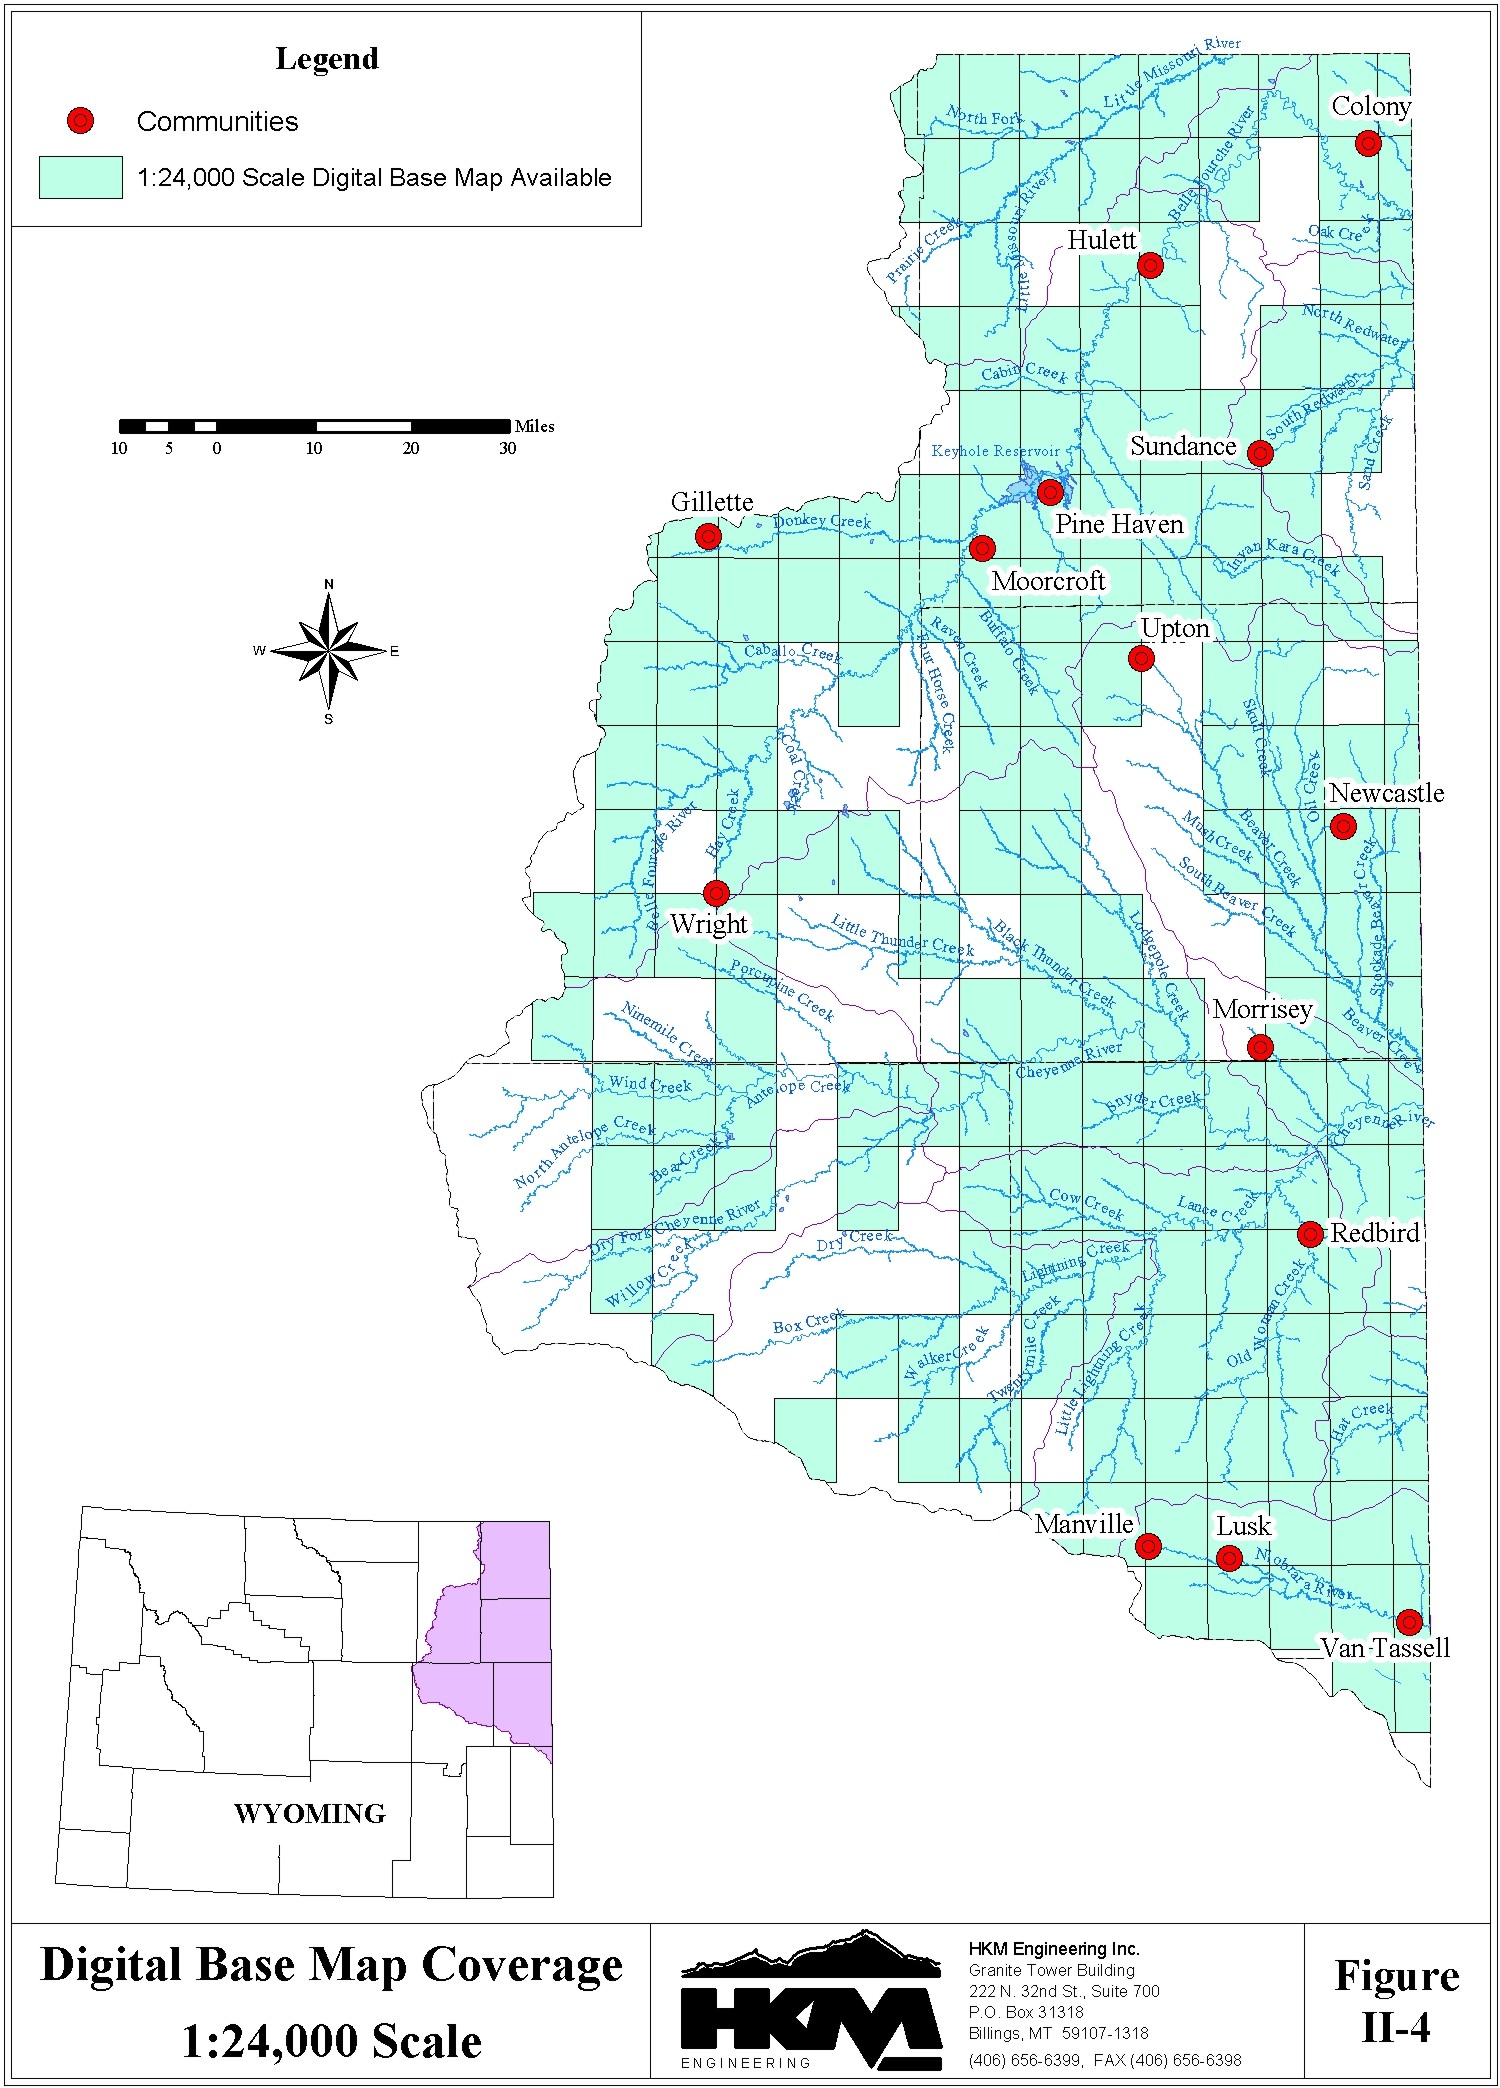
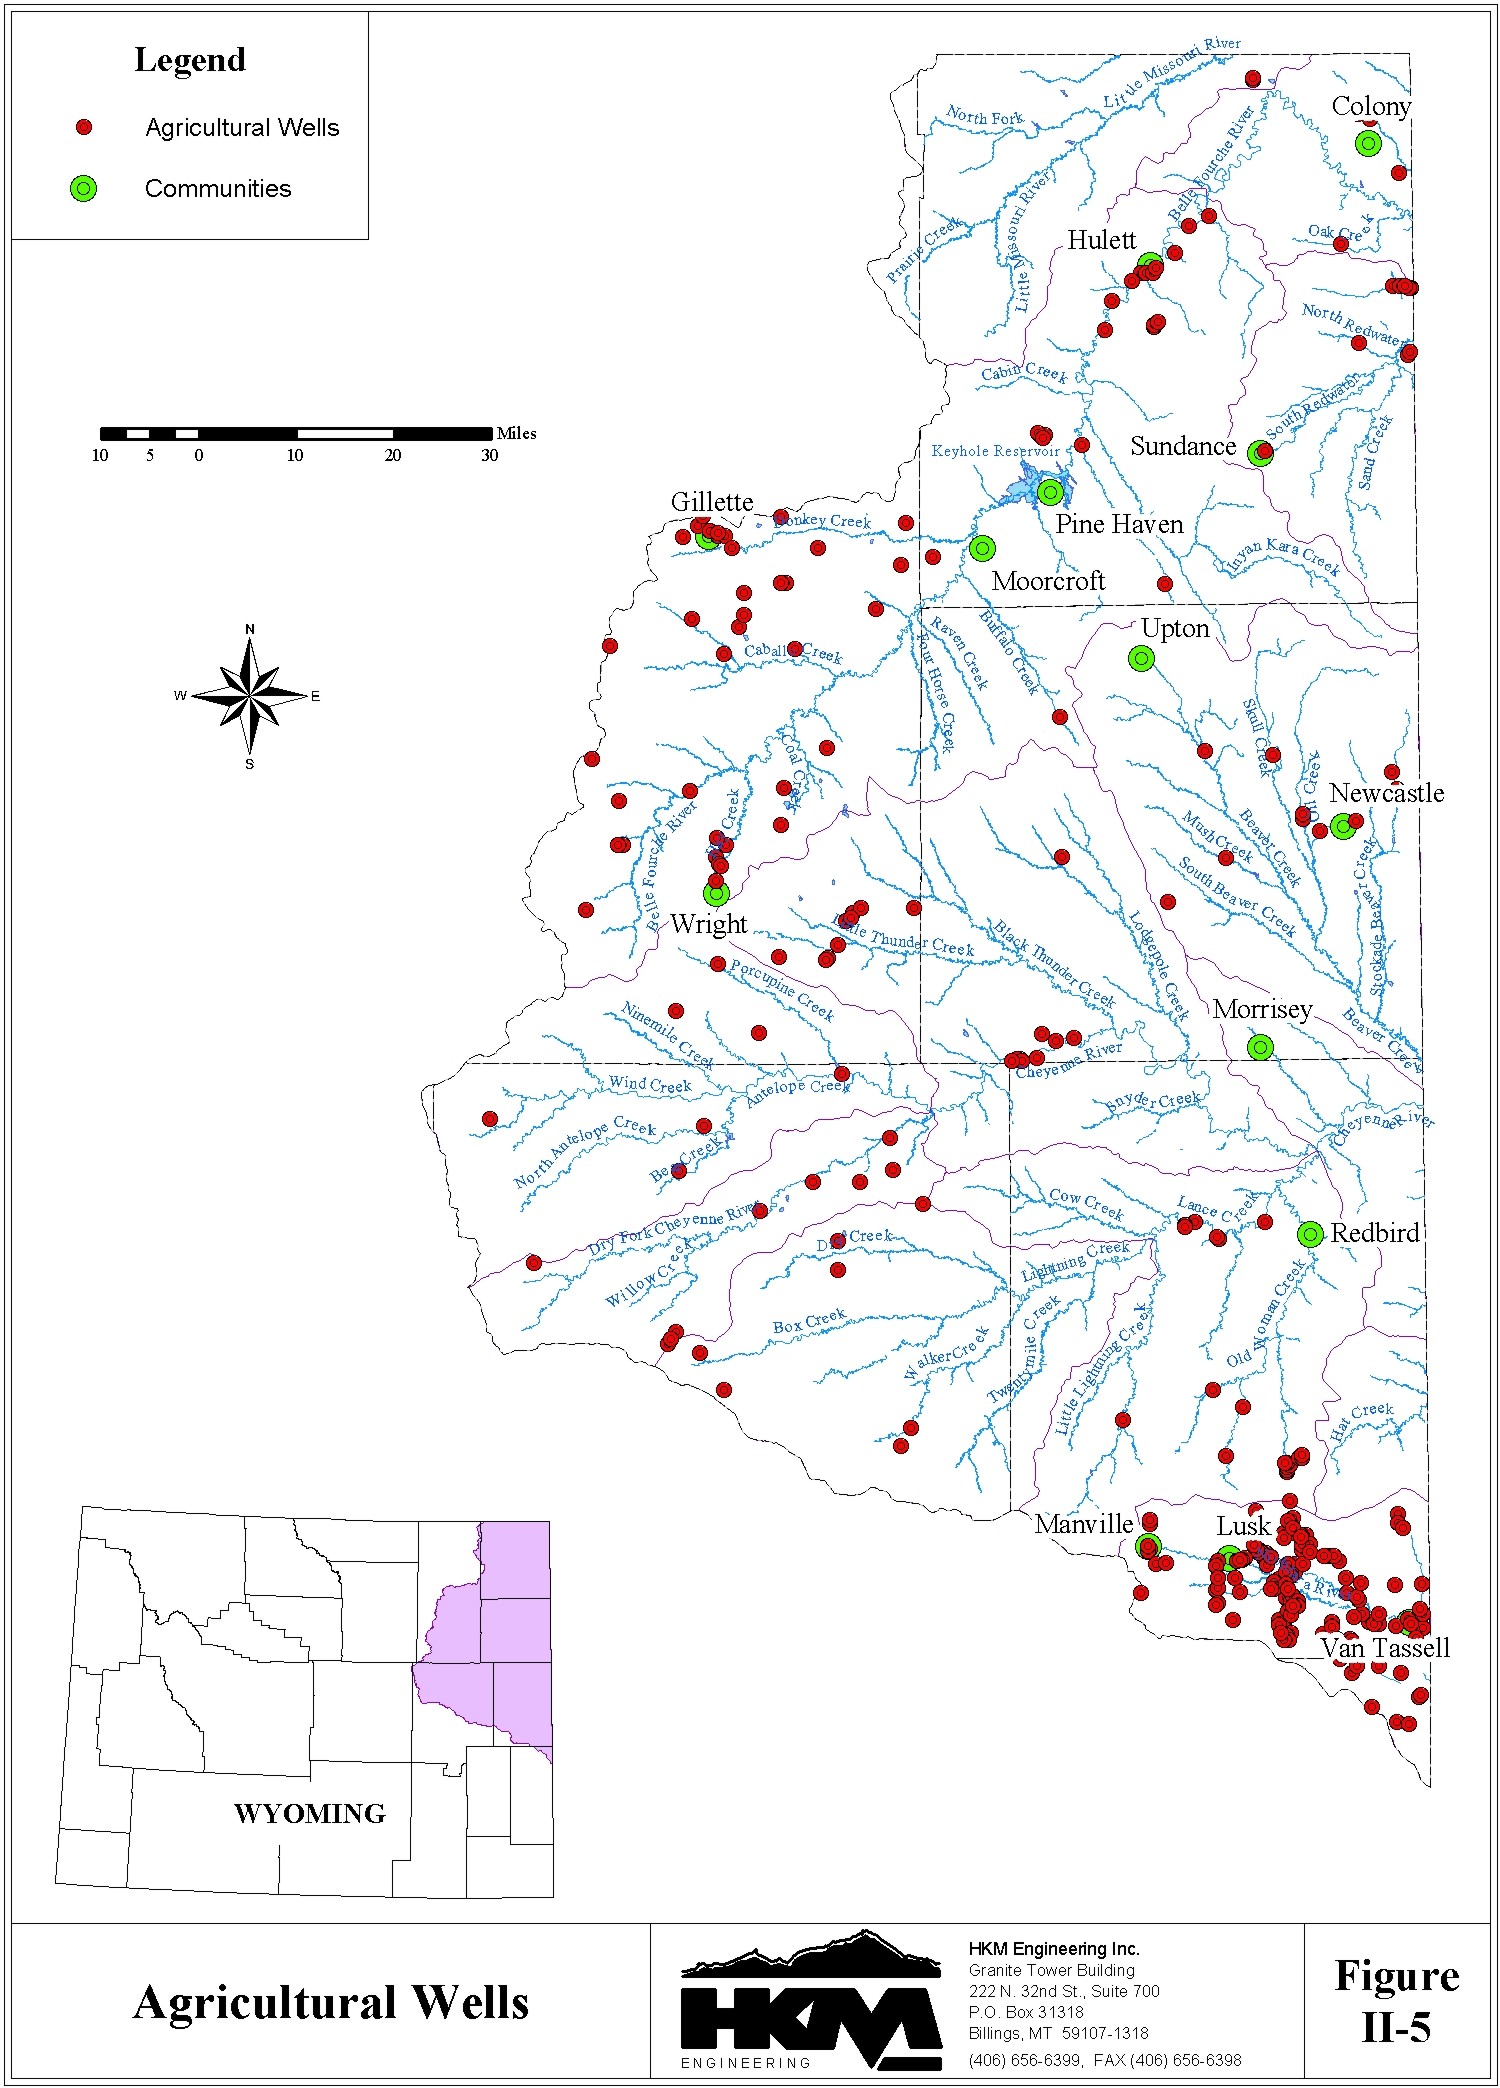
The extent of irrigated land within the planning area is shown on Figures II-1 and II-2. A typical area of irrigated lands mapping is illustrated on Figure II-3. The extent of the digital base map coverage is shown on Figure II-4 and the Agricultural Wells with yields of at least 50 gpm are shown on Figure II-5.
A summary of the quantity of irrigated lands is provided on Tables II-1 and II-2 and on Figure II- 6.
Table II-1
Summary of Irrigated Lands by Irrigation Classification (acres)
| SUBBASIN NAME |
HUC | IRRIGATION CLASSIFICATION | ||||||||||||||
| A | B | C | AB | AC | BC | ABC | TOTAL ABC |
AD | BD | TOTAL AD, BD |
S | H | E | TOTAL | ||
| Upper Little Missouri | 10110201 | 49 | 1,434 | 14 | 106 | 0 | 0 | 0 | 1,603 | 0 | 0 | 0 | 6,712 | 1,486 | 339 | 10,140 |
| Upper Belle Fourche | 10120201 | 2,631 | 4,316 | 8 | 242 | 241 | 0 | 0 | 7,438 | 364 | 39 | 403 | 2,039 | 2,921 | 1,267 | 14,068 |
| Lower Belle Fourche | 10120202 | 2,502 | 989 | 0 | 592 | 0 | 0 | 0 | 4,083 | 0 | 0 | 0 | 883 | 803 | 131 | 5,900 |
| Redwater Creek | 10120203 | 1,405 | 713 | 0 | 0 | 0 | 0 | 0 | 2,118 | 15 | 28 | 43 | 51 | 153 | 12 | 2,377 |
| Upper Cheyenne | 10120103 | 18 | 1,959 | 0 | 0 | 0 | 0 | 0 | 1,977 | 0 | 0 | 0 | 2,194 | 2,187 | 914 | 7,272 |
| Antelope Creek | 10120101 | 0 | 427 | 0 | 0 | 0 | 0 | 0 | 427 | 0 | 0 | 0 | 196 | 576 | 51 | 1,250 |
| Beaver Creek | 10120107 | 396 | 5,739 | 43 | 1,716 | 0 | 320 | 140 | 8,354 | 0 | 1,110 | 1,110 | 508 | 402 | 1,175 | 11,549 |
| Hat Creek | 10120108 | 0 | 1,442 | 0 | 0 | 0 | 0 | 0 | 1,442 | 0 | 0 | 0 | 46 | 381 | 72 | 1,941 |
| Lance Creek | 10120104 | 643 | 2,870 | 43 | 0 | 0 | 0 | 0 | 3,556 | 0 | 0 | 0 | 2,308 | 1,397 | 801 | 8,062 |
| Lightning Creek | 10120105 | 0 | 393 | 0 | 0 | 0 | 0 | 0 | 393 | 0 | 0 | 0 | 1,096 | 722 | 643 | 2,854 |
| Dry Fork Cheyenne | 10120102 | 0 | 119 | 0 | 0 | 0 | 0 | 0 | 119 | 0 | 0 | 0 | 763 | 132 | 454 | 1,468 |
| Angostura Reservoir | 10120106 | 0 | 1,773 | 0 | 0 | 0 | 0 | 0 | 1,773 | 0 | 0 | 0 | 688 | 1,455 | 288 | 4,204 |
| Niobrara Headwaters | 10150002 | 11,147 | 911 | 4 | 0 | 101 | 0 | 0 | 12,163 | 0 | 80 | 80 | 12 | 158 | 3,384 | 15,797 |
| TOTAL | 18,791 | 23,085 | 112 | 2,656 | 342 | 320 | 140 | 45,446 | 379 | 1,257 | 1,636 | 17,496 | 12,773 | 9,531 | 86,882 | |
Table II-2
Summary of Irrigated Lands by Primary Source of Supply (acres)
| Subbasin Name | HUC | Primary Source of Water Supply | ||
| Ground Water | Surface Water | Total | ||
| Upper Little Missouri | 10110201 | 0 | 10,140 | 10,140 |
| Upper Belle Fourche | 10120201 | 930 | 13,138 | 14,068 |
| Lower Belle Fourche | 10120202 | 186 | 5,714 | 5,900 |
| Redwater Creek | 10120203 | 164 | 2,213 | 2,377 |
| Upper Cheyenne | 10120103 | 127 | 7,145 | 7,272 |
| Antelope Creek | 10120101 | 0 | 1,250 | 1,250 |
| Beaver Creek | 10120107 | 273 | 11,276 | 11,549 |
| Hat Creek | 10120108 | 0 | 1,941 | 1,941 |
| Lance Creek | 10120104 | 667 | 7,395 | 8,062 |
| Lightning Creek | 10120105 | 469 | 2,385 | 2,854 |
| Dry Fork Cheyenne | 10120102 | 32 | 1,436 | 1,468 |
| Angostura Reservoir | 10120106 | 0 | 4,204 | 4,204 |
| Niobrara Headwaters | 10150002 | 14,950 | 847 | 15,797 |
| TOTAL | 17,798 | 69,084 | 86,882 | |
Figure II-6
Acreage of Irrigated Land by Irrigation Classification
click to enlarge
Irrigated Crops
Irrigated agriculture in the planning area is primarily associated with forage production for the livestock industry. Ranchers depend on irrigated cropland to provide winter feed and summer grazing for their stock. Alfalfa, grass hay, and pasture grass are the dominant crops grown in the planning area. Lesser amounts of small grains and corn are also produced.
Stereo aerial photography was used as a primary basis for determining the types of crop grown in the various portions of the planning area. A visual assessment of the condition of the fields and the foliage density was used as a primary means of distinguishing between alfalfa and grass hay or pasture. Row crops such as grain crops or corn were more easily distinguished visually although they were of much more limited extent. Crop distributions from County Agricultural Statistics were used as an additional crosscheck of the results.
The resulting distribution of irrigated crops is summarized in Table II-3 by Hydrologic Unit Code (HUC4) subbasin.
Table II-3
Summary of Irrigated Crops (acres)
| Subbasin Name | HUC | Acreage | Total Active |
% of Active irrigated Acres | ||||||||
| Alfalfa | Grass | Grain | Corn | Idle | Total | Alfalfa | Grass | Grain | Corn | |||
| Upper Little Missouri | 10110201 | 0 | 9,801 | 0 | 0 | 339 | 10,140 | 9,801 | 0 | 100 | 0 | 0 |
| Upper Belle Fourche | 10120201 | 1,174 | 11,385 | 170 | 71 | 1,267 | 14,067 | 12,800 | 9 | 89 | 1 | 1 |
| Lower Belle Fourche | 10120202 | 2,633 | 2,598 | 381 | 159 | 131 | 5,902 | 5,771 | 46 | 45 | 7 | 2 |
| Redwater Creek | 10120203 | 1,292 | 807 | 187 | 78 | 12 | 2,376 | 2,364 | 55 | 34 | 8 | 3 |
| Upper Cheyenne | 10120103 | 0 | 6,357 | 0 | 0 | 914 | 7,271 | 6,357 | 0 | 100 | 0 | 0 |
| Antelope Creek | 10120101 | 0 | 1,199 | 0 | 0 | 51 | 1,250 | 1,199 | 0 | 100 | 0 | 0 |
| Beaver Creek | 10120107 | 3,092 | 6,648 | 447 | 186 | 1,175 | 11,548 | 10,373 | 30 | 64 | 4 | 2 |
| Hat Creek | 10120108 | 0 | 1,869 | 0 | 0 | 72 | 1,941 | 1,869 | 0 | 100 | 0 | 0 |
| Lance Creek | 10120104 | 790 | 6,309 | 114 | 48 | 801 | 8,062 | 7,261 | 11 | 87 | 1 | 1 |
| Lightning Creek | 10120105 | 0 | 2,211 | 0 | 0 | 643 | 2,854 | 2,211 | 0 | 100 | 0 | 0 |
| Dry Fork Cheyenne | 10120102 | 0 | 1,014 | 0 | 0 | 454 | 1,468 | 1,014 | 0 | 100 | 0 | 0 |
| Angostura Reservoir | 10120106 | 877 | 2,860 | 127 | 53 | 288 | 4,205 | 3,917 | 22 | 73 | 3 | 2 |
| Niobrara Headwaters | 10150002 | 10,795 | 146 | 1,472 | 0 | 3,384 | 15,797 | 12,413 | 87 | 1 | 12 | 0 |
| TOTAL | 20,653 | 53,204 | 2,898 | 595 | 9,531 | 86,881 | 77,350 | 26 | 69 | 4 | 1 | |
The results are shown graphically on Figure II-7.
Figure II-7
Acreage of Irrigated Land by Crop
click to enlarge
Irrigation Water Consumption
The depletion of water by irrigation is primarily dependent on the number of acres irrigated, the crop water demands, and the amount of water available to meet these demands.
Total crop water demands are dependent on the consumptive use of the crop. The crop consumptive use requirement is the maximum water use of a well-watered crop under optimum growing conditions. A portion of the total annual rainfall is available to meet this consumptive use requirement. Effective precipitation is defined as that part of the total rainfall during the growing season, which is available to meet the consumptive water requirements of the crops. The remaining consumptive use requirement, unmet by natural rainfall, is referred to as the Consumptive Irrigation Requirement (CIR).
Knowing the number of acres of irrigation within a Service Area (a grouping of lands served by a common supply ditch), the types of crops grown, and the climatic conditions, estimates of the theoretical maximum diversions can be made for all of the irrigated lands throughout the basin. In practice however, actual diversions commonly fall short of the amount necessary to meet the full CIR of the crops (the "theoretical maximum diversion requirement"). This is especially true with flood-irrigated, forage crops. Actual conditions seldom represent the optimum conditions necessary to achieve maximum water consumption.
The methodology used in the current planning effort to estimate irrigation depletions relies on records of actual irrigation diversions in Northeastern Wyoming. Unfortunately, there is very little available data on historical diversions within the limits of the planning area. Diversion records are available only for the Murray Ditch on Redwater Creek and much of this irrigation is located in South Dakota, outside the limits of this planning study. Lacking information specific to the planning area, the relationships between actual irrigation diversions and theoretical maximum diversions based on diversion records for the adjacent Powder/Tongue River Basin planning area are used.
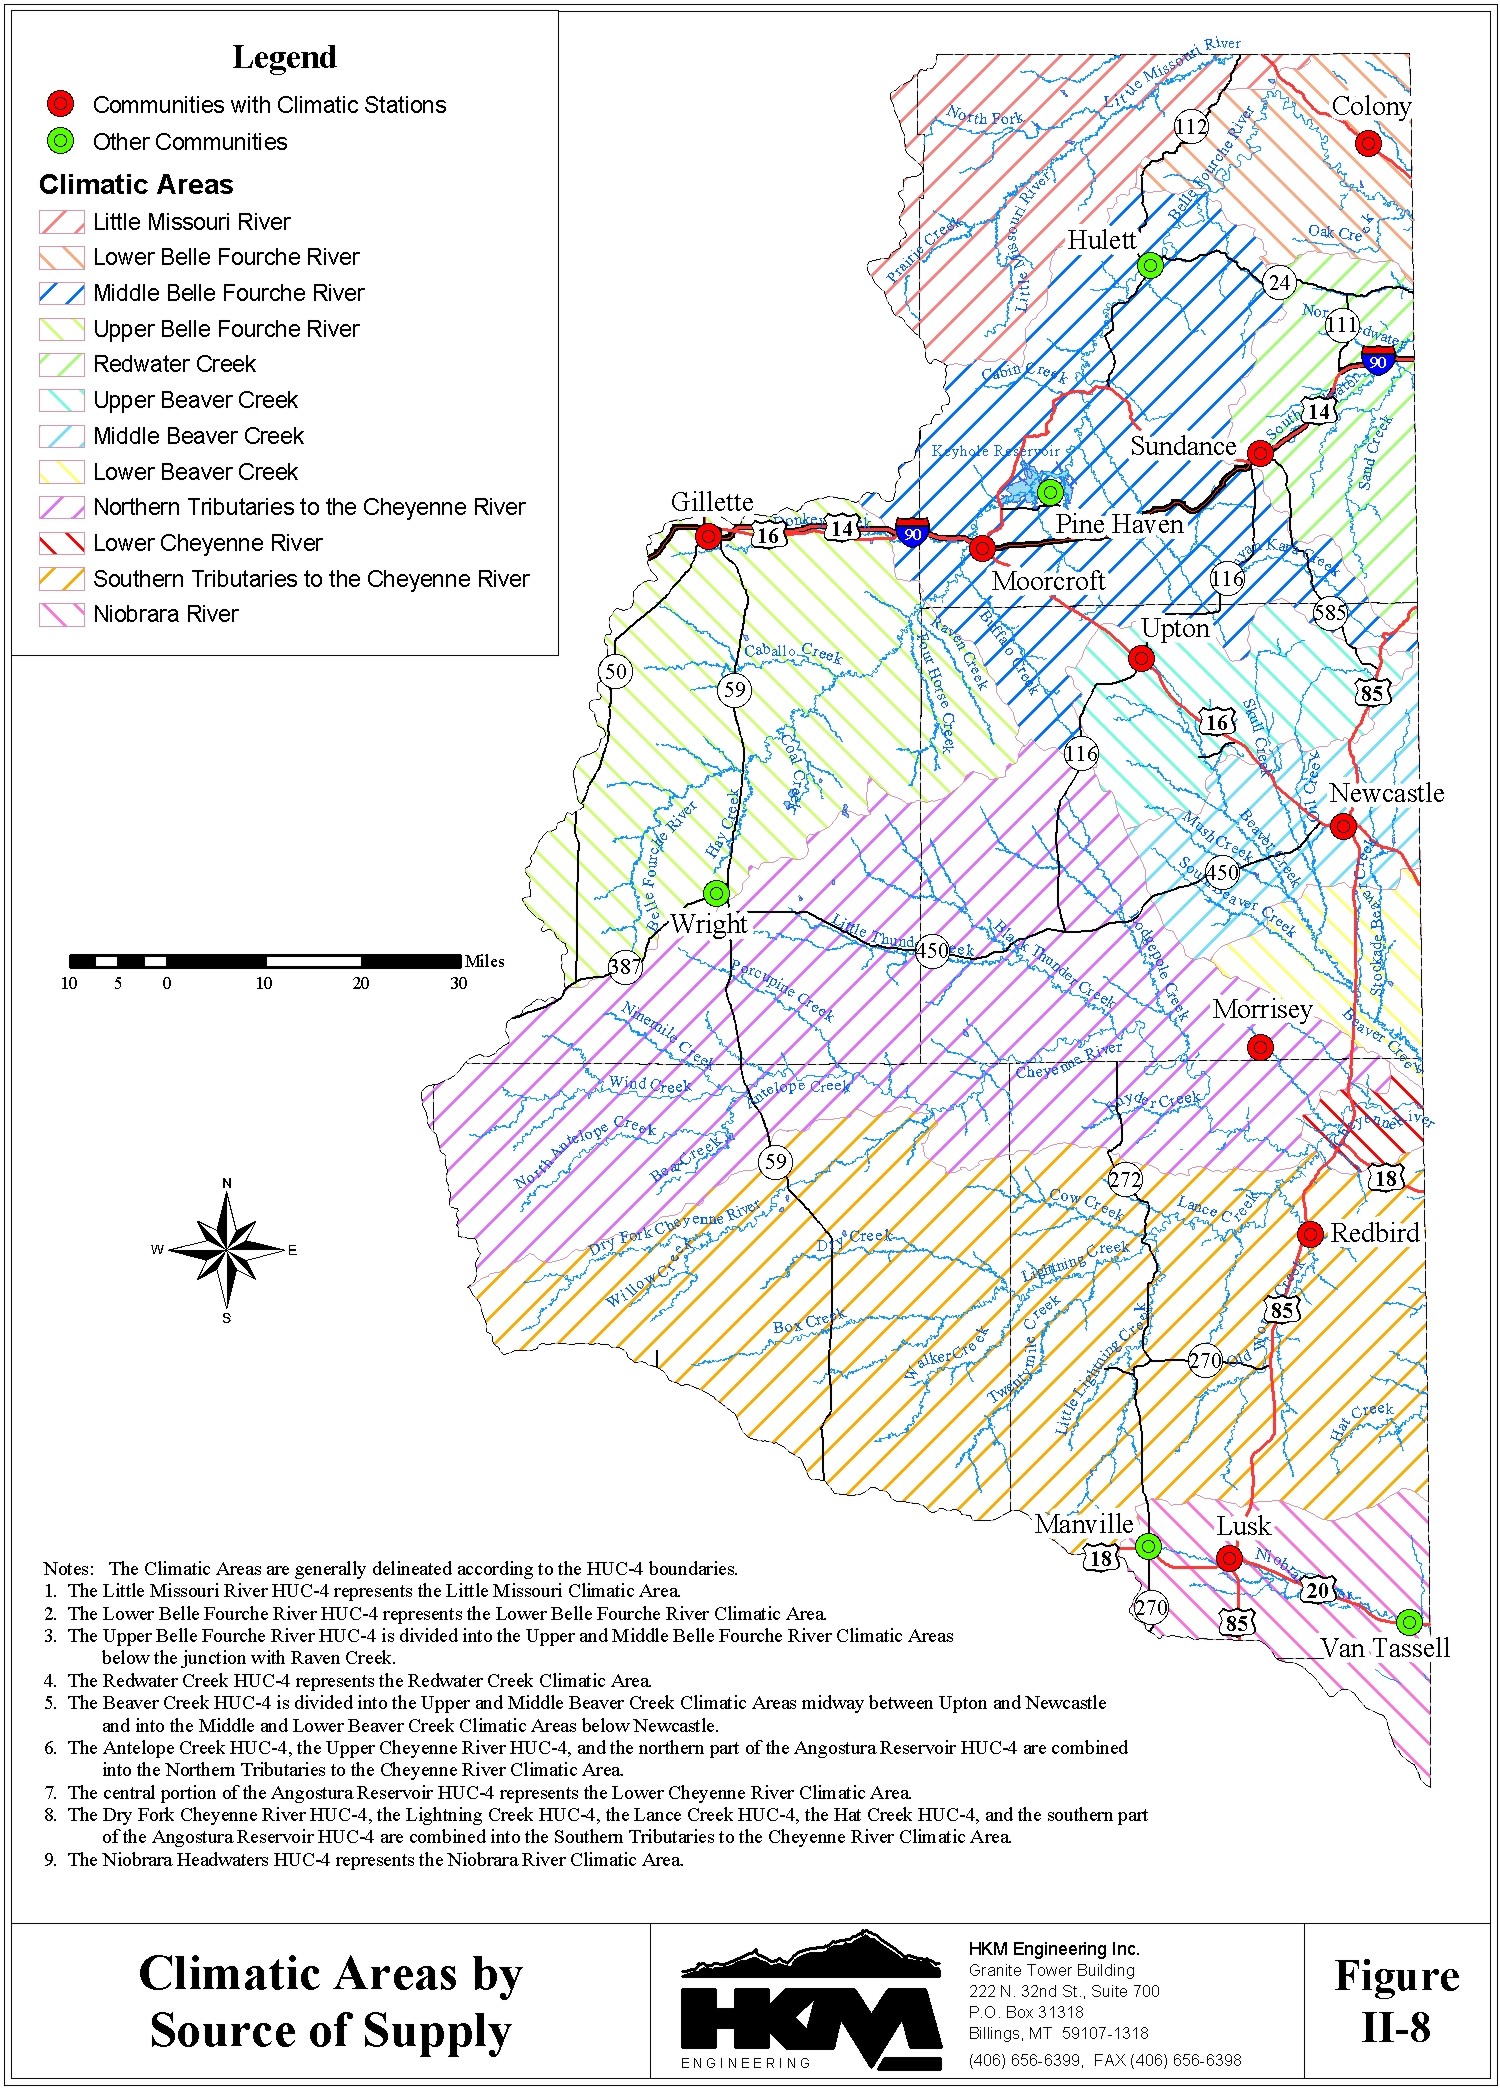
Comparisons were made between actual historic diversions for 70 key irrigation ditches and the theoretical maximum diversion to the lands served by these ditches (Service Areas) for the neighboring Powder/Tongue River Basin. The relationships developed allow for estimation of actual diversions and depletions where records are unavailable. According to these relationships, the average proportion of actual historic diversions to theoretical maximum diversions is at a maximum in wet years (73 %), is somewhat lower in normal years (71 %), and is considerably lower in dry years (56 %). The climatic areas used in calculating the CIR and corresponding Theoretical Maximum Diversion Requirement for the Northeast Wyoming River Basins planning area are shown on Figure II-8.
Not all of the water diverted for irrigation goes to meeting the crop water demands, in fact, the crop water consumption often times represents only a minor portion of the total diversion amount. A significant portion of the diverted flow is lost to seepage from the main conveyance ditch, lateral ditches, and field ditches, headgate leakage, ditch tailwater waste, field wastewater, and deep percolation past the crop root zone. Much of this "water loss" ultimately returns back to stream system for reuse downstream. That portion of the estimated actual diversion volume that is consumed by the crop is defined here as the estimated actual depletion. The estimated actual depletions for wet, normal, and dry years total 88,500 acre-feet, 86,300 acre-feet, and 76,500 acre-feet respectively. The estimated actual surface water depletions and ground water depletions are summarized respectively in Tables II-4 and II-5 by climatic area. The same information is summarized by drainage basin in Tables II-6 and II-7 respectively.
Table II-4
Estimated Actual Surface Water Depletions (Acre-Feet)
| Source of Supply |
Climate Stations1 |
Active Irrigation (Acres) |
Hydrologic Condition |
Jan | Feb | Mar | Apr | May | Jun | Jul | Aug | Sep | Oct | Nov | Dec | Annual |
| Little Missouri River | Colony, Weston | 9,799 | Wet Normal Dry |
0 0 0 |
0 0 0 |
0 0 0 |
614 532 775 |
1,047 1,138 1,451 |
1,828 2,000 1,813 |
3,427 2,912 2,640 |
3,082 2,514 2,005 |
1,577 1,276 972 |
72 83 103 |
0 0 0 |
0 0 0 |
11,648 10,455 9,759 |
| Upper Belle Fourche River | Gillette | 3,312 | Wet Normal Dry |
0 0 0 |
0 0 0 |
0 0 0 |
57 79 173 |
281 344 413 |
698 671 683 |
1,229 1,003 898 |
1,118 942 669 |
529 416 309 |
4 10 8 |
0 0 0 |
0 0 0 |
3,915 3,465 3,152 |
| Middle Belle Fourche River | Moorcroft | 9,011 | Wet Normal Dry |
0 0 0 |
0 0 0 |
0 0 0 |
103 109 216 |
562 745 1,382 |
1,573 1,941 1,908 |
2,990 2,620 2,290 |
2,942 2,708 1,961 |
1,546 1,264 858 |
17 19 16 |
0 0 0 |
0 0 0 |
9,734 9,406 8,630 |
| Lower Belle Fourche River | Colony | 5,584 | Wet Normal Dry |
0 0 0 |
0 0 0 |
0 0 0 |
99 100 206 |
348 530 1,309 |
997 1,325 1,241 |
2,261 2,001 1,789 |
1,867 1,787 1,226 |
1,065 886 567 |
23 29 37 |
0 0 0 |
0 0 0 |
6,661 6,656 6,374 |
| Redwater Creek | Sundance | 2,213 | Wet Normal Dry |
0 0 0 |
0 0 0 |
0 0 0 |
6 12 21 |
84 138 303 |
342 481 394 |
776 756 627 |
608 696 400 |
298 267 190 |
0 1 1 |
0 0 0 |
0 0 0 |
2,115 2,350 1,937 |
| Upper Beaver Creek | Upton | 669 | Wet Normal Dry |
0 0 0 |
0 0 0 |
0 0 0 |
2 3 9 |
38 47 142 |
147 147 137 |
256 199 202 |
203 212 128 |
144 124 80 |
1 1 1 |
0 0 0 |
0 0 0 |
791 733 698 |
| Middle Beaver Creek | Newcastle, Upton |
6,000 | Wet Normal Dry |
0 0 0 |
0 0 0 |
0 0 0 |
12 27 92 |
331 435 1,292 |
1,439 1,475 1,337 |
2,360 1,914 1,894 |
1,714 1,930 1,156 |
1,327 1,155 723 |
5 3 3 |
0 0 0 |
0 0 0 |
7,188 6,938 6,496 |
| Lower Beaver Creek | Morrisey, Newcastle |
3,561 | Wet Normal Dry |
0 0 0 |
0 0 0 |
0 0 0 |
54 59 79 |
201 244 604 |
682 828 713 |
1,005 1,065 875 |
768 1,114 574 |
558 636 378 |
22 22 20 |
0 0 0 |
0 0 0 |
3,291 3,969 3,242 |
| Northern Tributaries to Cheyenne | Morrisey | 7,958 | Wet Normal Dry |
0 0 0 |
0 0 0 |
0 0 0 |
209 196 322 |
362 747 1,296 |
1,685 1,474 1,848 |
2,025 1,762 1,845 |
2,105 1,900 1,178 |
886 923 938 |
228 112 148 |
0 0 0 |
0 0 0 |
7,501 7,113 7,577 |
| Southern Tributaries to Cheyenne | Redbird | 12,736 | Wet Normal Dry |
0 0 0 |
0 0 0 |
0 0 0 |
323 612 730 |
1,151 1,287 2,633 |
3,086 3,282 3,464 |
4,186 4,093 3,721 |
4,096 3,669 2,589 |
2,065 2,040 1,195 |
11 5 39 |
0 0 0 |
0 0 0 |
14,919 14,988 14,371 |
| Lower Cheyenne River | Morrisey, Redbird |
2,602 | Wet Normal Dry |
0 0 0 |
0 0 0 |
0 0 0 |
58 55 95 |
109 238 453 |
556 502 630 |
680 594 625 |
697 644 391 |
295 308 307 |
63 31 41 |
0 0 0 |
0 0 0 |
2,458 2,372 2,542 |
| Niobrara River | Lusk | 847 | Wet Normal Dry |
0 0 0 |
0 0 0 |
0 0 0 |
1 7 20 |
67 73 40 |
250 255 144 |
303 259 222 |
323 262 160 |
113 151 58 |
0 0 1 |
0 0 0 |
0 0 0 |
1,057 1,007 646 |
| Total | 64,292 | Wet Normal Dry |
0 0 0 |
0 0 0 |
0 0 0 |
1,539 1,790 2,738 |
4,582 5,965 11,318 |
13,282 14,381 14,313 |
21,499 19,177 17,627 |
19,524 18,377 12,436 |
10,405 9,446 6,574 |
446 315 417 |
0 0 0 |
0 0 0 |
71,277 69,451 65,424 | |
Table II-5
Estimated Actual Ground Water Depletions (Acre-Feet)
| Source of Supply |
Climate Stations1 |
Active Irrigation (Acres) |
Hydrologic Condition |
Jan | Feb | Mar | Apr | May | Jun | Jul | Aug | Sep | Oct | Nov | Dec | Annual |
| Little Missouri River | Colony, Weston |
0 | Wet Normal Dry |
0 0 0 |
0 0 0 |
0 0 0 |
0 0 0 |
0 0 0 |
0 0 0 |
0 0 0 |
0 0 0 |
0 0 0 |
0 0 0 |
0 0 0 |
0 0 0 |
0 0 0 |
| Upper Belle Fourche River | Gillette | 352 | Wet Normal Dry |
0 0 0 |
0 0 0 |
0 0 0 |
0 0 0 |
0 0 0 |
25 32 37 |
146 121 112 |
177 171 108 |
89 72 49 |
0 0 0 |
0 0 0 |
0 0 0 |
437 396 306 |
| Middle Belle Fourche River | Moorcroft | 112 | Wet Normal Dry |
0 0 0 |
0 0 0 |
0 0 0 |
0 0 0 |
0 0 2 |
5 10 11 |
38 33 30 |
51 50 34 |
28 23 15 |
0 0 0 |
0 0 0 |
0 0 0 |
123 117 91 |
| Lower Belle Fourche River | Colony | 186 | Wet Normal Dry |
0 0 0 |
0 0 0 |
0 0 0 |
0 0 3 |
5 12 37 |
28 40 38 |
81 72 66 |
75 76 49 |
44 37 22 |
0 0 0 |
0 0 0 |
0 0 0 |
233 237 215 |
| Redwater Creek | Sundance | 163 | Wet Normal Dry |
0 0 0 |
0 0 0 |
0 0 0 |
0 0 0 |
0 0 0 |
3 11 10 |
53 49 42 |
63 66 45 |
40 33 24 |
0 0 0 |
0 0 0 |
0 0 0 |
159 159 120 |
| Upper Beaver Creek | Upton | 0 | Wet Normal Dry |
0 0 0 |
0 0 0 |
0 0 0 |
0 0 0 |
0 0 0 |
0 0 0 |
0 0 0 |
0 0 0 |
0 0 0 |
0 0 0 |
0 0 0 |
0 0 0 |
0 0 0 |
| Middle Beaver Creek | Newcastle, Upton |
143 | Wet Normal Dry |
0 0 0 |
0 0 0 |
0 0 0 |
0 0 0 |
0 0 1 |
14 14 13 |
54 44 43 |
58 64 39 |
43 37 24 |
0 0 0 |
0 0 0 |
0 0 0 |
168 159 120 |
| Lower Beaver Creek | Morrisey, Newcastle |
0 | Wet Normal Dry |
0 0 0 |
0 0 0 |
0 0 0 |
0 0 0 |
0 0 0 |
0 0 0 |
0 0 0 |
0 0 0 |
0 0 0 |
0 0 0 |
0 0 0 |
0 0 0 |
0 0 0 |
| Northern Tributaries to Cheyenne | Morrisey | 127 | Wet Normal Dry |
0 0 0 |
0 0 0 |
0 0 0 |
0 0 0 |
0 1 1 |
12 11 16 |
33 29 31 |
46 44 27 |
20 21 20 |
0 0 0 |
0 0 0 |
0 0 0 |
112 105 95 |
| Southern Tributaries to Cheyenne | Redbird | 387 | Wet Normal Dry |
0 0 0 |
0 0 0 |
0 0 0 |
0 1 6 |
11 21 69 |
72 93 102 |
146 145 135 |
161 161 102 |
84 83 46 |
0 0 0 |
0 0 0 |
0 0 0 |
474 505 461 |
| Lower Cheyenne River | Morrisey, Redbird |
0 | Wet Normal Dry |
0 0 0 |
0 0 0 |
0 0 0 |
0 0 0 |
0 0 0 |
0 0 0 |
0 0 0 |
0 0 0 |
0 0 0 |
0 0 0 |
0 0 0 |
0 0 0 |
0 0 0 |
| Niobrara River | Lusk | 11,566 | Wet Normal Dry |
0 0 0 |
0 0 0 |
0 0 0 |
1 29 207 |
687 948 615 |
3,397 3,650 2,064 |
4,528 3,880 3,351 |
5,105 4,271 2,527 |
1,797 2,407 898 |
0 1 1 |
0 0 0 |
0 0 0 |
15,515 15,185 9,663 |
| Total | 13,036 | Wet Normal Dry |
0 0 0 |
0 0 0 |
0 0 0 |
1 31 216 |
704 982 726 |
3,557 3,861 2,292 |
5,078 4,373 3,809 |
5,736 4,903 2,930 |
2,145 2,713 1,098 |
0 1 1 |
0 0 0 |
0 0 0 |
17,222 16,864 11,072 | |
Table II-6
Estimated Actual Surface Water Depletions (Acre-Feet)
| Source of Supply |
Active Irrigation (Acres) |
Hydrologic Condition |
Jan | Feb | Mar | Apr | May | Jun | Jul | Aug | Sep | Oct | Nov | Dec | Annual |
| Little Missouri River | 9,799 | Wet Normal Dry |
0 0 0 |
0 0 0 |
0 0 0 |
614 532 775 |
1,047 1,138 1,451 |
1,828 2,000 1,813 |
3,427 2,912 2,640 |
3,082 2,514 2,005 |
1,577 1,276 972 |
72 83 103 |
0 0 0 |
0 0 0 |
11,648 10,455 9,759 |
| Belle Fourche River | 17,907 | Wet Normal Dry |
0 0 0 |
0 0 0 |
0 0 0 |
260 288 595 |
1,191 1,619 3,103 |
3,267 3,937 3,832 |
6,480 5,624 4,976 |
5,928 5,436 3,856 |
3,140 2,565 1,733 |
44 58 61 |
0 0 0 |
0 0 0 |
20,310 19,526 18,157 |
| Redwater Creek | 2,213 | Wet Normal Dry |
0 0 0 |
0 0 0 |
0 0 0 |
6 12 21 |
84 138 303 |
342 481 394 |
776 756 627 |
608 696 400 |
298 267 190 |
0 1 1 |
0 0 0 |
0 0 0 |
2,115 2,350 1,937 |
| Beaver Creek | 10,230 | Wet Normal Dry |
0 0 0 |
0 0 0 |
0 0 0 |
68 89 180 |
570 725 2,038 |
2,268 2,450 2,187 |
3,620 3,178 2,970 |
2,685 3,256 1,857 |
2,030 1,916 1,181 |
28 26 24 |
0 0 0 |
0 0 0 |
11,269 11,640 10,437 |
| Cheyenne River | 23,295 | Wet Normal Dry |
0 0 0 |
0 0 0 |
0 0 0 |
590 862 1,147 |
1,623 2,272 4,382 |
5,327 5,259 5,942 |
6,892 6,448 6,192 |
6,898 6,213 4,158 |
3,247 3,271 2,440 |
302 147 228 |
0 0 0 |
0 0 0 |
24,878 24,473 24,489 |
| Niobrara River | 847 | Wet Normal Dry |
0 0 0 |
0 0 0 |
0 0 0 |
1 7 20 |
67 73 40 |
250 255 144 |
303 259 222 |
323 262 160 |
113 151 58 |
0 0 1 |
0 0 0 |
0 0 0 |
1,057 1,007 646 |
| Total | 64,292 | Wet Normal Dry |
0 0 0 |
0 0 0 |
0 0 0 |
1,539 1,790 2,738 |
4,582 5,965 11,318 |
13,282 14,381 14,313 |
21,499 19,177 17,627 |
19,524 18,377 12,436 |
10,405 9,446 6,574 |
446 315 417 |
0 0 0 |
0 0 0 |
71,277 69,451 65,424 |
Table II-7
Estimated Actual Ground Water Depletions (Acre-Feet)
| Source of Supply |
Active Irrigation (Acres) |
Hydrologic Condition |
Jan | Feb | Mar | Apr | May | Jun | Jul | Aug | Sep | Oct | Nov | Dec | Annual |
| Little Missouri River | 0 | Wet Normal Dry |
0 0 0 |
0 0 0 |
0 0 0 |
0 0 0 |
0 0 0 |
0 0 0 |
0 0 0 |
0 0 0 |
0 0 0 |
0 0 0 |
0 0 0 |
0 0 0 |
0 0 0 |
| Belle Fourche River | 650 | Wet Normal Dry |
0 0 0 |
0 0 0 |
0 0 0 |
0 0 3 |
6 12 39 |
58 81 86 |
265 227 207 |
304 297 191 |
161 132 86 |
0 0 0 |
0 0 0 |
0 0 0 |
793 750 612 |
| Redwater Creek | 163 | Wet Normal Dry |
0 0 0 |
0 0 0 |
0 0 0 |
0 0 0 |
0 0 0 |
3 11 10 |
53 49 42 |
63 66 45 |
40 33 24 |
0 0 0 |
0 0 0 |
0 0 0 |
159 159 120 |
| Beaver Creek | 143 | Wet Normal Dry |
0 0 0 |
0 0 0 |
0 0 0 |
0 0 0 |
0 0 1 |
14 14 13 |
54 44 43 |
58 64 39 |
43 37 24 |
0 0 0 |
0 0 0 |
0 0 0 |
168 159 120 |
| Cheyenne River | 514 | Wet Normal Dry |
0 0 0 |
0 0 0 |
0 0 0 |
0 1 6 |
11 21 71 |
85 104 119 |
178 174 166 |
207 205 129 |
105 104 66 |
0 0 0 |
0 0 0 |
0 0 0 |
586 610 556 |
| Niobrara River | 11,566 | Wet Normal Dry |
0 0 0 |
0 0 0 |
0 0 0 |
1 29 207 |
687 948 615 |
3,397 3,650 2,064 |
4,528 3,880 3,351 |
5,105 4,271 2,527 |
1,797 2,407 898 |
0 1 1 |
0 0 0 |
0 0 0 |
15,515 15,185 9,663 |
| Total | 13,036 | Wet Normal Dry |
0 0 0 |
0 0 0 |
0 0 0 |
1 31 216 |
704 982 726 |
3,557 3,861 2,292 |
5,078 4,373 3,809 |
5,736 4,903 2,930 |
2,145 2,713 1,098 |
0 1 1 |
0 0 0 |
0 0 0 |
17,222 16,864 11,072 |
C. Municipal and Domestic UseMunicipal and domestic uses are described in this section of the report. For the purpose of this report municipal uses are defined as uses satisfied by a public water supply system. Domestic uses are those that are satisfied by individual wells and small water systems.
Municipal
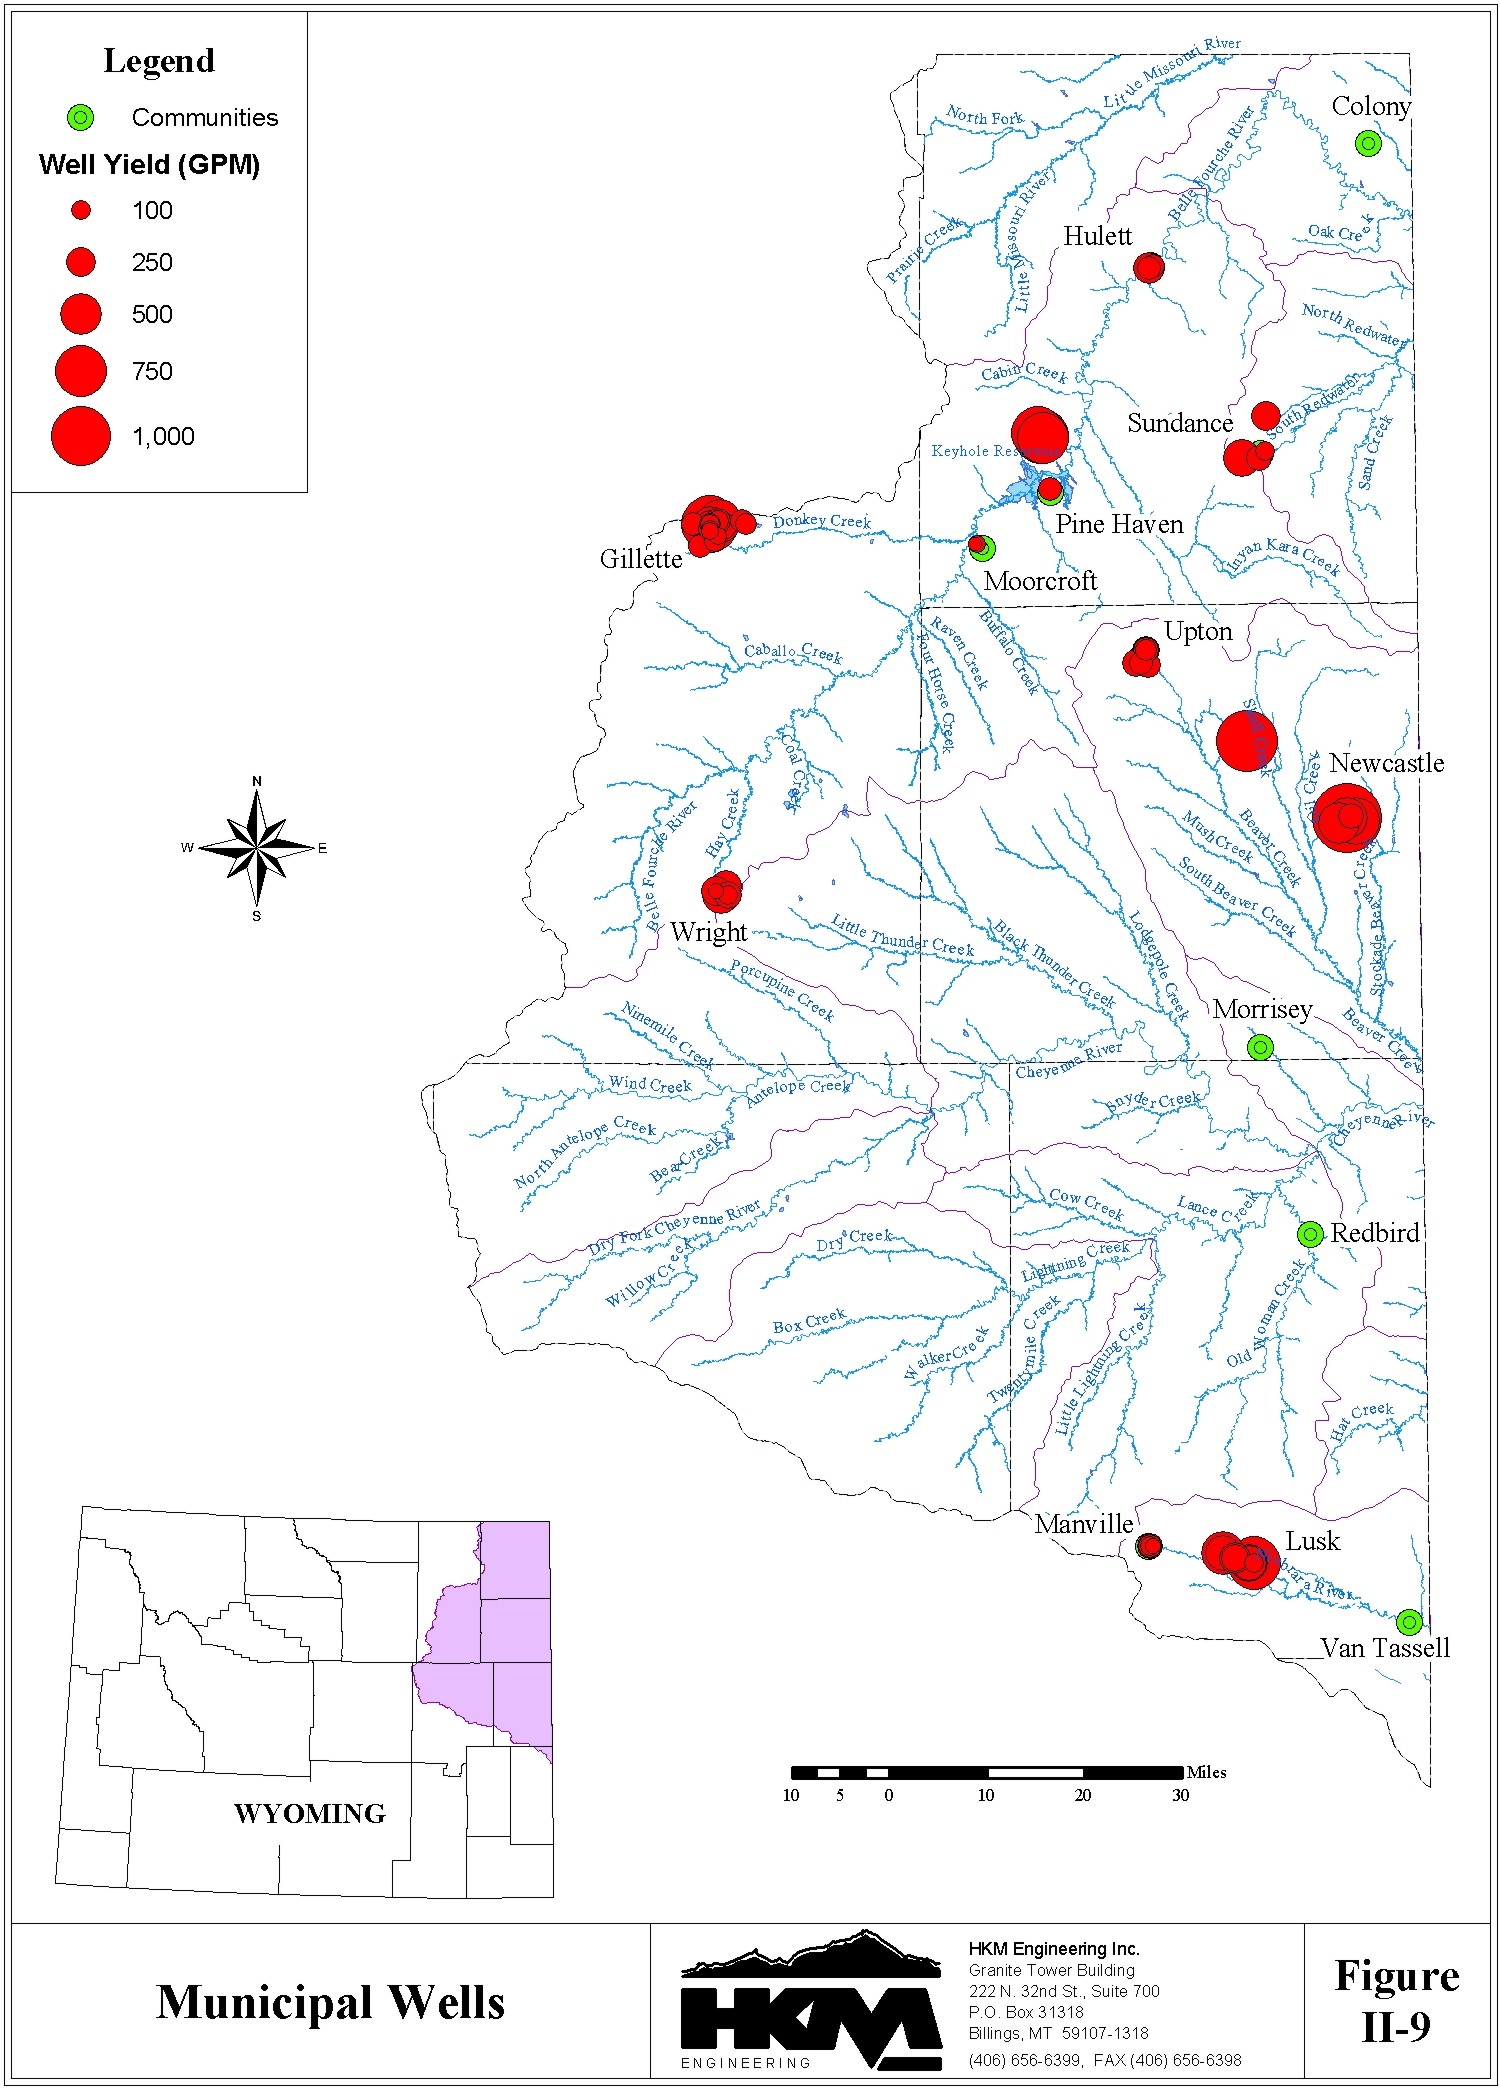
There are thirty-three public water supply entities consisting of incorporated municipalities, districts, and privately owned water systems in the planning area. These entities are listed below. All of these systems derive their supply from ground water and Figure II-9 displays the location of municipal wells according to the records of the State Engineer's Office.
Information on the water sources and systems of the twenty entities was obtained through: 1) The year 2000 Water System Survey Reports compiled and published by the WWDC; 2) directly from the entity through mail surveys and personnel communication; and 3) the Wyoming DEQ office in Sheridan. The detail information compiled for each of the entities is presented in the Municipal Use Technical Memorandum. Municipal ground water use is summarized in Table II-8.
Table II-9 compares the existing usage demand imposed on the municipal system to the capacity of that system. This table indicates most of the municipal systems in the Northeast Wyoming River Basins study area have adequate capacity to meet existing needs. There are, however, a number of entities with system capacities close to or less than existing demands.
Table II-8
Municipal Ground Water Use
(Million Gallons)
| Municipality | Population 1 | GPCPD 2 | Annual Use |
| American Road W&SD | 210 | 104 | 8.0 |
| Antelope Valley | 800 | N/A | N/A |
| Cambria I&SD | 110 | 140 | 5.6 |
| Cedar Hills | 250 | 40 | 3.7 |
| Central Campbell Co. I&SD | 1,500 | 60 | 32.9 |
| Collins Heights I&SD | 250 | N/A | N/A |
| Crestview WD | 490 | 150 | 26.8 |
| Force Road JPB | 250 | 360 | 32.9 |
| Fox Park I&SD | 843 | N/A | N/A |
| Freedom Hills Subdivision | 400 | N/A | N/A |
| City of Gillette | 22,000 | 200 | 1,606.0 |
| Town of Hulett | 450 | 100 | 16.4 |
| Lance Creek W&SD | 40 | 525 | 250 |
| Lost Springs | N/A | N/A | N/A |
| City of Lusk | 1,600 | 160 | 93.4 |
| Town of Manville | 100 | 700 | 25.6 |
| Town of Moorcroft | 770 | 130 | 36.5 |
| City of Newcastle | 3,300 | 225 | 271.0 |
| Newton Industrial Park I&SD | 25 | 160 | 1.5 |
| Osage WD | 216 | 230 | 18.1 |
| Peoples I&SD | 80 | N/A | N/A |
| Town of Pine Haven | 222 | 220 | 17.8 |
| Salt Creek WD | 500 | 150 | 27.4 |
| Southfork Estates I&SD | 115 | 80 | 3.4 |
| Sunburst W&SD | Water supplied by City of Gillette | ||
| City of Sundance | 1,250 | 150 | 68.4 |
| Town of Upton | 950 | 225 | 78.0 |
| Van Tassell | N/A | N/A | N/A |
| Vista West I&SD | 250 | 100 | 9.1 |
| Wessex I&SD | 21 | 150 | 1.1 |
| West End WD | 300 | 50 | 5.5 |
| Westridge WUA | 260 | 240 | 22.8 |
| Wright W&SD | 1,500 | 219 | 119.9 |
1 2000 census
2 Water right is permitted well yield
Table II-9
Comparison of Usage to System Capacity
| Municipality | Population 1 | Peak Day Demand (gpm) |
System Capacity (gpm) |
Water Right2 (gpm) |
| American Road W&SD | 210 | 29 | 165 | N/A |
| Antelope Valley | 800 | N/A | N/A | N/A |
| Cambria I&SD | 110 | 14 | 50 | N/A |
| Cedar Hills | 250 | 40 | 180 | N/A |
| Central Campbell Co. I&SD | 1,500 | 254 | 610 | N/A |
| Collins Heights I&SD | 250 | N/A | N/A | N/A |
| Crestview WD | 490 | 160 | 120 | N/A |
| Force Road JPB | 250 | 174 | 120 | N/A |
| Fox Park I&SD | 843 | N/A | 180 | N/A |
| Freedom Hills Subdivision | 400 | N/A | 200 | N/A |
| City of Gillette | 22,000 | 8,290 | 12,865 | 15,725 |
| Town of Hulett | 450 | 140 | 300 | 300 |
| Lance Creek W&SD | 40 | 58 | 60 | 250 |
| Lost Springs | N/A | N/A | N/A | N/A |
| City of Lusk | 1,600 | 754 | 1,600 | N/A |
| Town of Manville | 100 | 103 | 430 | N/A |
| Town of Moorcroft | 770 | 350 | 350 | N/A |
| City of Newcastle | 3,300 | 1,390 | 1,800 | N/A |
| Newton Industrial Park I&SD | 25 | 3 | 25 | N/A |
| Osage WD | 216 | N/A | 200 | N/A |
| Peoples I&SD | 80 | N/A | 55 | N/A |
| Town of Pine Haven | 222 | 90 | 120 | 120 |
| Salt Creek WD | 500 | 139 | 1,000 | 500 |
| Southfork Estates I&SD | 115 | 17 | 80 | None |
| Sunburst W&SD | Water supplied by City of Gillette | |||
| City of Sundance | 1,250 | 450 | 1,000 | N/A |
| Town of Upton | 950 | 350 | 840 | N/A |
| Van Tassell | N/A | N/A | N/A | N/A |
| Vista West I&SD | 250 | 42 | 130 | N/A |
| Wessex I&SD | 21 | 5 | 20 | 50 |
| West End WD | 300 | 42 | 1,150 | N/A |
| Westridge WUA | 260 | 97 | 105 | 125 |
| Wright W&SD | 1,500 | 544 | 1,350 | 1,560 |
1 2000 census
2 Water right is permitted well yield
Domestic
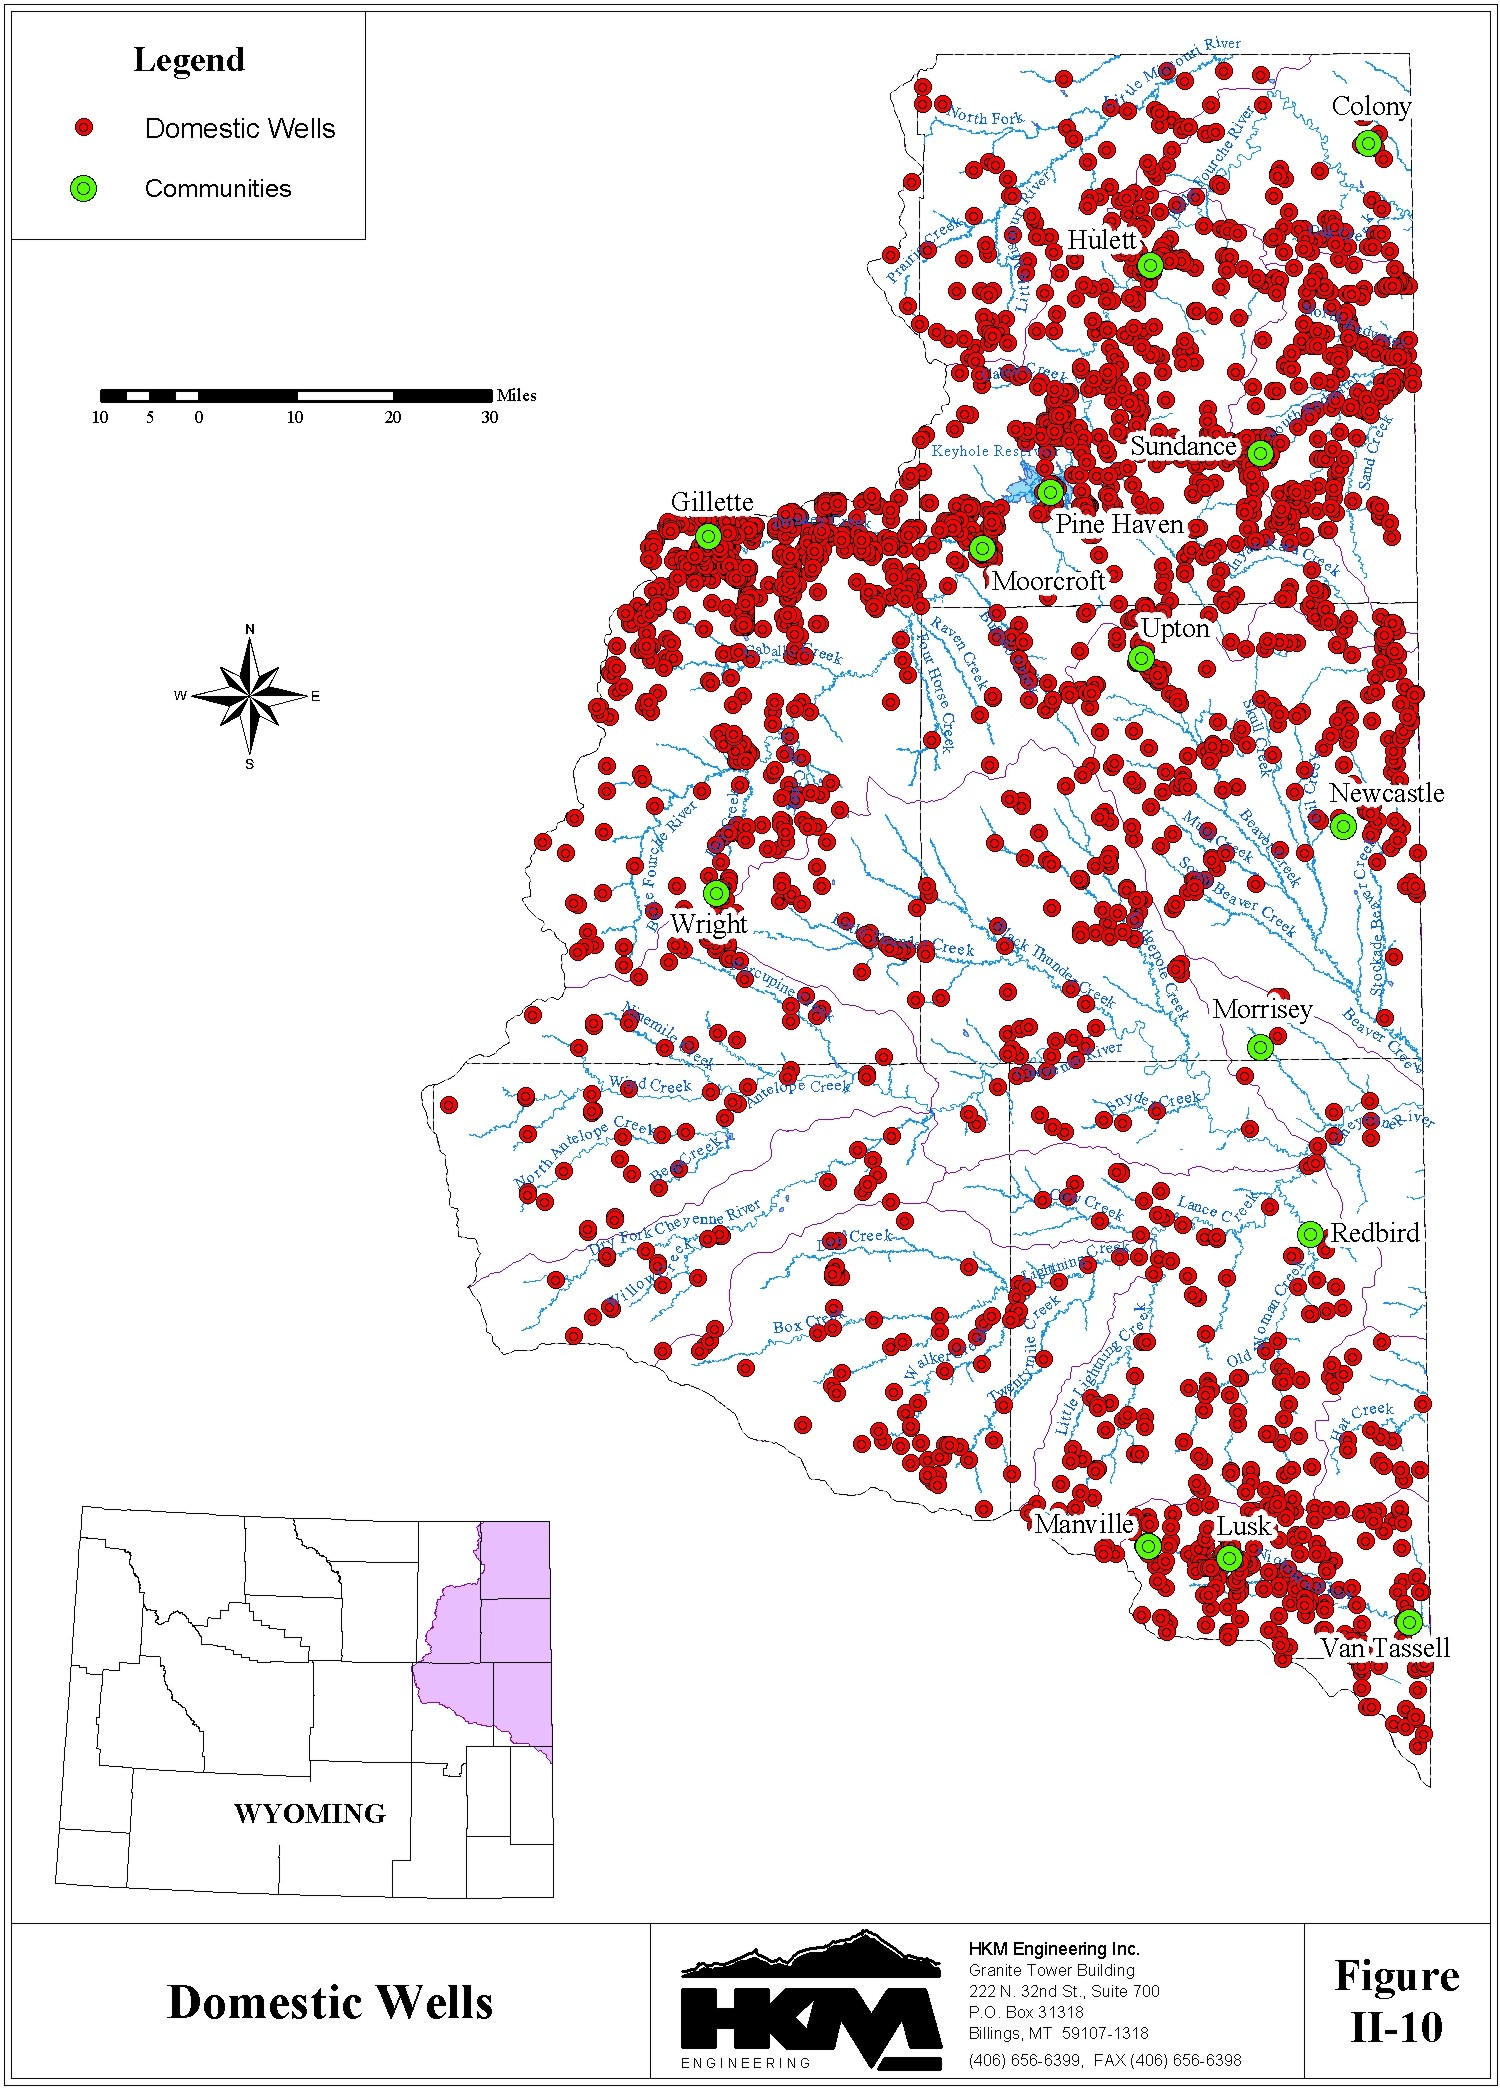
Domestic use includes water supplied for rural homes, subdivisions, small trailer courts, commercial establishments, parks, campgrounds, rural schools, domestic uses at coal mines, and other small water uses that are not supplied from a central public water system. These uses are almost exclusively supplied from ground water. A notable exception is that limited irrigation of lawns and gardens from a surface water source is practiced by many rural homes where a surface source is available. Figure II-10 displays the location of domestic wells according to the records of the State Engineer's Office
The population served by individual domestic systems is estimated to be 7,405. To estimate domestic water usage it is assumed individuals served by domestic systems consume between 150 and 300 gallons per day. At this usage rate the total daily domestic use in the study area is between 1.26 and 2.52 million gallons. On an annual basis, domestic use is estimated to be between 1,410 and 2,820 acre-feet.
Domestic use also includes consumption by two special types of systems:
Total domestic use, including permanent populations and the two special systems, is estimated to be between 1.91 and 3.17 million gallons per day, or between 2,140 and 3,550 acre-feet per year.
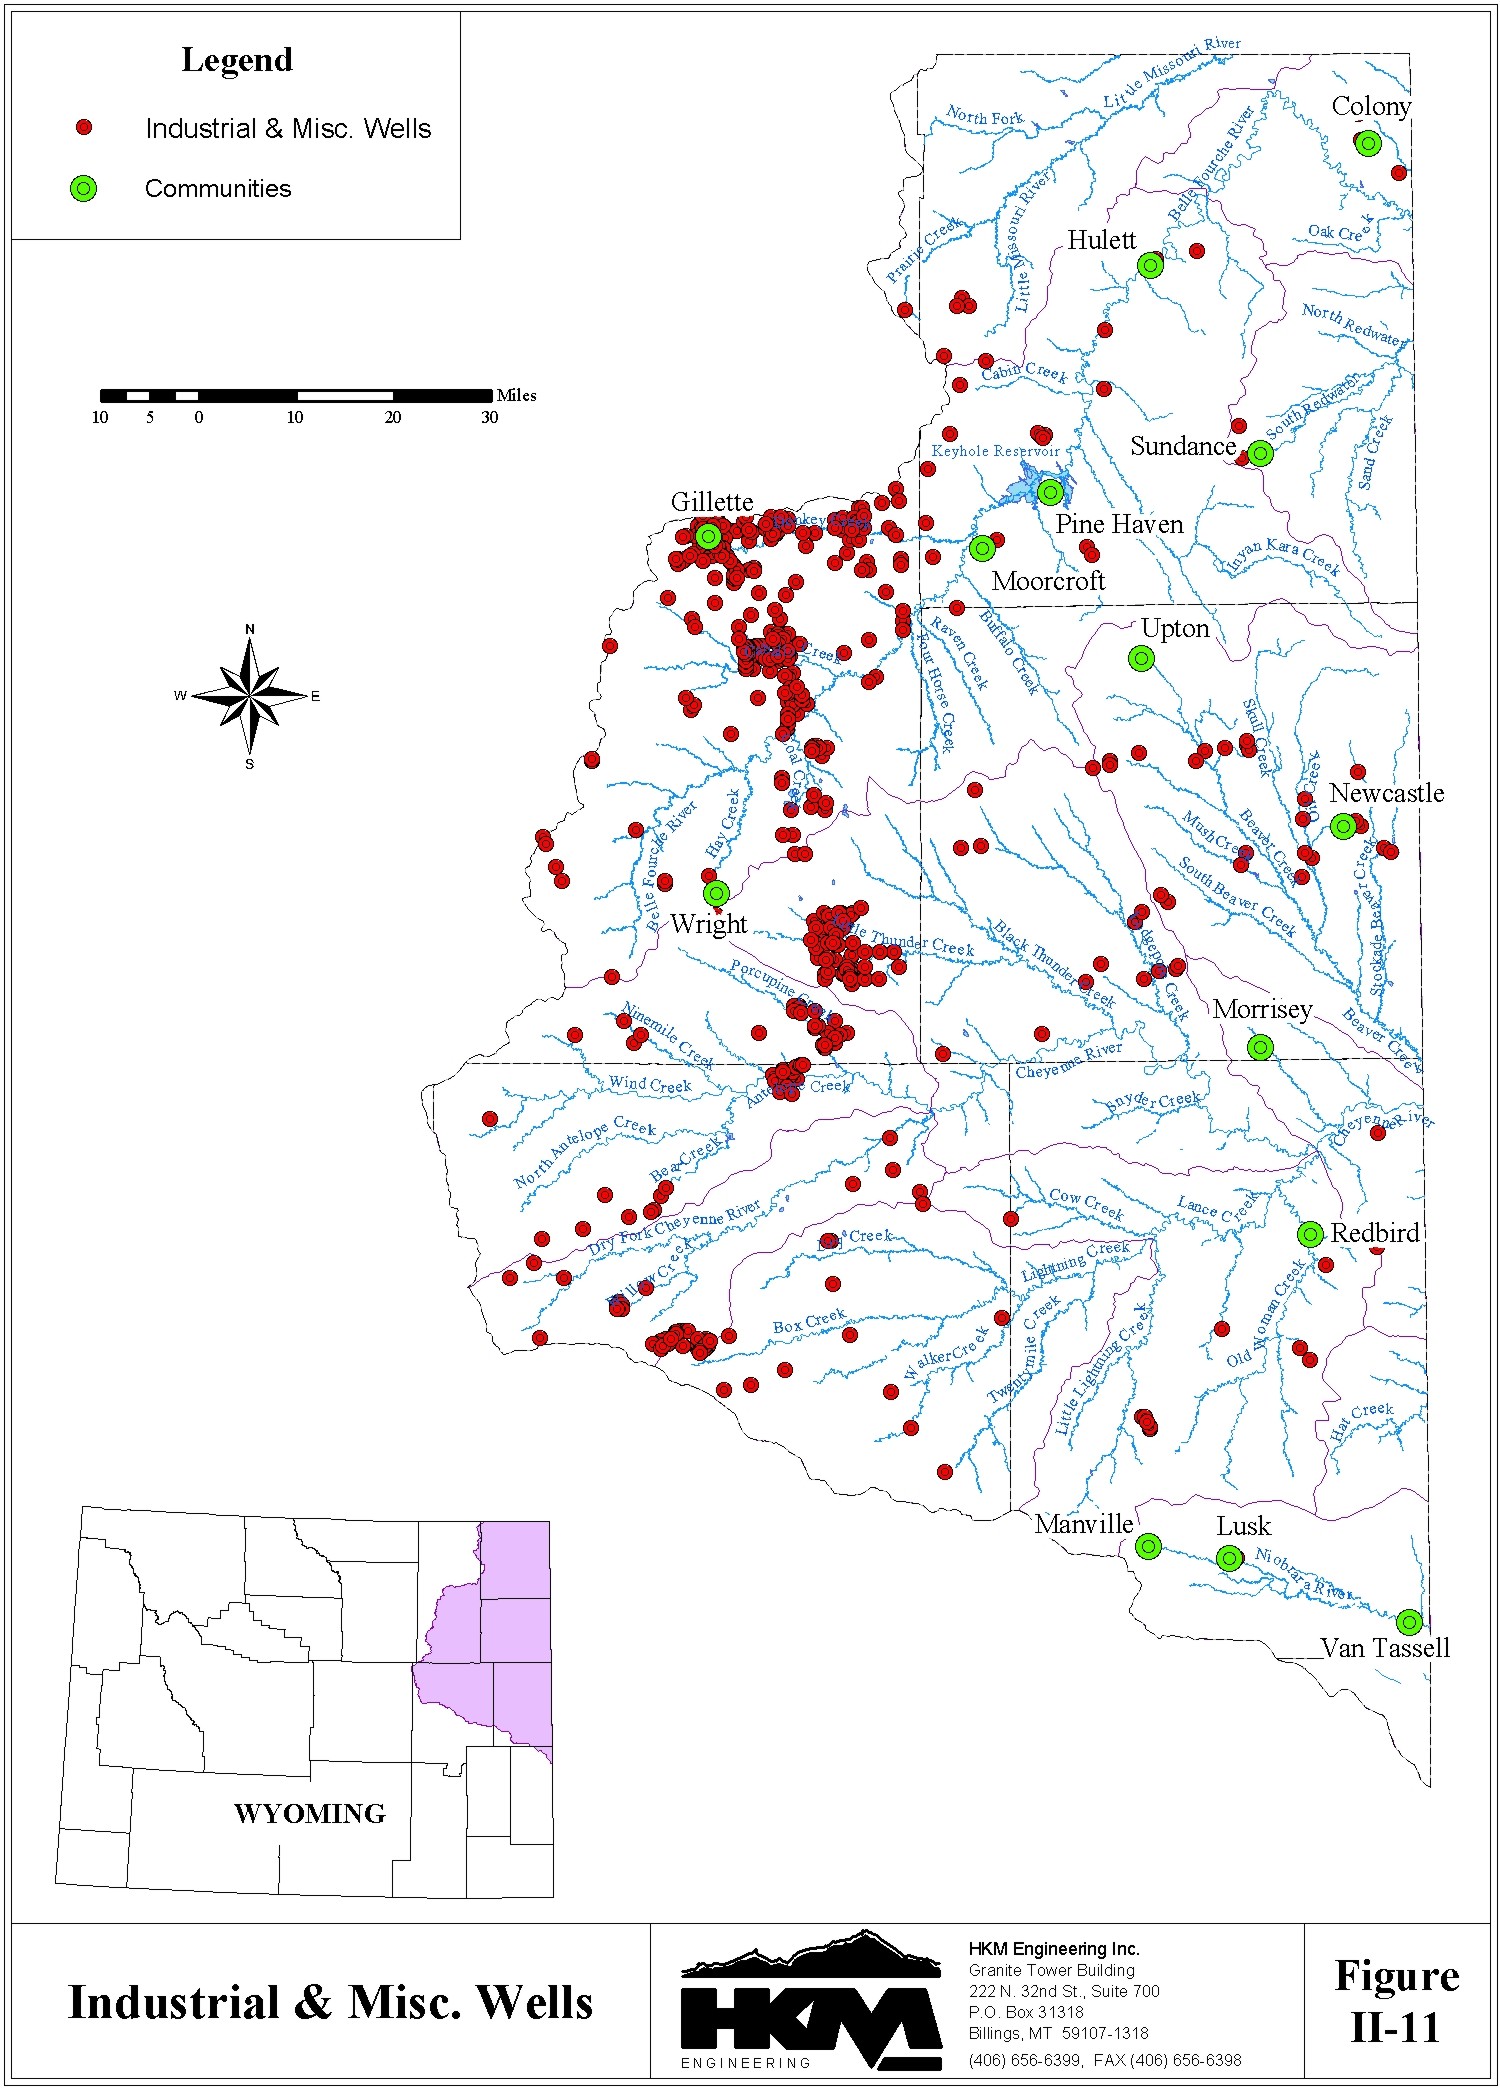
D. Industrial UseIndustrial water use in the Northeast Wyoming River Basins, including electric power generation, coal mining, conventional oil and gas production, coalbed methane production, and oil refining is described in this section. The information reported here was obtained from individual water users, the Coalbed Methane Coordination Coalition (CBMCC), the Wyoming Oil & Gas Conservation Commission (OGCC), and the U.S. Bureau of Land Management (BLM).
The majority of the industrial use is from ground water. Figure II-11 displays the location of industrial water wells with capacities of at least 50 gpm according to the records of the State Engineer's Office. CBM wells are not shown on Figure II-11. A small amount of surface water is used at the Wyodak Plant east of Gillette for electric power generation, and this use is described below.
Electric Power Generation
Electricity is generated at two coal-fired facilities in the planning area, the Wyodak Plant and Osage Plant. The Wyodak Plant has a capacity of 460 megawatts, is air-cooled, and uses about 700 acre-feet of water per year. About half of this water supply is treated wastewater effluent from the City of Gillette, a portion of which originates as surface water. The 33-megawatt Osage Plant is wet-cooled and consumes about 870 acre-feet annually, all of which comes from ground water.
Coal Mining
Water is used in the coal mining industry mainly for dust abatement with lesser amounts used for equipment wash-down and domestic purposes. Water for these uses is obtained from pit dewatering wells, pit sumps, and captured surface runoff. Excess water is discharged to surface water at various permitted points that vary from year to year due to mine progress. Records from five coal mines in the Northeast Wyoming River Basins planning area indicate a combined usage of about 2,700 acre-feet per year. The annual discharge from these mines is approximately 3,000 acre-feet.
Conventional Oil and Gas Production
Conventional oil and gas wells produce as well as consume ground water. Water is consumed by injection into the oil and gas aquifers to stimulate production. According to OGCC records for the year 2000, 2,878 wells produced approximately 10,200 acre-feet of water, and 1,127 injection wells consumed about 10,400 acre-feet.
Injection water comes from two sources: oil and gas produced water and wells drilled specifically to pump injection water supply. Produced water can also be discharged to the surface. Because no agency monitors the amounts of produced water injected or discharged, the net amount of water consumed by conventional oil and gas wells cannot be quantified.
Coalbed Methane Production
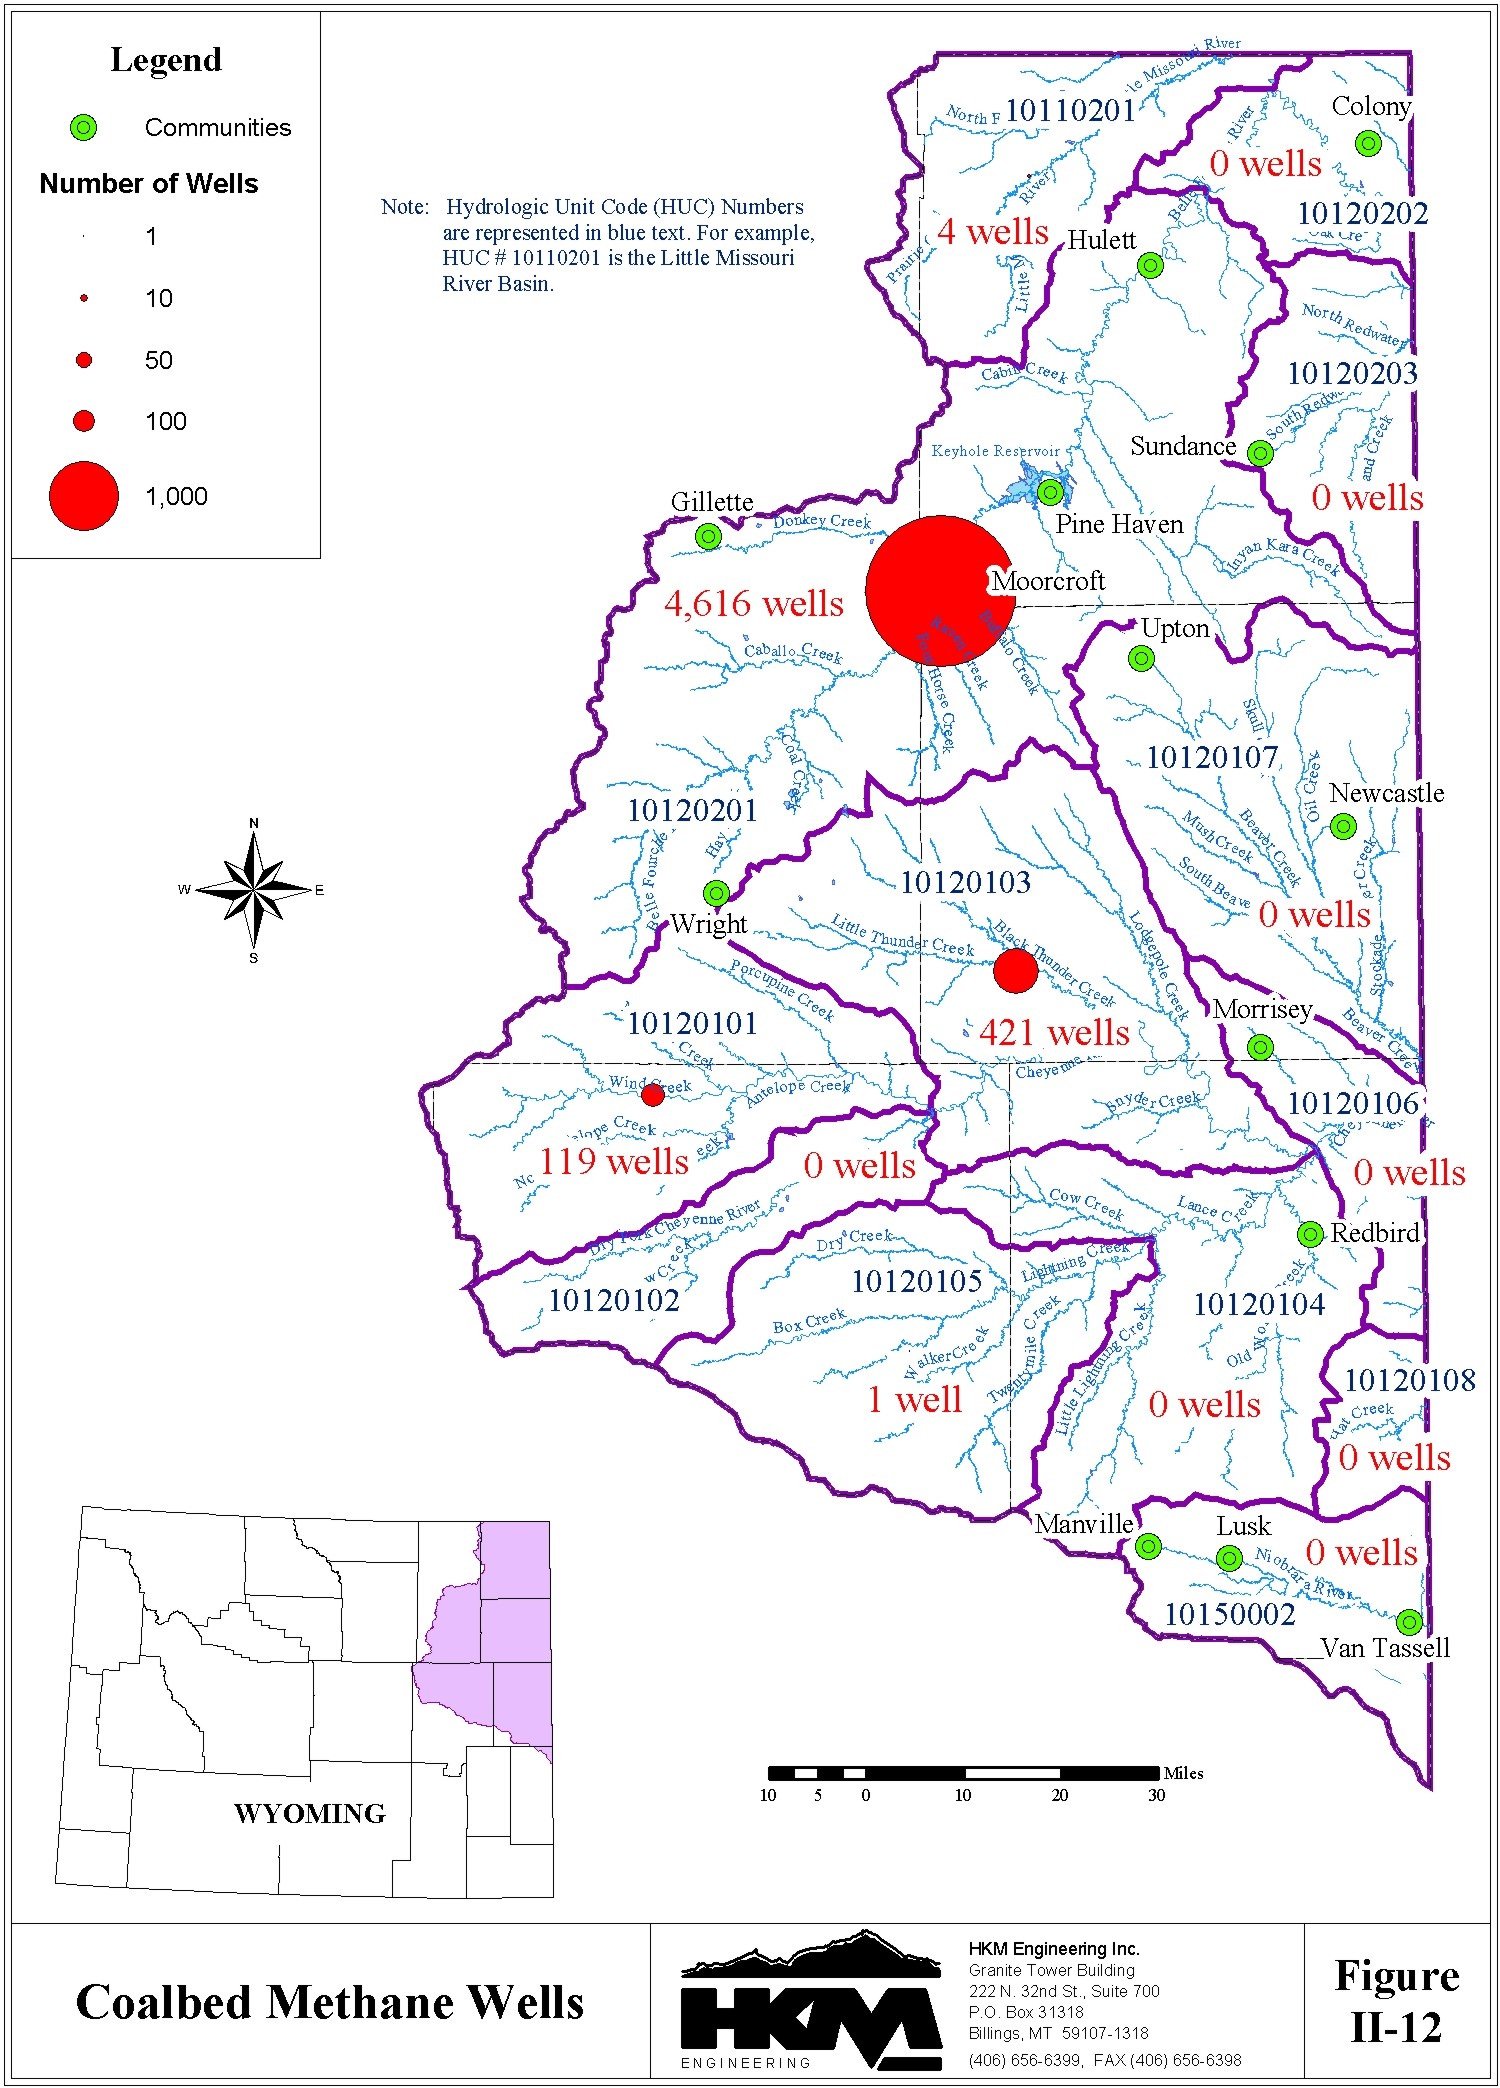
There is little direct consumptive use of water in the CBM industry. However, the production of CBM gas results from lowering the water table over the coal seam and a significant amount of ground water is produced in this operation. OGCC records indicate approximately 35,600 acre- feet of water was pumped from the 5,161 CBM wells in the Northeast Wyoming River Basins in 2001. Throughout the history of CBM production, which dates back to the 1970s, OGCC records indicate approximately 99,700 acre-feet has been pumped. The locations of the CBM wells on record with the Wyoming Oil and Gas Conservation Commission as of January 2002, by regions within the planning area are shown on Figure II-12.
There is little information available to quantify what happens to water pumped from CBM wells. The majority of this production water is discharged into existing drainages, and some is conveyed to small reservoirs where it either infiltrates or evaporates. A small portion of this water is reported to be used for irrigation.
Oil Refining
An oil refining facility in Newcastle consumes approximately 250 gpm on a constant basis throughout the year, or about 400 acre-feet per year. The Town of Newcastle supplies the majority of the water from their ground water source, and a small amount of the demand is met from other wells.
E. Recreational UseRecreational uses associated with the water resources of the Northeast Wyoming River Basins are described in this section of the report under the general headings of boating, fishing, and waterfowl hunting. Keyhole Reservoir, an important recreational resource in the basin, is also discussed.
Water-based recreation is enhanced through minimum flow releases from reservoirs, minimum pool levels maintained in reservoirs, and instream flow water rights established on streams. These water administration topics are addressed in the environmental section of this chapter.
Data compiled for water-related recreational use is presented to the extent it is available. This report does not address the economic impacts of recreation in the planning area, although this data is presented in the Technical Memorandum prepared for this topic.
Boating
Many of the streams and lakes in the study area support boating activities, including whitewater, scenic, fishing, and water skiing. Boaters primarily use Gillette and Keyhole reservoirs. Boating is a non-consumptive use because it depends on waters being maintained for other purposes.
Because permits are not required for boating anywhere in the planning area, usage numbers that could indicate capacity limits and pressures are not available from management agencies. The Bureau of Reclamation's default figure of one boat per ten surface acres of water is used to estimate capacities elsewhere, but until use numbers are generated in the study area to support this estimate, that guideline cannot be used.
At present, no central agency monitors or controls float trips on the streams in the study area, although individuals do occasionally float the Belle Fourche River. No records are available to quantify this use of streams within the basin.
Fishing
Fishing represents the biggest recreation-related water use in the Northeast Wyoming River Basins. This use is non-consumptive and, in most cases, is dependent on water devoted to other uses such as irrigation or municipal. A notable exception to this dependency is the instream flow water right program administered by the State of Wyoming. Instream flows are discussed later in this section of the report.
The State of Wyoming classifies trout streams under the five designations listed below:
The Wyoming Game and Fish Department (WGFD) maintains records of fishing activity. According to recent records, the 35 streams in the Northeast Wyoming study area tracked by the WGFD experience about 13,500 angler-days annually. Standing water (ponds, lakes, reservoirs) see about 48,700 angler-days in a year.
Basin management plans developed by WGFD provide additional information on fishing in the study area. This data is summarized below:
Little Missouri River Drainage
        Streams..................90 angler-days/year
        Standing Water........2,377 angler-days/year

Belle Fourche River Drainage
        Streams..............12,231 angler-days/year
        Standing Water*......15,699 angler-days/year
        Keyhole Reservoir.....5,467 angler-days/year
        *excluding Keyhole Reservoir

Cheyenne River Drainage
        Streams...............1,062 angler-days/year
        Standing Water.......13,732 angler-days/year

Niobrara River Drainage
        Streams...............none
        Standing Water........1,034 angler-days/year
These WGFD estimates are not all current. Updated estimates of fishing activity were developed
for this planning study to reflect current activity in the planning area. These estimates indicate
that the Northeast Wyoming River Basins experiences approximately 15,000 activity-days of
stream fishing each year and 50,000 activity-days of fishing on standing waters.
Waterfowl Hunting
The harvest of migratory waterfowl is a recreational pursuit affected by the presence or absence of water. Wetlands and open water are needed for breeding, nesting, rearing, feeding and isolation from land-based predators. In the Northeast Wyoming River Basins, which represents the western extreme of the central flyway, waterfowl hunting is pursued where sufficient local or migratory populations are available.
Harvest objectives are not currently used (post-1993), because harvest is taken into account in the setting of season length and bag limits by the USFWS using the "Adaptive Harvest Management" concept. In effect, the desired harvest is a prospective number using past hunter success, population effects, and regulations in concert with current-year populations. With current duck populations and hunting pressure, it appears there is a sufficient resource to provide a quality duck hunting experience now and in the near future, with the existing water resources of the basin.
Similarly, goose hunting seasons and bag limits are set under guidelines from the USFWS, although states have more flexibility in setting bag and possession limits. Like duck populations, goose populations are strong and increasing. With approval from USFWS, states can set special seasons to allow depredation harvest from growing local flocks. According to historic estimates, the Rocky Mountain Population (RMP) of Canada geese has grown approximately four-fold since 1972. Since 1989, populations have increased at a rate of eight percent per year.
Keyhole Reservoir
The biggest still-water recreation attraction in the Northeast Wyoming River Basins, Keyhole Reservoir supports skiing, fishing, swimming, boating, and camping and has been doing so essentially since its construction in late 1952. Part of the Pick-Sloan Missouri Basin Program, the "Keyhole Unit," named after the Keyhole Ranch it was constructed on, is run by the U.S. Bureau of Reclamation. Though the Wyoming Department of State Parks and Cultural Resources (WDSPCR) manages Keyhole State Park, located at the eastern end of the reservoir, under a memorandum of understanding and cooperative agreement with the Bureau of Reclamation, experience has shown that the water levels controlled by the Bureau of Reclamation have a large impact on recreation.
The State Park area consists of a marina-concessionaire, motel, campgrounds, boating ramps, day-use areas, picnic areas, playground, swimming beach, restroom facilities, and trailer sanitary station. Under a dual management agreement on the western portion of the reservoir lands, the Bureau of Reclamation manages the grazing leases and leaves WDSPCR with the general recreation activities not associated with the park. The Keyhole and Sundance Boat Clubs, private exclusive use areas near the Pronghorn Campground, offer cabins and mobile home trailers. The club leases the space from WDSPCR.
Park visitation statistics compiled by WDSPCR reveal that between 1992 and 2000 the number of visitor-days (based on a 12-hour stay) ranged from a low of about 232,000 in 1994 to a high of about 368,000 in 1993. The average during this period was 288,000 visitor-days. Ninety-five percent of visitors come from Wyoming, South Dakota, North Dakota, Nebraska, and Colorado. The remaining five percent come from the rest of the United States, Canada, and other foreign nations. Visitor counts from the park indicate a growing number of visitors that generally coincides with a shorter stay at the park.
The WGFD manages Keyhole for walleye production but stocks a number of species during any five-year period. Much of the stocking is done with "forage fish," which are stocked to provide young-of-the-year fingerlings for other fish to feed on.
A 1985 creel survey revealed that fishermen exerted a pressure of 5,467 angler-days (1.65 per acre of surface water) and 23,727 angling hours (7.2 per acre of surface water). This survey was conducted when the water level was quite low and likely understates the fishing pressure experienced at the lake. At full pool the reservoir has approximately 9,411 surface acres while the area during the survey was estimated to be only about 3,300 surface acres.
F. Environmental UseEnvironmental uses of water in the Northeast Wyoming River Basins are largely non- consumptive. For instance, instream flows by definition maintain water in the channel to improve habitat.
This section of the report discusses the water administration topics of minimum flow releases, minimum pool maintenance, and instream flow water rights. Other topics included in this section include environmental concerns associated with water produced by coalbed methane development, wetland mapping, and comments and concerns of groups with environmental interests.
Water Administration
Minimum flow releases from reservoirs, minimum pool levels maintained in reservoirs, and instream flow water rights established on streams are all intended to protect and enhance water- related habitat. A major and desired consequence of implementing these water administration criteria is the increase in recreational opportunities and use.
Minimum conservation pools and minimum flow releases are not available or are nonexistent in the standing water of the Northeast Wyoming River Basins. Low water levels in Keyhole Reservoir in 1989 to 1991 sparked discussions between Wyoming, South Dakota, and the Crook County Irrigation District over establishing a minimum conservation pool, but when water conditions improved, the issue was not pursued.
In 1986, the State of Wyoming enacted legislation defining "instream flow" as a beneficial use of water, and stipulated how instream flow water rights would be filed, evaluated, granted or denied, and ultimately regulated. Instream flow rights are filed with the Wyoming State Engineer's Office, held by the Wyoming Water Development Commission, and managed by Wyoming Game and Fish.
The law allows for instream flow water rights to be filed and granted on unappropriated water originating as natural flow or from storage in existing or new reservoirs. For natural flow sources, the flow amount is defined as the minimum needed to "maintain or improve existing fisheries." The language relating to stored water is slightly different, defining the minimum needed to "establish or maintain new or existing fisheries." Generally speaking, instream flow is considered a non-consumptive beneficial use.
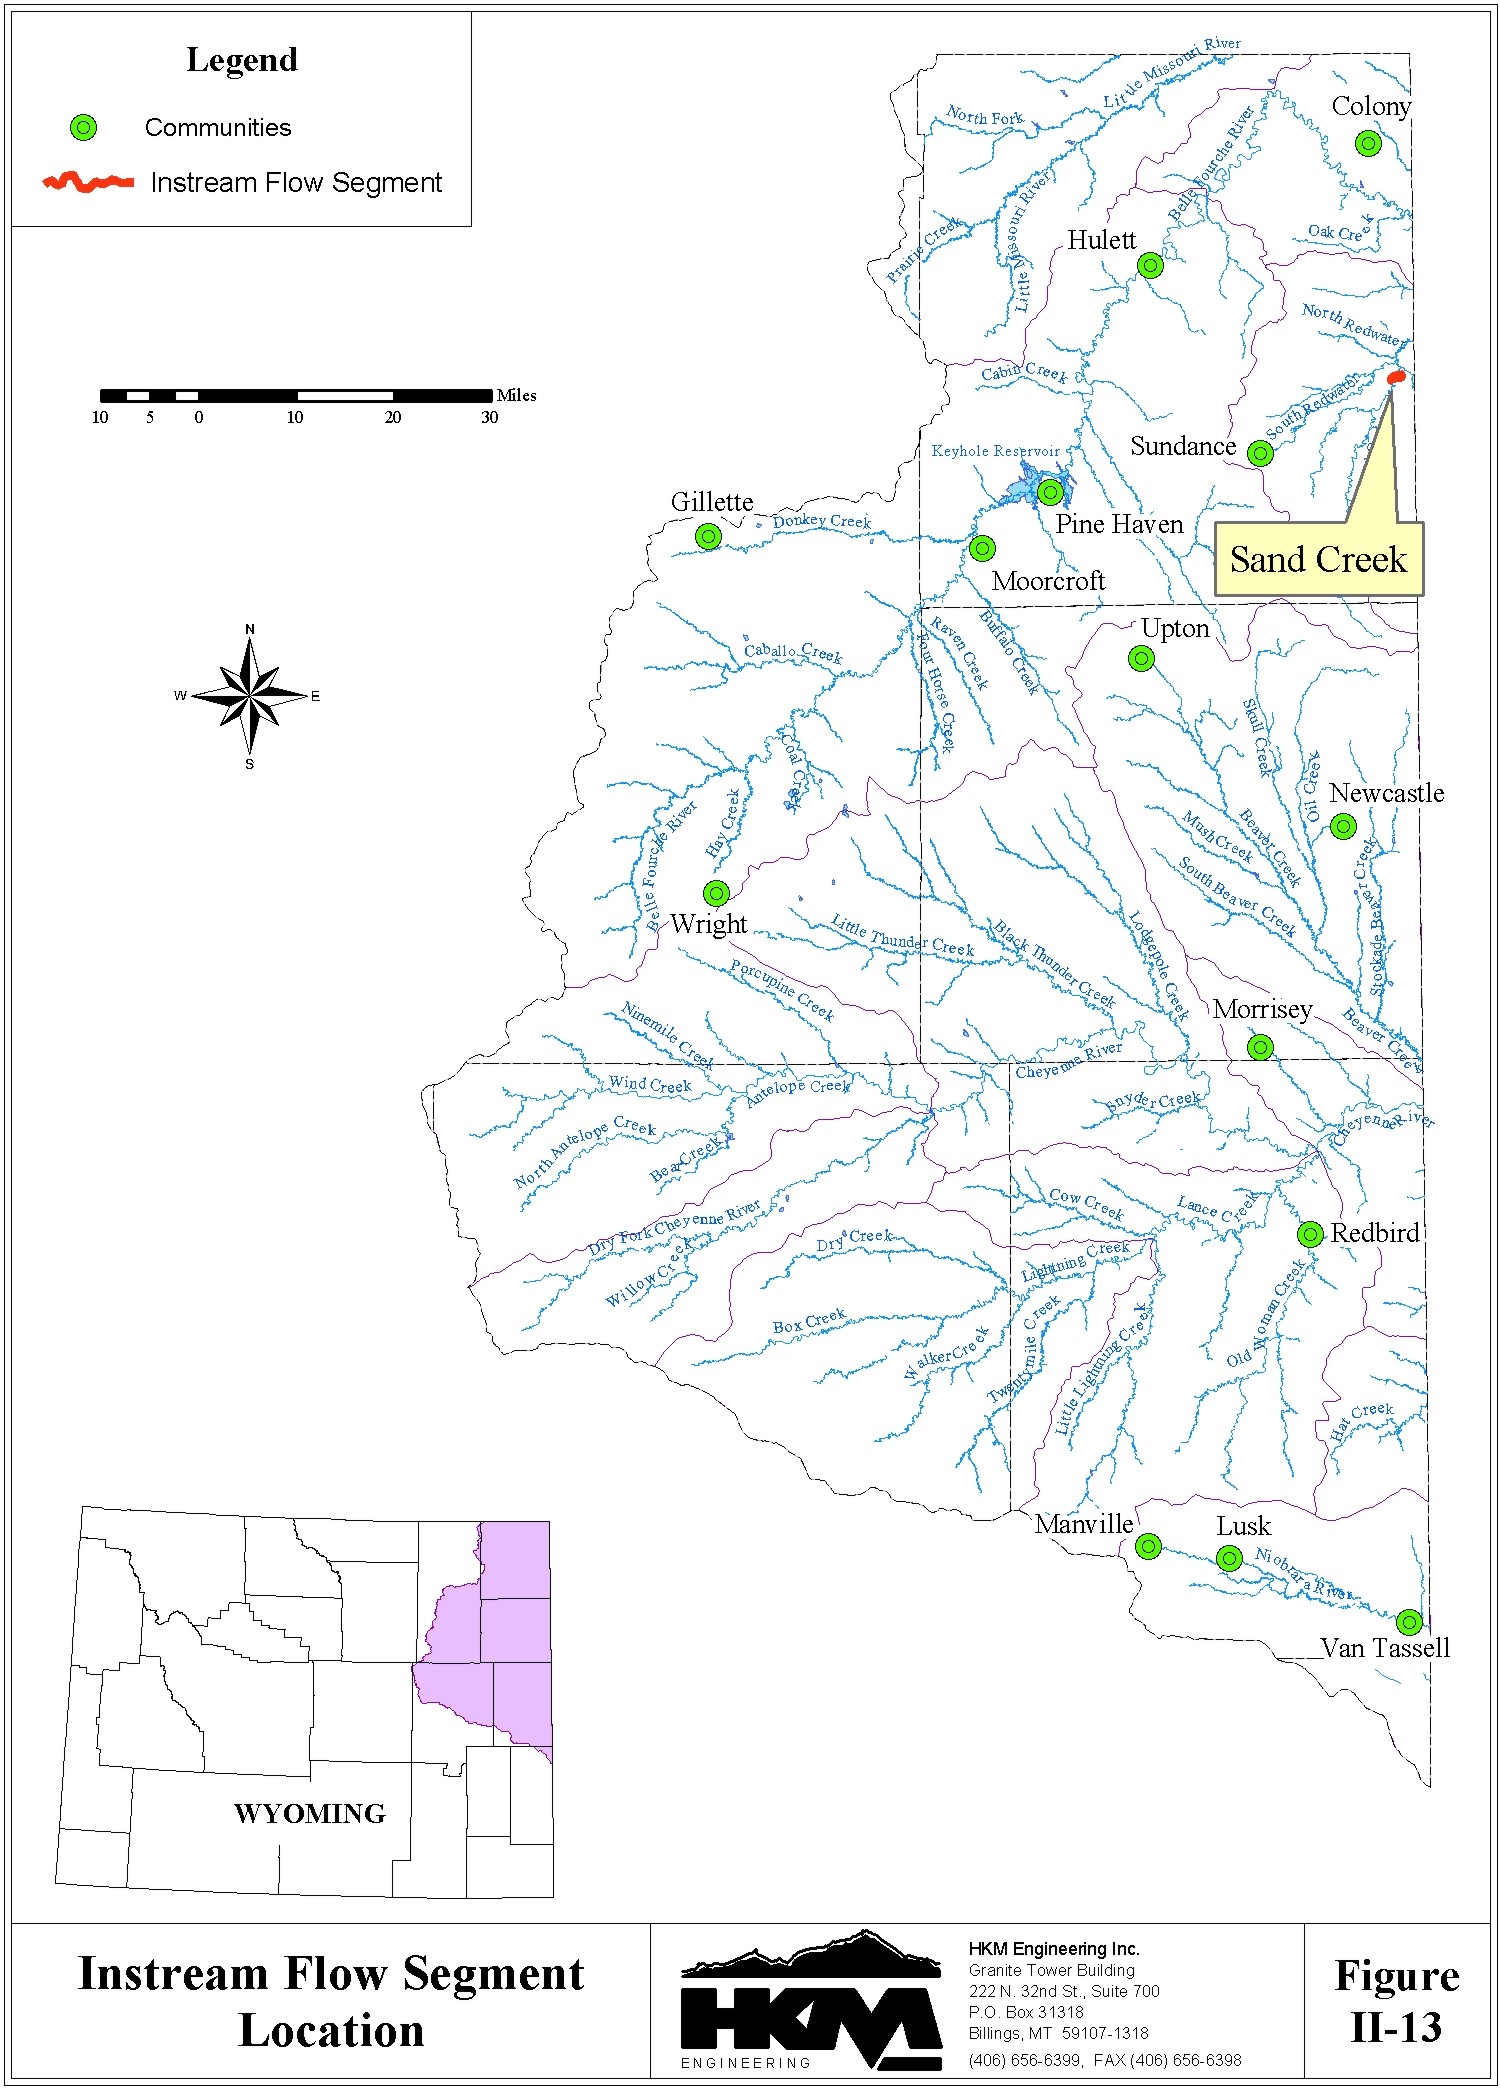
The single instream flow segment in the Northeast Wyoming River Basins is described in Table II-10 and shown on Figure II-13. The Wyoming State Engineer's Office has granted a water right for this segment.
Table II-10
Instream Flow Water Rights
| Stream | Location | Flow/Timing | Priority |
| Redwater Creek in the Sand Creek Drainage | From the south boundary of the SW ¼ of NE ¼ Section 7, T52N, R60W to the north boundary of the SE ¼ of SW ¼ Section 5, T52N, R60W (2.5 miles long). | 21 cfs, Nov. 1 . Dec. 31 16 cfs, June 1 . April 30 18 cfs, May 1 . Oct. 31 |
12/7/1987 |
Coalbed Methane Water Production
Coalbed methane (CBM) is produced by lowering the pressure over the coal seam through reducing the column of water in the coal aquifer. Environmental concerns related to the water produced from CBM wells fall into two categories: quantity and quality.
Environmental concerns about this quantity of ground water now flowing over the surface include: 1) increased sedimentation in streams; 2) increased erosion in everything from the draws and gullies collecting the discharges to main-stem rivers downstream; 3) constant presence of water over soils in areas historically watered only in brief episodes; and, 4) increased flooding.
Water quality concerns associated with CBM activity include: 1) the interaction of sodium- adsorption ratio (S.A.R.) in the produced water with soils downstream of the discharge; 2) the variable nature of potential pollutants like sodium, barium, iron, and manganese in produced waters; 3) the emergence of salt crusts on newly waterlogged clays; and, 4) the reaction of organisms (from microinvertebrates to fish to humans) to the produced waters in draws, ponds, or rivers.
The Wyoming Department of Environmental Quality (DEQ) has established a general permit for CBM discharge waters. Under this permit operators are required to monitor discharges following a specified schedule, and for specified parameters, to determine if the quality of the discharge is within allowable limits. The coverage of the operators under the general permit is dependent on staying within the limits established by DEQ.
Organizations outside the state government have been calling for more information to form the basis for regulation of CBM produced water. For instance, a memorandum distributed by the Coalbed Methane Coordination Coalition (CBMCC) assesses the need for further research on discharge alternatives:
Watershed-based water management plans and landowner associations are key to controlling impact and taking maximum advantage of produced water. Alternatives to discharge such as irrigation, storage and retrieval, dust control, and fire suppression all must be tested and evaluated. Consideration must be given to surface water, alluvial underflow, and ground water. The effects of recharge on alluvium are difficult to study yet very important as alluvial aquifers are important for agriculture. On the obverse of the coin, drawdown issues must be addressed in the deeper aquifers. Means to minimize and mitigate transboundary effects on downstream parties must be identified and implemented where appropriate.Wetlands Mapping
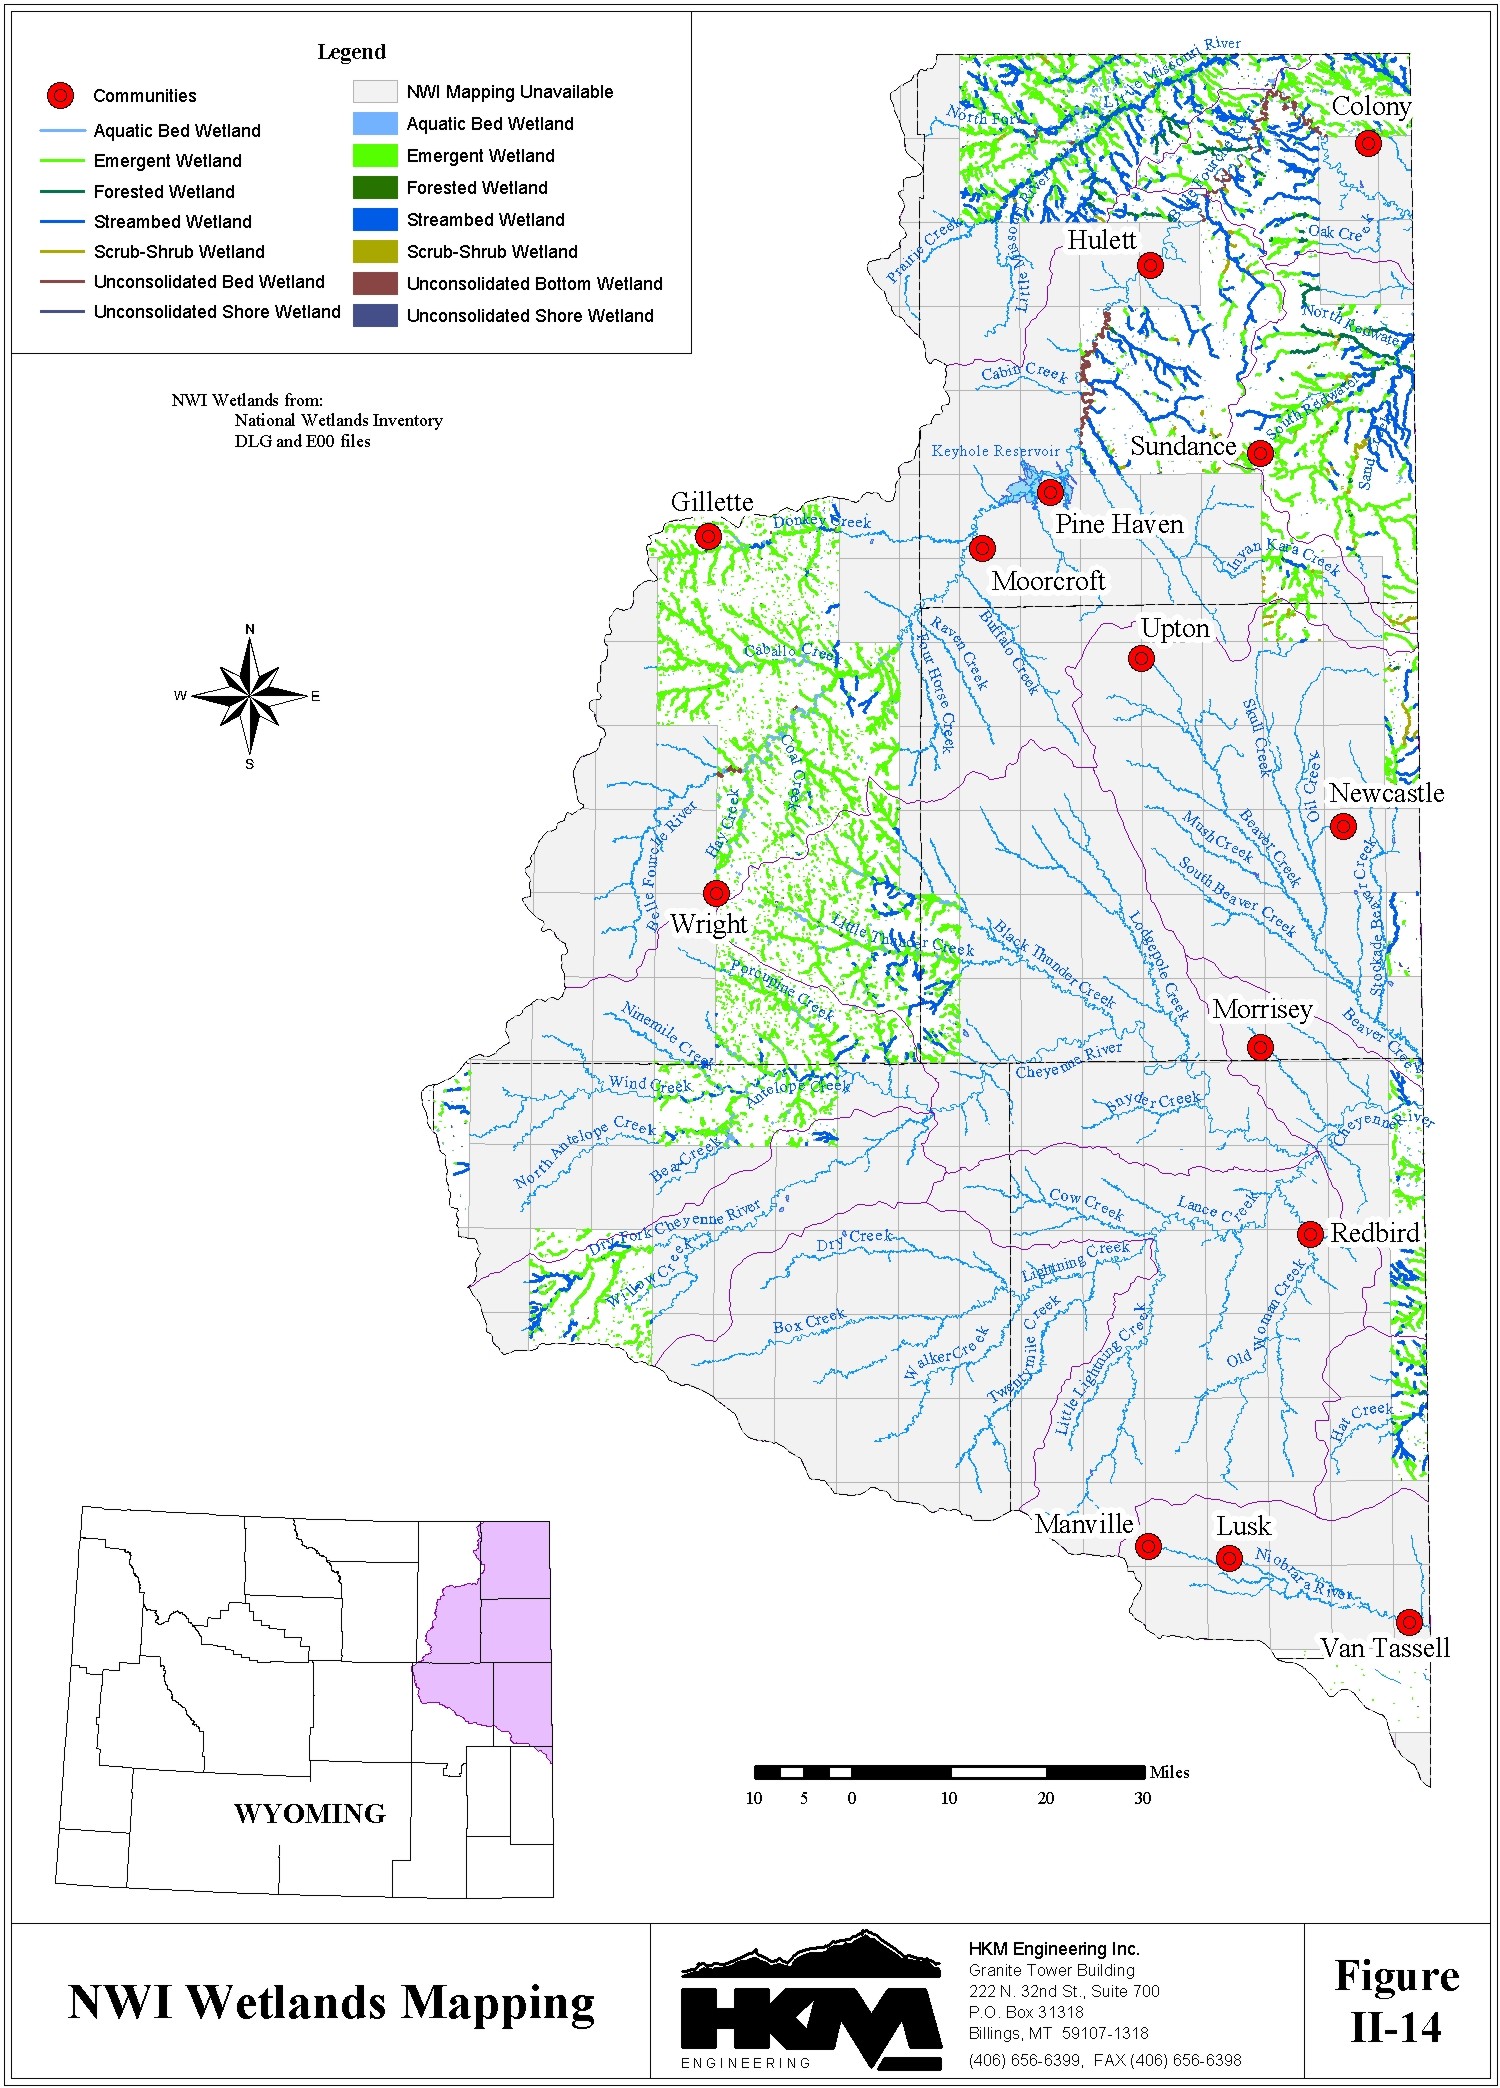
Wetlands are transitional lands between terrestrial and aquatic systems where the water table is usually at or near the surface or the land is covered by shallow water. For purposes of the classification, wetlands must have one or more of the following three attributes:
Comments and Concerns
As part of this task, groups with environmental concerns were identified and contacted to solicit comments and concerns on environmental issues in this basin. Each of the groups were asked the following questions:
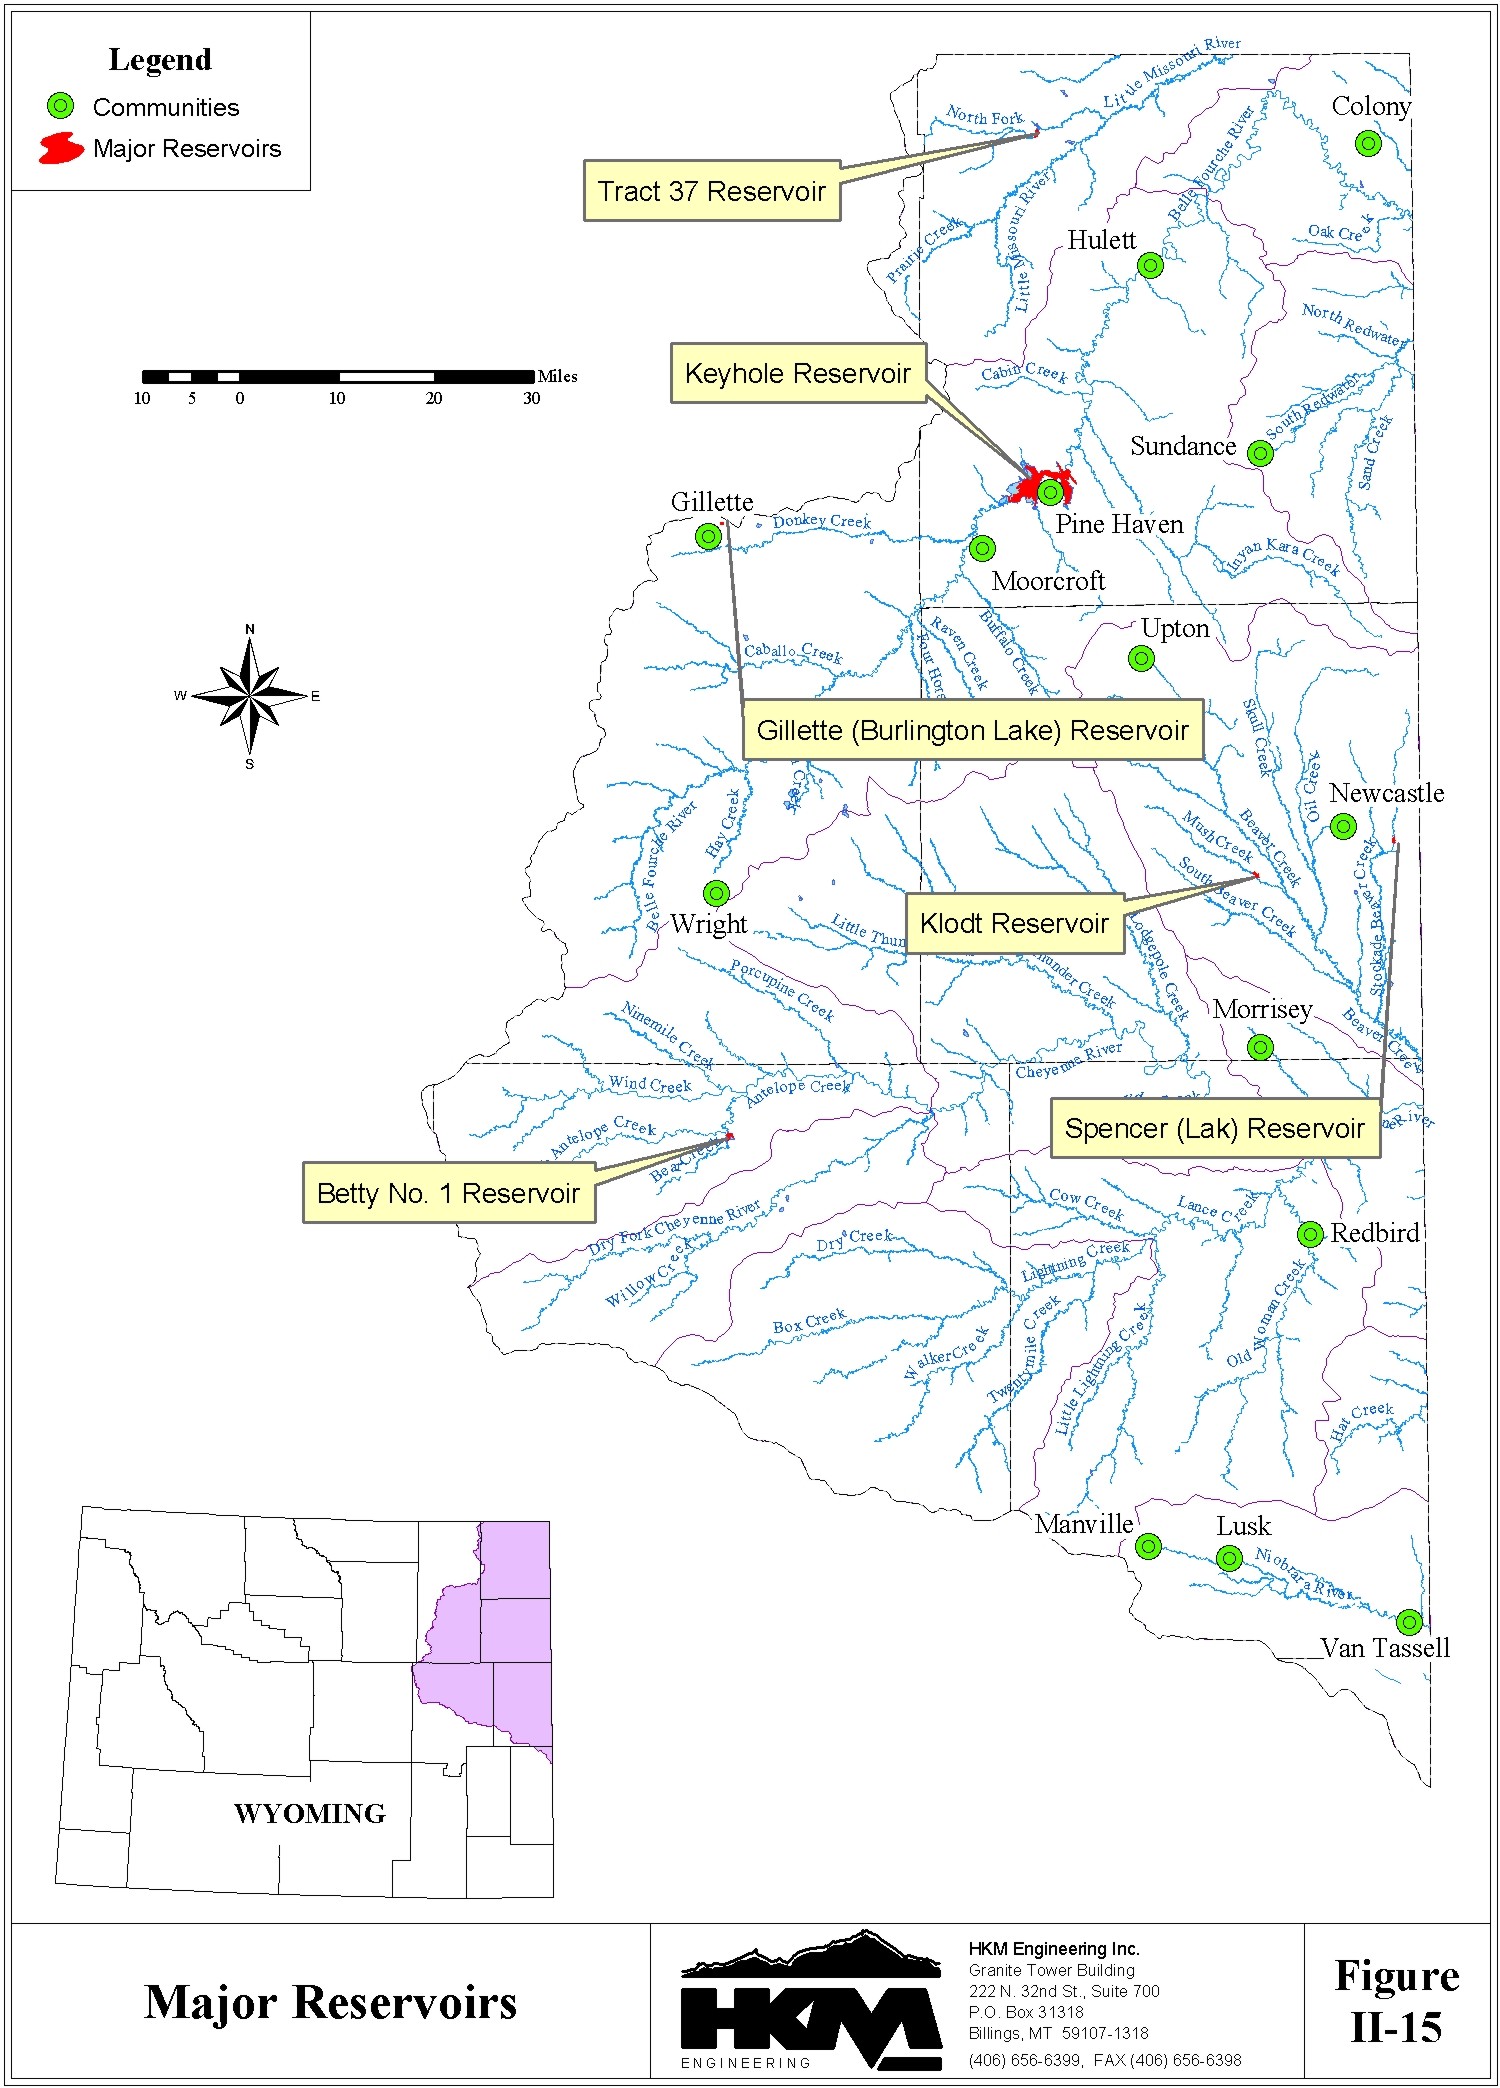
G. Reservoir EvaporationOperation data have been compiled for six key storage facilities within the planning area. The list of reservoirs, developed in coordination with the State Engineer's Office Division 2 personnel, consists of reservoirs with capacities in excess of approximately 1,000 acre-feet. These storage reservoirs are primarily used to supply supplemental water for irrigation. Table II- 11 lists the key storage facilities in the planning area.
Table II-11 Key Storage Reservoirs
| Reservoir | Active Capacity (af) |
Dam Height (ft) |
Surface Area (acres) |
Ann. Net Evap. Loss (af) |
| Betty No. 1 | 1,345 | 32 | 171 | 355 |
| Gillette | 2,080 | 10 | 145 | N.A. |
| Keyhole | 185,800 | 115 | 13,686 | 12,915 |
| Klodt | 980 | 26 | 124 | 317 |
| Spencer | 2,162 | 45 | 126 | 224 |
| Tract 37 | 2,454 | 31 | 302 | 560 |
The locations of these reservoirs are shown on Figure II-15. In addition to the detailed information compiled for these 6 key facilities, statistical data has also been compiled for 209 additional reservoirs with capacities in excess of 50 acre-feet or in excess of 20 feet in height.
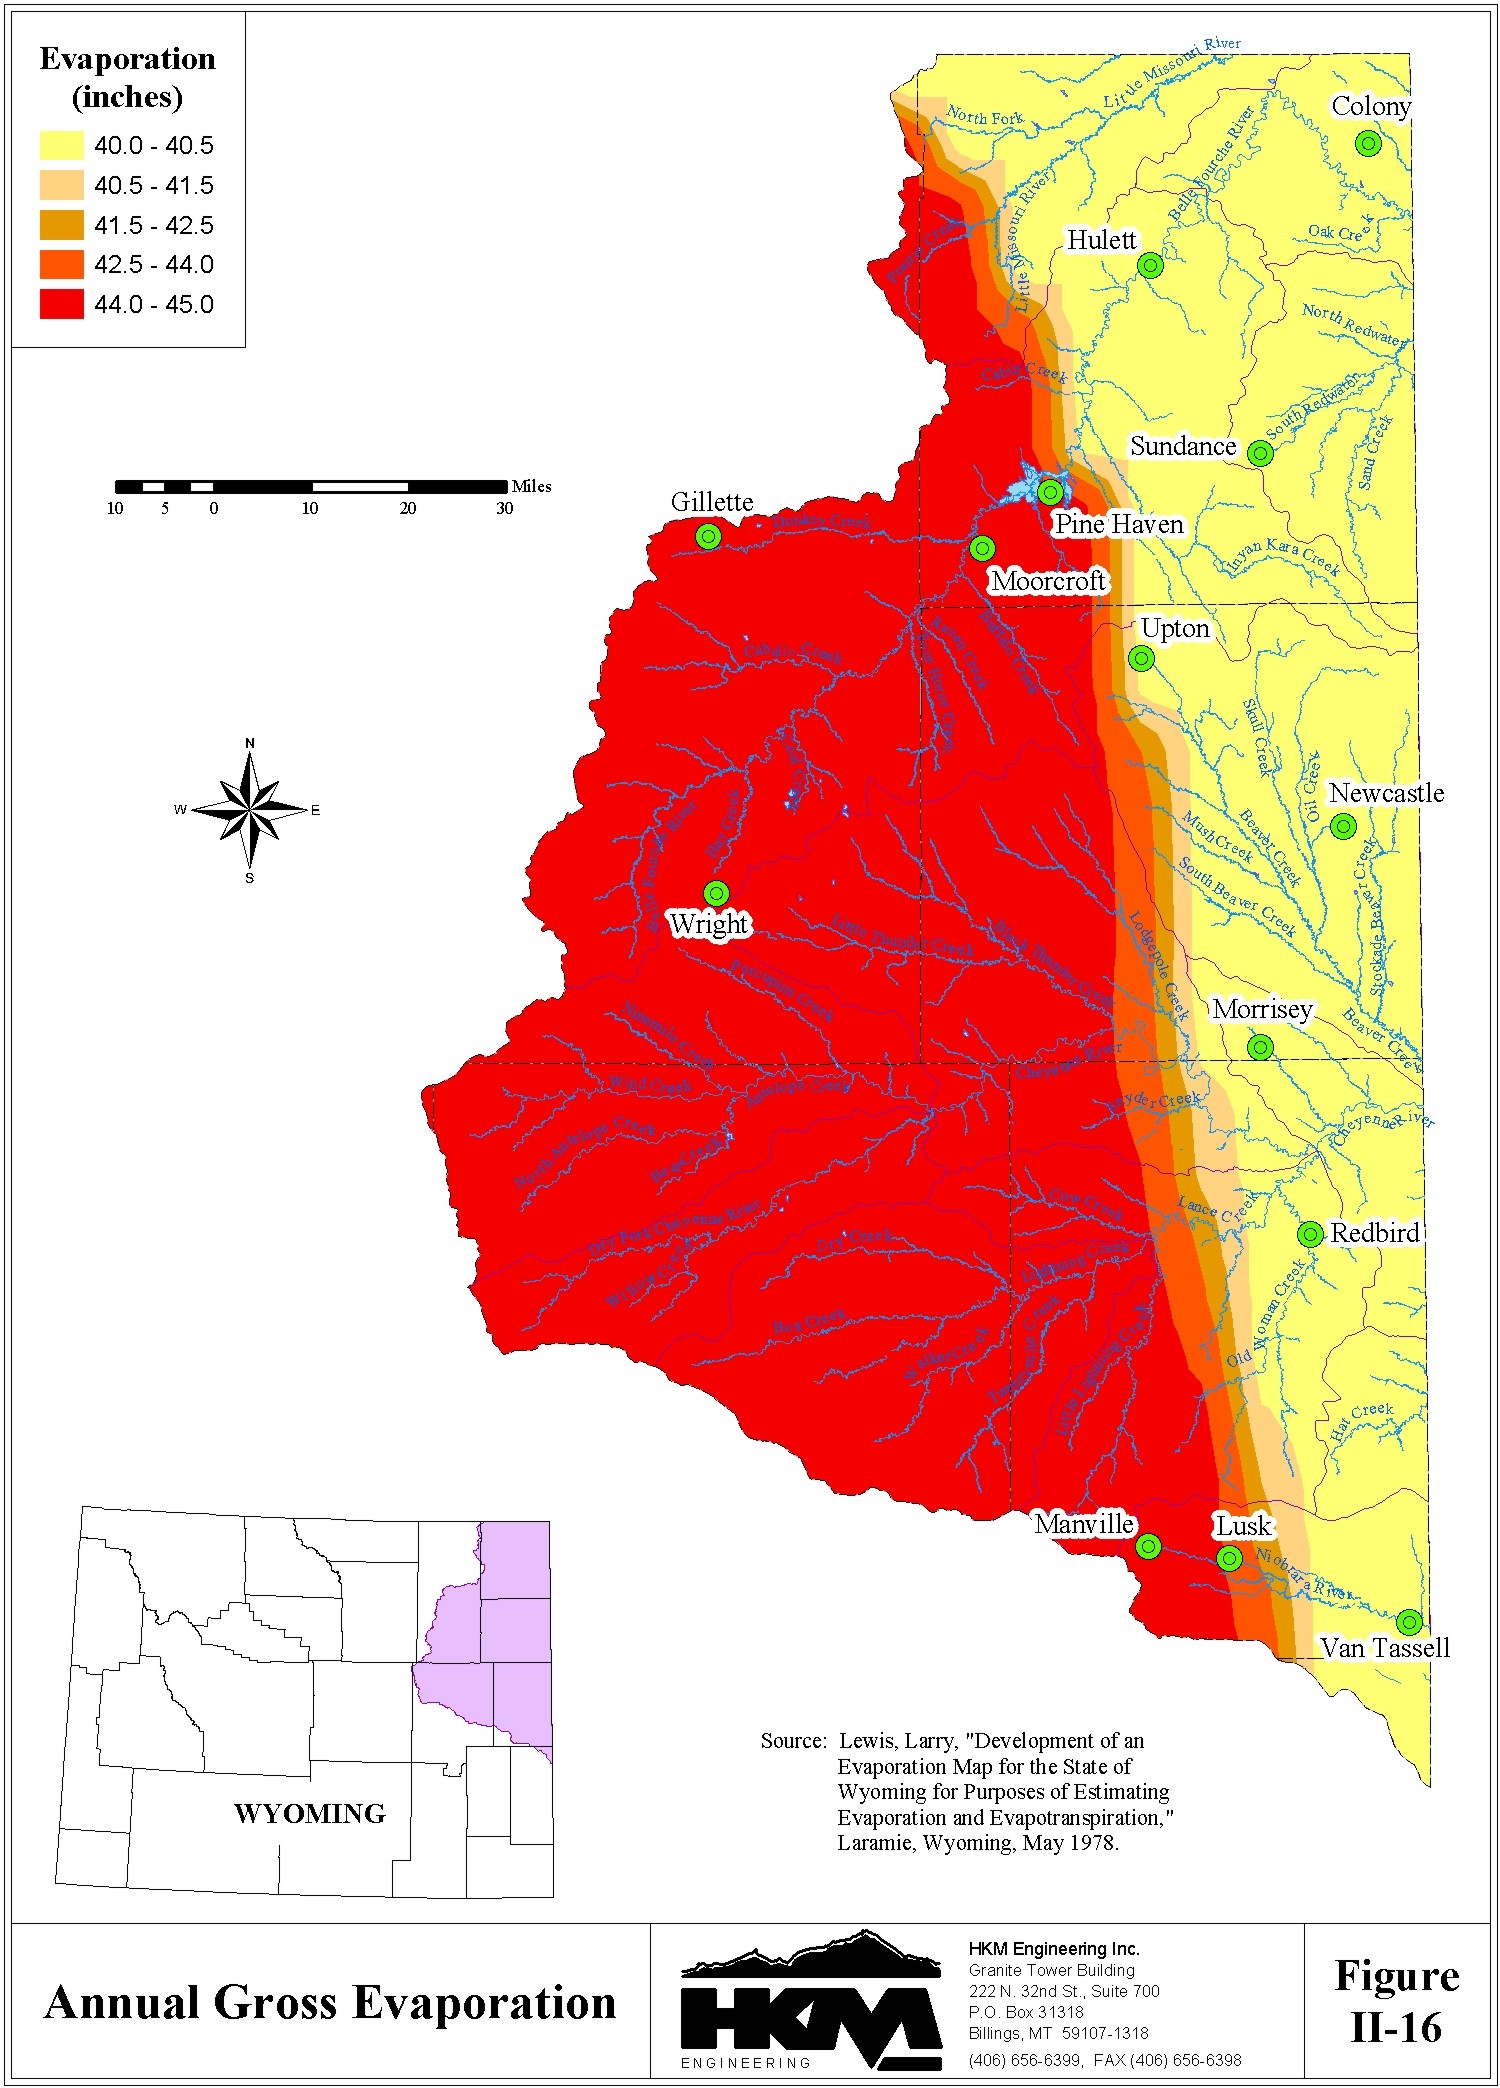
Evaporation from man made storage reservoirs constitutes another consumptive use of water within the planning area. The net evaporation volume from the key storage reservoirs is determined by multiplying the net depth of evaporation (gross evaporation minus precipitation) by the water surface area of the respective reservoirs. Normal precipitation depths across the planning area were shown on Figure I-2. Estimated evaporation across the planning area is shown on Figure II-16.
End-of-month storage records are available only for Keyhole Reservoir. The average, monthly water surface area was determined for Keyhole using these records and when multiplied by the net monthly evaporation loss, yielded total evaporation volume.
A relationship between average monthly end-of-month storage to total reservoir capacity was developed for Keyhole Reservoir to provide a basis for estimating average monthly reservoir volumes for the remaining facilities for which records are not available. These monthly proportions were applied to the total reservoir capacities of the remaining 5 facilities in order to make reasonable estimates of monthly storage volumes and the corresponding water surface areas for these facilities as well. With this information, evaporation volumes for the remaining 5 facilities was also determined. Total reservoir evaporation is estimated at 14,400 acre-feet for, the key reservoirs in the planning area (Table II-11).
Stock Pond Evaporation
Evaporation from stock ponds is considered to be a relatively minor contributor to total water consumption in most river basins in the State. However, given the relative scarcity of surface water in the Northeast Wyoming River Basins planning area, together with the large number of stock ponds that exist, the accumulative evaporation loss from these ponds is relatively significant. Two information bases were utilized to estimate evaporative loss from stock ponds:
The digital base maps are a digital representation of the 1: 24,000 scale, United States Geological Survey (USGS) 7 ½ minute quadrangle maps and show stock ponds to the extent that they have been mapped by the USGS.
Stock ponds, as defined by the SEO, are limited to those impoundments with a total capacity of 20 acre-feet or less. Further, the Belle Fourche River Compact permits Wyoming's unlimited use of stock water reservoirs not exceeding 20 acre-feet in capacity. This 20 acre-foot capacity then defines the upper limit of the reservoirs that are the target of this analysis. The mapped ponds provide information regarding the maximum surface area but no information regarding the capacity of each pond. The SEO database of permitted stock ponds, however, provides capacity information, albeit, only for those stock ponds which were permitted as of December 2000. There were a total of 5,093 permitted stock ponds in the Northeast Wyoming River Basins planning area as of this date.
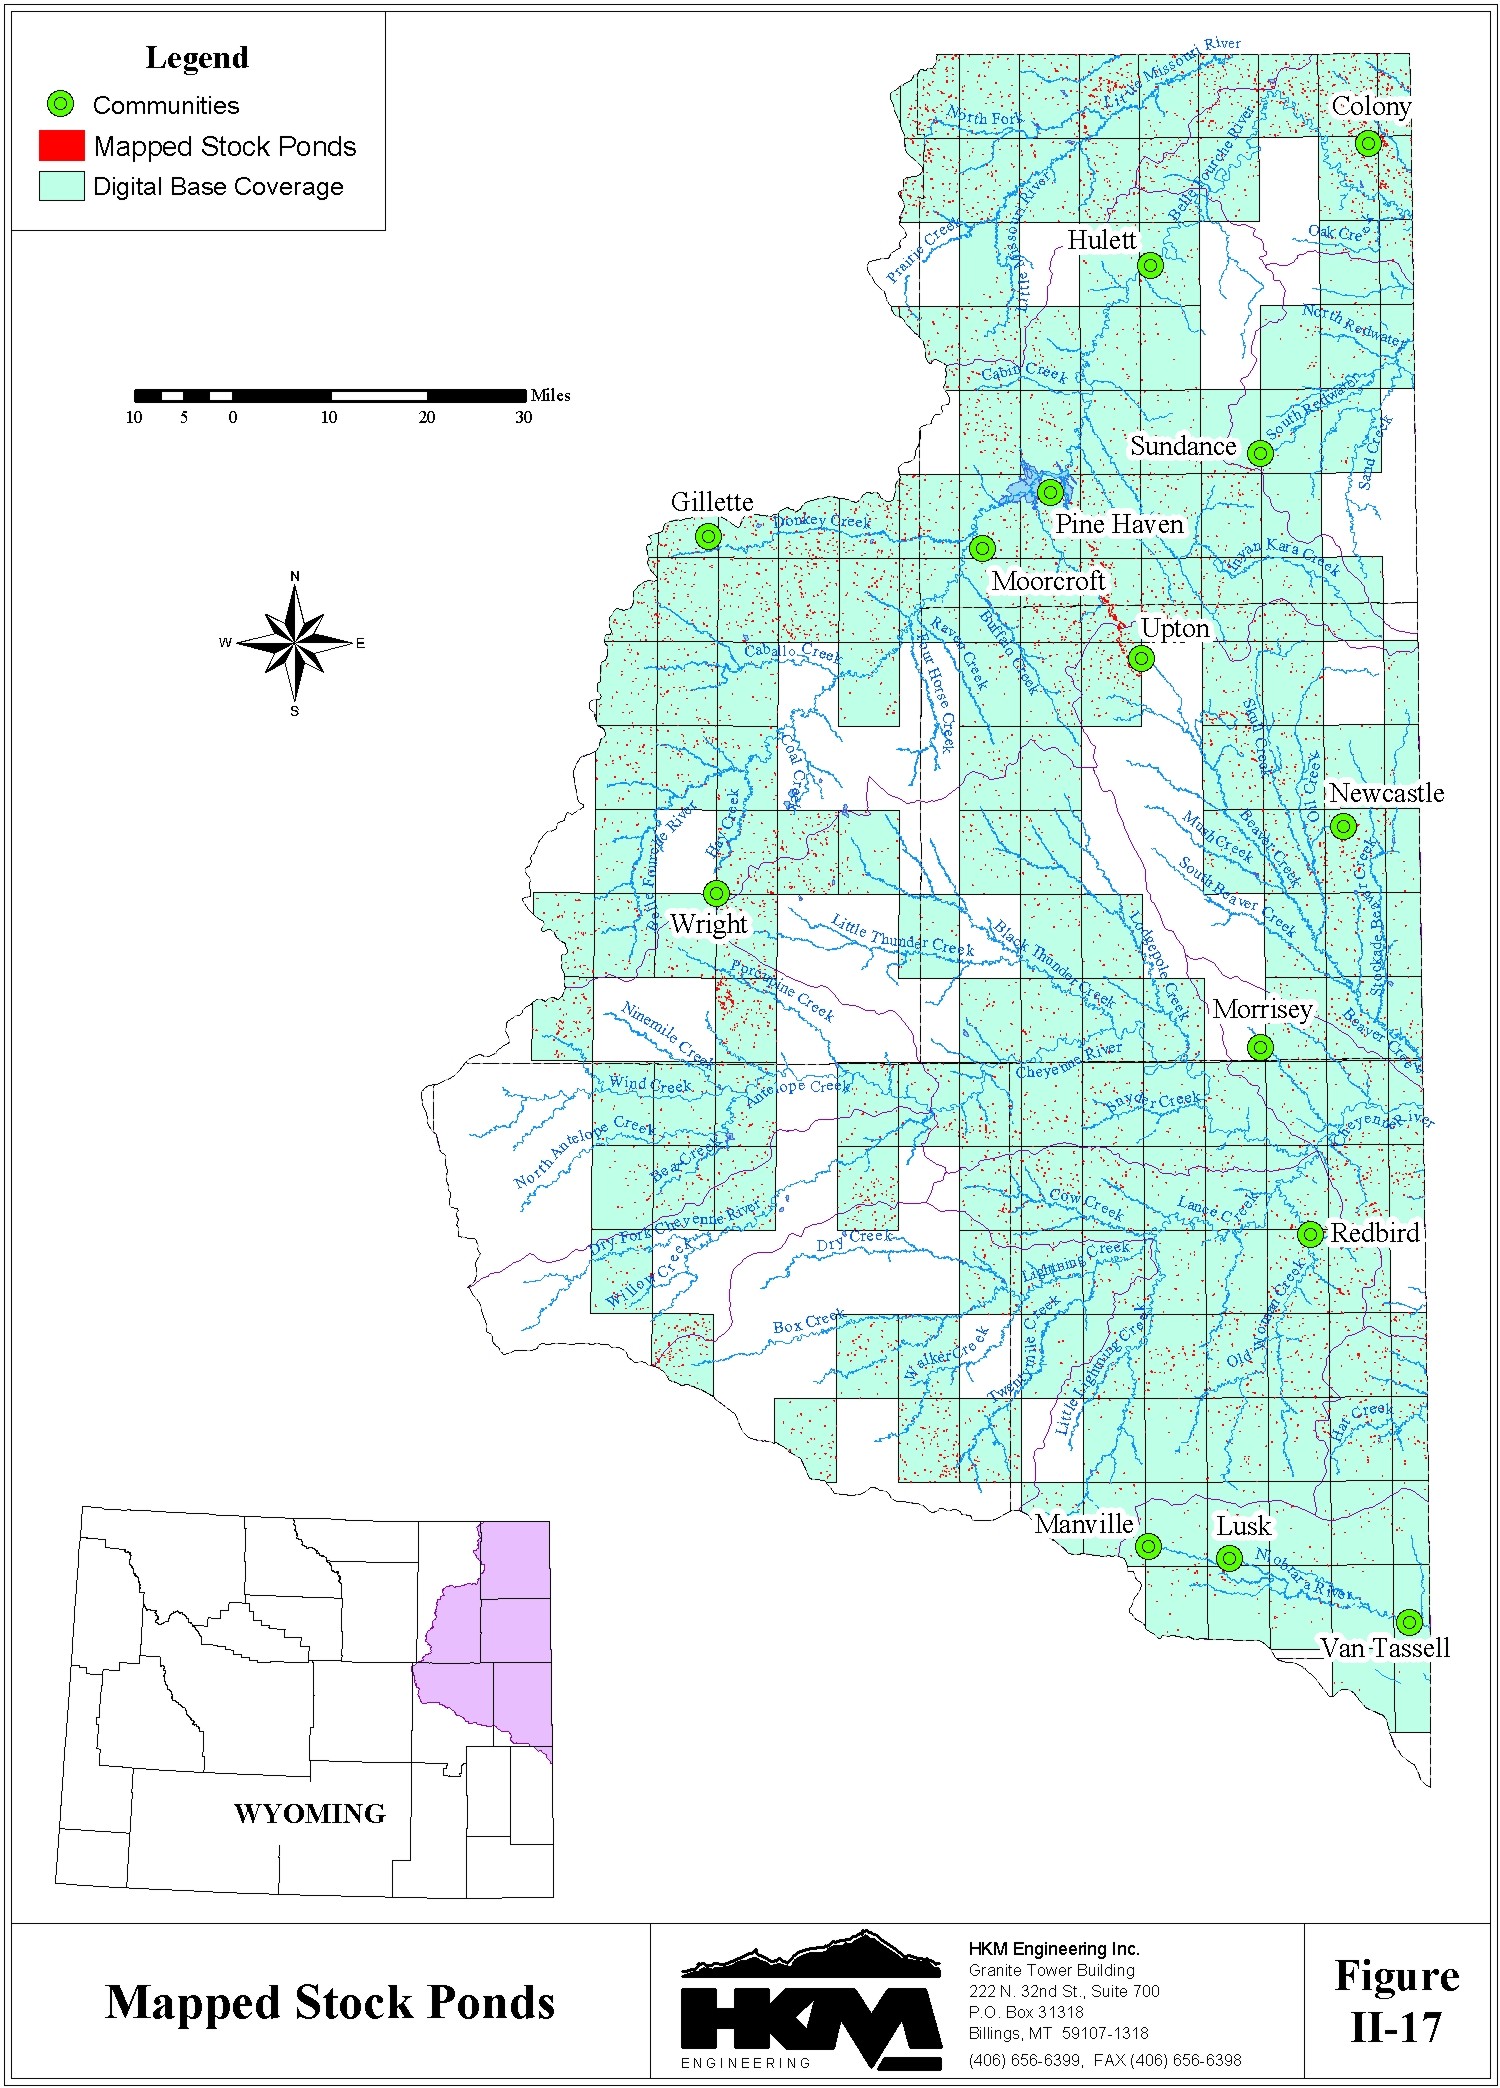
The inventory of mapped stock ponds can only be performed for those areas of the planning area where digital base maps were acquired for this study. The extent of the digital base map coverage is shown on Figure II-4 and covers roughly 74% of the total geographic area. Information provided in the SEO permit database was joined with the stock ponds included on the digital base maps. With this information, the permitted capacity was related to the mapped surface area of the stock ponds to determine the typical maximum surface area of stock ponds as defined for this analysis (20 acre-feet and less). Only those ponds on the digital base maps with maximum surface areas of 6 acres or less were considered to be stock ponds as defined here. The mapped stock ponds are illustrated on Figure II-17.
Reservoir evaporation from the stock ponds was determined using the method previously described for the major reservoirs. The maximum reservoir surface areas were, however, first reduced to reflect the fact that the stock ponds are typically only full for a short time each year. Based on input from the Basin Advisory Group, it is assumed that the typical stock pond is empty on May 1st, is full on June 1st, and gradually empties until it's dry on August 1st. The total volume of stock pond evaporation for the portion of the basin covered by digital base maps is estimated at 4,640 acre-feet. Extrapolating out for the remaining 26% of the planning area not covered by digital base maps, it is estimated that the total volume of stock pond evaporation for the Northeast Wyoming River Basins planning area is 6,300 acre-feet from 16,600 stock ponds.
The total annual volume of reservoir evaporation for the planning area including the major reservoirs and the small stock ponds is 20,700 acre-feet.
H. Basin Water Use SummaryTable II-12 summarizes the water consumption (depletions) for the various existing uses in the planning area.
Table II-12
Summary of Current Water Uses
| Dry | Normal | Wet | |||||
| (AF/Year) | |||||||
| Water Use | Surface Water |
Ground Water |
Surface Water |
Ground Water |
Surface Water |
Ground Water | |
| Agricultural | 65,000 | 11,000 | 69,000 | 17,000 | 71,000 | 17,000 | |
| Municipal | --- | 9,100 | -- | 9,100 | --- | 9,100 | |
| Domestic | --- | 3,600 | --- | 3,600 | --- | 3,600 | |
| Industrial | Oil & Gas1 | --- | 46,000 | --- | 46,000 | --- | 46,000 |
| Other2 | --- | 4,700 | --- | 4,700 | --- | 4,700 | |
| Recreation | Non-consumptive | ||||||
| Environmental | Non-consumptive | ||||||
| Evaporation | Key Reservoirs | 14,000 | --- | 14,000 | --- | 14,000 | --- |
| Stock Ponds | 6,300 | --- | 6,300 | --- | 6,300 | --- | |
| TOTAL | 85,300 | 74,400 | 89,300 | 80,400 | 91,300 | 80,400 | |
Notes: 1. Includes conventional oil and gas production water and CBM production water.
2. Includes electricity generation, coal mining, and oil refining.