Wyoming State Water Plan
Wyoming State Water Plan
Wyoming Water Development Office
6920 Yellowtail Rd
Cheyenne, WY 82002
Phone: 307-777-7626

Wyoming Water Development Office
6920 Yellowtail Rd
Cheyenne, WY 82002
Phone: 307-777-7626


| SUBJECT: | Green River Basin Plan Irrigation Diversion Operation and Description |
| PREPARED BY: | Pat Tyrrell, Jennifer Russell, States West Water Resources |
Alexander Ditch, West Fork New Fork River
Diversion Description: Diversion consists of a 6' wide wood gate.1
Conveyance Description: Open Channel Canal, approximately 1 mile in length.1
Wyoming Water Rights Summary:
| Priority Date (M-D-Y) | Permit Number |
Permitted Use | Acres | Flow (cfs) |
Cumulative Flow (cfs) | Comments |
| 07-03-1896 | 1281 | Irrigation | 520.00 | 7.40 | 7.40 | POD/MOC change from a portion of W.F. Irrigation Ditch. |
| 03-15-1901 | 3081 | Irrigation | 320.00 | 4.57 | 11.97 | POD/MOC change from a portion of Luman Ditch. |
| 03-15-1901 | 3082 | Irrigation | 160.00 | 2.28 | 14.25 | POD/MOC change from a portion of Luman No. 2 Ditch |
| 11-11-1903 | 5855 | Irrigation | 14.25 | 11.12 AF Secondary Supply from New Fork Lake Reservoir (480R) (8.00 acres served) | ||
| 11-11-1903 | 4865E | Irrigation | 14.25 | 107.44 AF Secondary Supply from New Fork Lake Reservoir (480R) (77.30 acres served) | ||
| 02-02-1915 | 13032 | Domestic, Irrigation | 13.00 | 0.18 | 14.43 | |
| 06-11-1929 | 4836E | Irrigation | 51.90 | 0.74 | 15.17 |
Storage Rights: New Fork Lake Reservoir.
Estimated Canal Losses: Typical losses (10%) are experienced.1
Irrigation Practices: Lands are flood irrigated.1
Crop Types / Consumptive Use: Lands are native grass hay and pasture.1
Return Flows: Return flows are delivered to West Fork New Fork River at Beeline Ditch.2
Other Operational Information: The canal is typically turned on in late May and irrigation flows stop in late July. Stock flows continue until October.1
Note: There are two ditches with the name of Alexander on the West Fork New Fork River. This memo describes the larger (lower) ditch. The other ditch has a headgate located at Section 32, Township 36, Range 110, and has a total permitted flow of 1.20 cfs.
|
Alexander Ditch, West Fork New Fork River, Diversion Data
| Wateryear | May | June | July | August | September | |||||
| Average (cfs) | Monthly Total (AF) | Average (cfs) | Monthly Total (AF) | Average (cfs) | Monthly Total (AF) | Average (cfs) | Monthly Total (AF) | Average (cfs) | Monthly Total (AF) | |
| 1980 | ||||||||||
| 1981 | ||||||||||
| 1982 | ||||||||||
| 1983 | ||||||||||
| 1984 | 21.17 | 1,259.90 | 9.57 | 588.28 | 0.59 | 36.28 | 4.39 | 261.42 | ||
| 1985 | 20.85 | 1,240.46 | 8.82 | 542.48 | 0.76 | 47.01 | 2.03 | 121.05 | ||
| 1986 | 23.06 | 1,371.97 | 12.23 | 751.80 | 1.10 | 67.93 | 3.08 | 183.29 | ||
| 1987 | 6.81 | 418.85 | 19.28 | 1,147.26 | 9.65 | 593.32 | 1.41 | 86.82 | 3.21 | 191.21 |
| 1988 | ||||||||||
| 1989 | ||||||||||
| 1990 | ||||||||||
| 1991 | ||||||||||
| 1992 | ||||||||||
| 1993 | ||||||||||
| 1994 | 0.00 | 0.00 | 5.12 | 304.66 | 14.46 | 889.11 | 2.35 | 144.50 | ||
| 1995 | ||||||||||
| 1996 | ||||||||||
| 1997 | ||||||||||
| 1998 | ||||||||||
| Averages: | 3.41 | 209.43 | 17.90 | 1,064.85 | 10.95 | 673.00 | 1.24 | 76.51 | 3.18 | 189.24 |
Data:
1994: 5/13, 6/13, dry; 7/2, 18.00 cfs; 7/22, 14.00 cfs; 8/15, dry; 9/7, 2.50 cfs.
Supply: 1980, below average; 1981, slightly below average; 1982, average (late peak); 1983, above average; 1984, above average; 1985, below average; 1986, average to slightly above average; 1988: very below average; 1989, below average; 1990, below average; 1991, slightly below average; 1992, below average; 1993, average; 1994, below average; 1995, average to above average; 1996, average; 1997, average; 1998, average to above average.
Source: State Engineer's Office, Annual Hydrographers' Reports.
| ALEXANDER DITCH | STATION NO. 0077115.00 |
| LATITUDE 42-59-51 LONGITUDE 109-58-39 | |
| SW1/4SE1/4 SECTION 34 TOWNSHIP 35 N, RANGE 110 W 6TH P.M. | |
| ELEVATION 7350.00 FT DRAINAGE AREA UNKNOWN | |
| NONCONTRIBUTING 0.00 SQ MI BASIN 15570000 | |
| SUBLETTE COUNTY DATA FROM WWRC (C) | |
| ***TO USE THIS DATA, SEE VIC HASFURTHER*** |
| MEAN DAILY FLOW IN CFS BY WATER YEAR | |||||||||||||
| 1984 | |||||||||||||
| DAY | OCT | NOV | DEC | JAN | FEB | MAR | APR | MAY | JUNE | JULY | AUG | SEPT | DAY |
| 1 | ** | ** | ** | ** | ** | ** | ** | ** | 23.50 | 20.10 | 0.59 | 0.59 | 1 |
| 2 | ** | ** | ** | ** | ** | ** | ** | ** | 23.50 | 20.90 | 0.59 | 0.59 | 2 |
| 3 | ** | ** | ** | ** | ** | ** | ** | ** | 23.50 | 21.40 | 0.59 | 1.33 | 3 |
| 4 | ** | ** | ** | ** | ** | ** | ** | ** | 20.90 | 25.20 | 0.59 | 4.58 | 4 |
| 5 | ** | ** | ** | ** | ** | ** | ** | ** | 20.10 | 25.40 | 0.59 | 4.58 | 5 |
| 6 | ** | ** | ** | ** | ** | ** | ** | ** | 24.00 | 25.40 | 0.59 | 4.04 | 6 |
| 7 | ** | ** | ** | ** | ** | ** | ** | ** | 23.00 | 24.60 | 0.59 | 4.25 | 7 |
| 8 | ** | ** | ** | ** | ** | ** | ** | ** | 22.20 | 24.30 | 0.59 | 4.46 | 8 |
| 9 | ** | ** | ** | ** | ** | ** | ** | ** | 21.60 | 13.20 | 0.59 | 5.04 | 9 |
| 10 | ** | ** | ** | ** | ** | ** | ** | ** | 22.40 | 4.58 | 0.59 | 5.28 | 10 |
| 11 | ** | ** | ** | ** | ** | ** | ** | ** | 22.70 | 4.58 | 0.59 | 5.41 | 11 |
| 12 | ** | ** | ** | ** | ** | ** | ** | ** | 21.60 | 4.58 | 0.59 | 6.20 | 12 |
| 13 | ** | ** | ** | ** | ** | ** | ** | ** | 20.40 | 4.58 | 0.59 | 5.66 | 13 |
| 14 | ** | ** | ** | ** | ** | ** | ** | ** | 19.60 | 7.53 | 0.59 | 5.53 | 14 |
| 15 | ** | ** | ** | ** | ** | ** | ** | ** | 19.40 | 18.20 | 0.59 | 5.53 | 15 |
| 16 | ** | ** | ** | ** | ** | ** | ** | ** | 22.20 | 15.60 | 0.59 | 5.53 | 16 |
| 17 | ** | ** | ** | ** | ** | ** | ** | ** | 22.20 | 15.80 | 0.59 | 5.04 | 17 |
| 18 | ** | ** | ** | ** | ** | ** | ** | ** | 21.40 | 9.22 | 0.59 | 5.04 | 18 |
| 19 | ** | ** | ** | ** | ** | ** | ** | ** | 19.40 | 1.02 | 0.59 | 4.92 | 19 |
| 20 | ** | ** | ** | ** | ** | ** | ** | ** | 19.20 | 0.91 | 0.59 | 5.16 | 20 |
| 21 | ** | ** | ** | ** | ** | ** | ** | 2.61 | 19.20 | 0.94 | 0.59 | 5.93 | 21 |
| 22 | ** | ** | ** | ** | ** | ** | ** | 3.45 | 19.60 | 0.87 | 0.59 | 5.79 | 22 |
| 23 | ** | ** | ** | ** | ** | ** | ** | 4.46 | 19.60 | 0.94 | 0.59 | 7.53 | 23 |
| 24 | ** | ** | ** | ** | ** | ** | ** | 5.66 | 20.40 | 0.87 | 0.59 | 7.53 | 24 |
| 25 | ** | ** | ** | ** | ** | ** | ** | 5.66 | 21.40 | 0.87 | 0.59 | 4.80 | 25 |
| 26 | ** | ** | ** | ** | ** | ** | ** | 4.69 | 21.40 | 0.84 | 0.59 | 2.32 | 26 |
| 27 | ** | ** | ** | ** | ** | ** | ** | 10.70 | 20.90 | 0.84 | 0.59 | 2.32 | 27 |
| 28 | ** | ** | ** | ** | ** | ** | ** | 9.78 | 19.40 | 0.80 | 0.59 | 2.32 | 28 |
| 29 | ** | ** | ** | ** | ** | ** | ** | 9.78 | 19.60 | 0.84 | 0.59 | 2.25 | 29 |
| 30 | ** | ** | ** | ** | ** | ** | ** | 23.00 | 20.90 | 0.84 | 0.59 | 2.25 | 30 |
| 31 | ** | ** | ** | ** | 23.50 | 0.84 | 0.59 | 31 | |||||
| TOTAL | ** | ** | ** | ** | ** | ** | ** | 103.29* | 635.20 | 296.59 | 18.29 | 131.80 | |
| MEAN | ** | ** | ** | ** | ** | ** | ** | 9.39* | 21.17 | 9.57 | 0.59 | 4.39 | |
| AC-FT | ** | ** | ** | ** | ** | ** | ** | 204.87* | 1259.90 | 588.28 | 36.28 | 261.42 | |
| ALEXANDER DITCH | STATION NO. 0077115.00 |
| LATITUDE 42-59-51 LONGITUDE 109-58-39 | |
| SW1/4SE1/4 SECTION 34 TOWNSHIP 35 N, RANGE 110 W 6TH P.M. | |
| ELEVATION 7350.00 FT DRAINAGE AREA UNKNOWN | |
| NONCONTRIBUTING 0.00 SQ MI BASIN 15570000 | |
| SUBLETTE COUNTY DATA FROM WWRC (C) | |
| ***TO USE THIS DATA, SEE VIC HASFURTHER*** |
| MEAN DAILY FLOW IN CFS BY WATER YEAR | |||||||||||||
| 1985 | |||||||||||||
| DAY | OCT | NOV | DEC | JAN | FEB | MAR | APR | MAY | JUNE | JULY | AUG | SEPT | DAY |
| 1 | 2.25 | ** | ** | ** | ** | ** | ** | ** | 25.89 | 0.25 | 0.02 | 1.47 | 1 |
| 2 | 2.32 | ** | ** | ** | ** | ** | ** | ** | 24.96 | 0.19 | 0.02 | 0.63 | 2 |
| 3 | 2.32 | ** | ** | ** | ** | ** | ** | ** | 26.51 | 3.88 | 0.02 | 0.98 | 3 |
| 4 | 2.32 | ** | ** | ** | ** | ** | ** | ** | 26.20 | 20.32 | 0.02 | 1.18 | 4 |
| 5 | 2.39 | ** | ** | ** | ** | ** | ** | ** | 25.27 | 21.15 | 0.03 | 1.32 | 5 |
| 6 | 2.39 | ** | ** | ** | ** | ** | ** | ** | 22.83 | 21.72 | 0.02 | 1.47 | 6 |
| 7 | 2.32 | ** | ** | ** | ** | ** | ** | ** | 22.29 | 21.15 | 0.01 | 1.39 | 7 |
| 8 | 2.25 | ** | ** | ** | ** | ** | ** | ** | 22.00 | 18.96 | 0.01 | 1.47 | 8 |
| 9 | 2.18 | ** | ** | ** | ** | ** | ** | ** | 22.58 | 18.43 | 0.02 | 1.55 | 9 |
| 10 | 2.18 | ** | ** | ** | ** | ** | ** | ** | 22.29 | 18.96 | 0.01 | 1.63 | 10 |
| 11 | 2.12 | ** | ** | ** | ** | ** | ** | ** | 22.29 | 19.77 | 0.02 | 1.71 | 11 |
| 12 | 2.05 | ** | ** | ** | ** | ** | ** | ** | 22.58 | 19.50 | 0.03 | 2.15 | 12 |
| 13 | 1.93 | ** | ** | ** | ** | ** | ** | ** | 22.58 | 18.69 | 0.04 | 1.71 | 13 |
| 14 | 1.87 | ** | ** | ** | ** | ** | ** | ** | 22.83 | 17.91 | 0.06 | 1.55 | 14 |
| 15 | 1.75 | ** | ** | ** | ** | ** | ** | ** | 23.46 | 17.65 | 0.04 | 1.79 | 15 |
| 16 | 1.33 | ** | ** | ** | ** | ** | ** | ** | 24.06 | 16.63 | 0.09 | 2.15 | 16 |
| 17 | 1.33 | ** | ** | ** | ** | ** | ** | ** | 24.36 | 15.89 | 0.14 | 2.15 | 17 |
| 18 | 1.02 | ** | ** | ** | ** | ** | ** | ** | 23.46 | 1.79 | 0.16 | 2.24 | 18 |
| 19 | 0.00 | ** | ** | ** | ** | ** | ** | ** | 20.87 | 0.32 | 0.12 | 2.95 | 19 |
| 20 | 0.00 | ** | ** | ** | ** | ** | ** | ** | 19.23 | 0.16 | 0.07 | 2.34 | 20 |
| 21 | 0.00 | ** | ** | ** | ** | ** | ** | ** | 17.65 | 0.07 | 1.79 | 2.64 | 21 |
| 22 | 0.00 | ** | ** | ** | ** | ** | ** | 7.39 | 17.39 | 0.07 | 1.71 | 3.52 | 22 |
| 23 | 0.00 | ** | ** | ** | ** | ** | ** | 7.34 | 17.39 | 0.02 | 1.79 | 3.06 | 23 |
| 24 | 0.00 | ** | ** | ** | ** | ** | ** | 7.34 | 17.91 | 0.00 | 1.88 | 2.74 | 24 |
| 25 | 0.00 | ** | ** | ** | ** | ** | ** | 13.30 | 23.46 | 0.00 | 1.97 | 2.74 | 25 |
| 26 | 0.00 | ** | ** | ** | ** | ** | ** | 15.40 | 24.06 | 0.00 | 2.15 | 2.74 | 26 |
| 27 | 0.00 | ** | ** | ** | ** | ** | ** | 17.39 | 23.46 | 0.00 | 2.54 | 2.95 | 27 |
| 28 | ** | ** | ** | ** | ** | ** | ** | 17.39 | 16.38 | 0.00 | 2.74 | 2.95 | 28 |
| 29 | ** | ** | ** | ** | ** | ** | ** | 18.17 | 0.80 | 0.00 | 2.15 | 2.15 | 29 |
| 30 | ** | ** | ** | ** | ** | ** | ** | 31.43 | 0.36 | 0.01 | 2.06 | 1.71 | 30 |
| 31 | ** | ** | ** | ** | 29.08 | 0.01 | 1.97 | 31 | |||||
| TOTAL | 36.32* | ** | ** | ** | ** | ** | ** | 164.23* | 625.40 | 273.50 | 23.70 | 61.03 | |
| MEAN | 1.35* | ** | ** | ** | ** | ** | ** | 16.42* | 20.85 | 8.82 | 0.76 | 2.03 | |
| AC-FT | 72.04* | ** | ** | ** | ** | ** | ** | 325.75* | 1240.46 | 542.48 | 47.01 | 121.05 | |
| ALEXANDER DITCH | STATION NO. 0077115.00 |
| LATITUDE 42-59-51 LONGITUDE 109-58-39 | |
| SW1/4SE1/4 SECTION 34 TOWNSHIP 35 N, RANGE 110 W 6TH P.M. | |
| ELEVATION 7350.00 FT DRAINAGE AREA UNKNOWN | |
| NONCONTRIBUTING 0.00 SQ MI BASIN 15570000 | |
| SUBLETTE COUNTY DATA FROM WWRC (C) | |
| ***TO USE THIS DATA, SEE VIC HASFURTHER*** |
| MEAN DAILY FLOW IN CFS BY WATER YEAR | |||||||||||||
| 1986 | |||||||||||||
| DAY | OCT | NOV | DEC | JAN | FEB | MAR | APR | MAY | JUNE | JULY | AUG | SEPT | DAY |
| 1 | 1.63 | 1.47 | ** | ** | ** | ** | ** | ** | 10.03 | 28.47 | 0.07 | 2.75 | 1 |
| 2 | 1.71 | 1.63 | ** | ** | ** | ** | ** | ** | 12.99 | 28.47 | 0.09 | 2.75 | 2 |
| 3 | 1.71 | 1.63 | ** | ** | ** | ** | ** | ** | 15.32 | 28.14 | 0.07 | 2.65 | 3 |
| 4 | 1.71 | ** | ** | ** | ** | ** | ** | ** | 17.58 | 28.14 | 0.09 | 2.65 | 4 |
| 5 | 1.71 | ** | ** | ** | ** | ** | ** | ** | 21.98 | 28.47 | 0.11 | 2.75 | 5 |
| 6 | 1.63 | ** | ** | ** | ** | ** | ** | ** | 15.08 | 28.47 | 0.09 | 2.75 | 6 |
| 7 | 2.06 | ** | ** | ** | ** | ** | ** | ** | 25.28 | 25.59 | 0.07 | 2.75 | 7 |
| 8 | 2.24 | ** | ** | ** | ** | ** | ** | ** | 24.36 | 9.45 | 0.07 | 3.08 | 8 |
| 9 | 2.15 | ** | ** | ** | ** | ** | ** | ** | 23.75 | 9.07 | 0.09 | 3.54 | 9 |
| 10 | 2.15 | ** | ** | ** | ** | ** | ** | ** | 21.69 | 8.33 | 0.11 | 3.78 | 10 |
| 11 | 2.06 | ** | ** | ** | ** | ** | ** | ** | 22.27 | 13.21 | 0.32 | 3.78 | 11 |
| 12 | 2.06 | ** | ** | ** | ** | ** | ** | ** | 26.85 | 26.85 | 2.35 | 3.66 | 12 |
| 13 | 1.97 | ** | ** | ** | ** | ** | ** | ** | 29.13 | 26.85 | 2.35 | 3.54 | 13 |
| 14 | 1.88 | ** | ** | ** | ** | ** | ** | ** | 28.14 | 26.85 | 2.45 | 3.42 | 14 |
| 15 | 1.88 | ** | ** | ** | ** | ** | ** | ** | 26.53 | 27.17 | 2.55 | 3.42 | 15 |
| 16 | 1.88 | ** | ** | ** | ** | ** | ** | ** | 25.28 | 18.64 | 2.55 | 3.42 | 16 |
| 17 | 1.88 | ** | ** | ** | ** | ** | ** | ** | 24.05 | 10.23 | 2.65 | 3.42 | 17 |
| 18 | 1.79 | ** | ** | ** | ** | ** | ** | ** | 22.86 | 3.42 | 2.65 | 3.66 | 18 |
| 19 | 1.79 | ** | ** | ** | ** | ** | ** | ** | 21.69 | 1.63 | 2.45 | 3.90 | 19 |
| 20 | 1.71 | ** | ** | ** | ** | ** | ** | ** | 20.55 | 0.19 | 2.35 | 4.16 | 20 |
| 21 | 1.71 | ** | ** | ** | ** | ** | ** | 0.00 | 27.17 | 0.09 | 2.35 | 4.16 | 21 |
| 22 | 1.79 | ** | ** | ** | ** | ** | ** | 0.00 | 27.17 | 0.09 | 2.45 | 3.42 | 22 |
| 23 | 2.06 | ** | ** | ** | ** | ** | ** | 0.16 | 26.53 | 0.14 | 0.85 | 2.35 | 23 |
| 24 | 1.97 | ** | ** | ** | ** | ** | ** | 2.65 | 24.97 | 0.14 | 0.06 | 2.35 | 24 |
| 25 | 1.88 | ** | ** | ** | ** | ** | ** | 2.65 | 25.28 | 0.22 | 0.07 | 2.35 | 25 |
| 26 | 1.79 | ** | ** | ** | ** | ** | ** | 2.65 | 25.59 | 0.19 | 0.09 | 2.35 | 26 |
| 27 | 1.71 | ** | ** | ** | ** | ** | ** | 2.75 | 25.28 | 0.16 | 0.16 | 2.35 | 27 |
| 28 | 1.63 | ** | ** | ** | ** | ** | ** | 1.89 | 24.97 | 0.11 | 0.22 | 2.35 | 28 |
| 29 | 1.25 | ** | ** | ** | ** | ** | ** | 0.53 | 24.97 | 0.09 | 0.29 | 2.45 | 29 |
| 30 | 1.04 | ** | ** | ** | ** | ** | ** | 1.80 | 24.36 | 0.09 | 1.32 | 2.45 | 30 |
| 31 | 1.39 | ** | ** | ** | 7.80 | 0.07 | 2.86 | 31 | |||||
| TOTAL | 55.82 | 4.73* | ** | ** | ** | ** | ** | 22.88* | 691.70 | 379.03 | 34.25 | 92.41 | |
| MEAN | 1.80 | 1.58* | ** | ** | ** | ** | ** | 2.08* | 23.06 | 12.23 | 1.10 | 3.08 | |
| AC-FT | 110.72 | 9.38* | ** | ** | ** | ** | ** | 43.58* | 1371.97 | 751.80 | 67.93 | 183.29 | |
| ALEXANDER DITCH | STATION NO. 0077115.00 |
| LATITUDE 42-59-51 LONGITUDE 109-58-39 | |
| SW1/4SE1/4 SECTION 34 TOWNSHIP 35 N, RANGE 110 W 6TH P.M. | |
| ELEVATION 7350.00 FT DRAINAGE AREA UNKNOWN | |
| NONCONTRIBUTING 0.00 SQ MI BASIN 15570000 | |
| SUBLETTE COUNTY DATA FROM WWRC (C) | |
| ***TO USE THIS DATA, SEE VIC HASFURTHER*** |
| MEAN DAILY FLOW IN CFS BY WATER YEAR | |||||||||||||
| 1987 | |||||||||||||
| DAY | OCT | NOV | DEC | JAN | FEB | MAR | APR | MAY | JUNE | JULY | AUG | SEPT | DAY |
| 1 | 2.45 | 1.97 | ** | ** | ** | ** | ** | ** | 14.91 | 19.40 | 0.07 | 2.83 | 1 |
| 2 | 2.45 | 2.06 | ** | ** | ** | ** | ** | ** | 15.38 | 18.10 | 0.07 | 2.93 | 2 |
| 3 | 2.35 | 1.18 | ** | ** | ** | ** | ** | ** | 16.59 | 7.47 | 0.09 | 4.35 | 3 |
| 4 | 2.35 | 0.25 | ** | ** | ** | ** | ** | ** | 16.34 | 5.02 | 0.11 | 4.75 | 4 |
| 5 | 2.35 | 0.19 | ** | ** | ** | ** | ** | ** | 16.10 | 4.48 | 0.11 | 4.61 | 5 |
| 6 | 2.35 | 0.14 | ** | ** | ** | ** | ** | ** | 18.10 | 4.09 | 0.11 | 4.61 | 6 |
| 7 | 2.35 | 0.11 | ** | ** | ** | ** | ** | ** | 20.75 | 23.59 | 0.11 | 3.85 | 7 |
| 8 | 2.35 | 0.11 | ** | ** | ** | ** | ** | ** | 20.48 | 23.59 | 0.11 | 3.15 | 8 |
| 9 | 2.25 | 0.14 | ** | ** | ** | ** | ** | ** | 21.87 | 23.88 | 0.09 | 3.26 | 9 |
| 10 | 2.06 | 0.16 | ** | ** | ** | ** | ** | ** | 23.59 | 26.90 | 0.09 | 3.26 | 10 |
| 11 | 2.06 | 0.19 | ** | ** | ** | ** | ** | ** | 23.29 | 26.27 | 0.05 | 3.26 | 11 |
| 12 | 2.16 | 0.19 | ** | ** | ** | ** | ** | 1.31 | 22.72 | 25.67 | 0.05 | 3.37 | 12 |
| 13 | 2.06 | 0.22 | ** | ** | ** | ** | ** | 2.32 | 22.72 | 24.77 | 0.09 | 3.43 | 13 |
| 14 | 2.16 | 0.32 | ** | ** | ** | ** | ** | 4.35 | 21.87 | 23.88 | 0.19 | 3.49 | 14 |
| 15 | 2.16 | 0.32 | ** | ** | ** | ** | ** | 6.03 | 19.94 | 25.37 | 0.32 | 3.49 | 15 |
| 16 | 2.16 | 0.44 | ** | ** | ** | ** | ** | 6.50 | 8.16 | 11.39 | 0.19 | 3.61 | 16 |
| 17 | 2.25 | 0.36 | ** | ** | ** | ** | ** | 6.50 | 5.73 | 1.04 | 0.14 | 3.73 | 17 |
| 18 | 2.25 | 0.32 | ** | ** | ** | ** | ** | 7.14 | 6.97 | 0.91 | 0.16 | 3.61 | 18 |
| 19 | 2.45 | 0.32 | ** | ** | ** | ** | ** | 9.24 | 21.87 | 0.74 | 0.58 | 3.15 | 19 |
| 20 | 2.45 | 0.29 | ** | ** | ** | ** | ** | 12.66 | 22.72 | 0.63 | 3.97 | 3.15 | 20 |
| 21 | 2.55 | 0.29 | ** | ** | ** | ** | ** | 14.21 | 22.72 | 0.63 | 3.97 | 3.15 | 21 |
| 22 | 2.65 | 0.29 | ** | ** | ** | ** | ** | 15.86 | 22.72 | 0.40 | 3.85 | 3.04 | 22 |
| 23 | 2.55 | 0.29 | ** | ** | ** | ** | ** | 14.44 | 22.72 | 0.22 | 3.61 | 2.83 | 23 |
| 24 | 2.45 | 0.29 | ** | ** | ** | ** | ** | 13.53 | 22.15 | 0.19 | 3.85 | 2.23 | 24 |
| 25 | 2.35 | 0.32 | ** | ** | ** | ** | ** | 12.87 | 22.72 | 0.09 | 3.73 | 2.52 | 25 |
| 26 | 2.35 | ** | ** | ** | ** | ** | ** | 13.76 | 24.17 | 0.04 | 3.49 | 2.72 | 26 |
| 27 | 2.25 | ** | ** | ** | ** | ** | ** | 15.38 | 20.21 | 0.02 | 3.26 | 2.05 | 27 |
| 28 | 2.16 | ** | ** | ** | ** | ** | ** | 14.67 | 19.94 | 0.02 | 2.93 | 2.05 | 28 |
| 29 | 2.35 | ** | ** | ** | ** | ** | ** | 13.53 | 20.48 | 0.11 | 2.83 | 1.96 | 29 |
| 30 | 2.45 | ** | ** | ** | ** | ** | ** | 12.66 | 20.48 | 0.11 | 2.83 | 1.96 | 30 |
| 31 | 2.25 | ** | ** | ** | 14.21 | 0.11 | 2.72 | 31 | |||||
| TOTAL | 71.83 | 10.76* | ** | ** | ** | ** | ** | 211.17* | 578.41 | 299.13 | 43.77 | 96.40 | |
| MEAN | 2.32 | .43* | ** | ** | ** | ** | ** | 10.56* | 19.28 | 9.65 | 1.41 | 3.21 | |
| AC-FT | 142.47 | 21.34* | ** | ** | ** | ** | ** | 418.85* | 1147.26 | 593.32 | 86.82 | 191.21 | |
| ALEXANDER DITCH | STATION NO. 0077115.00 |
| LATITUDE 42-59-51 LONGITUDE 109-58-39 | |
| SW1/4SE1/4 SECTION 34 TOWNSHIP 35 N, RANGE 110 W 6TH P.M. | |
| ELEVATION 7350.00 FT DRAINAGE AREA UNKNOWN | |
| NONCONTRIBUTING 0.00 SQ MI BASIN 15570000 | |
| SUBLETTE COUNTY DATA FROM WWRC (C) | |
| ***TO USE THIS DATA, SEE VIC HASFURTHER*** |
| MEAN DAILY FLOW IN CFS BY WATER YEAR | |||||||||||||
| 1988 | |||||||||||||
| DAY | OCT | NOV | DEC | JAN | FEB | MAR | APR | MAY | JUNE | JULY | AUG | SEPT | DAY |
| 1 | 1.96 | 1.91 | ** | ** | ** | ** | ** | ** | ** | ** | ** | ** | 1 |
| 2 | 1.87 | ** | ** | ** | ** | ** | ** | ** | ** | ** | ** | ** | 2 |
| 3 | 1.62 | ** | ** | ** | ** | ** | ** | ** | ** | ** | ** | ** | 3 |
| 4 | 1.96 | ** | ** | ** | ** | ** | ** | ** | ** | ** | ** | ** | 4 |
| 5 | 2.83 | ** | ** | ** | ** | ** | ** | ** | ** | ** | ** | ** | 5 |
| 6 | 2.62 | ** | ** | ** | ** | ** | ** | ** | ** | ** | ** | ** | 6 |
| 7 | 2.83 | ** | ** | ** | ** | ** | ** | ** | ** | ** | ** | ** | 7 |
| 8 | 2.72 | ** | ** | ** | ** | ** | ** | ** | ** | ** | ** | ** | 8 |
| 9 | 2.93 | ** | ** | ** | ** | ** | ** | ** | ** | ** | ** | ** | 9 |
| 10 | 3.37 | ** | ** | ** | ** | ** | ** | ** | ** | ** | ** | ** | 10 |
| 11 | 3.43 | ** | ** | ** | ** | ** | ** | ** | ** | ** | ** | ** | 11 |
| 12 | 2.93 | ** | ** | ** | ** | ** | ** | ** | ** | ** | ** | ** | 12 |
| 13 | 2.93 | ** | ** | ** | ** | ** | ** | ** | ** | ** | ** | ** | 13 |
| 14 | 3.04 | ** | ** | ** | ** | ** | ** | ** | ** | ** | ** | ** | 14 |
| 15 | 2.93 | ** | ** | ** | ** | ** | ** | ** | ** | ** | ** | ** | 15 |
| 16 | 2.93 | ** | ** | ** | ** | ** | ** | ** | ** | ** | ** | ** | 16 |
| 17 | 2.93 | ** | ** | ** | ** | ** | ** | ** | ** | ** | ** | ** | 17 |
| 18 | 2.93 | ** | ** | ** | ** | ** | ** | ** | ** | ** | ** | ** | 18 |
| 19 | 2.93 | ** | ** | ** | ** | ** | ** | ** | ** | ** | ** | ** | 19 |
| 20 | 3.04 | ** | ** | ** | ** | ** | ** | ** | ** | ** | ** | ** | 20 |
| 21 | 3.15 | ** | ** | ** | ** | ** | ** | ** | ** | ** | ** | ** | 21 |
| 22 | 3.15 | ** | ** | ** | ** | ** | ** | ** | ** | ** | ** | ** | 22 |
| 23 | 2.83 | ** | ** | ** | ** | ** | ** | ** | ** | ** | ** | ** | 23 |
| 24 | 2.67 | ** | ** | ** | ** | ** | ** | ** | ** | ** | ** | ** | 24 |
| 25 | 2.62 | ** | ** | ** | ** | ** | ** | ** | ** | ** | ** | ** | 25 |
| 26 | 2.52 | ** | ** | ** | ** | ** | ** | ** | ** | ** | ** | ** | 26 |
| 27 | 2.52 | ** | ** | ** | ** | ** | ** | ** | ** | ** | ** | ** | 27 |
| 28 | 2.57 | ** | ** | ** | ** | ** | ** | ** | ** | ** | ** | ** | 28 |
| 29 | 2.52 | ** | ** | ** | ** | ** | ** | ** | ** | ** | ** | ** | 29 |
| 30 | 2.37 | ** | ** | ** | ** | ** | ** | ** | ** | ** | ** | 30 | |
| 31 | 1.96 | ** | ** | ** | ** | ** | ** | 31 | |||||
| TOTAL | 83.61 | 1.91* | ** | ** | ** | ** | ** | ** | ** | ** | ** | ** | |
| MEAN | 2.70 | 1.91* | ** | ** | ** | ** | ** | ** | ** | ** | ** | ** | |
| AC-FT | 165.84 | 3.79* | ** | ** | ** | ** | ** | ** | ** | ** | ** | ** | |
Source: Wyoming Water Resources Data System, March 20, 200
Bee Line Ditch, West Fork New Fork River
Diversion Description: Diversion consists of two 30" diameter slide gates. A wooden plank diversion dam exists.1
Conveyance Description: Open Channel Canal. Approximately 3/4 of a mile below the headgate, the canal splits into two branches: the east branch is approximately 12 miles long; the west branch is approximately 9 miles long.1
Wyoming Water Rights Summary:
| Priority Date (M-D-Y) | Permit Number |
Permitted Use | Acres | Flow (cfs) |
Cumulative Flow (cfs) | Comments |
| 05-10-1897 | 1487 | Irrigation | 707.40 | 10.13 | 10.13 | |
| 05-15-1899 | 425E | Irrigation | 596.00 | 8.50 | 18.63 | |
| 11-11-1903 | 4871E | Irrigation | 18.63 | 482.19 AF Secondary Supply from New Fork Lake Reservoir (480R) (346.90 acres served) | ||
| 11-21-1904 | 1303E | Irrigation | 80.00 | 1.14 | 19.77 | |
| 06-11-1929 | 4843E | Irrigation | 268.78 | 3.81 | 23.58 |
Storage Rights: New Fork Lake Reservoir.
Estimated Canal Losses: Typical losses (10%) are experienced.1
Irrigation Practices: Lands are flood irrigated.1
Crop Types / Consumptive Use: Lands are native grass hay and pasture.1
Return Flows: Return flows are delivered to West Fork New Fork River at Duck Creek.2
Other Operational Information: The canal is typically turned on in late May and irrigation flows stop in late July. Stock flows continue until October.1
|
Bee Line Ditch, West Fork New Fork River, Diversion Data
| Wateryear | May | June | July | August | September | |||||
| Average (cfs) | Monthly Total (AF) | Average (cfs) | Monthly Total (AF) | Average (cfs) | Monthly Total (AF) | Average (cfs) | Monthly Total (AF) | Average (cfs) | Monthly Total (AF) | |
| 1980 | ||||||||||
| 1981 | ||||||||||
| 1982 | ||||||||||
| 1983 | ||||||||||
| 1984 | 23.88 | 1,420.88 | 27.57 | 1,695.35 | 0.83 | 50.80 | 1.37 | 81.76 | ||
| 1985 | 2.61 | 160.36 | 27.80 | 1,654.41 | 24.74 | 1,521.46 | 3.70 | 227.56 | 6.69 | 398.12 |
| 1986 | 1.78 | 109.63 | 42.50 | 2,529.14 | 32.27 | 1,984.30 | 6.26 | 384.67 | 6.20 | 369.12 |
| 1987 | 11.14 | 685.01 | 27.13 | 1,614.22 | 25.47 | 1,566.27 | 4.43 | 272.65 | 2.47 | 147.09 |
| 1988 | ||||||||||
| 1989 | ||||||||||
| 1990 | ||||||||||
| 1991 | ||||||||||
| 1992 | ||||||||||
| 1993 | 42.66 | 2,538.45 | 30.22 | 1,858.16 | ||||||
| 1994 | 11.95 | 734.78 | 29.36 | 1,747.04 | 10.67 | 656.07 | 10.10 | 621.01 | ||
| 1995 | ||||||||||
| 1996 | ||||||||||
| 1997 | ||||||||||
| 1998 | ||||||||||
| Averages: | 6.87 | 422.44 | 32.22 | 1,917.36 | 25.16 | 1,546.93 | 5.06 | 311.34 | 4.18 | 249.02 |
Data:
1993: 6/3, 23.00 cfs; 6/4, 38.40 cfs; 6/16, 51.81 cfs; 7/29, 24.60 cfs.
1994: 5/13, 10.00 cfs; 6/13, 41.00 cfs; 7/2, 8.50 cfs; 7/22, 12.00 cfs; 9/7, 8.50 cfs.
Supply: 1980, below average; 1981, slightly below average; 1982, average (late peak); 1983, above average; 1984, above average; 1985, below average; 1986, average to slightly above average; 1988: very below average; 1989, below average; 1990, below average; 1991, slightly below average; 1992, below average; 1993, average; 1994, below average; 1995, average to above average; 1996, average; 1997, average; 1998, average to above average.
Source: State Engineer's Office, Annual Hydrographers' Reports.
| BEE-LINE DITCH | STATION NO. 007128.00 |
| LATITUDE 42-54-35 LONGITUDE 109-58-42 | |
| SE1/4NW1/4 SECTION 13 TOWNSHIP 34 N, RANGE 110 W 6TH P.M. | |
| ELEVATION 7258.00 FT DRAINAGE AREA UNKNOWN | |
| NONCONTRIBUTING 0.00 SQ MI BASIN 15570000 | |
| SUBLETTE COUNTY DATA FROM WWRC (C) | |
| ***TO USE THIS DATA, SEE VIC HASFURTHER*** |
| MEAN DAILY FLOW IN CFS BY WATER YEAR | |||||||||||||
| 1984 | |||||||||||||
| DAY | OCT | NOV | DEC | JAN | FEB | MAR | APR | MAY | JUNE | JULY | AUG | SEPT | DAY |
| 1 | ** | ** | ** | ** | ** | ** | ** | ** | 2.28 | 49.80 | 1.10 | 0.54 | 1 |
| 2 | ** | ** | ** | ** | ** | ** | ** | ** | 0.38 | 43.90 | 0.98 | 0.54 | 2 |
| 3 | ** | ** | ** | ** | ** | ** | ** | ** | 0.38 | 40.30 | 0.88 | 0.58 | 3 |
| 4 | ** | ** | ** | ** | ** | ** | ** | ** | 0.38 | 43.30 | 0.79 | 0.61 | 4 |
| 5 | ** | ** | ** | ** | ** | ** | ** | ** | 0.38 | 45.20 | 0.58 | 0.74 | 5 |
| 6 | ** | ** | ** | ** | ** | ** | ** | ** | 5.26 | 45.80 | 0.70 | 0.79 | 6 |
| 7 | ** | ** | ** | ** | ** | ** | ** | ** | 18.60 | 45.20 | 0.88 | 0.79 | 7 |
| 8 | ** | ** | ** | ** | ** | ** | ** | ** | 16.20 | 45.20 | 0.74 | 0.79 | 8 |
| 9 | ** | ** | ** | ** | ** | ** | ** | ** | 15.60 | 44.60 | 0.61 | 0.79 | 9 |
| 10 | ** | ** | ** | ** | ** | ** | ** | ** | 17.20 | 45.80 | 0.61 | 0.93 | 10 |
| 11 | ** | ** | ** | ** | ** | ** | ** | ** | 19.00 | 43.30 | 0.61 | 0.88 | 11 |
| 12 | ** | ** | ** | ** | ** | ** | ** | ** | 19.40 | 42.70 | 0.61 | 0.93 | 12 |
| 13 | ** | ** | ** | ** | ** | ** | ** | ** | 21.30 | 47.10 | 0.61 | 0.88 | 13 |
| 14 | ** | ** | ** | ** | ** | ** | ** | ** | 20.90 | 46.50 | 0.70 | 0.83 | 14 |
| 15 | ** | ** | ** | ** | ** | ** | ** | ** | 20.10 | 42.70 | 0.74 | 0.58 | 15 |
| 16 | ** | ** | ** | ** | ** | ** | ** | ** | 20.90 | 39.70 | 0.79 | 0.50 | 16 |
| 17 | ** | ** | ** | ** | ** | ** | ** | ** | 22.90 | 36.80 | 0.83 | 0.50 | 17 |
| 18 | ** | ** | ** | ** | ** | ** | ** | ** | 23.70 | 36.30 | 0.88 | 0.54 | 18 |
| 19 | ** | ** | ** | ** | ** | ** | ** | ** | 23.70 | 37.40 | 0.88 | 0.58 | 19 |
| 20 | ** | ** | ** | ** | ** | ** | ** | ** | 22.90 | 17.60 | 0.88 | 0.65 | 20 |
| 21 | ** | ** | ** | ** | ** | ** | ** | ** | 28.60 | 2.99 | 0.88 | 0.70 | 21 |
| 22 | ** | ** | ** | ** | ** | ** | ** | ** | 39.70 | 2.47 | 0.88 | 0.70 | 22 |
| 23 | ** | ** | ** | ** | ** | ** | ** | ** | 42.70 | 2.28 | 0.93 | 0.70 | 23 |
| 24 | ** | ** | ** | ** | ** | ** | ** | ** | 43.30 | 1.55 | 0.83 | 1.77 | 24 |
| 25 | ** | ** | ** | ** | ** | ** | ** | 1.10 | 44.60 | 0.74 | 0.98 | 1.55 | 25 |
| 26 | ** | ** | ** | ** | ** | ** | ** | 0.79 | 45.80 | 0.70 | 1.10 | 5.42 | 26 |
| 27 | ** | ** | ** | ** | ** | ** | ** | 0.74 | 45.80 | 0.88 | 1.15 | 2.67 | 27 |
| 28 | ** | ** | ** | ** | ** | ** | ** | 0.58 | 44.60 | 1.04 | 1.04 | 2.38 | 28 |
| 29 | ** | ** | ** | ** | ** | ** | ** | 0.58 | 43.30 | 0.98 | 0.93 | 4.36 | 29 |
| 30 | ** | ** | ** | ** | ** | ** | 3.22 | 46.50 | 0.98 | 0.88 | 7.00 | 30 | |
| 31 | ** | ** | ** | ** | 7.19 | 0.93 | 0.61 | 31 | |||||
| TOTAL | ** | ** | ** | ** | ** | ** | ** | 14.20* | 716.36 | 854.74 | 25.61 | 41.22 | |
| MEAN | ** | ** | ** | ** | ** | ** | ** | 2.03* | 23.88 | 27.57 | 0.83 | 1.37 | |
| AC-FT | ** | ** | ** | ** | ** | ** | ** | 28.17* | 1420.88 | 1695.35 | 50.80 | 81.76 | |
| BEE-LINE DITCH | STATION NO. 007128.00 |
| LATITUDE 42-54-35 LONGITUDE 109-58-42 | |
| SE1/4NW1/4 SECTION 13 TOWNSHIP 34 N, RANGE 110 W 6TH P.M. | |
| ELEVATION 7258.00 FT DRAINAGE AREA UNKNOWN | |
| NONCONTRIBUTING 0.00 SQ MI BASIN 15570000 | |
| SUBLETTE COUNTY DATA FROM WWRC (C) | |
| ***TO USE THIS DATA, SEE VIC HASFURTHER*** |
| MEAN DAILY FLOW IN CFS BY WATER YEAR | |||||||||||||
| 1985 | |||||||||||||
| DAY | OCT | NOV | DEC | JAN | FEB | MAR | APR | MAY | JUNE | JULY | AUG | SEPT | DAY |
| 1 | 5.10 | ** | ** | ** | ** | ** | ** | ** | 28.05 | 26.26 | 4.01 | 3.52 | 1 |
| 2 | 4.95 | ** | ** | ** | ** | ** | ** | ** | 31.03 | 25.91 | 4.01 | 6.28 | 2 |
| 3 | 4.36 | ** | ** | ** | ** | ** | ** | ** | 29.89 | 22.56 | 4.26 | 6.28 | 3 |
| 4 | 3.96 | ** | ** | ** | ** | ** | ** | ** | 16.35 | 21.61 | 4.13 | 6.12 | 4 |
| 5 | 3.83 | ** | ** | ** | ** | ** | ** | ** | 15.29 | 21.93 | 4.13 | 6.12 | 5 |
| 6 | 3.83 | ** | ** | ** | ** | ** | ** | ** | 23.54 | 28.78 | 4.13 | 6.12 | 6 |
| 7 | 4.65 | ** | ** | ** | ** | ** | ** | ** | 27.32 | 32.20 | 4.13 | 6.12 | 7 |
| 8 | 4.51 | ** | ** | ** | ** | ** | ** | ** | 26.26 | 36.24 | 4.13 | 6.12 | 8 |
| 9 | 4.51 | ** | ** | ** | ** | ** | ** | ** | 26.61 | 35.41 | 3.88 | 6.28 | 9 |
| 10 | 4.51 | ** | ** | ** | ** | ** | ** | ** | 13.28 | 34.19 | 3.88 | 6.44 | 10 |
| 11 | 4.51 | ** | ** | ** | ** | ** | ** | ** | 4.39 | 37.94 | 3.88 | 6.44 | 11 |
| 12 | 4.51 | ** | ** | ** | ** | ** | ** | ** | 9.93 | 48.01 | 4.01 | 7.28 | 12 |
| 13 | 3.57 | ** | ** | ** | ** | ** | ** | ** | 29.15 | 43.27 | 4.01 | 7.11 | 13 |
| 14 | 4.36 | ** | ** | ** | ** | ** | ** | ** | 29.15 | 39.67 | 3.88 | 6.77 | 14 |
| 15 | 4.23 | ** | ** | ** | ** | ** | ** | ** | 29.15 | 37.94 | 3.88 | 6.61 | 15 |
| 16 | 4.80 | ** | ** | ** | ** | ** | ** | ** | 30.27 | 37.51 | 3.88 | 6.44 | 16 |
| 17 | 4.23 | ** | ** | ** | ** | ** | ** | ** | 29.52 | 40.56 | 3.88 | 6.28 | 17 |
| 18 | 4.65 | ** | ** | ** | ** | ** | ** | ** | 30.65 | 41.91 | 3.88 | 6.28 | 18 |
| 19 | 5.75 | ** | ** | ** | ** | ** | ** | ** | 31.81 | 38.80 | 3.88 | 7.28 | 19 |
| 20 | 5.75 | ** | ** | ** | ** | ** | ** | ** | 31.42 | 30.65 | 3.88 | 7.28 | 20 |
| 21 | 2.02 | ** | ** | ** | ** | ** | ** | ** | 30.65 | 22.89 | 3.76 | 6.94 | 21 |
| 22 | 2.10 | ** | ** | ** | ** | ** | ** | 1.46 | 29.89 | 21.92 | 3.88 | 7.99 | 22 |
| 23 | 2.38 | ** | ** | ** | ** | ** | ** | 2.86 | 30.65 | 9.33 | 3.88 | 7.81 | 23 |
| 24 | 1.93 | ** | ** | ** | ** | ** | ** | 3.07 | 31.81 | 3.76 | 3.76 | 7.28 | 24 |
| 25 | 3.45 | ** | ** | ** | ** | ** | ** | 3.07 | 37.51 | 3.64 | 3.64 | 7.11 | 25 |
| 26 | 5.58 | ** | ** | ** | ** | ** | ** | 2.86 | 37.94 | 4.01 | 2.76 | 7.11 | 26 |
| 27 | 5.26 | ** | ** | ** | ** | ** | ** | 2.10 | 41.00 | 4.01 | 2.76 | 7.11 | 27 |
| 28 | ** | ** | ** | ** | ** | ** | ** | 1.32 | 37.51 | 4.01 | 2.76 | 7.28 | 28 |
| 29 | ** | ** | ** | ** | ** | ** | 14.77 | 34.19 | 4.01 | 2.66 | 7.46 | 29 | |
| 30 | ** | ** | ** | ** | ** | ** | 21.29 | 29.89 | 4.01 | 2.56 | 7.46 | 30 | |
| 31 | ** | ** | ** | ** | 28.05 | 4.13 | 2.56 | 31 | |||||
| TOTAL | 113.29* | ** | ** | ** | ** | ** | ** | 80.85* | 834.10 | 767.01 | 114.73 | 200.72 | |
| MEAN | 4.20* | ** | ** | ** | ** | ** | ** | 8.09* | 27.80 | 24.74 | 3.70 | 6.69 | |
| AC-FT | 224.71* | ** | ** | ** | ** | ** | ** | 160.36* | 1654.41 | 1521.46 | 227.56 | 398.12 | |
| BEE-LINE DITCH | STATION NO. 007128.00 |
| LATITUDE 42-54-35 LONGITUDE 109-58-42 | |
| SE1/4NW1/4 SECTION 13 TOWNSHIP 34 N, RANGE 110 W 6TH P.M. | |
| ELEVATION 7258.00 FT DRAINAGE AREA UNKNOWN | |
| NONCONTRIBUTING 0.00 SQ MI BASIN 15570000 | |
| SUBLETTE COUNTY DATA FROM WWRC (C) | |
| ***TO USE THIS DATA, SEE VIC HASFURTHER*** |
| MEAN DAILY FLOW IN CFS BY WATER YEAR | |||||||||||||
| 1986 | |||||||||||||
| DAY | OCT | NOV | DEC | JAN | FEB | MAR | APR | MAY | JUNE | JULY | AUG | SEPT | DAY |
| 1 | 7.28 | 4.79 | ** | ** | ** | ** | ** | ** | 18.60 | 45.37 | 5.42 | 6.33 | 1 |
| 2 | 7.11 | 4.79 | ** | ** | ** | ** | ** | ** | 23.71 | 51.47 | 5.42 | 6.33 | 2 |
| 3 | 6.94 | 4.79 | ** | ** | ** | ** | ** | ** | 36.78 | 51.47 | 5.42 | 6.33 | 3 |
| 4 | 6.77 | 4.79 | ** | ** | ** | ** | ** | ** | 38.42 | 50.99 | 5.42 | 6.33 | 4 |
| 5 | 6.77 | ** | ** | ** | ** | ** | ** | ** | 43.13 | 52.45 | 5.27 | 6.17 | 5 |
| 6 | 6.77 | ** | ** | ** | ** | ** | ** | ** | 44.46 | 50.50 | 5.42 | 6.17 | 6 |
| 7 | 6.77 | ** | ** | ** | ** | ** | ** | ** | 45.37 | 51.47 | 5.42 | 6.17 | 7 |
| 8 | 6.94 | ** | ** | ** | ** | ** | ** | ** | 48.60 | 51.47 | 5.42 | 6.17 | 8 |
| 9 | 6.77 | ** | ** | ** | ** | ** | ** | ** | 46.74 | 50.99 | 5.42 | 6.17 | 9 |
| 10 | 6.77 | ** | ** | ** | ** | ** | ** | ** | 43.13 | 48.60 | 5.42 | 6.17 | 10 |
| 11 | 6.61 | ** | ** | ** | ** | ** | ** | ** | 38.83 | 46.28 | 5.42 | 6.17 | 11 |
| 12 | 6.77 | ** | ** | ** | ** | ** | ** | ** | 43.13 | 42.25 | 5.42 | 6.17 | 12 |
| 13 | 6.77 | ** | ** | ** | ** | ** | ** | ** | 45.82 | 40.95 | 5.42 | 6.01 | 13 |
| 14 | 6.44 | ** | ** | ** | ** | ** | ** | ** | 45.37 | 40.95 | 5.42 | 6.01 | 14 |
| 15 | 6.44 | ** | ** | ** | ** | ** | ** | ** | 45.37 | 46.74 | 5.42 | 6.01 | 15 |
| 16 | 6.44 | ** | ** | ** | ** | ** | ** | ** | 43.57 | 50.50 | 5.56 | 6.01 | 16 |
| 17 | 6.28 | ** | ** | ** | ** | ** | ** | ** | 42.25 | 46.28 | 6.33 | 6.01 | 17 |
| 18 | 6.28 | ** | ** | ** | ** | ** | ** | ** | 43.13 | 36.37 | 7.31 | 5.86 | 18 |
| 19 | 6.12 | ** | ** | ** | ** | ** | ** | ** | 43.57 | 31.71 | 7.49 | 5.71 | 19 |
| 20 | 6.12 | ** | ** | ** | ** | ** | ** | ** | 40.52 | 26.35 | 7.31 | 5.71 | 20 |
| 21 | 6.12 | ** | ** | ** | ** | ** | ** | ** | 44.46 | 23.71 | 7.49 | 5.71 | 21 |
| 22 | 6.12 | ** | ** | ** | ** | ** | ** | ** | 50.03 | 10.32 | 7.49 | 5.71 | 22 |
| 23 | 6.28 | ** | ** | ** | ** | ** | ** | ** | 49.55 | 5.86 | 7.49 | 5.56 | 23 |
| 24 | 6.28 | ** | ** | ** | ** | ** | ** | ** | 47.67 | 5.71 | 7.31 | 5.71 | 24 |
| 25 | 6.28 | ** | ** | ** | ** | ** | ** | ** | 46.28 | 6.01 | 7.14 | 5.56 | 25 |
| 26 | 6.28 | ** | ** | ** | ** | ** | ** | ** | 46.28 | 6.33 | 7.14 | 5.56 | 26 |
| 27 | 6.12 | ** | ** | ** | ** | ** | ** | 2.61 | 43.57 | 6.33 | 7.14 | 5.56 | 27 |
| 28 | 6.12 | ** | ** | ** | ** | ** | ** | 7.66 | 43.13 | 6.01 | 6.98 | 5.42 | 28 |
| 29 | 6.12 | ** | ** | ** | ** | ** | 13.42 | 42.69 | 5.71 | 6.98 | 8.56 | 29 | |
| 30 | 5.97 | ** | ** | ** | ** | ** | 14.63 | 40.95 | 5.71 | 6.98 | 10.74 | 30 | |
| 31 | 5.36 | ** | ** | ** | 16.95 | 5.56 | 6.65 | 31 | |||||
| TOTAL | 200.21 | 19.16* | ** | ** | ** | ** | ** | 55.27* | 1275.11 | 1000.42 | 193.94 | 186.10 | |
| MEAN | 6.46 | 4.79* | ** | ** | ** | ** | ** | 11.05* | 42.50 | 32.27 | 6.26 | 6.20 | |
| AC-FT | 397.11 | 38.00* | ** | ** | ** | ** | ** | 109.63* | 2529.14 | 1984.30 | 384.67 | 369.12 | |
| BEE-LINE DITCH | STATION NO. 007128.00 |
| LATITUDE 42-54-35 LONGITUDE 109-58-42 | |
| SE1/4NW1/4 SECTION 13 TOWNSHIP 34 N, RANGE 110 W 6TH P.M. | |
| ELEVATION 7258.00 FT DRAINAGE AREA UNKNOWN | |
| NONCONTRIBUTING 0.00 SQ MI BASIN 15570000 | |
| SUBLETTE COUNTY DATA FROM WWRC (C) | |
| ***TO USE THIS DATA, SEE VIC HASFURTHER*** |
| MEAN DAILY FLOW IN CFS BY WATER YEAR | |||||||||||||
| 1987 | |||||||||||||
| DAY | OCT | NOV | DEC | JAN | FEB | MAR | APR | MAY | JUNE | JULY | AUG | SEPT | DAY |
| 1 | 9.92 | 7.31 | 0.00 | ** | ** | ** | ** | ** | 18.16 | 33.09 | 4.26 | 4.00 | 1 |
| 2 | 10.32 | 6.81 | 0.00 | ** | ** | ** | ** | ** | 15.59 | 33.09 | 4.13 | 3.76 | 2 |
| 3 | 10.95 | 6.98 | 0.00 | ** | ** | ** | ** | ** | 15.35 | 33.09 | 4.13 | 3.76 | 3 |
| 4 | 10.32 | 6.98 | 0.00 | ** | ** | ** | ** | ** | 16.09 | 31.33 | 4.13 | 3.88 | 4 |
| 5 | 9.92 | 6.49 | 0.00 | ** | ** | ** | ** | ** | 16.34 | 28.61 | 4.13 | 3.88 | 5 |
| 6 | 9.72 | 6.33 | ** | ** | ** | ** | ** | ** | 16.34 | 27.63 | 4.00 | 3.17 | 6 |
| 7 | 9.72 | 5.86 | ** | ** | ** | ** | ** | ** | 19.51 | 26.66 | 4.00 | 2.73 | 7 |
| 8 | 10.95 | 4.58 | ** | ** | ** | ** | ** | ** | 25.39 | 28.28 | 4.00 | 2.52 | 8 |
| 9 | 11.60 | 3.13 | ** | ** | ** | ** | ** | ** | 23.24 | 32.03 | 4.33 | 2.42 | 9 |
| 10 | 11.60 | 1.97 | ** | ** | ** | ** | ** | ** | 35.63 | 47.99 | 4.80 | 2.33 | 10 |
| 11 | 12.04 | 1.22 | ** | ** | ** | ** | ** | ** | 28.61 | 50.15 | 4.80 | 2.33 | 11 |
| 12 | 11.82 | 1.50 | ** | ** | ** | ** | ** | 3.63 | 27.63 | 41.78 | 4.73 | 2.23 | 12 |
| 13 | 11.82 | 0.76 | ** | ** | ** | ** | ** | 3.88 | 29.96 | 37.88 | 4.73 | 2.23 | 13 |
| 14 | 11.82 | 0.81 | ** | ** | ** | ** | ** | 4.00 | 28.61 | 37.12 | 4.80 | 2.23 | 14 |
| 15 | 11.82 | 0.81 | ** | ** | ** | ** | ** | 3.88 | 30.64 | 34.89 | 5.23 | 2.23 | 15 |
| 16 | 11.60 | 0.86 | ** | ** | ** | ** | ** | 4.13 | 34.89 | 33.81 | 5.01 | 2.23 | 16 |
| 17 | 11.60 | 0.71 | ** | ** | ** | ** | ** | 4.39 | 29.96 | 37.88 | 4.80 | 2.23 | 17 |
| 18 | 11.82 | 0.37 | ** | ** | ** | ** | ** | 9.64 | 26.34 | 39.81 | 4.73 | 2.23 | 18 |
| 19 | 9.52 | 0.18 | ** | ** | ** | ** | ** | 16.60 | 26.02 | 35.63 | 4.66 | 2.23 | 19 |
| 20 | 7.49 | 0.14 | ** | ** | ** | ** | ** | 21.77 | 27.95 | 33.09 | 4.53 | 2.23 | 20 |
| 21 | 7.49 | 0.00 | ** | ** | ** | ** | ** | 26.98 | 30.30 | 32.03 | 4.53 | 2.13 | 21 |
| 22 | 7.49 | 0.00 | ** | ** | ** | ** | ** | 27.63 | 32.03 | 17.11 | 4.39 | 2.04 | 22 |
| 23 | 7.31 | 0.00 | ** | ** | ** | ** | ** | 26.34 | 33.81 | 3.76 | 4.39 | 2.05 | 23 |
| 24 | 7.31 | 0.00 | ** | ** | ** | ** | ** | 23.85 | 33.81 | 3.88 | 4.39 | 1.95 | 24 |
| 25 | 7.14 | 0.00 | ** | ** | ** | ** | ** | 23.85 | 33.09 | 4.13 | 4.53 | 1.95 | 25 |
| 26 | 7.14 | 0.00 | ** | ** | ** | ** | ** | 25.08 | 33.45 | 4.13 | 4.39 | 1.91 | 26 |
| 27 | 6.98 | 0.00 | ** | ** | ** | ** | ** | 26.66 | 32.03 | 4.13 | 4.39 | 1.86 | 27 |
| 28 | 6.98 | 0.00 | ** | ** | ** | ** | ** | 27.95 | 30.30 | 4.13 | 4.26 | 1.86 | 28 |
| 29 | 6.98 | 0.00 | ** | ** | ** | ** | 23.55 | 30.64 | 4.13 | 4.13 | 1.78 | 29 | |
| 30 | 7.31 | 0.00 | ** | ** | ** | ** | 21.77 | 32.38 | 4.13 | 4.13 | 1.78 | 30 | |
| 31 | 7.31 | ** | ** | ** | 19.78 | 4.26 | 4.00 | 31 | |||||
| TOTAL | 295.81 | 63.80 | 0.00* | ** | ** | ** | ** | 345.36* | 814.09 | 789.66 | 137.46 | 74.16 | |
| MEAN | 9.54 | 2.13 | 0.00* | ** | ** | ** | ** | 17.27* | 27.14 | 25.47 | 4.43 | 2.47 | |
| AC-FT | 586.73 | 126.55 | 0.00* | ** | ** | ** | ** | 685.01* | 1614.72 | 1566.27 | 272.65 | 147.09 | |
| BEE-LINE DITCH | STATION NO. 007128.00 |
| LATITUDE 42-54-35 LONGITUDE 109-58-42 | |
| SE1/4NW1/4 SECTION 13 TOWNSHIP 34 N, RANGE 110 W 6TH P.M. | |
| ELEVATION 7258.00 FT DRAINAGE AREA UNKNOWN | |
| NONCONTRIBUTING 0.00 SQ MI BASIN 15570000 | |
| SUBLETTE COUNTY DATA FROM WWRC (C) | |
| ***TO USE THIS DATA, SEE VIC HASFURTHER*** |
| MEAN DAILY FLOW IN CFS BY WATER YEAR | |||||||||||||
| 1988 | |||||||||||||
| DAY | OCT | NOV | DEC | JAN | FEB | MAR | APR | MAY | JUNE | JULY | AUG | SEPT | DAY |
| 1 | 1.78 | ** | ** | ** | ** | ** | ** | ** | ** | ** | ** | ** | 1 |
| 2 | 3.05 | ** | ** | ** | ** | ** | ** | ** | ** | ** | ** | ** | 2 |
| 3 | 6.60 | ** | ** | ** | ** | ** | ** | ** | ** | ** | ** | ** | 3 |
| 4 | 6.44 | ** | ** | ** | ** | ** | ** | ** | ** | ** | ** | ** | 4 |
| 5 | 6.93 | ** | ** | ** | ** | ** | ** | ** | ** | ** | ** | ** | 5 |
| 6 | 6.77 | ** | ** | ** | ** | ** | ** | ** | ** | ** | ** | ** | 6 |
| 7 | 7.27 | ** | ** | ** | ** | ** | ** | ** | ** | ** | ** | ** | 7 |
| 8 | 8.14 | ** | ** | ** | ** | ** | ** | ** | ** | ** | ** | ** | 8 |
| 9 | 8.32 | ** | ** | ** | ** | ** | ** | ** | ** | ** | ** | ** | 9 |
| 10 | 8.50 | ** | ** | ** | ** | ** | ** | ** | ** | ** | ** | ** | 10 |
| 11 | 8.50 | ** | ** | ** | ** | ** | ** | ** | ** | ** | ** | ** | 11 |
| 12 | 8.50 | ** | ** | ** | ** | ** | ** | ** | ** | ** | ** | ** | 12 |
| 13 | 8.54 | ** | ** | ** | ** | ** | ** | ** | ** | ** | ** | ** | 13 |
| 14 | 8.72 | ** | ** | ** | ** | ** | ** | ** | ** | ** | ** | ** | 14 |
| 15 | 8.72 | ** | ** | ** | ** | ** | ** | ** | ** | ** | ** | ** | 15 |
| 16 | 8.69 | ** | ** | ** | ** | ** | ** | ** | ** | ** | ** | ** | 16 |
| 17 | 8.54 | ** | ** | ** | ** | ** | ** | ** | ** | ** | ** | ** | 17 |
| 18 | 8.54 | ** | ** | ** | ** | ** | ** | ** | ** | ** | ** | ** | 18 |
| 19 | 8.54 | ** | ** | ** | ** | ** | ** | ** | ** | ** | ** | ** | 19 |
| 20 | 8.87 | ** | ** | ** | ** | ** | ** | ** | ** | ** | ** | ** | 20 |
| 21 | 8.69 | ** | ** | ** | ** | ** | ** | ** | ** | ** | ** | ** | 21 |
| 22 | 8.69 | ** | ** | ** | ** | ** | ** | ** | ** | ** | ** | ** | 22 |
| 23 | 8.50 | ** | ** | ** | ** | ** | ** | ** | ** | ** | ** | ** | 23 |
| 24 | 8.73 | ** | ** | ** | ** | ** | ** | ** | ** | ** | ** | ** | 24 |
| 25 | 8.69 | ** | ** | ** | ** | ** | ** | ** | ** | ** | ** | ** | 25 |
| 26 | 8.50 | ** | ** | ** | ** | ** | ** | ** | ** | ** | ** | ** | 26 |
| 27 | 8.50 | ** | ** | ** | ** | ** | ** | ** | ** | ** | ** | ** | 27 |
| 28 | 8.37 | ** | ** | ** | ** | ** | ** | ** | ** | ** | ** | ** | 28 |
| 29 | 8.50 | ** | ** | ** | ** | ** | ** | ** | ** | ** | ** | ** | 29 |
| 30 | 8.69 | ** | ** | ** | ** | ** | ** | ** | ** | ** | ** | 30 | |
| 31 | 8.50 | ** | ** | ** | ** | ** | ** | 31 | |||||
| TOTAL | 244.32 | ** | ** | ** | ** | ** | ** | ** | ** | ** | ** | ** | |
| MEAN | 7.88 | ** | ** | ** | ** | ** | ** | ** | ** | ** | ** | ** | |
| AC-FT | 484.60 | ** | ** | ** | ** | ** | ** | ** | ** | ** | ** | ** | |
Source: Wyoming Water Resources Data System, March 20, 2000
Bertram Ditch, New Fork River
Diversion Description: Diversion consists of a single 24" slide gate. No diversion dam exists.1
Conveyance Description: Open Channel Canal, approximately 1 mile in length.1
Wyoming Water Rights Summary:
| Priority Date (M-D-Y) | Permit Number |
Permitted Use | Acres | Flow (cfs) |
Cumulative Flow (cfs) | Comments |
| 09-09-1901 | 3406 | Irrigation | 226.00 | 3.22 | 3.22 | |
| 05-19-1908 | 1890E | Irrigation | 725.00 | 10.35 | 13.57 | |
| 03-06-1925 | 4444E | Irrigation | 86.00 | 1.22 | 14.79 |
Estimated Canal Losses: Information not available at time of report.
Irrigation Practices: Information not available at time of report.
Crop Types / Consumptive Use: Information not available at time of report.
Return Flows: Return flows are delivered to New Fork River near Big Piney.2
Other Operational Information: Information not available at time of report.
|
Bertram Ditch, New Fork River, Diversion Data
No Diversion Data Available.
Boulder Canal, Boulder Creek
Diversion Description: Diversion consists of a single 72" steel radial gate. A rock diversion dam exists.1
Conveyance Description: Open Channel Canal, approximately 14 miles in length.1
Wyoming Water Rights Summary:
| Priority Date (M-D-Y) | Permit Number |
Permitted Use | Acres | Flow (cfs) |
Cumulative Flow (cfs) | Comments |
| 10-18-1899 | 2322 | Irrigation | 630.00 | 9.00 | 9.00 | Permitted Name: Burkhalter |
| 03-08-1901 | 633E | Irrigation | 285.00 | 4.07 | 13.07 | Permitted Name: Enl. Burkhalter |
| 08-01-1902 | 889E | Domestic, Irrigation | 3,087.50 | 44.05 | 57.12 | Permitted Name: Boulder Canal (Enl. Oliver) |
| 08-25-1902 | 906E | Irrigation | 260.00 | 3.71 | 60.83 | Permitted Name: Enl. Burkhalter |
| 05-11-1903 | 1042E | Irrigation | 320.00 | 4.56 | 65.39 | Permitted Name: Enl. Burkhalter |
| 06-04-1903 | 1099E | Irrigation | 729.00 | 10.41 | 75.80 | Permitted Name: Enl. Burkhalter & Thompson |
| 12-18-1906 | 1646E | Domestic, Irrigation | 746.00 | 10.64 | 86.44 | Permitted Name: Boulder (Enl. Burkhalter) |
| 10-14-1919 | 4030E | Domestic, Irrigation, Stock | 3,693.47 | 52.66 | 139.10 | Permitted Name: Enl. Boulder Canal (Oliver & Burkhalter) |
| 03-11-1948 | 5454E | Irrigation | 99.00 | 1.41 | 140.51 | Permitted Name: Enl. Boulder Canal |
| 03-01-1984 | 6749E | Irrigation | 37.00 | 0.53 | 141.04 | Permitted Name: Lozier Enl. Boulder Canal |
| 03-01-1984 | 6750E | Irrigation | 59.00 | 0.84 | 141.88 | Permitted Name: Johnston Enl. Boulder Canal |
| 04-04-1985 | 6780E | Irrigation | 26.60 | 0.39 | 142.27 | Permitted Name: Steele Enl. Boulder Canal. Supplementary Supply for 63.90 acres with Original Supply from East Fork New Fork River |
Storage Rights: None.
Estimated Canal Losses: Typical (10%) losses are experienced in the first 6 miles of the canal; higher than typical losses (20-25%) are experienced in the remainder of the canal.1
Irrigation Practices: Information not available at time of report.
Crop Types / Consumptive Use: Information not available at time of report.
Return Flows: Approximately 85% of the return flows are delivered to West Fork New Fork River near Ward Ball, and approximately 15% are delivered to East Fork River near New Fork Wyoming.2
Other Operational Information: Information not available at time of report.
|
Boulder Canal, Boulder Creek, Diversion Data
| Wateryear | May | June | July | August | September | |||||
| Average (cfs) | Monthly Total (AF) | Average (cfs) | Monthly Total (AF) | Average (cfs) | Monthly Total (AF) | Average (cfs) | Monthly Total (AF) | Average (cfs) | Monthly Total (AF) | |
| 1980 | ||||||||||
| 1981 | ||||||||||
| 1982 | ||||||||||
| 1983 | ||||||||||
| 1984 | 323.50 | 19,249.59 | ||||||||
| 1985 | ||||||||||
| 1986 | ||||||||||
| 1987 | ||||||||||
| 1988 | ||||||||||
| 1989 | ||||||||||
| 1990 | ||||||||||
| 1991 | ||||||||||
| 1992 | ||||||||||
| 1993 | ||||||||||
| 1994 | ||||||||||
| 1995 | ||||||||||
| 1996 | ||||||||||
| 1997 | ||||||||||
| 1998 | ||||||||||
| Averages: | 323.50 | 19,249.59 | ||||||||
Data:
1981: 6/9, 360 cfs; 8/11, 22 cfs; 8/27, 120 cfs.
1982: 6/7, 380 cfs; 6/17, 360 cfs; 7/22, off.
1983: 5/10, 65 cfs (est); 5/18, off; 5/26, 80 cfs; 6/13, 384 cfs.
1984: 5/17, 100 cfs; 6/19, 366 cfs; 7/3, 372 cfs.
1991: 6/24, 344.26 cfs.
1992: 6/10, 251.00 cfs; 6/24, 100.00 cfs.
1993: 7/6, 350.00 cfs.
1994: 7/5, 350.00 cfs.
1996: 6/15, 348 cfs; 8/1, 76.8 cfs.
1997: 5/19, 160.6 cfs; 6120, 305 cfs; 7/29, 112.7 cfs.
1998: 8/4, 99.42 cfs; 9/30, 68.7 cfs.
Supply: 1980, below average; 1981, slightly below average; 1982, average (late peak); 1983, above average; 1984, above average; 1985, below average; 1986, average to slightly above average; 1988: very below average; 1989, below average; 1990, below average; 1991, slightly below average; 1992, below average; 1993, average; 1994, below average; 1995, average to above average; 1996, average; 1997, average; 1998, average to above average.
Source: State Engineer's Office, Annual Hydrographers' Reports.
Colorado Ditch, Pine Creek
Diversion Description: Diversion consists of a 5' wide slide gate mounted on a concrete structure. A rock diversion dam exists.1
Conveyance Description: Open Channel Canal, approximately 2 miles in length.1
Wyoming Water Rights Summary:
| Priority Date (M-D-Y) | Permit Number |
Permitted Use | Acres | Flow (cfs) |
Cumulative Flow (cfs) | Comments |
| 05-06-1898 | 1817 | Irrigation | 723.98 | 10.34 | 10.34 | |
| 02-09-1899 | 402E | Irrigation | 287.00 | 4.06 | 14.40 | |
| 11-08-1906 | 1631E | Irrigation | 241.55 | 3.44 | 17.84 | |
| 08-10-1934 | 4954E | Domestic, Irrigation, Stock | 17.84 | 3,370.23 AF Secondary Supply from Fremont Lake Reservoir (4453R and 4465R) (878.55 acres served) | ||
| 06-26-1945 | 5406E | Irrigation, Stock | 72.90 | 1.04 | 18.88 | |
| 05-07-1984 | 6859E | Res. Supply | 18.88 | Supply Ditch for Golf Course Pond Nos. 1-4 |
Storage Rights: Fremont Lake Reservoir.
Estimated Canal Losses: No significant losses are experienced. In fact, minor gains are experienced from seepage of other ditches.1
Irrigation Practices: Lands are flood irrigated.1
Crop Types / Consumptive Use: Lands are native grass hay and pasture.1
Return Flows: Return flows are delivered to West Fork New Fork River near Sill Ditch.2
Other Operational Information: The canal is typically turned on the first of May and off the first of September.1
|
Colorado Ditch, Pine Creek, Diversion Data
| Wateryear | May | June | July | August | September | |||||
| Average (cfs) | Monthly Total (AF) | Average (cfs) | Monthly Total (AF) | Average (cfs) | Monthly Total (AF) | Average (cfs) | Monthly Total (AF) | Average (cfs) | Monthly Total (AF) | |
| 1974 | 21.11 | 1,298.20 | 54.85 | 3,263.80 | 42.38 | 2,606.08 | 0.00 | 0.00 | 4.75 | 282.64 |
| 1975 | 37.65 | 2,240.13 | 54.72 | 3,364.76 | 3.41 | 202.91 | ||||
| 1976 | 25.54 | 1,519.93 | 29.35 | 1,804.76 | 6.55 | 402.64 | 9.71 | 578.00 | ||
| 1978 | 42.41 | 2,523.57 | 32.48 | 1,997.35 | ||||||
| 1980 | 2.75 | 169.09 | 26.75 | 1,591.74 | 18.79 | 1,155.35 | 0.00 | 0.00 | ||
| 1981 | 3.52 | 216.44 | 25.78 | 1,534.02 | 20.63 | 1,268.49 | ||||
| 1982 | 33.07 | 1,967.80 | 46.24 | 2,843.19 | 0.06 | 3.69 | 1.50 | 89.26 | ||
| 1983 | 28.43 | 1,691.70 | 30.32 | 1,864.30 | ||||||
| 1984 | 27.38 | 1,629.22 | 38.55 | 2,370.35 | 8.85 | 544.17 | ||||
| 1985 | ||||||||||
| 1986 | ||||||||||
| 1987 | 15.95 | 980.73 | 37.64 | 2,239.74 | 29.61 | 1,820.65 | ||||
| 1988 | 13.51 | 830.68 | ||||||||
| 1989 | 7.12 | 437.79 | 19.93 | 1,185.92 | 19.32 | 1,187.94 | ||||
| 1990 | 2.69 | 160.07 | ||||||||
| 1991 | 20.36 | 1,211.25 | ||||||||
| 1992 | 32.49 | 1,997.73 | 34.03 | 2,024.93 | 23.64 | 1,453.57 | 20.16 | 1,239.59 | 6.39 | 380.23 |
| 1993 | 45.01 | 2,678.28 | 30.48 | 1,874.14 | 6.20 | 381.22 | 5.79 | 344.53 | ||
| 1994 | 26.08 | 1,603.60 | 42.44 | 2,525.36 | 31.88 | 1,960.22 | 9.07 | 557.69 | 5.85 | 348.10 |
| 1995 | 19.71 | 1,211.92 | 33.16 | 1,973.16 | 34.78 | 2,138.54 | 8.87 | 545.40 | 10.94 | 650.98 |
| 1996 | 8.77 | 539.25 | 28.47 | 1,694.08 | 20.57 | 1,264.80 | ||||
| 1997 | ||||||||||
| 1998 | 2.19 | 134.76 | ||||||||
| Averages: | 15.28 | 939.42 | 31.42 | 1,869.71 | 30.43 | 1,870.89 | 6.20 | 380.92 | 6.04 | 359.58 |
Data:
1980: 5/14, 6 cfs; 5/24, 5 cfs; 5/28, 3 cfs; 6/4, 5 cfs; 6/9, 10 cfs; 6/13, 30 cfs; 6/17, 32 cfs; 6/24, 40 cfs; 6/27, 40 cfs; 7/7, 58 cfs; 7/10, 40 cfs; 7/16, 7/17, 8/1 1, off.
1981: 5/13, 2 cfs (est); 5/27, 6 cfs; 6/9, 30 cfs; 6/15, 21 cfs; 7/6, 38 cfs; 7/15, 32 cfs; 7/24, 7/30, off; 8/7, 2 cfs (est).
1982: 5/24, off; 6/9, 20 cfs; 6/18, 40 cfs; 6/24, 45 cfs; 7/7, 62 cfs; 7/19, 55 cfs; 8/2, 9/6, off; 9/21, 6 cfs (est).
1983: 6/3, off; 6/22, 44 cfs; 6/27, 50 cfs; 7/11, 50 cfs; 7/19, 32 cfs; 7/26, off.
1984: 5/22, 4 cfs; 5/30, 2 cfs; 6/9, 17 cfs; 6/18, 31 cfs; 7/2, 50 cfs; 7/10, 45 cfs; 7/16, 30 cfs; 7/26, 38 cfs; 8/20, off.
1986: 6/18, 22.5 cfs; 6/26, 39 cfs; 7/9, 22.5 cfs.
1987: 5/6, 16.3 cfs; 5/7, 9.6 cfs; 6/2, 29.7 cfs; 6/23, 42.9 cfs; 7/13, 39.3 cfs; 7/15, 35.7 cfs; 8/3, 3.0 cfs.
1988: 6/1, 46.3 cfs; 7/14, 35.1 cfs; 7/26, 21.8 cfs; 8/1, 4 cfs; 8/5, 4 cfs.
1989: 5/4, 4 cfs; 5/17, 3 cfs; 5/26, 15 cfs; 6/8, 18 cfs; 6/26, 21 cfs; 7/3, 33 cfs; 8/2, 3 cfs.
1990: 5/21, 10.5 cfs; 6/13, 1.9 cfs (est); 7/12, 1.3 cfs (est).
1991: 6/10, 23.40 cfs; 7/2, 35.30 cfs.
1992: 4/15, 12.00 cfs; 5/6, 18.00 cfs; 5/26, 50.30 cfs; 5/27, 38.00 cfs; 6/3, 40.00 cfs; 6/16, 35.00 cfs; 6/24, 30.00 cfs; 7/17, 15.00 cfs; 7/18, 25.00 cfs; 7/20, 30.00 cfs; 8/31, 15.00 cfs; 9/4, 10.00 cfs; 9/28, 3.00 cfs.
1993: 5/17, 39.30 cfs; 5/22, 45.00 cfs; 5/28, 48.60 cfs; 6/2, 45.00 cfs; 7/5, 45.00 cfs; 7/7, 44.00 cfs; 8/4, 6.00 cfs; 8/8, 6.00 cfs; 8/10, 6.00 cfs; 8/16, 6.00 cfs; 8/20, 6.00 cfs; 8/23, 6.00 cfs; 9/20, 6.00 cfs; 9/23, 6.00 cfs; 9/25, 6.00 cfs; 9/29, 4.50 cfs; 10/2, 4.00 cfs.
1994: 5/2, off; 5/26, 45.30 cfs; 6/14, 38.00 cfs; 6/16, 40.00 cfs; 6/24, 48.80 cfs; 7/6, 35.00 cfs; 7/20, 38.00 cfs; 8/1, 10.00 cfs; 8/11, 9.00 cfs; 8/22, 9.00 cfs; 9/8, 8.00 cfs; 9/20, 10.00 cfs; 9/21, 10.00 cfs.
1995: 4/3, 4/30, off; 5/1, 12.5 cfs; 5/7, 18.8 cfs; 5/13, 20.0 cfs; 5/25, 21.5 cfs; 6/3, 22.0 cfs; 6/9, 33.0 cfs; 6/24, 37.8 cfs; 7/1, 35 cfs (est); 7/31, 35.0 cfs; 8/2, 8.0 cfs; 8/24, 7.5 cfs; 9/5, 18.7 cfs; 9/22, 12.0 cfs (est).
1996: 5/10, 2.0 cfs (est); 5/14, 8.5 cfs (est); 6/25, 33.9 cfs; 7/8, 42 cfs (est); 7/25, off; 8/13, 1.5 cfs (est).
1997: 7/8, 28.2 cfs.
1998: 6/1, 33.05 cfs; 7/29, 2.5 cfs; 9/3, 1.9 cfs.
Supply: 1980, below average; 1981, slightly below average; 1982, average (late peak); 1983, above average; 1984, above average; 1985, below average; 1986, average to slightly above average; 1988: very below average; 1989, below average; 1990, below average; 1991, slightly below average; 1992, below average; 1993, average; 1994, below average; 1995, average to above average; 1996, average; 1997, average; 1998, average to above average.
Source: State Engineer's Office, Annual Hydrographers' Reports.
| COLORADO DITCH NEAR PINEDALE BY COUNTY ROAD | STATION NO. 006040.00 |
| LATITUDE 42-53-17 LONGITUDE 109-52-11 | |
| NW1/4SE1/4 SECTION 28 TOWNSHIP 34 N, RANGE 109 W 6TH P.M. | |
| ELEVATION 7220.00 FT DRAINAGE AREA UNKNOWN | |
| NONCONTRIBUTING AREA UNKNOWN BASIN 15570500 | |
| SUBLETTE COUNTY DATA FROM WATER COMMISSIONERS (P) |
| MEAN DAILY FLOW IN CFS BY WATER YEAR | |||||||||||||
| 1974 | |||||||||||||
| DAY | OCT | NOV | DEC | JAN | FEB | MAR | APR | MAY | JUNE | JULY | AUG | SEPT | DAY |
| 1 | ** | ** | ** | ** | ** | ** | ** | ** | 54.00 | 57.00 | 0.00 | 0.00 | 1 |
| 2 | ** | ** | ** | ** | ** | ** | ** | ** | 54.00 | 56.80 | 0.00 | 0.00 | 2 |
| 3 | ** | ** | ** | ** | ** | ** | ** | ** | 53.00 | 57.00 | 0.00 | 0.00 | 3 |
| 4 | ** | ** | ** | ** | ** | ** | ** | ** | 53.00 | 57.00 | 0.00 | 0.00 | 4 |
| 5 | ** | ** | ** | ** | ** | ** | ** | ** | 53.00 | 58.00 | 0.00 | 0.00 | 5 |
| 6 | ** | ** | ** | ** | ** | ** | ** | ** | 53.00 | 59.00 | 0.00 | 0.00 | 6 |
| 7 | ** | ** | ** | ** | ** | ** | ** | 7.00 | 53.00 | 60.00 | 0.00 | 0.00 | 7 |
| 8 | ** | ** | ** | ** | ** | ** | ** | 7.00 | 52.50 | 63.00 | 0.00 | 0.00 | 8 |
| 9 | ** | ** | ** | ** | ** | ** | ** | 7.00 | 52.00 | 63.00 | 0.00 | 0.00 | 9 |
| 10 | ** | ** | ** | ** | ** | ** | ** | 7.00 | 52.00 | 63.00 | 0.00 | 0.00 | 10 |
| 11 | ** | ** | ** | ** | ** | ** | ** | 8.00 | 53.00 | 62.00 | 0.00 | 0.00 | 11 |
| 12 | ** | ** | ** | ** | ** | ** | ** | 9.00 | 53.00 | 60.00 | 0.00 | 0.00 | 12 |
| 13 | ** | ** | ** | ** | ** | ** | ** | 10.00 | 53.00 | 58.00 | 0.00 | 0.00 | 13 |
| 14 | ** | ** | ** | ** | ** | ** | ** | 10.00 | 54.00 | 56.00 | 0.00 | 0.00 | 14 |
| 15 | ** | ** | ** | ** | ** | ** | ** | 10.01 | 54.00 | 54.00 | 0.00 | 0.00 | 15 |
| 16 | ** | ** | ** | ** | ** | ** | ** | 14.00 | 55.00 | 52.00 | 0.00 | 0.00 | 16 |
| 17 | ** | ** | ** | ** | ** | ** | ** | 18.00 | 55.00 | 50.10 | 0.00 | 0.00 | 17 |
| 18 | ** | ** | ** | ** | ** | ** | ** | 20.00 | 56.00 | 48.00 | 0.00 | 0.00 | 18 |
| 19 | ** | ** | ** | ** | ** | ** | ** | 24.00 | 56.00 | 46.00 | 0.00 | 17.50 | 19 |
| 20 | ** | ** | ** | ** | ** | ** | ** | 28.00 | 57.00 | 44.00 | 0.00 | 16.00 | 20 |
| 21 | ** | ** | ** | ** | ** | ** | ** | 32.00 | 57.00 | 42.00 | 0.00 | 16.00 | 21 |
| 22 | ** | ** | ** | ** | ** | ** | ** | 36.80 | 57.00 | 40.00 | 0.00 | 15.00 | 22 |
| 23 | ** | ** | ** | ** | ** | ** | ** | 38.30 | 57.00 | 38.00 | 0.00 | 14.00 | 23 |
| 24 | ** | ** | ** | ** | ** | ** | ** | 39.80 | 57.00 | 36.00 | 0.00 | 13.00 | 24 |
| 25 | ** | ** | ** | ** | ** | ** | ** | 41.30 | 57.00 | 34.00 | 0.00 | 12.00 | 25 |
| 26 | ** | ** | ** | ** | ** | ** | ** | 42.80 | 57.00 | 0.00 | 0.00 | 11.00 | 26 |
| 27 | ** | ** | ** | ** | ** | ** | ** | 44.30 | 57.00 | 0.00 | 0.00 | 7.00 | 27 |
| 28 | ** | ** | ** | ** | ** | ** | ** | 45.80 | 57.00 | 0.00 | 0.00 | 7.00 | 28 |
| 29 | ** | ** | ** | ** | ** | ** | 48.50 | 57.00 | 0.00 | 0.00 | 7.00 | 29 | |
| 30 | ** | ** | ** | ** | ** | ** | 51.90 | 57.00 | 0.00 | 0.00 | 7.00 | 30 | |
| 31 | ** | ** | ** | ** | 54.00 | 0.00 | 0.00 | 31 | |||||
| TOTAL | ** | ** | ** | ** | ** | ** | ** | 654.41* | 1645.50 | 1313.90 | 0.00 | 142.50 | |
| MEAN | ** | ** | ** | ** | ** | ** | ** | 26.18* | 54.85 | 42.38 | 0.00 | 4.75 | |
| AC-FT | ** | ** | ** | ** | ** | ** | ** | 1298.20* | 3263.80 | 2606.08 | 0.00 | 282.64 | |
| COLORADO DITCH NEAR PINEDALE BY COUNTY ROAD | STATION NO. 006040.00 |
| LATITUDE 42-53-17 LONGITUDE 109-52-11 | |
| NW1/4SE1/4 SECTION 28 TOWNSHIP 34 N, RANGE 109 W 6TH P.M. | |
| ELEVATION 7220.00 FT DRAINAGE AREA UNKNOWN | |
| NONCONTRIBUTING AREA UNKNOWN BASIN 15570500 | |
| SUBLETTE COUNTY DATA FROM WATER COMMISSIONERS (P) |
| MEAN DAILY FLOW IN CFS BY WATER YEAR | |||||||||||||
| 1975 | |||||||||||||
| DAY | OCT | NOV | DEC | JAN | FEB | MAR | APR | MAY | JUNE | JULY | AUG | SEPT | DAY |
| 1 | 7.00 | ** | ** | ** | ** | ** | ** | ** | 12.00 | 50.90 | 48.00 | ** | 1 |
| 2 | 7.00 | ** | ** | ** | ** | ** | ** | ** | 13.00 | 53.00 | 47.00 | ** | 2 |
| 3 | 7.00 | ** | ** | ** | ** | ** | ** | ** | 14.00 | 54.00 | 47.00 | ** | 3 |
| 4 | 7.00 | ** | ** | ** | ** | ** | ** | ** | 15.00 | 55.00 | ** | ** | 4 |
| 5 | 7.00 | ** | ** | ** | ** | ** | ** | ** | 20.00 | 56.00 | ** | ** | 5 |
| 6 | 9.00 | ** | ** | ** | ** | ** | ** | ** | 25.00 | 57.00 | ** | ** | 6 |
| 7 | 9.00 | ** | ** | ** | ** | ** | ** | ** | 30.00 | 58.00 | ** | ** | 7 |
| 8 | 9.00 | ** | ** | ** | ** | ** | ** | ** | 35.00 | 59.70 | ** | ** | 8 |
| 9 | 9.00 | ** | ** | ** | ** | ** | ** | ** | 37.30 | 60.00 | ** | ** | 9 |
| 10 | 9.00 | ** | ** | ** | ** | ** | ** | ** | 38.00 | 59.00 | ** | 2.30 | 10 |
| 11 | 9.00 | ** | ** | ** | ** | ** | ** | ** | 39.00 | 59.00 | ** | 3.00 | 11 |
| 12 | 8.00 | ** | ** | ** | ** | ** | ** | ** | 40.00 | 59.00 | ** | 3.00 | 12 |
| 13 | 8.00 | ** | ** | ** | ** | ** | ** | ** | 41.00 | 58.00 | ** | 3.00 | 13 |
| 14 | 7.00 | ** | ** | ** | ** | ** | ** | ** | 42.00 | 58.00 | ** | 3.00 | 14 |
| 15 | ** | ** | ** | ** | ** | ** | ** | ** | 42.00 | 58.00 | ** | 3.00 | 15 |
| 16 | ** | ** | ** | ** | ** | ** | ** | ** | 42.90 | 57.00 | ** | 3.00 | 16 |
| 17 | ** | ** | ** | ** | ** | ** | ** | ** | 43.00 | 57.00 | ** | 3.00 | 17 |
| 18 | ** | ** | ** | ** | ** | ** | ** | ** | 43.00 | 57.00 | ** | 3.00 | 18 |
| 19 | ** | ** | ** | ** | ** | ** | ** | ** | 43.00 | 56.00 | ** | 3.00 | 19 |
| 20 | ** | ** | ** | ** | ** | ** | ** | ** | 43.00 | 55.00 | ** | 3.00 | 20 |
| 21 | ** | ** | ** | ** | ** | ** | ** | ** | 44.00 | 54.00 | ** | 7.00 | 21 |
| 22 | ** | ** | ** | ** | ** | ** | ** | ** | 44.00 | 53.00 | ** | 7.00 | 22 |
| 23 | ** | ** | ** | ** | ** | ** | ** | ** | 44.00 | 52.50 | ** | 7.00 | 23 |
| 24 | ** | ** | ** | ** | ** | ** | ** | ** | 44.50 | 52.00 | ** | 7.00 | 24 |
| 25 | ** | ** | ** | ** | ** | ** | ** | ** | 46.00 | 51.00 | ** | 7.00 | 25 |
| 26 | ** | ** | ** | ** | ** | ** | ** | ** | 48.00 | 51.00 | ** | 7.00 | 26 |
| 27 | ** | ** | ** | ** | ** | ** | ** | ** | 50.00 | 50.00 | ** | 7.00 | 27 |
| 28 | ** | ** | ** | ** | ** | ** | ** | ** | 50.10 | 50.00 | ** | 7.00 | 28 |
| 29 | ** | ** | ** | ** | ** | ** | ** | 50.10 | 49.30 | ** | 7.00 | 29 | |
| 30 | ** | ** | ** | ** | ** | ** | ** | 50.50 | 49.00 | ** | 7.00 | 30 | |
| 31 | ** | ** | ** | ** | 11.35 | 48.00 | ** | 31 | |||||
| TOTAL | 112.00* | ** | ** | ** | ** | ** | ** | 11.35* | 1129.40 | 1696.40 | 142.00* | 102.30* | |
| MEAN | 8.00* | ** | ** | ** | ** | ** | ** | 11.35* | 37.65 | 54.72 | 47.33* | 4.87* | |
| AC-FT | 221.15* | ** | ** | ** | ** | ** | ** | 22.51* | 2240.13 | 3364.76 | 281.65* | 202.91* | |
| COLORADO DITCH NEAR PINEDALE BY COUNTY ROAD | STATION NO. 006040.00 |
| LATITUDE 42-53-17 LONGITUDE 109-52-11 | |
| NW1/4SE1/4 SECTION 28 TOWNSHIP 34 N, RANGE 109 W 6TH P.M. | |
| ELEVATION 7220.00 FT DRAINAGE AREA UNKNOWN | |
| NONCONTRIBUTING AREA UNKNOWN BASIN 15570500 | |
| SUBLETTE COUNTY DATA FROM WATER COMMISSIONERS (P) |
| MEAN DAILY FLOW IN CFS BY WATER YEAR | |||||||||||||
| 1976 | |||||||||||||
| DAY | OCT | NOV | DEC | JAN | FEB | MAR | APR | MAY | JUNE | JULY | AUG | SEPT | DAY |
| 1 | ** | ** | ** | ** | ** | ** | ** | ** | 18.30 | 30.00 | 5.00 | 5.00 | 1 |
| 2 | 3.50 | ** | ** | ** | ** | ** | ** | ** | 19.00 | 30.00 | 4.75 | 5.28 | 2 |
| 3 | 27.30 | ** | ** | ** | ** | ** | ** | ** | 21.00 | 30.00 | 5.00 | 5.00 | 3 |
| 4 | 27.00 | ** | ** | ** | ** | ** | ** | ** | 24.00 | 30.00 | 5.00 | 5.00 | 4 |
| 5 | 27.00 | ** | ** | ** | ** | ** | ** | ** | 27.00 | 31.00 | 6.00 | 5.00 | 5 |
| 6 | 27.00 | ** | ** | ** | ** | ** | ** | ** | 30.00 | 31.00 | 6.00 | 5.00 | 6 |
| 7 | 27.00 | ** | ** | ** | ** | ** | ** | ** | 33.00 | 31.00 | 7.00 | 5.04 | 7 |
| 8 | 26.00 | ** | ** | ** | ** | ** | ** | ** | 36.00 | 32.00 | 8.00 | 5.00 | 8 |
| 9 | 26.00 | ** | ** | ** | ** | ** | ** | ** | 39.80 | 32.00 | 9.00 | 5.00 | 9 |
| 10 | 26.00 | ** | ** | ** | ** | ** | ** | ** | 41.00 | 33.00 | 9.50 | 5.00 | 10 |
| 11 | 25.00 | ** | ** | ** | ** | ** | ** | ** | 41.00 | 34.00 | 10.00 | 12.00 | 11 |
| 12 | 25.00 | ** | ** | ** | ** | ** | ** | ** | 41.00 | 35.00 | 10.00 | 12.00 | 12 |
| 13 | 25.00 | ** | ** | ** | ** | ** | ** | ** | 36.00 | 36.50 | 9.00 | 12.60 | 13 |
| 14 | 24.00 | ** | ** | ** | ** | ** | ** | ** | 32.00 | 36.00 | 9.00 | 12.00 | 14 |
| 15 | 24.00 | ** | ** | ** | ** | ** | ** | ** | 32.50 | 35.00 | 8.00 | 12.00 | 15 |
| 16 | 24.00 | ** | ** | ** | ** | ** | ** | ** | 32.00 | 35.00 | 8.00 | 12.00 | 16 |
| 17 | 23.00 | ** | ** | ** | ** | ** | ** | 8.95 | 34.00 | 34.00 | 7.00 | 12.00 | 17 |
| 18 | 23.00 | ** | ** | ** | ** | ** | ** | 9.00 | 34.00 | 33.00 | 6.00 | 12.00 | 18 |
| 19 | 23.00 | ** | ** | ** | ** | ** | ** | 9.00 | ** | 32.50 | 5.00 | 12.00 | 19 |
| 20 | 22.00 | ** | ** | ** | ** | ** | ** | 9.00 | ** | 32.00 | 4.75 | 12.00 | 20 |
| 21 | 22.00 | ** | ** | ** | ** | ** | ** | 9.00 | ** | 32.00 | 5.00 | 12.00 | 21 |
| 22 | 22.00 | ** | ** | ** | ** | ** | ** | 9.00 | ** | 32.00 | 5.00 | 12.00 | 22 |
| 23 | 21.00 | ** | ** | ** | ** | ** | ** | 9.00 | 24.90 | 31.00 | 5.00 | 12.19 | 23 |
| 24 | 21.00 | ** | ** | ** | ** | ** | ** | 9.00 | 24.00 | 31.10 | 5.00 | 12.00 | 24 |
| 25 | 21.00 | ** | ** | ** | ** | ** | ** | 9.00 | 24.00 | 30.00 | 6.00 | 12.00 | 25 |
| 26 | 20.00 | ** | ** | ** | ** | ** | ** | 8.95 | 23.70 | 29.00 | 6.00 | 12.00 | 26 |
| 27 | 20.10 | ** | ** | ** | ** | ** | ** | 9.00 | 23.00 | 28.00 | 6.00 | 12.00 | 27 |
| 28 | 19.00 | ** | ** | ** | ** | ** | ** | 12.00 | 23.00 | 27.00 | 6.00 | 12.00 | 28 |
| 29 | 18.00 | ** | ** | ** | ** | ** | 15.00 | 23.10 | 6.00 | 6.00 | 12.30 | 29 | |
| 30 | ** | ** | ** | ** | ** | ** | 18.00 | 29.00 | 5.80 | 6.00 | 12.00 | 30 | |
| 31 | ** | ** | ** | ** | 18.00 | 5.00 | 5.00 | 31 | |||||
| TOTAL | 638.90* | ** | ** | ** | ** | ** | ** | 161.90* | 766.30* | 909.90 | 203.00 | 291.41 | |
| MEAN | 22.82* | ** | ** | ** | ** | ** | ** | 10.79* | 29.47* | 29.35 | 6.55 | 9.71 | |
| AC-FT | 1267.24* | ** | ** | ** | ** | ** | ** | 321.12* | 1519.93* | 1804.76 | 402.64 | 578.00 | |
| COLORADO DITCH NEAR PINEDALE BY COUNTY ROAD | STATION NO. 006040.00 |
| LATITUDE 42-53-17 LONGITUDE 109-52-11 | |
| NW1/4SE1/4 SECTION 28 TOWNSHIP 34 N, RANGE 109 W 6TH P.M. | |
| ELEVATION 7220.00 FT DRAINAGE AREA UNKNOWN | |
| NONCONTRIBUTING AREA UNKNOWN BASIN 15570500 | |
| SUBLETTE COUNTY DATA FROM WATER COMMISSIONERS (P) |
| MEAN DAILY FLOW IN CFS BY WATER YEAR | |||||||||||||
| 1978 | |||||||||||||
| DAY | OCT | NOV | DEC | JAN | FEB | MAR | APR | MAY | JUNE | JULY | AUG | SEPT | DAY |
| 1 | ** | ** | ** | ** | ** | ** | ** | ** | 12.00 | 50.90 | 48.00 | ** | 1 |
| 2 | ** | ** | ** | ** | ** | ** | ** | ** | 33.00 | 56.00 | ** | ** | 2 |
| 3 | ** | ** | ** | ** | ** | ** | ** | ** | 33.00 | 55.00 | ** | ** | 3 |
| 4 | ** | ** | ** | ** | ** | ** | ** | ** | 33.00 | 54.00 | ** | ** | 4 |
| 5 | ** | ** | ** | ** | ** | ** | ** | ** | 33.30 | 53.00 | ** | ** | 5 |
| 6 | ** | ** | ** | ** | ** | ** | ** | ** | 33.00 | 52.00 | ** | ** | 6 |
| 7 | ** | ** | ** | ** | ** | ** | ** | ** | 34.00 | 50.00 | ** | ** | 7 |
| 8 | ** | ** | ** | ** | ** | ** | ** | ** | 35.00 | 48.00 | ** | ** | 8 |
| 9 | ** | ** | ** | ** | ** | ** | ** | ** | 38.00 | 46.00 | ** | ** | 9 |
| 10 | ** | ** | ** | ** | ** | ** | ** | ** | 40.00 | 44.00 | ** | ** | 10 |
| 11 | ** | ** | ** | ** | ** | ** | ** | ** | 42.00 | 40.00 | ** | ** | 11 |
| 12 | ** | ** | ** | ** | ** | ** | ** | ** | 44.00 | 32.00 | ** | ** | 12 |
| 13 | ** | ** | ** | ** | ** | ** | ** | ** | 46.00 | 28.00 | ** | ** | 13 |
| 14 | ** | ** | ** | ** | ** | ** | ** | ** | 46.00 | 28.00 | ** | ** | 14 |
| 15 | ** | ** | ** | ** | ** | ** | ** | ** | 46.00 | 28.00 | ** | ** | 15 |
| 16 | ** | ** | ** | ** | ** | ** | ** | ** | 46.00 | 49.00 | ** | ** | 16 |
| 17 | ** | ** | ** | ** | ** | ** | ** | ** | 46.00 | 49.00 | ** | ** | 17 |
| 18 | ** | ** | ** | ** | ** | ** | ** | ** | 46.00 | 49.00 | ** | ** | 18 |
| 19 | ** | ** | ** | ** | ** | ** | ** | ** | 46.00 | 49.00 | ** | ** | 19 |
| 20 | ** | ** | ** | ** | ** | ** | ** | 6.00 | 47.00 | 48.00 | ** | 19.00 | 20 |
| 21 | ** | ** | ** | ** | ** | ** | ** | 6.00 | 47.00 | 46.00 | ** | 18.00 | 21 |
| 22 | ** | ** | ** | ** | ** | ** | ** | 6.00 | 47.00 | 44.00 | ** | 18.00 | 22 |
| 23 | ** | ** | ** | ** | ** | ** | ** | 6.00 | 48.00 | 2.00 | ** | 17.00 | 23 |
| 24 | ** | ** | ** | ** | ** | ** | ** | 6.00 | 48.00 | 2.00 | ** | 17.00 | 24 |
| 25 | ** | ** | ** | ** | ** | ** | ** | 6.00 | 49.00 | ** | ** | 17.00 | 25 |
| 26 | ** | ** | ** | ** | ** | ** | ** | 6.00 | 50.00 | ** | ** | 16.00 | 26 |
| 27 | ** | ** | ** | ** | ** | ** | ** | 6.00 | 51.00 | ** | ** | 16.00 | 27 |
| 28 | ** | ** | ** | ** | ** | ** | ** | 6.00 | 52.00 | ** | ** | 16.00 | 28 |
| 29 | ** | ** | ** | ** | ** | ** | 6.00 | 53.00 | ** | ** | 15.00 | 29 | |
| 30 | ** | ** | ** | ** | ** | ** | 6.00 | 54.00 | ** | ** | 14.00 | 30 | |
| 31 | ** | ** | ** | ** | 6.00 | ** | ** | 31 | |||||
| TOTAL | ** | ** | ** | ** | ** | ** | ** | 72.00* | 1272.30 | 1007.00* | ** | 183.00* | |
| MEAN | ** | ** | ** | ** | ** | ** | ** | 6.00* | 42.41 | 41.96* | ** | 16.64* | |
| AC-FT | *** | ** | ** | ** | ** | ** | ** | 142.81* | 2523.57 | 1997.35* | ** | 362.98* | |
Source: Wyoming Water Resources Data System, March 20, 2000
Converse Ditch, West Fork New Fork River
Diversion Description: Diversion consists of two 8' wide concrete and plank drop gates.1
Conveyance Description: Open Channel Canal, approximately 11 miles long1
Wyoming Water Rights Summary:
| Priority Date (M-D-Y) | Permit Number |
Permitted Use | Acres | Flow (cfs) |
Cumulative Flow (cfs) | Comments |
| 08-09-1898 | 1928 | Irrigation | 622.00 | 8.88 | 8.88 | POD/MOC change from a portion of Belknap & Noble Ditch. |
| 11-05-1900 | 2898 | Irrigation | 320.00 | 4.57 | 13.45 | POD/MOC change from a portion of Belknap & Noble Ditch. |
| 10-31-1901 | 3519 | Irrigation | 720.00 | 10.26 | 23.71 | |
| 11-11-1903 | 5855 | Irrigation | 23.71 | 2,532.58 AF Secondary Supply from New Fork Lake Reservoir (480R) (1,822.00 acres served) | ||
| 04-26-1906 | 1545E | Irrigation | 80.00 | 1.14 | 24.85 |
Storage Rights: New Fork Lake Reservoir.
Estimated Canal Losses: Greater than typical losses (50%) are experienced.1
Irrigation Practices: Lands are flood irrigated.1
Crop Types / Consumptive Use: Approximately 100 acres alfalfa; remaining lands are native grass hay and pasture.1
Return Flows: Return flows are delivered to Duck Creek south of Cora.2
Other Operational Information: The canal is typically turned on in late May and irrigation flows stop in late July. Stock flows continue until October.1
|
Converse Ditch, West Fork New Fork River, Diversion Data
| Wateryear | May | June | July | August | September | |||||
| Average (cfs) | Monthly Total (AF) | Average (cfs) | Monthly Total (AF) | Average (cfs) | Monthly Total (AF) | Average (cfs) | Monthly Total (AF) | Average (cfs) | Monthly Total (AF) | |
| 1980 | ||||||||||
| 1981 | ||||||||||
| 1982 | ||||||||||
| 1983 | ||||||||||
| 1984 | 43.99 | 2,617.79 | 32.26 | 1,983.47 | 0.03 | 1.86 | 0.54 | 32.39 | ||
| 1985 | 17.53 | 1,077.90 | 37.34 | 2,221.59 | 18.31 | 1,125.86 | 1.79 | 110.24 | 9.03 | 537.32 |
| 1986 | 55.54 | 3,304.88 | 44.89 | 2,760.28 | 0.00 | 0.00 | 4.20 | 250.06 | ||
| 1987 | 24.09 | 1,480.98 | 32.79 | 1,951.18 | 21.36 | 1,313.49 | 0.00 | 0.00 | 6.39 | 380.15 |
| 1988 | ||||||||||
| 1989 | ||||||||||
| 1990 | ||||||||||
| 1991 | ||||||||||
| 1992 | ||||||||||
| 1993 | ||||||||||
| 1994 | 17.20 | 1,057.59 | 27.18 | 1,617.32 | 6.87 | 422.19 | ||||
| 1995 | 38.82 | 2,309.95 | 50.96 | 3,133.41 | ||||||
| 1996 | ||||||||||
| 1997 | ||||||||||
| 1998 | ||||||||||
| Averages: | 19.61 | 1,205.49 | 39.28 | 2,337.12 | 29.11 | 1,789.78 | 0.46 | 28.03 | 5.04 | 299.98 |
Data:
1993: 6/3, 65.00 cfs.
1994: 5/13, 25.00 cfs; 6/13, 35.00 cfs; 7/2, 10.20 cfs; 7/22, 10.00 cfs; 9/7, 6.00 cfs.
1995: 6/7, 25.0 cfs (est); 6/21, 58 cfs (est); 7/18, 59.9 cfs; 8/9, off.
1998: 6/9, 46.2 cfs.
Supply: 1980, below average; 1981, slightly below average; 1982, average (late peak); 1983, above average; 1984, above average; 1985, below average; 1986, average to slightly above average; 1988: very below average; 1989, below average; 1990, below average; 1991, slightly below average; 1992, below average; 1993, average; 1994, below average; 1995, average to above average; 1996, average; 1997, average; 1998, average to above average.
Source: State Engineer's Office, Annual Hydrographers' Reports.
| CONVERSE DITCH | STATION NO. 0077122.00 |
| LATITUDE 42-54-35 LONGITUDE 109-58-42 | |
| SE1/4SE1/4 SECTION 3 TOWNSHIP 35 N, RANGE 110 W 6TH P.M. | |
| ELEVATION 7317.00 FT DRAINAGE AREA UNKNOWN | |
| NONCONTRIBUTING 0.00 SQ MI BASIN 15570000 | |
| SUBLETTE COUNTY DATA FROM WWRC (C) | |
| ***TO USE THIS DATA, SEE VIC HASFURTHER*** |
| MEAN DAILY FLOW IN CFS BY WATER YEAR | |||||||||||||
| 1984 | |||||||||||||
| DAY | OCT | NOV | DEC | JAN | FEB | MAR | APR | MAY | JUNE | JULY | AUG | SEPT | DAY |
| 1 | ** | ** | ** | ** | ** | ** | ** | ** | 50.90 | 41.50 | 0.06 | 0.01 | 1 |
| 2 | ** | ** | ** | ** | ** | ** | ** | ** | 52.00 | 41.20 | 0.06 | 0.01 | 2 |
| 3 | ** | ** | ** | ** | ** | ** | ** | ** | 52.40 | 41.50 | 0.06 | 0.01 | 3 |
| 4 | ** | ** | ** | ** | ** | ** | ** | ** | 43.30 | 49.80 | 0.06 | 0.01 | 4 |
| 5 | ** | ** | ** | ** | ** | ** | ** | ** | 41.90 | 51.20 | 0.06 | 0.01 | 5 |
| 6 | ** | ** | ** | ** | ** | ** | ** | ** | 50.50 | 46.90 | 0.04 | 0.01 | 6 |
| 7 | ** | ** | ** | ** | ** | ** | ** | ** | 48.30 | 43.70 | 0.04 | 0.01 | 7 |
| 8 | ** | ** | ** | ** | ** | ** | ** | ** | 45.80 | 41.90 | 0.04 | 0.01 | 8 |
| 9 | ** | ** | ** | ** | ** | ** | ** | ** | 44.70 | 38.70 | 0.04 | 0.01 | 9 |
| 10 | ** | ** | ** | ** | ** | ** | ** | ** | 46.50 | 37.70 | 0.04 | 0.01 | 10 |
| 11 | ** | ** | ** | ** | ** | ** | ** | ** | 50.20 | 39.80 | 0.04 | 0.01 | 11 |
| 12 | ** | ** | ** | ** | ** | ** | ** | ** | 44.70 | 38.70 | 0.04 | 0.01 | 12 |
| 13 | ** | ** | ** | ** | ** | ** | ** | ** | 41.50 | 39.80 | 0.04 | 0.01 | 13 |
| 14 | ** | ** | ** | ** | ** | ** | ** | ** | 38.70 | 37.70 | 0.04 | 0.01 | 14 |
| 15 | ** | ** | ** | ** | ** | ** | ** | ** | 35.60 | 32.90 | 0.04 | 0.01 | 15 |
| 16 | ** | ** | ** | ** | ** | ** | ** | ** | 45.80 | 32.90 | 0.02 | 0.01 | 16 |
| 17 | ** | ** | ** | ** | ** | ** | ** | ** | 46.50 | 34.60 | 0.02 | 0.01 | 17 |
| 18 | ** | ** | ** | ** | ** | ** | ** | ** | 45.10 | 38.40 | 0.02 | 0.01 | 18 |
| 19 | ** | ** | ** | ** | ** | ** | ** | ** | 39.40 | 45.40 | 0.02 | 0.01 | 19 |
| 20 | ** | ** | ** | ** | ** | ** | ** | ** | 39.10 | 36.30 | 0.02 | 0.01 | 20 |
| 21 | ** | ** | ** | ** | ** | ** | ** | 15.88 | 39.10 | 37.00 | 0.02 | 0.01 | 21 |
| 22 | ** | ** | ** | ** | ** | ** | ** | 13.50 | 40.50 | 41.20 | 0.02 | 0.01 | 22 |
| 23 | ** | ** | ** | ** | ** | ** | ** | 10.97 | 40.50 | 43.00 | 0.02 | 0.01 | 23 |
| 24 | ** | ** | ** | ** | ** | ** | ** | 8.70 | 41.90 | 28.60 | 0.01 | 0.01 | 24 |
| 25 | ** | ** | ** | ** | ** | ** | ** | 9.64 | 44.40 | 24.20 | 0.01 | 0.01 | 25 |
| 26 | ** | ** | ** | ** | ** | ** | ** | 8.70 | 44.00 | 15.10 | 0.01 | 0.01 | 26 |
| 27 | ** | ** | ** | ** | ** | ** | ** | 22.20 | 43.00 | 0.06 | 0.01 | 0.01 | 27 |
| 28 | ** | ** | ** | ** | ** | ** | ** | 17.60 | 40.10 | 0.06 | 0.01 | 1.00 | 28 |
| 29 | ** | ** | ** | ** | ** | ** | ** | 16.30 | 40.10 | 0.06 | 0.01 | 7.53 | 29 |
| 30 | ** | ** | ** | ** | ** | ** | 47.60 | 43.30 | 0.06 | 0.01 | 7.53 | 30 | |
| 31 | ** | ** | ** | ** | 50.20 | 0.06 | 0.01 | 31 | |||||
| TOTAL | ** | ** | ** | ** | ** | ** | ** | 221.29* | 1319.80 | 1000.00 | 0.94 | 16.33 | |
| MEAN | ** | ** | ** | ** | ** | ** | ** | 20.12* | 43.99 | 32.26 | 0.03 | 0.54 | |
| AC-FT | ** | ** | ** | ** | ** | ** | ** | 438.92* | 2617.79 | 1983.47 | 1.86 | 32.39 | |
| CONVERSE DITCH | STATION NO. 0077122.00 |
| LATITUDE 42-54-35 LONGITUDE 109-58-42 | |
| SE1/4SE1/4 SECTION 3 TOWNSHIP 35 N, RANGE 110 W 6TH P.M. | |
| ELEVATION 7317.00 FT DRAINAGE AREA UNKNOWN | |
| NONCONTRIBUTING 0.00 SQ MI BASIN 15570000 | |
| SUBLETTE COUNTY DATA FROM WWRC (C) | |
| ***TO USE THIS DATA, SEE VIC HASFURTHER*** |
| MEAN DAILY FLOW IN CFS BY WATER YEAR | |||||||||||||
| 1985 | |||||||||||||
| DAY | OCT | NOV | DEC | JAN | FEB | MAR | APR | MAY | JUNE | JULY | AUG | SEPT | DAY |
| 1 | 7.25 | ** | ** | ** | ** | ** | ** | ** | 48.89 | 7.28 | 0.38 | 5.11 | 1 |
| 2 | 5.44 | ** | ** | ** | ** | ** | ** | ** | 70.91 | 6.77 | 0.38 | 6.53 | 2 |
| 3 | 6.70 | ** | ** | ** | ** | ** | ** | ** | 49.37 | 11.40 | 0.38 | 8.05 | 3 |
| 4 | 8.11 | ** | ** | ** | ** | ** | ** | ** | 49.37 | 31.44 | 0.38 | 8.85 | 4 |
| 5 | 8.11 | ** | ** | ** | ** | ** | ** | ** | 46.51 | 35.66 | 0.38 | 8.85 | 5 |
| 6 | 8.11 | ** | ** | ** | ** | ** | ** | ** | 38.29 | 37.40 | 0.38 | 9.12 | 6 |
| 7 | 7.53 | ** | ** | ** | ** | ** | ** | ** | 36.97 | 36.53 | 0.29 | 9.12 | 7 |
| 8 | 8.11 | ** | ** | ** | ** | ** | ** | ** | 36.53 | 35.66 | 0.07 | 9.40 | 8 |
| 9 | 9.32 | ** | ** | ** | ** | ** | ** | ** | 37.84 | 39.62 | 0.13 | 9.96 | 9 |
| 10 | 9.97 | ** | ** | ** | ** | ** | ** | 28.18 | 37.40 | 38.29 | 0.13 | 9.96 | 10 |
| 11 | 10.30 | ** | ** | ** | ** | ** | ** | 27.39 | 37.40 | 42.79 | 0.13 | 9.96 | 11 |
| 12 | 12.40 | ** | ** | ** | ** | ** | ** | 18.47 | 38.73 | 41.88 | 0.21 | 11.11 | 12 |
| 13 | 12.80 | ** | ** | ** | ** | ** | ** | 20.23 | 20.23 | 39.17 | 0.21 | 9.12 | 13 |
| 14 | 13.10 | ** | ** | ** | ** | ** | ** | 19.88 | 37.84 | 36.53 | 0.13 | 10.24 | 14 |
| 15 | 9.64 | ** | ** | ** | ** | ** | ** | 17.44 | 39.62 | 29.79 | 0.21 | 10.53 | 15 |
| 16 | 14.70 | ** | ** | ** | ** | ** | ** | 17.10 | 40.97 | 28.18 | 0.48 | 9.40 | 16 |
| 17 | 13.50 | ** | ** | ** | ** | ** | ** | 17.10 | 41.88 | 27.79 | 0.82 | 9.12 | 17 |
| 18 | 14.70 | ** | ** | ** | ** | ** | ** | 14.16 | 40.52 | 14.16 | 1.35 | 9.12 | 18 |
| 19 | 15.90 | ** | ** | ** | ** | ** | ** | 13.84 | 36.53 | 9.68 | 1.81 | 10.24 | 19 |
| 20 | 13.90 | ** | ** | ** | ** | ** | ** | 17.10 | 35.23 | 7.28 | 2.31 | 8.31 | 20 |
| 21 | 13.90 | ** | ** | ** | ** | ** | ** | 18.47 | 31.02 | 6.28 | 2.84 | 8.05 | 21 |
| 22 | 13.50 | ** | ** | ** | ** | ** | ** | 19.17 | 28.58 | 1.67 | 2.84 | 9.12 | 22 |
| 23 | 13.10 | ** | ** | ** | ** | ** | ** | 15.77 | 28.58 | 0.21 | 2.84 | 9.68 | 23 |
| 24 | 9.01 | ** | ** | ** | ** | ** | ** | 11.11 | 31.44 | 0.13 | 2.84 | 9.12 | 24 |
| 25 | 7.82 | ** | ** | ** | ** | ** | ** | 20.95 | 46.98 | 0.29 | 3.03 | 8.85 | 25 |
| 26 | 7.82 | ** | ** | ** | ** | ** | ** | 25.82 | 44.64 | 0.29 | 3.62 | 8.85 | 26 |
| 27 | 9.97 | ** | ** | ** | ** | ** | ** | 28.99 | 39.62 | 0.29 | 6.04 | 8.85 | 27 |
| 28 | ** | ** | ** | ** | ** | ** | ** | 28.18 | 28.18 | 0.29 | 6.28 | 9.12 | 28 |
| 29 | ** | ** | ** | ** | ** | ** | 29.79 | 11.40 | 0.29 | 4.24 | 8.85 | 29 | |
| 30 | ** | ** | ** | ** | ** | ** | 69.28 | 8.58 | 0.29 | 5.34 | 8.31 | 30 | |
| 31 | ** | ** | ** | ** | 65.02 | 0.29 | 5.11 | 31 | |||||
| TOTAL | 284.71* | ** | ** | ** | ** | ** | ** | 543.44* | 1120.05 | 567.62 | 55.58 | 270.90 | |
| MEAN | 10.54* | ** | ** | ** | ** | ** | ** | 24.70* | 37.34 | 18.31 | 1.79 | 9.03 | |
| AC-FT | 564.71* | ** | ** | ** | ** | ** | ** | 1077.90* | 2221.59 | 1125.86 | 110.24 | 537.32 | |
| CONVERSE DITCH | STATION NO. 0077122.00 |
| LATITUDE 42-54-35 LONGITUDE 109-58-42 | |
| SE1/4SE1/4 SECTION 3 TOWNSHIP 35 N, RANGE 110 W 6TH P.M. | |
| ELEVATION 7317.00 FT DRAINAGE AREA UNKNOWN | |
| NONCONTRIBUTING 0.00 SQ MI BASIN 15570000 | |
| SUBLETTE COUNTY DATA FROM WWRC (C) | |
| ***TO USE THIS DATA, SEE VIC HASFURTHER*** |
| MEAN DAILY FLOW IN CFS BY WATER YEAR | |||||||||||||
| 1986 | |||||||||||||
| DAY | OCT | NOV | DEC | JAN | FEB | MAR | APR | MAY | JUNE | JULY | AUG | SEPT | DAY |
| 1 | 8.05 | 7.02 | ** | ** | ** | ** | ** | ** | 33.78 | 74.80 | 0.00 | 0.00 | 1 |
| 2 | 7.79 | 7.28 | ** | ** | ** | ** | ** | ** | 36.29 | 76.96 | 0.00 | 0.00 | 2 |
| 3 | 7.53 | 7.28 | ** | ** | ** | ** | ** | ** | 29.74 | 74.27 | 0.00 | 0.00 | 3 |
| 4 | 7.53 | ** | ** | ** | ** | ** | ** | ** | 29.34 | 72.67 | 0.00 | 0.00 | 4 |
| 5 | 7.28 | ** | ** | ** | ** | ** | ** | ** | 58.81 | 67.94 | 0.00 | 0.00 | 5 |
| 6 | 7.28 | ** | ** | ** | ** | ** | ** | ** | 30.53 | 67.94 | 0.00 | 0.00 | 6 |
| 7 | 8.05 | ** | ** | ** | ** | ** | ** | ** | 79.13 | 68.46 | 0.00 | 0.00 | 7 |
| 8 | 8.05 | ** | ** | ** | ** | ** | ** | ** | 75.88 | 74.27 | 0.00 | 0.00 | 8 |
| 9 | 8.05 | ** | ** | ** | ** | ** | ** | ** | 68.83 | 72.67 | 0.00 | 0.00 | 9 |
| 10 | 8.85 | ** | ** | ** | ** | ** | ** | ** | 44.15 | 74.27 | 0.00 | 0.00 | 10 |
| 11 | 7.79 | ** | ** | ** | ** | ** | ** | ** | 45.05 | 70.56 | 0.00 | 0.00 | 11 |
| 12 | 7.79 | ** | ** | ** | ** | ** | ** | ** | 75.88 | 66.91 | 0.00 | 0.00 | 12 |
| 13 | 7.53 | ** | ** | ** | ** | ** | ** | ** | 74.80 | 66.39 | 0.00 | 0.00 | 13 |
| 14 | 7.53 | ** | ** | ** | ** | ** | ** | ** | 72.14 | 65.88 | 0.00 | 0.00 | 14 |
| 15 | 7.53 | ** | ** | ** | ** | ** | ** | ** | 64.34 | 70.56 | 0.00 | 0.00 | 15 |
| 16 | 7.53 | ** | ** | ** | ** | ** | ** | ** | 56.84 | 62.31 | 0.00 | 0.00 | 16 |
| 17 | 7.53 | ** | ** | ** | ** | ** | ** | ** | 51.54 | 59.81 | 0.00 | 0.00 | 17 |
| 18 | 7.53 | ** | ** | ** | ** | ** | ** | ** | 48.26 | 56.84 | 0.00 | 3.38 | 18 |
| 19 | 7.53 | ** | ** | ** | ** | ** | ** | ** | 41.91 | 37.99 | 0.00 | 8.41 | 19 |
| 20 | 7.28 | ** | ** | ** | ** | ** | ** | ** | 38.42 | 17.35 | 0.00 | 8.41 | 20 |
| 21 | 7.28 | ** | ** | ** | ** | ** | ** | ** | 74.80 | 16.36 | 0.00 | 8.68 | 21 |
| 22 | 7.53 | ** | ** | ** | ** | ** | ** | 11.44 | 74.27 | 20.06 | 0.00 | 8.68 | 22 |
| 23 | 8.31 | ** | ** | ** | ** | ** | ** | 9.75 | 67.94 | 22.18 | 0.00 | 8.94 | 23 |
| 24 | 8.05 | ** | ** | ** | ** | ** | ** | 8.94 | 59.31 | 19.72 | 0.00 | 10.59 | 24 |
| 25 | 8.05 | ** | ** | ** | ** | ** | ** | 10.87 | 58.81 | 6.65 | 0.00 | 10.59 | 25 |
| 26 | 7.79 | ** | ** | ** | ** | ** | ** | 10.31 | 59.31 | 4.39 | 0.00 | 11.16 | 26 |
| 27 | 7.79 | ** | ** | ** | ** | ** | ** | 10.31 | 56.84 | 2.46 | 0.00 | 11.44 | 27 |
| 28 | 7.53 | ** | ** | ** | ** | ** | ** | 8.68 | 57.83 | 0.94 | 0.00 | 12.03 | 28 |
| 29 | 6.77 | ** | ** | ** | ** | ** | 6.90 | 54.90 | 0.03 | 0.00 | 11.73 | 29 | |
| 30 | 6.28 | ** | ** | ** | ** | ** | 6.90 | 51.54 | 0.00 | 0.00 | 12.03 | 30 | |
| 31 | 7.28 | ** | ** | ** | 32.55 | 0.00 | 0.00 | 31 | |||||
| TOTAL | 236.69 | 21.58* | ** | ** | ** | ** | ** | 116.65* | 1666.21 | 1391.64 | 0.00 | 126.07 | |
| MEAN | 7.64 | 7.19* | ** | ** | ** | ** | ** | 11.67* | 55.54 | 44.89 | 0.00 | 4.20 | |
| AC-FT | 469.47 | 42.80* | ** | ** | ** | ** | ** | 231.37* | 3304.88 | 2760.28 | 0.00 | 250.06 | |
| CONVERSE DITCH | STATION NO. 0077122.00 |
| LATITUDE 42-54-35 LONGITUDE 109-58-42 | |
| SE1/4SE1/4 SECTION 3 TOWNSHIP 35 N, RANGE 110 W 6TH P.M. | |
| ELEVATION 7317.00 FT DRAINAGE AREA UNKNOWN | |
| NONCONTRIBUTING 0.00 SQ MI BASIN 15570000 | |
| SUBLETTE COUNTY DATA FROM WWRC (C) | |
| ***TO USE THIS DATA, SEE VIC HASFURTHER*** |
| MEAN DAILY FLOW IN CFS BY WATER YEAR | |||||||||||||
| 1987 | |||||||||||||
| DAY | OCT | NOV | DEC | JAN | FEB | MAR | APR | MAY | JUNE | JULY | AUG | SEPT | DAY |
| 1 | 12.62 | 5.03 | ** | ** | ** | ** | ** | ** | 25.29 | 26.42 | 0.00 | 0.00 | 1 |
| 2 | 13.22 | 5.48 | ** | ** | ** | ** | ** | ** | 26.04 | 23.44 | 0.00 | 0.00 | 2 |
| 3 | 11.44 | 5.03 | ** | ** | ** | ** | ** | ** | 28.73 | 14.01 | 0.00 | 0.00 | 3 |
| 4 | 10.59 | 4.81 | ** | ** | ** | ** | ** | ** | 26.80 | 7.79 | 0.00 | 3.90 | 4 |
| 5 | 10.03 | ** | ** | ** | ** | ** | ** | ** | 27.57 | 6.44 | 0.00 | 7.79 | 5 |
| 6 | 9.75 | ** | ** | ** | ** | ** | ** | ** | 27.57 | 5.53 | 0.00 | 7.79 | 6 |
| 7 | 9.75 | ** | ** | ** | ** | ** | ** | ** | 29.91 | 21.64 | 0.00 | 7.79 | 7 |
| 8 | 9.75 | ** | ** | ** | ** | ** | ** | ** | 32.32 | 33.96 | 0.00 | 7.79 | 8 |
| 9 | 9.75 | ** | ** | ** | ** | ** | ** | ** | 40.79 | 35.21 | 0.00 | 7.79 | 9 |
| 10 | 10.03 | ** | ** | ** | ** | ** | ** | ** | 49.44 | 54.69 | 0.00 | 7.79 | 10 |
| 11 | 10.59 | ** | ** | ** | ** | ** | ** | ** | 42.12 | 46.19 | 0.00 | 8.15 | 11 |
| 12 | 10.59 | ** | ** | ** | ** | ** | ** | 11.83 | 41.68 | 39.92 | 0.00 | 8.15 | 12 |
| 13 | 10.59 | ** | ** | ** | ** | ** | ** | 27.57 | 39.92 | 36.48 | 0.00 | 8.52 | 13 |
| 14 | 10.87 | ** | ** | ** | ** | ** | ** | 29.12 | 38.16 | 34.38 | 0.00 | 8.52 | 14 |
| 15 | 10.87 | ** | ** | ** | ** | ** | ** | 29.12 | 36.90 | 37.33 | 0.00 | 8.15 | 15 |
| 16 | 10.87 | ** | ** | ** | ** | ** | ** | 34.38 | 16.54 | 41.24 | 0.00 | 8.90 | 16 |
| 17 | 10.87 | ** | ** | ** | ** | ** | ** | 37.33 | 10.94 | 48.97 | 0.00 | 9.09 | 17 |
| 18 | 11.16 | ** | ** | ** | ** | ** | ** | 45.27 | 10.94 | 37.33 | 0.00 | 8.52 | 18 |
| 19 | 12.92 | ** | ** | ** | ** | ** | ** | 45.27 | 36.48 | 27.95 | 0.00 | 7.44 | 19 |
| 20 | 11.16 | ** | ** | ** | ** | ** | ** | 39.48 | 41.68 | 14.32 | 0.00 | 7.44 | 20 |
| 21 | 7.14 | ** | ** | ** | ** | ** | ** | 48.50 | 41.68 | 19.89 | 0.00 | 7.27 | 21 |
| 22 | 6.41 | ** | ** | ** | ** | ** | ** | 55.18 | 41.68 | 22.71 | 0.00 | 7.27 | 22 |
| 23 | 5.94 | ** | ** | ** | ** | ** | ** | 44.82 | 42.52 | 8.52 | 0.00 | 6.44 | 23 |
| 24 | 5.94 | ** | ** | ** | ** | ** | ** | 41.68 | 41.68 | 4.45 | 0.00 | 5.25 | 24 |
| 25 | 5.71 | ** | ** | ** | ** | ** | ** | 39.48 | 39.48 | 7.10 | 0.00 | 6.13 | 25 |
| 26 | 5.71 | ** | ** | ** | ** | ** | ** | 41.68 | 37.33 | 5.83 | 0.00 | 6.44 | 26 |
| 27 | 5.71 | ** | ** | ** | ** | ** | ** | 44.82 | 29.12 | 0.12 | 0.00 | 4.97 | 27 |
| 28 | 5.48 | ** | ** | ** | ** | ** | ** | 42.12 | 25.66 | 0.12 | 0.00 | 4.97 | 28 |
| 29 | 7.64 | ** | ** | ** | ** | ** | 32.32 | 27.18 | 0.12 | 0.00 | 4.70 | 29 | |
| 30 | 10.03 | ** | ** | ** | ** | ** | 29.12 | 27.57 | 0.12 | 0.00 | 4.70 | 30 | |
| 31 | 7.39 | ** | ** | ** | 27.57 | 0.00 | 0.00 | 31 | |||||
| TOTAL | 290.52 | 20.35* | ** | ** | ** | ** | ** | 746.66* | 983.72 | 662.22 | 0.00 | 191.66 | |
| MEAN | 9.37 | 5.09* | ** | ** | ** | ** | ** | 37.33* | 32.79 | 21.36 | 0.00 | 6.39 | |
| AC-FT | 576.24 | 40.36* | ** | ** | ** | ** | ** | 1480.98* | 1951.18 | 1313.49 | 0.00 | 380.15 | |
| CONVERSE DITCH | STATION NO. 0077122.00 |
| LATITUDE 42-54-35 LONGITUDE 109-58-42 | |
| SE1/4SE1/4 SECTION 3 TOWNSHIP 35 N, RANGE 110 W 6TH P.M. | |
| ELEVATION 7317.00 FT DRAINAGE AREA UNKNOWN | |
| NONCONTRIBUTING 0.00 SQ MI BASIN 15570000 | |
| SUBLETTE COUNTY DATA FROM WWRC (C) | |
| ***TO USE THIS DATA, SEE VIC HASFURTHER*** |
| MEAN DAILY FLOW IN CFS BY WATER YEAR | |||||||||||||
| 1988 | |||||||||||||
| DAY | OCT | NOV | DEC | JAN | FEB | MAR | APR | MAY | JUNE | JULY | AUG | SEPT | DAY |
| 1 | 4.70 | 7.10 | ** | ** | ** | ** | ** | ** | ** | ** | ** | ** | 1 |
| 2 | 4.45 | ** | ** | ** | ** | ** | ** | ** | ** | ** | ** | ** | 2 |
| 3 | 4.19 | ** | ** | ** | ** | ** | ** | ** | ** | ** | ** | ** | 3 |
| 4 | 5.53 | ** | ** | ** | ** | ** | ** | ** | ** | ** | ** | ** | 4 |
| 5 | 10.94 | ** | ** | ** | ** | ** | ** | ** | ** | ** | ** | ** | 5 |
| 6 | 8.15 | ** | ** | ** | ** | ** | ** | ** | ** | ** | ** | ** | 6 |
| 7 | 8.90 | ** | ** | ** | ** | ** | ** | ** | ** | ** | ** | ** | 7 |
| 8 | 8.52 | ** | ** | ** | ** | ** | ** | ** | ** | ** | ** | ** | 8 |
| 9 | 9.68 | ** | ** | ** | ** | ** | ** | ** | ** | ** | ** | ** | 9 |
| 10 | 11.38 | ** | ** | ** | ** | ** | ** | ** | ** | ** | ** | ** | 10 |
| 11 | 11.83 | ** | ** | ** | ** | ** | ** | ** | ** | ** | ** | ** | 11 |
| 12 | 10.26 | ** | ** | ** | ** | ** | ** | ** | ** | ** | ** | ** | 12 |
| 13 | 10.51 | ** | ** | ** | ** | ** | ** | ** | ** | ** | ** | ** | 13 |
| 14 | 10.94 | ** | ** | ** | ** | ** | ** | ** | ** | ** | ** | ** | 14 |
| 15 | 10.94 | ** | ** | ** | ** | ** | ** | ** | ** | ** | ** | ** | 15 |
| 16 | 10.94 | ** | ** | ** | ** | ** | ** | ** | ** | ** | ** | ** | 16 |
| 17 | 10.94 | ** | ** | ** | ** | ** | ** | ** | ** | ** | ** | ** | 17 |
| 18 | 10.94 | ** | ** | ** | ** | ** | ** | ** | ** | ** | ** | ** | 18 |
| 19 | 10.94 | ** | ** | ** | ** | ** | ** | ** | ** | ** | ** | ** | 19 |
| 20 | 10.94 | ** | ** | ** | ** | ** | ** | ** | ** | ** | ** | ** | 20 |
| 21 | 11.38 | ** | ** | ** | ** | ** | ** | ** | ** | ** | ** | ** | 21 |
| 22 | 11.38 | ** | ** | ** | ** | ** | ** | ** | ** | ** | ** | ** | 22 |
| 23 | 10.09 | ** | ** | ** | ** | ** | ** | ** | ** | ** | ** | ** | 23 |
| 24 | 10.09 | ** | ** | ** | ** | ** | ** | ** | ** | ** | ** | ** | 24 |
| 25 | 10.09 | ** | ** | ** | ** | ** | ** | ** | ** | ** | ** | ** | 25 |
| 26 | 9.68 | ** | ** | ** | ** | ** | ** | ** | ** | ** | ** | ** | 26 |
| 27 | 9.68 | ** | ** | ** | ** | ** | ** | ** | ** | ** | ** | ** | 27 |
| 28 | 9.68 | ** | ** | ** | ** | ** | ** | ** | ** | ** | ** | ** | 28 |
| 29 | 9.68 | ** | ** | ** | ** | ** | ** | ** | ** | ** | ** | ** | 29 |
| 30 | 8.52 | ** | ** | ** | ** | ** | ** | ** | ** | ** | ** | 30 | |
| 31 | 7.44 | ** | ** | ** | ** | ** | ** | 31 | |||||
| TOTAL | 293.33 | 7.10* | ** | ** | ** | ** | ** | ** | ** | ** | ** | ** | |
| MEAN | 9.46 | 7.10* | ** | ** | ** | ** | ** | ** | ** | ** | ** | ** | |
| AC-FT | 581.81 | 14.08* | ** | ** | ** | ** | ** | ** | ** | ** | ** | ** | |
Source: Wyoming Water Resources Data System, March 20, 2000
East Fork Canal, East Fork New Fork River
Diversion Description: Diversion consists of a single 3' by 3' slide gate mounted on a concrete structure.1
Conveyance Description: Open Channel Canal, approximately 8 miles in length.1
Wyoming Water Rights Summary:
| Priority Date (M-D-Y) | Permit Number |
Permitted Use | Acres | Flow (cfs) |
Cumulative Flow (cfs) | Comments |
| 07-24-1905 | 6803 | Irrigation | 720.00 | 10.27 | 10.27 | Formerly Lake Ditch |
| 08-23-1906 | 7356 | Irrigation | 1,026.00 | 14.63 | 24.90 | |
| 01-21-1911 | 2397E | Irrigation | 84.00 | 1.20 | 26.10 |
Storage Rights: None.
Estimated Canal Losses: Due to the high content of gravel, sand, and boulders in the soil in the upper reaches of the ditch, greater than typical losses (40%) are experienced.1
Irrigation Practices: Lands are flood irrigated.1
Crop Types / Consumptive Use: Lands are native grass hay and pasture.1
Return Flows: Approximately 50% of the return flows are delivered to Muddy Creek, and 50% to East Fork New Fork River.1
Other Operational Information: The canal is typically turned on the first of May and off in mid-July.1
|
East Fork Canal, East Fork New Fork River, Diversion Data
| Wateryear | May | June | July | August | September | |||||
| Average (cfs) | Monthly Total (AF) | Average (cfs) | Monthly Total (AF) | Average (cfs) | Monthly Total (AF) | Average (cfs) | Monthly Total (AF) | Average (cfs) | Monthly Total (AF) | |
| 1980 | 23.49 | 1,397.75 | 20.30 | 1,207.93 | ||||||
| 1981 | 13.94 | 857.14 | 18.00 | 1,071.07 | ||||||
| 1982 | 10.64 | 654.23 | 27.18 | 1,617.32 | 18.18 | 1,081.79 | 10.00 | 614.88 | 10.00 | 594.04 |
| 1983 | 4.43 | 272.39 | 18.12 | 1,078.21 | 18.44 | 1,097.26 | ||||
| 1984 | 23.45 | 1,395.37 | 15.45 | 919.34 | ||||||
| 1985 | 0.65 | 38.68 | 0.65 | 38.68 | 1.83 | 108.89 | ||||
| 1986 | ||||||||||
| 1987 | ||||||||||
| 1988 | 14.35 | 853.88 | ||||||||
| 1989 | 20.60 | 1,266.64 | 23.63 | 1,406.08 | 19.35 | 1,151.40 | ||||
| 1990 | ||||||||||
| 1991 | 26.43 | 1,572.69 | ||||||||
| 1992 | 30.11 | 1,851.39 | 25.40 | 1,511.40 | ||||||
| 1993 | ||||||||||
| 1994 | 33.11 | 2,035.85 | 32.85 | 1,954.71 | 21.83 | 1,298.98 | 3.90 | 232.07 | ||
| 1995 | 12.89 | 792.58 | 32.69 | 1,945.19 | 34.55 | 2,055.87 | 17.58 | 1,046.08 | 5.25 | 312.40 |
| 1996 | ||||||||||
| 1997 | ||||||||||
| 1998 | ||||||||||
| Averages: | 17.97 | 1,104.32 | 24.14 | 1,436.70 | 18.59 | 1,106.41 | 8.03 | 482.93 | 5.69 | 338.78 |
Data:
1980: 5/18, on; 5/21, 19 cfs; 5/29, 20 cfs; 6/3, 21 cfs; 6/11, 23 cfs; 6/23, 25 cfs; 6/30, 26 cfs; 7/9, 26 cfs; 7/15, 23 cfs; 7/22, 15 cfs; 7/28, 12 cfs; 8/8, 8 cfs; 8/12, 7 cfs; 8/13, off.
1981: 4/24, off; 5/8, 7.5 cfs; 5/14, 14 cfs; 6/10, 27 cfs; 6/17, 24 cfs; 6/25, 22 cfs; 7/11, off.
1982: 5/14, off; 5/24, 20 cfs; 6/3, 24 cfs; 6/18, 26 cfs; 6/23, 33 cfs; 7/2, 30 cfs; 7/8, 30 cfs; 7/16, 26 cfs; 7/19, off; 8/27, 10 cfs; 8/30, 10 cfs; 10/5, off.
1983: 5/24, on, 10 cfs; 5/26, 20 cfs; 6/7, 27 cfs, 6/17, 26 cfs; 6/24, 26 cfs; 7/6, 29 cfs; 7/12, 26 cfs; 7/19, 16 cfs; 7/27, off; 9/12, 13 cfs.
1984: 5/18, off; 6/1, 26 cfs; 6/9, 20 cfs; 6/12, 21 cfs; 6/29, 27 cfs; 7/6, 29 cfs; 7/16, 15 cfs; 7/23, off; 9/25, off.
1985: 7/6, 20 cfs; 7/7, off; 7/31, off; 9/5, 1.5 cfs (est); 9/25, 5.0 cfs (est).
1986: 6/26, 31.1 cfs; 9/9, 3 cfs (est).
1987: 5/14, 28.6 cfs; 7/14, off; 8/31, 3 cfs.
1988: 4/12, 0 cfs; 5/25, 0 cfs; 6/26, 19.5 cfs; 7/1, 9.2 cfs.
1989: 4/14, 0 cfs; 4/21, 20 cfs; 5/3, 20 cfs; 5/13, 20 cfs; 6/26, 25 cfs; 7/13, 20 cfs; 8/3, 0.
1990: 5/23, 27.4 cfs; 7/11, 15.0 cfs (est).
1991: 6/4, 30.33 cfs; 7/11, 28.0 cfs.
1992: 5/6, 40.00 cfs; 5/29, 35.00 cfs; 6/8, 40.00 cfs; 6/9, 24.00 cfs; 6/10, 24.00 cfs; 6/11, 20.00 cfs; 7/10, 20.00 cfs.
1993: 4/29, off; 5/3, 4.00 cfs; 6/18, 48.30 cfs; 7/27, off; 9/2, off.
1994: 5/3, 15.00 cfs; 5/23, 50.00 cfs; 6/19, 30.20 cfs; 6/20, 25.2 cfs; 7/18, 25.00 cfs; 8/4, 5.00 cfs; 9/15, off.
1995: 4/10, off; 4/18, off; 4/26, off; 5/24, 18.8 cfs; 6/26, 41.0 cfs; 7/6, 42 cfs; 7/7, 40 cfs (est.); 8/16, 15 cfs (est); 8/30, 15 cfs (est); 9/21, off.
1996: 5/4, 9.5 cfs (est); 6/26, 33.0 cfs (arrive), 1.42 cfs (depart); 9/21, 19.0 cfs (est).
1997: 5/27, 24 cfs (est).
Supply: 1980, below average; 1981, slightly below average; 1982, average (late peak); 1983, above average; 1984, above average; 1985, below average; 1986, average to slightly above average; 1988: very below average; 1989, below average; 1990, below average; 1991, slightly below average; 1992, below average; 1993, average; 1994, below average; 1995, average to above average; 1996, average; 1997, average; 1998, average to above average.
Source: State Engineer's Office, Annual Hydrographers' Reports.
Fayette Canal, Fall Creek
Diversion Description: Diversion consists of two 36" slide gates.1
Conveyance Description: Open Channel Canal, approximately 8 miles in length.1
Wyoming Water Rights Summary:
| Priority Date (M-D-Y) | Permit Number |
Permitted Use | Acres | Flow (cfs) |
Cumulative Flow (cfs) | Comments |
| 06-22-1906 | 7496 | Irrigation | 1,607.00 | 22.95 | 22.95 | |
| 08-11-1952 | 5637E | Irrigation, Stock | 522.00 | 7.45 | 30.40 |
Estimated Canal Losses: Information not available at time of report.
Irrigation Practices: Information not available at time of report.
Crop Types / Consumptive Use: Information not available at time of report.
Return Flows: Return flows are delivered to West Fork new Fork River at Pole Creek.2
Other Operational Information: Information not available at time of report.
|
Fayette Canal, Fall Creek, Diversion Data
| Wateryear | May | June | July | August | September | |||||
| Average (cfs) | Monthly Total (AF) | Average (cfs) | Monthly Total (AF) | Average (cfs) | Monthly Total (AF) | Average (cfs) | Monthly Total (AF) | Average (cfs) | Monthly Total (AF) | |
| 1980 | ||||||||||
| 1981 | ||||||||||
| 1982 | ||||||||||
| 1983 | ||||||||||
| 1984 | ||||||||||
| 1985 | ||||||||||
| 1986 | ||||||||||
| 1987 | ||||||||||
| 1988 | 6.15 | 378.07 | ||||||||
| 1989 | ||||||||||
| 1990 | ||||||||||
| 1991 | 18.67 | 1,107.26 | ||||||||
| 1992 | ||||||||||
| 1993 | 28.50 | 1,695.65 | 20.29 | 1,247.58 | 10.99 | 675.75 | 4.69 | 279.07 | ||
| 1994 | 25.00 | 1,537.19 | 42.06 | 2,502.74 | 29.41 | 1,808.35 | 6.11 | 375.69 | 4.20 | 249.92 |
| 1995 | 7.65 | 470.38 | 29.80 | 1,773.22 | 24.68 | 1,517.51 | 25.45 | 1,564.86 | 12.05 | 717.02 |
| 1996 | 20.00 | 1,229.75 | ||||||||
| 1997 | 17.12 | 1,052.46 | ||||||||
| 1998 | ||||||||||
| Averages: | 16.33 | 1,003.79 | 29.76 | 1,769.72 | 20.11 | 1,236.25 | 14.92 | 917.19 | 6.98 | 415.34 |
Data:
1987: 7/14, 46.8 cfs; 9/8, 6 cfs.
1988: 5/13, 13 cfs; 6/26, 22 cfs; 7/5, 9 cfs; 8/5, 0.5 cfs.
1991: 5/19, 13.08 cfs; 6/19, 38.35 cfs.
1992: 4/8, 0.00 cfs; 6/3, 21.00 cfs; 9/3, 2.00 cfs.
1993: 5/19, 22.60 cfs; 6/21, 31.60 cfs; 7/8, 19.60 cfs; 7/30, 20.00 cfs; 8/25, 6.30 cfs; 9/1, 4.50 cfs; 9/20, 10.30 cfs.
1994: 5/12, 25.00 cfs; 5/26, 45.50 cfs; 6/1, 48.30 cfs; 6/7, 50.00 cfs; 6/14, 45.00 cfs; 6/22, 35.60 cfs; 7/25, 28.80 cfs; 8/5, 10.60 cfs; 8/23, off; 8/30, 7.00 cfs; 9/6, 7.00 cfs; 9/19, 7.00 cfs.
1995: 4/6, 4/17, 5/4, off; 5/10, 6.5 cfs (est); 5/31, 12.8 cfs; 6/5, 21.8 cfs; 6/27, 38.8 cfs; 8/3, 12.0 cfs; 9/14, off.
1996: 5/1, 5/13, off; 7/1, 38 cfs (est); 8/1, 2.0 cfs (est).
1997: 7/22, 42.1 cfs; 8/19, 23.5 cfs.
Supply: 1980, below average; 1981, slightly below average; 1982, average (late peak); 1983, above average; 1984, above average; 1985, below average; 1986, average to slightly above average; 1988: very below average; 1989, below average; 1990, below average; 1991, slightly below average; 1992, below average; 1993, average; 1994, below average; 1995, average to above average; 1996, average; 1997, average; 1998, average to above average.
Source: State Engineer's Office, Annual Hydrographers' Reports.
Fremont Ditch, Pine Creek
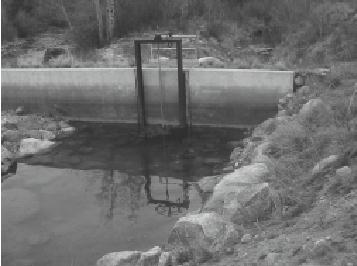 |
Diversion Description: Diversion consists of a single 4' by 4' slide gate. The headgate is attached to the Fremont Lake Dam.1 |
| |
| Conveyance Description: Open Channel Canal, approximately 6 miles in length.1 | |
Wyoming Water Rights Summary:
| Priority Date (M-D-Y) | Permit Number |
Permitted Use | Acres | Flow (cfs) |
Cumulative Flow (cfs) | Comments |
| 03-02-1954 | 21373 | Irrigation, Stock | 474.00 | 6.77 | 6.77 | |
| 05-25-1971 | 6388E | Irrigation | 45.00 | 0.64 | 7.41 |
Storage Rights: None.
Estimated Canal Losses: Losses are minor.1
Irrigation Practices: Lands are flood irrigated.1
Crop Types / Consumptive Use: Lands are native grass hay and pasture.1
Return Flows: Return flows are delivered to West Fork New Fork River at Willow Creek.2
Other Operational Information: The canal is initially turned on the first of May for stock water use. By approximately the first of June the canal experiences its highest flows. Typically, the canal is turned off by the first of October.1
|
Fremont Ditch, Pine Creek, Diversion Data
| Wateryear | May | June | July | August | September | |||||
| Average (cfs) | Monthly Total (AF) | Average (cfs) | Monthly Total (AF) | Average (cfs) | Monthly Total (AF) | Average (cfs) | Monthly Total (AF) | Average (cfs) | Monthly Total (AF) | |
| 1980 | ||||||||||
| 1981 | ||||||||||
| 1982 | ||||||||||
| 1983 | ||||||||||
| 1984 | ||||||||||
| 1985 | 4.29 | 263.78 | 16.46 | 979.44 | 13.97 | 858.98 | 0.45 | 27.67 | 0.19 | 11.31 |
| 1986 | 3.36 | 206.60 | 21.54 | 1,281.72 | 23.77 | 1,461.56 | 1.02 | 62.72 | 0.74 | 44.03 |
| 1987 | ||||||||||
| 1988 | 6.13 | 376.92 | 23.53 | 1,400.13 | 14.35 | 882.35 | 5.41 | 332.65 | 6.82 | 405.82 |
| 1989 | 11.84 | 728.01 | 27.17 | 1,616.73 | 21.33 | 1,311.53 | 2.79 | 171.55 | 9.38 | 558.15 |
| 1990 | 13.55 | 833.16 | 20.60 | 1,225.79 | 21.41 | 1,316.45 | 3.32 | 204.14 | 2.82 | 167.80 |
| 1991 | 6.99 | 429.80 | 18.17 | 1,081.19 | 19.68 | 1,210.08 | 2.36 | 145.11 | 1.88 | 111.87 |
| 1992 | 10.34 | 635.78 | 20.37 | 1,212.10 | 16.90 | 1,039.14 | 1.86 | 114.37 | 0.41 | 24.40 |
| 1993 | 4.95 | 304.36 | 20.20 | 1,201.98 | 30.13 | 1,852.62 | 6.78 | 416.89 | 2.48 | 147.57 |
| 1994 | 5.38 | 330.80 | 29.09 | 1,730.98 | 22.00 | 1,352.73 | 6.53 | 401.51 | 3.80 | 226.12 |
| 1995 | 4.13 | 253.94 | 24.45 | 1,454.88 | 35.03 | 2,153.91 | 11.25 | 691.74 | 4.36 | 259.44 |
| 1996 | 6.67 | 410.12 | 25.97 | 1,545.32 | 28.65 | 1,761.62 | 5.18 | 318.51 | 2.73 | 162.45 |
| 1997 | 3.07 | 188.77 | 19.52 | 1,161.52 | 23.68 | 1,456.03 | 14.90 | 916.17 | 8.81 | 524.23 |
| 1998 | 10.79 | 663.45 | 5.43 | 333.88 | 1.64 | 97.59 | ||||
| Averages: | 6.73 | 413.50 | 22.26 | 1,324.31 | 21.67 | 1,332.34 | 5.18 | 318.22 | 3.54 | 210.83 |
Data:
1996: 5/10, off; 5/11, 3.0 cfs (est); 6/11, 23 cfs (est); 6/15, 31 cfs (est); 6/17, 30.0 cfs (est); 6/24, 28 cfs (est); 6/25, 30.1 cfs; 7/1, 30 cfs; 7/3, 32 cfs (est); 7/8, 35.0 cfs (est); 7/23, 26 cfs (est); 7/25, 32 cfs (est); 7/29, 20 cfs (est); 8/1, 20 cfs (est); 8/6, 4.5 cfs (est); 8/13, 4.5 cfs (est); 8/19, 2.5 cfs (est); 8/26, 4.0 cfs (est); 8/30, 4.0 cfs (est); 9/4, 4.0 cfs (est); 9/12, 4.5 cfs (est); 9/16, 2.5 cfs (est); 9/24, 3.0 cfs (est).
1997: 5/12, 5.0 cfs (est); 6/2, 4.5 cfs (est); 6/12, 23 cfs (est); 7/7, 23.9 cfs; 7/15, 24.5 cfs; 7/19, 24.5 cfs; 7/24, 24.5 cfs; 7/29, 23.9 cfs; 7/30, 18 cfs (est); 8/7, 15.4 cfs; 8/12, 15.4 cfs; 8/18, 14 cfs; 8/25, 15.4 cfs; 9/4, 10.4 cfs; 9/10, 10.5 cfs; 9/23, 10.0 cfs; 9/30, off.
1998: 7/6, 25 cfs (est); 7/9, 25 cfs (est); 7/29, 0.5 cfs (est); 8/7, 6.17 cfs; 8/13, 6.17 cfs; 8/19, 5.75 cfs; 8/27, 5.7 cfs (est); 9/3, 3.3 cfs; 9/9, 3.3 cfs; 9/16, 3.2 cfs.
Supply: 1980, below average; 1981, slightly below average; 1982, average (late peak); 1983, above average; 1984, above average; 1985, below average; 1986, average to slightly above average; 1988: very below average; 1989, below average; 1990, below average; 1991, slightly below average; 1992, below average; 1993, average; 1994, below average; 1995, average to above average; 1996, average; 1997, average; 1998, average to above average.
Source: State Engineer's Office, Annual Hydrographers' Reports.
Gilligan & Iven Ditch, East Fork New Fork River
Diversion Description: Diversion consists of a single 40" by 40" slide gate mounted on a concrete structure.1
Conveyance Description: Open Channel Canal, approximately 2 1/2 miles in length.1
Wyoming Water Rights Summary:
| Priority Date (M-D-Y) | Permit Number |
Permitted Use | Acres | Flow (cfs) |
Cumulative Flow (cfs) | Comments |
| 10-08-1897 | 1622 | Irrigation | 630.00 | 9.00 | 9.00 | |
| 12-11-1903 | 1137E | Domestic, Irrigation, Stock | 320.00 | 4.57 | 13.57 |
Storage Rights: None.
Estimated Canal Losses: Slightly greater than typical losses (20%) are experienced.1
Irrigation Practices: Lands are flood irrigated.1
Crop Types / Consumptive Use: Lands are native grass hay and pasture.1
Return Flows: Return flows are delivered to Cottonwood Creek above East Fork River.2
Other Operational Information: The canal is typically turned on the first of May and off in mid-July.1
|
Gilligan & Iven Ditch, East Fork New Fork River, Diversion Data
| Wateryear | May | June | July | August | September | |||||
| Average (cfs) | Monthly Total (AF) | Average (cfs) | Monthly Total (AF) | Average (cfs) | Monthly Total (AF) | Average (cfs) | Monthly Total (AF) | Average (cfs) | Monthly Total (AF) | |
| 1975 | 5.52 | 339.93 | 18.75 | 1,115.70 | 19.58 | 1,203.87 | 5.51 | 338.50 | 4.18 | 248.73 |
| 1976 | 4.81 | 295.93 | 19.44 | 1,156.56 | 16.56 | 1,018.31 | ||||
| 1978 | 7.35 | 452.23 | 18.50 | 1,100.83 | 15.81 | 971.90 | ||||
| 1980 | 7.48 | 459.93 | 10.60 | 630.74 | 9.36 | 575.52 | 7.99 | 491.29 | 5.39 | 320.73 |
| 1981 | 13.88 | 853.45 | 22.19 | 1,320.40 | 9.15 | 562.61 | 5.20 | 319.74 | 2.22 | 132.10 |
| 1982 | 22.92 | 1,363.83 | 16.44 | 1,010.86 | 3.95 | 242.88 | 5.73 | 340.96 | ||
| 1983 | 8.33 | 495.67 | 5.95 | 365.85 | 8.58 | 527.56 | ||||
| 1984 | 14.76 | 878.28 | 10.38 | 638.24 | ||||||
| 1985 | ||||||||||
| 1986 | ||||||||||
| 1987 | ||||||||||
| 1988 | 6.67 | 410.12 | 10.69 | 636.10 | ||||||
| 1989 | 15.56 | 956.75 | 12.58 | 748.56 | 4.62 | 284.07 | ||||
| 1990 | ||||||||||
| 1989 | 11.84 | 728.01 | 27.17 | 1,616.73 | 21.33 | 1,311.53 | 2.79 | 171.55 | 9.38 | 558.15 |
| 1991 | ||||||||||
| 1992 | 13.30 | 791.40 | ||||||||
| 1993 | 12.20 | 750.35 | ||||||||
| 1994 | 22.39 | 1,376.71 | 17.73 | 1,055.01 | 11.51 | 707.72 | 2.23 | 137.12 | ||
| 1995 | 9.58 | 589.05 | 19.12 | 1,137.72 | 20.37 | 1,252.50 | 4.73 | 290.84 | 1.09 | 64.86 |
| 1996 | ||||||||||
| 1997 | ||||||||||
| 1998 | ||||||||||
| Averages: | 10.54 | 648.45 | 16.07 | 956.22 | 12.70 | 781.04 | 5.46 | 335.42 | 3.72 | 221.48 |
Data:
1980: 5/6, 5 cfs; 5/13, 9 cfs; 5/20, 8 cfs; 5/21, 11 cfs; 5/29, 10 cfs; 6/3, 10 cfs; 6/10, 13 cfs; 6/18, 10 cfs; 6/23, 10 cfs; 6/30, 9 cfs; 7/9, 8 cfs; 7/15, 6 cfs; 7/22, 7 cfs; 7/24, 16 cfs; 7/28, 12 cfs; 8/1, 16 cfs; 8/8, 6 cfs; 8/12, 5 cfs; 8/21, 8 cfs; 9/22, 5 cfs; 9/30, 4 cfs.
1981: 4/24, 5 cfs; 5/8, 13 cfs; 5/14, 8 cfs; 5/28, 21 cfs; 6/4, 24 cfs; 6/9, 25 cfs; 6/17, 21 cfs; 6/25, 22 cfs; 7/7, 12 cfs; 7/15, 8 cfs; 7/20, 7 cfs; 8/4, 6 cfs; 8/13, 5 cfs; 8/27, 5 cfs; 10/2, off.
1982:5/24, 21 cfs; 6/2, 21 cfs; 6/9, 21 cfs; 6/18, 27 cfs; 6/22, 26 cfs; 7/2, 17 cfs; 7/8, 22 cfs; 7/16, 23 cfs; 7/23, 13 cfs; 8/3, off; 8/27, 7 cfs; 9/22, 9 cfs.
1983: 5/26, 11 cfs; 6/1, 15 cfs; 6/7, 18 cfs; 6/17, 17 cfs; 6/24, 17 cfs; 7/6, 13 cfs; 7/12, 12 cfs; 7/19, 7 cfs; 7/27, off; 8/22, 12 cfs; 9/12, off.
1984: 5/18, 6 cfs; 5/22, 5 cfs; 6/1, 17 cfs; 6/9, 13 cfs; 6/12, 13 cfs; 6/14, 14 cfs; 6/29, 16 cfs; 7/6, 15 cfs; 7/11, 13 cfs; 7/16, 10 cfs; 7/19, 12 cfs; 7/23, 11 cfs; 7/30, off.
1985: 7/7, 13.3 cfs. (Ditch washed out.)
1986: 6/19, 10.0 cfs; 7/9, 12.8 cfs; 9/9, 8.1 cfs.
1987: 5/14, 27.7 cfs; 7/14, off.
1988: 4/12, 5 cfs; 5/25, 7 cfs; 6/18, 10 cfs; 6/26, 13.9 cfs; 6/27, 16.6 cfs; 7/1, 12.4 cfs.
1989: 4/14, 0 cfs; 4/21, 4.5 cfs; 5/3, 6 cfs; 5/13, 20 cfs; 6/28, 10 cfs; 7/13, 4 cfs; 8/1, 3 cfs.
1990: 6/18, 20.0 cfs (est); 7/11, 10.0 cfs (est).
1992: 5/29, 15.00 cfs; 6/8, 15.00 cfs; 6/10, 13.00 cfs; 6/11, 13.00 cfs; 7/10, 12.00 cfs.
1993: 4/29, 6.00 cfs; 5/3, 4.00 cfs; 6/14, 29.3 cfs; 7/27, 9/2, off.
1994: 5/3, 12.00 cfs; 5/23, 31.50 cfs; 6/19, 15.30 cfs; 6/20, 13.00 cfs; 7/18, 14.00 cfs; 8/4, 1.50 cfs; 9/3, 3.00 cfs.
1995: 4/10, off ; 4/18, 2.0 cfs (est); 4/26, 3.0 cfs (est); 5/24, 12.0 cfs; 6/26, 22.3 cfs; 7/6, 24 efs (est); 7/17, 22 cfs; 8/16, 3.5 cfs; 8/30, off; 9/21, 3.0 cfs.
1996: 5/4, 3.0 cfs; 6/26, 28 cfs (est).
1997: 7/15, 8.3 cfs.
Supply: 1980, below average; 1981, slightly below average; 1982, average (late peak); 1983, above average; 1984, above average; 1985, below average; 1986, average to slightly above average; 1988: very below average; 1989, below average; 1990, below average; 1991, slightly below average; 1992, below average; 1993, average; 1994, below average; 1995, average to above average; 1996, average; 1997, average; 1998, average to above average.
Source: State Engineer's Office, Annual Hydrographers' Reports.
| GILLIGAN & IVEN DITCH | STATION NO. 0066110.00 |
| LATITUDE 0-00-00 LONGITUDE 0-00-00 | |
| SECTION 0 TOWNSHIP 0, RANGE 0 P.M. | |
| ELEVATION UNKNOWN DRAINAGE AREA UNKNOWN | |
| NONCONTRIBUTING AREA UNKNOWN BASIN UNKNOWN | |
| DATA FROM WATER COMMISSIONERS (P) |
| MEAN DAILY FLOW IN CFS BY WATER YEAR | |||||||||||||
| 1975 | |||||||||||||
| DAY | OCT | NOV | DEC | JAN | FEB | MAR | APR | MAY | JUNE | JULY | AUG | SEPT | DAY |
| 1 | ** | ** | ** | ** | ** | ** | ** | ** | 15.00 | 22.25 | 16.50 | 4.50 | 1 |
| 2 | ** | ** | ** | ** | ** | ** | ** | ** | 16.00 | 22.50 | 16.00 | 5.00 | 2 |
| 3 | ** | ** | ** | ** | ** | ** | ** | ** | 17.00 | 22.25 | 15.00 | 6.00 | 3 |
| 4 | ** | ** | ** | ** | ** | ** | ** | ** | 18.70 | 22.50 | 5.00 | 6.25 | 4 |
| 5 | ** | ** | ** | ** | ** | ** | ** | ** | 19.00 | 22.50 | 5.00 | 6.00 | 5 |
| 6 | ** | ** | ** | ** | ** | ** | ** | ** | 20.00 | 22.50 | 5.00 | 5.00 | 6 |
| 7 | ** | ** | ** | ** | ** | ** | ** | ** | 19.00 | 22.75 | 4.48 | 4.00 | 7 |
| 8 | ** | ** | ** | ** | ** | ** | ** | ** | 18.00 | 22.75 | 4.48 | 3.00 | 8 |
| 9 | ** | ** | ** | ** | ** | ** | ** | ** | 18.00 | 22.75 | 4.48 | 2.00 | 9 |
| 10 | ** | ** | ** | ** | ** | ** | ** | ** | 17.00 | 22.75 | 4.48 | 2.00 | 10 |
| 11 | ** | ** | ** | ** | ** | ** | ** | ** | 17.50 | 22.50 | 4.48 | 2.00 | 11 |
| 12 | ** | ** | ** | ** | ** | ** | ** | ** | 17.00 | 22.00 | 4.48 | 2.00 | 12 |
| 13 | ** | ** | ** | ** | ** | ** | ** | 6.38 | 18.00 | 21.00 | 4.48 | 3.00 | 13 |
| 14 | ** | ** | ** | ** | ** | ** | ** | 6.50 | 20.00 | 20.50 | 4.48 | 3.00 | 14 |
| 15 | ** | ** | ** | ** | ** | ** | ** | 6.50 | 22.00 | 20.00 | 4.48 | 3.40 | 15 |
| 16 | ** | ** | ** | ** | ** | ** | ** | 7.00 | 22.00 | 19.50 | 4.24 | 3.50 | 16 |
| 17 | ** | ** | ** | ** | ** | ** | ** | 7.00 | 24.00 | 19.00 | 4.24 | 3.50 | 17 |
| 18 | ** | ** | ** | ** | ** | ** | ** | 7.00 | 24.25 | 18.50 | 4.24 | 3.50 | 18 |
| 19 | ** | ** | ** | ** | ** | ** | ** | 7.00 | 18.00 | 18.00 | 4.24 | 4.00 | 19 |
| 20 | ** | ** | ** | ** | ** | ** | ** | 7.00 | 16.30 | 17.50 | 4.24 | 4.50 | 20 |
| 21 | ** | ** | ** | ** | ** | ** | ** | 8.00 | 15.00 | 17.00 | 4.24 | 4.50 | 21 |
| 22 | ** | ** | ** | ** | ** | ** | ** | 8.00 | 15.00 | 17.00 | 4.24 | 4.50 | 22 |
| 23 | ** | ** | ** | ** | ** | ** | ** | 9.00 | 17.00 | 17.00 | 4.24 | 5.00 | 23 |
| 24 | ** | ** | ** | ** | ** | ** | ** | 9.00 | 19.00 | 16.70 | 4.24 | 5.00 | 24 |
| 25 | ** | ** | ** | ** | ** | ** | ** | 10.00 | 22.75 | 16.50 | 4.24 | 5.25 | 25 |
| 26 | ** | ** | ** | ** | ** | ** | ** | 10.00 | 17.50 | 16.50 | 4.24 | 5.00 | 26 |
| 27 | ** | ** | ** | ** | ** | ** | ** | 11.00 | 17.50 | 16.50 | 4.24 | 5.00 | 27 |
| 28 | ** | ** | ** | ** | ** | ** | ** | 12.00 | 19.00 | 16.50 | 4.24 | 5.00 | 28 |
| 29 | ** | ** | ** | ** | ** | ** | 13.00 | 21.00 | 16.50 | 4.24 | 5.00 | 29 | |
| 30 | ** | ** | ** | ** | ** | ** | 13.00 | 22.00 | 16.50 | 4.24 | 5.00 | 30 | |
| 31 | ** | ** | ** | ** | 14.00 | 16.50 | 4.24 | 31 | |||||
| TOTAL | ** | ** | ** | ** | ** | ** | ** | 171.38* | 562.50 | 606.95 | 170.66 | 125.40 | |
| MEAN | ** | ** | ** | ** | ** | ** | ** | 9.02* | 18.75 | 19.58 | 5.51 | 4.18 | |
| AC-FT | ** | ** | ** | ** | ** | ** | ** | 339.93* | 1115.70 | 1203.87 | 338.50 | 248.73 | |
| GILLIGAN & IVEN DITCH | STATION NO. 0066110.00 |
| LATITUDE 0-00-00 LONGITUDE 0-00-00 | |
| SECTION 0 TOWNSHIP 0, RANGE 0 P.M. | |
| ELEVATION UNKNOWN DRAINAGE AREA UNKNOWN | |
| NONCONTRIBUTING AREA UNKNOWN BASIN UNKNOWN | |
| DATA FROM WATER COMMISSIONERS (P) |
| MEAN DAILY FLOW IN CFS BY WATER YEAR | |||||||||||||
| 1976 | |||||||||||||
| DAY | OCT | NOV | DEC | JAN | FEB | MAR | APR | MAY | JUNE | JULY | AUG | SEPT | DAY |
| 1 | ** | ** | ** | ** | ** | ** | ** | ** | 15.00 | 23.20 | 20.00 | ** | 1 |
| 2 | ** | ** | ** | ** | ** | ** | ** | ** | 16.00 | 23.00 | 9.00 | ** | 2 |
| 3 | ** | ** | ** | ** | ** | ** | ** | ** | 17.50 | 23.00 | 7.00 | ** | 3 |
| 4 | ** | ** | ** | ** | ** | ** | ** | ** | 18.00 | 23.00 | 5.00 | ** | 4 |
| 5 | ** | ** | ** | ** | ** | ** | ** | 1.50 | 18.00 | 23.00 | ** | ** | 5 |
| 6 | ** | ** | ** | ** | ** | ** | ** | 1.00 | 18.00 | 22.00 | ** | ** | 6 |
| 7 | ** | ** | ** | ** | ** | ** | ** | 1.00 | 19.00 | 21.70 | ** | ** | 7 |
| 8 | ** | ** | ** | ** | ** | ** | ** | 1.00 | 19.00 | 21.00 | ** | ** | 8 |
| 9 | ** | ** | ** | ** | ** | ** | ** | 1.00 | 19.00 | 21.00 | ** | ** | 9 |
| 10 | ** | ** | ** | ** | ** | ** | ** | 1.00 | 19.50 | 20.00 | ** | ** | 10 |
| 11 | ** | ** | ** | ** | ** | ** | ** | ** | 20.00 | 20.00 | ** | ** | 11 |
| 12 | ** | ** | ** | ** | ** | ** | ** | ** | 21.00 | 19.90 | ** | ** | 12 |
| 13 | ** | ** | ** | ** | ** | ** | ** | ** | 22.00 | 18.00 | ** | ** | 13 |
| 14 | ** | ** | ** | ** | ** | ** | ** | ** | 18.00 | 17.00 | ** | ** | 14 |
| 15 | ** | ** | ** | ** | ** | ** | ** | 6.00 | 18.00 | 15.50 | ** | ** | 15 |
| 16 | ** | ** | ** | ** | ** | ** | ** | 6.00 | 18.00 | 14.00 | ** | ** | 16 |
| 17 | ** | ** | ** | ** | ** | ** | ** | 6.00 | 18.70 | 12.00 | 4.00 | ** | 17 |
| 18 | ** | ** | ** | ** | ** | ** | ** | 6.00 | 19.00 | 10.00 | 4.00 | ** | 18 |
| 19 | ** | ** | ** | ** | ** | ** | ** | 6.00 | 19.00 | 9.60 | 4.00 | ** | 19 |
| 20 | ** | ** | ** | ** | ** | ** | ** | 6.50 | 19.00 | 8.00 | 4.00 | ** | 20 |
| 21 | ** | ** | ** | ** | ** | ** | ** | 7.00 | 19.00 | 8.00 | 5.00 | ** | 21 |
| 22 | ** | ** | ** | ** | ** | ** | ** | 7.00 | 20.00 | 8.00 | 5.00 | ** | 22 |
| 23 | ** | ** | ** | ** | ** | ** | ** | 8.00 | 20.00 | 15.00 | 5.20 | ** | 23 |
| 24 | ** | ** | ** | ** | ** | ** | ** | 8.00 | 20.40 | 15.00 | 5.00 | ** | 24 |
| 25 | ** | ** | ** | ** | ** | ** | ** | 9.00 | 21.00 | 15.00 | 5.00 | ** | 25 |
| 26 | ** | ** | ** | ** | ** | ** | ** | 9.00 | 21.00 | 15.00 | ** | ** | 26 |
| 27 | ** | ** | ** | ** | ** | ** | ** | 10.20 | 22.00 | 15.00 | ** | ** | 27 |
| 28 | ** | ** | ** | ** | ** | ** | ** | 10.00 | 22.00 | 15.50 | ** | ** | 28 |
| 29 | ** | ** | ** | ** | ** | ** | 11.00 | 23.00 | 15.00 | ** | ** | 29 | |
| 30 | ** | ** | ** | ** | ** | ** | 12.00 | 23.00 | 14.00 | ** | ** | 30 | |
| 31 | ** | ** | ** | ** | 15.00 | 13.00 | ** | 31 | |||||
| TOTAL | ** | ** | ** | ** | ** | ** | ** | 149.20* | 583.10 | 513.40 | 72.20* | ** | |
| MEAN | ** | ** | ** | ** | ** | ** | ** | 6.49* | 19.44 | 16.56 | 5.55* | ** | |
| AC-FT | ** | ** | ** | ** | ** | ** | ** | 295.93* | 1156.56 | 1018.31 | 143.21* | ** | |
| GILLIGAN & IVEN DITCH | STATION NO. 0066110.00 |
| LATITUDE 0-00-00 LONGITUDE 0-00-00 | |
| SECTION 0 TOWNSHIP 0, RANGE 0 P.M. | |
| ELEVATION UNKNOWN DRAINAGE AREA UNKNOWN | |
| NONCONTRIBUTING AREA UNKNOWN BASIN UNKNOWN | |
| DATA FROM WATER COMMISSIONERS (P) |
| MEAN DAILY FLOW IN CFS BY WATER YEAR | |||||||||||||
| 1978 | |||||||||||||
| DAY | OCT | NOV | DEC | JAN | FEB | MAR | APR | MAY | JUNE | JULY | AUG | SEPT | DAY |
| 1 | ** | ** | ** | ** | ** | ** | ** | ** | 13.00 | 20.00 | 2.00 | ** | 1 |
| 2 | ** | ** | ** | ** | ** | ** | ** | ** | 12.00 | 20.00 | 1.00 | ** | 2 |
| 3 | ** | ** | ** | ** | ** | ** | ** | ** | 13.00 | 20.00 | 1.00 | ** | 3 |
| 4 | ** | ** | ** | ** | ** | ** | ** | ** | 14.00 | 20.00 | 1.00 | ** | 4 |
| 5 | ** | ** | ** | ** | ** | ** | ** | ** | 15.00 | 21.00 | 2.00 | 6.00 | 5 |
| 6 | ** | ** | ** | ** | ** | ** | ** | ** | 18.00 | 21.00 | 2.00 | 5.00 | 6 |
| 7 | ** | ** | ** | ** | ** | ** | ** | ** | 22.00 | 20.00 | 2.00 | ** | 7 |
| 8 | ** | ** | ** | ** | ** | ** | ** | ** | 22.00 | 20.00 | 2.00 | ** | 8 |
| 9 | ** | ** | ** | ** | ** | ** | ** | ** | 22.00 | 21.00 | 2.00 | ** | 9 |
| 10 | ** | ** | ** | ** | ** | ** | ** | 5.00 | 22.00 | 21.00 | 2.00 | ** | 10 |
| 11 | ** | ** | ** | ** | ** | ** | ** | 5.00 | 18.00 | 21.00 | 2.00 | 3.00 | 11 |
| 12 | ** | ** | ** | ** | ** | ** | ** | 5.00 | 14.00 | 21.00 | 2.00 | ** | 12 |
| 13 | ** | ** | ** | ** | ** | ** | ** | 5.00 | 12.00 | 21.00 | 2.00 | ** | 13 |
| 14 | ** | ** | ** | ** | ** | ** | ** | 5.00 | 12.00 | 20.00 | 2.00 | ** | 14 |
| 15 | ** | ** | ** | ** | ** | ** | ** | 6.00 | 20.00 | 19.00 | ** | ** | 15 |
| 16 | ** | ** | ** | ** | ** | ** | ** | 7.00 | 20.00 | 18.00 | ** | ** | 16 |
| 17 | ** | ** | ** | ** | ** | ** | ** | 8.00 | 20.00 | 17.00 | ** | ** | 17 |
| 18 | ** | ** | ** | ** | ** | ** | ** | 9.00 | 20.00 | 16.00 | ** | ** | 18 |
| 19 | ** | ** | ** | ** | ** | ** | ** | 10.00 | 20.00 | 13.00 | ** | ** | 19 |
| 20 | ** | ** | ** | ** | ** | ** | ** | 10.00 | 20.00 | 10.00 | ** | ** | 20 |
| 21 | ** | ** | ** | ** | ** | ** | ** | 10.00 | 22.00 | 10.00 | ** | ** | 21 |
| 22 | ** | ** | ** | ** | ** | ** | ** | 10.00 | 22.00 | 16.00 | ** | ** | 22 |
| 23 | ** | ** | ** | ** | ** | ** | ** | 12.00 | 22.00 | 16.00 | ** | ** | 23 |
| 24 | ** | ** | ** | ** | ** | ** | ** | 14.00 | 21.00 | 16.00 | ** | ** | 24 |
| 25 | ** | ** | ** | ** | ** | ** | ** | 14.00 | 21.00 | 16.00 | ** | ** | 25 |
| 26 | ** | ** | ** | ** | ** | ** | ** | 15.00 | 20.00 | 16.00 | ** | ** | 26 |
| 27 | ** | ** | ** | ** | ** | ** | ** | 16.00 | 20.00 | 4.00 | ** | ** | 27 |
| 28 | ** | ** | ** | ** | ** | ** | ** | 17.00 | 19.00 | 4.00 | ** | ** | 28 |
| 29 | ** | ** | ** | ** | ** | ** | 16.00 | 19.00 | 4.00 | ** | ** | 29 | |
| 30 | ** | ** | ** | ** | ** | ** | 15.00 | 20.00 | 4.00 | ** | ** | 30 | |
| 31 | ** | ** | ** | ** | 14.00 | 4.00 | ** | 31 | |||||
| TOTAL | ** | ** | ** | ** | ** | ** | ** | 228.00* | 555.00 | 490.00 | 25.00* | 3.00* | |
| MEAN | ** | ** | ** | ** | ** | ** | ** | 10.36* | 18.50 | 15.81 | 1.79* | 3.00* | |
| AC-FT | ** | ** | ** | ** | ** | ** | ** | 452.23* | 1100.83 | 971.90 | 49.59* | 5.95* | |
Source: Wyoming Water Resources Data System, March 20, 2000
Harry Rahm Ditch, West Fork New Fork River
Diversion Description: Diversion consists of a single 5' wide wood slide gate. A wood plank diversion dam exists.1
Conveyance Description: Open Channel Canal, approximately 3/4 mile long1
Wyoming Water Rights Summary:
| Priority Date (M-D-Y) | Permit Number |
Permitted Use | Acres | Flow (cfs) |
Cumulative Flow (cfs) | Comments |
| 07-23-1896 | 1281 | Irrigation | 171.00 | 2.44 | 2.44 | POD/MOC change from a portion of W.F. Irrigation Ditch. |
| 07-13-1899 | 2175 | Irrigation | 240.00 | 3.42 | 5.86 | POD/MOC change from a portion of Ulrica Ditch. |
| 07-12-1902 | 4042 | Irrigation | 440.00 | 6.29 | 12.15 | POD/MOC change from a McKinley Ditch. |
| 11-11-1903 | 5855 | Irrigation | 12.15 | POD/MOC change from a portion of Ulrica Ditch. 333.60 AF Secondary Supply from New Fork Lake Reservoir (480R) (240.00 acres served) | ||
| 11-11-1903 | 5855 | Irrigation | 12.15 | POD/MOC change from a portion of W.F Irrigation Ditch. 208.50 AF Secondary Supply from New Fork Lake Reservoir (480R) (150.00 acres served) | ||
| 11-11-1903 | 5855 | Irrigation | 12.15 | POD/MOC change from McKinley Ditch. 601.10 AF Secondary Supply from New Fork Lake Reservoir (480R) (432.45 acres served) | ||
| 11-11-1903 | 4866E | Irrigation | 12.15 | POD/MOC change from a portion of Ulrica Ditch. 55.60 AF Secondary Supply from New Fork Lake Reservoir (480R) (40.00 acres served) | ||
| 11-28-1914 | 12843 | Irrigation | 40.00 | 0.57 | 12.72 | POD/MOC change from Channel Ditch. |
Storage Rights: New Fork Lake Reservoir.
Estimated Canal Losses: Typical losses (10%) are experienced.1
Irrigation Practices: Lands are flood irrigated.1
Crop Types / Consumptive Use: Lands are native grass hay and pasture.1
Return Flows: Return flows are delivered to West Fork New Fork River at Willow Creek.2
Other Operational Information: The canal is typically turned on in late May and irrigation flows stop in late July. Stock flows continue until October.1
|
Harry Rahm Ditch, West Fork New Fork River, Diversion Data
| Wateryear | May | June | July | August | September | |||||
| Average (cfs) | Monthly Total (AF) | Average (cfs) | Monthly Total (AF) | Average (cfs) | Monthly Total (AF) | Average (cfs) | Monthly Total (AF) | Average (cfs) | Monthly Total (AF) | |
| 1980 | ||||||||||
| 1981 | ||||||||||
| 1982 | ||||||||||
| 1983 | ||||||||||
| 1984 | 14.13 | 841.09 | 5.63 | 345.90 | 0.00 | 0.00 | 3.30 | 196.46 | ||
| 1985 | 8.16 | 485.81 | 3.29 | 202.04 | 1.28 | 78.82 | 3.11 | 185.22 | ||
| 1986 | 16.39 | 975.17 | 14.20 | 873.34 | 0.37 | 22.51 | 1.51 | 89.77 | ||
| 1987 | 4.97 | 305.34 | 5.87 | 349.39 | 3.01 | 185.04 | 1.18 | 72.69 | 2.80 | 166.61 |
| 1988 | ||||||||||
| 1989 | ||||||||||
| 1990 | ||||||||||
| 1991 | ||||||||||
| 1992 | ||||||||||
| 1993 | ||||||||||
| 1994 | 13.88 | 853.45 | ||||||||
| 1995 | ||||||||||
| 1996 | ||||||||||
| 1997 | ||||||||||
| 1998 | ||||||||||
| Averages: | 4.97 | 305.34 | 11.14 | 662.87 | 7.12 | 437.50 | 0.71 | 43.51 | 2.68 | 159.52 |
Data:
1994: 7/2, 14.30 cfs; 7/22, 15.00 cfs; 9/7, 3.00 cfs.
Supply: 1980, below average; 1981, slightly below average; 1982, average (late peak); 1983, above average; 1984, above average; 1985, below average; 1986, average to slightly above average; 1988: very below average; 1989, below average; 1990, below average; 1991, slightly below average; 1992, below average; 1993, average; 1994, below average; 1995, average to above average; 1996, average; 1997, average; 1998, average to above average.
Source: State Engineer's Office, Annual Hydrographers' Reports.
| HARRY RAHM DITCH | STATION NO. 007113.00 |
| LATITUDE 42-59-51 LONGITUDE 109-58-39 | |
| NW1/4 SW1/4 SECTION 25 TOWNSHIP 35N, RANGE 110W 6TH P.M. | |
| ELEVATION 7360.00 FT DRAINAGE AREA UNKNOWN | |
| NONCONTRIBUTING 0.00 SQ MI BASIN 15570800 | |
| SUBLETTE COUNTY | |
| DATA FROM WWRC | |
| ***TO USE THIS DATA,SEE VIC HASFURTHER*** |
| MEAN DAILY FLOW IN CFS BY WATER YEAR | |||||||||||||
| 1984 | |||||||||||||
| DAY | OCT | NOV | DEC | JAN | FEB | MAR | APR | MAY | JUNE | JULY | AUG | SEPT | DAY |
| 1 | ** | ** | ** | ** | ** | ** | ** | ** | 12.90 | 14.00 | 0.00 | 0.00 | 1 |
| 2 | ** | ** | ** | ** | ** | ** | ** | ** | 12.90 | 3.92 | 0.00 | 0.00 | 2 |
| 3 | ** | ** | ** | ** | ** | ** | ** | ** | 12.90 | 4.21 | 0.00 | 0.00 | 3 |
| 4 | ** | ** | ** | ** | ** | ** | ** | ** | 9.35 | 10.70 | 0.00 | 0.58 | 4 |
| 5 | ** | ** | ** | ** | ** | ** | ** | ** | 12.30 | 12.60 | 0.00 | 1.90 | 5 |
| 6 | ** | ** | ** | ** | ** | ** | ** | ** | 20.40 | 12.90 | 0.00 | 1.21 | 6 |
| 7 | ** | ** | ** | ** | ** | ** | ** | ** | 19.10 | 9.35 | 0.00 | 1.48 | 7 |
| 8 | ** | ** | ** | ** | ** | ** | ** | ** | 16.60 | 8.33 | 0.00 | 1.79 | 8 |
| 9 | ** | ** | ** | ** | ** | ** | ** | ** | 15.80 | 7.17 | 0.00 | 2.88 | 9 |
| 10 | ** | ** | ** | ** | ** | ** | ** | ** | 16.20 | 8.09 | 0.00 | 3.22 | 10 |
| 11 | ** | ** | ** | ** | ** | ** | ** | ** | 18.20 | 8.83 | 0.00 | 3.63 | 11 |
| 12 | ** | ** | ** | ** | ** | ** | ** | ** | 15.00 | 9.09 | 0.00 | 4.68 | 12 |
| 13 | ** | ** | ** | ** | ** | ** | ** | ** | 13.30 | 9.35 | 0.00 | 3.92 | 13 |
| 14 | ** | ** | ** | ** | ** | ** | ** | ** | 11.60 | 9.35 | 0.00 | 3.63 | 14 |
| 15 | ** | ** | ** | ** | ** | ** | ** | ** | 11.00 | 12.60 | 0.00 | 3.63 | 15 |
| 16 | ** | ** | ** | ** | ** | ** | ** | ** | 15.80 | 8.33 | 0.00 | 3.63 | 16 |
| 17 | ** | ** | ** | ** | ** | ** | ** | ** | 15.80 | 8.83 | 0.00 | 2.88 | 17 |
| 18 | ** | ** | ** | ** | ** | ** | ** | ** | 15.40 | 10.70 | 0.00 | 2.88 | 18 |
| 19 | ** | ** | ** | ** | ** | ** | ** | ** | 12.60 | 5.19 | 0.00 | 2.72 | 19 |
| 20 | ** | ** | ** | ** | ** | ** | ** | ** | 12.30 | 0.12 | 0.00 | 3.22 | 20 |
| 21 | ** | ** | ** | ** | ** | ** | ** | 0.54 | 12.30 | 0.07 | 0.00 | 4.21 | 21 |
| 22 | ** | ** | ** | ** | ** | ** | ** | 0.49 | 11.60 | 0.38 | 0.00 | 4.06 | 22 |
| 23 | ** | ** | ** | ** | ** | ** | ** | 0.45 | 11.60 | 0.24 | 0.00 | 6.95 | 23 |
| 24 | ** | ** | ** | ** | ** | ** | ** | 0.45 | 14.00 | 0.04 | 0.00 | 6.32 | 24 |
| 25 | ** | ** | ** | ** | ** | ** | ** | 0.45 | 15.80 | 0.00 | 0.00 | 5.37 | 25 |
| 26 | ** | ** | ** | ** | ** | ** | ** | 0.22 | 15.40 | 0.00 | 0.00 | 5.02 | 26 |
| 27 | ** | ** | ** | ** | ** | ** | ** | 1.68 | 14.30 | 0.00 | 0.00 | 5.02 | 27 |
| 28 | ** | ** | ** | ** | ** | ** | ** | 1.58 | 12.30 | 0.00 | 0.00 | 4.85 | 28 |
| 29 | ** | ** | ** | ** | ** | ** | 1.58 | 12.60 | 0.00 | 0.00 | 4.85 | 29 | |
| 30 | ** | ** | ** | ** | ** | ** | 11.60 | 14.70 | 0.00 | 0.00 | 4.52 | 30 | |
| 31 | ** | ** | ** | ** | 13.30 | 0.00 | 0.00 | 31 | |||||
| TOTAL | ** | ** | ** | ** | ** | ** | ** | 32.34* | 424.05 | 174.39 | 0.00 | 99.05 | |
| MEAN | ** | ** | ** | ** | ** | ** | ** | 2.94* | 14.14 | 5.63 | 0.00 | 3.30 | |
| AC-FT | ** | ** | ** | ** | ** | ** | ** | 64.15* | 841.09 | 345.90 | 0.00 | 196.46 | |
| HARRY RAHM DITCH | STATION NO. 007113.00 |
| LATITUDE 42-59-51 LONGITUDE 109-58-39 | |
| NW1/4 SW1/4 SECTION 25 TOWNSHIP 35N, RANGE 110W 6TH P.M. | |
| ELEVATION 7360.00 FT DRAINAGE AREA UNKNOWN | |
| NONCONTRIBUTING 0.00 SQ MI BASIN 15570800 | |
| SUBLETTE COUNTY | |
| DATA FROM WWRC | |
| ***TO USE THIS DATA,SEE VIC HASFURTHER*** |
| MEAN DAILY FLOW IN CFS BY WATER YEAR | |||||||||||||
| 1985 | |||||||||||||
| DAY | OCT | NOV | DEC | JAN | FEB | MAR | APR | MAY | JUNE | JULY | AUG | SEPT | DAY |
| 1 | 4.36 | ** | ** | ** | ** | ** | ** | ** | 11.18 | 0.00 | 0.00 | 3.03 | 1 |
| 2 | 5.02 | ** | ** | ** | ** | ** | ** | ** | 10.01 | 0.00 | 0.00 | 0.77 | 2 |
| 3 | 5.19 | ** | ** | ** | ** | ** | ** | ** | 13.50 | 0.86 | 0.00 | 0.00 | 3 |
| 4 | 4.85 | ** | ** | ** | ** | ** | ** | ** | 12.96 | 7.72 | 0.00 | 0.00 | 4 |
| 5 | 3.77 | ** | ** | ** | ** | ** | ** | ** | 12.18 | 10.24 | 0.00 | 0.11 | 5 |
| 6 | 3.77 | ** | ** | ** | ** | ** | ** | ** | 10.45 | 10.47 | 0.00 | 0.33 | 6 |
| 7 | 3.77 | ** | ** | ** | ** | ** | ** | ** | 10.01 | 10.24 | 0.00 | 0.86 | 7 |
| 8 | 3.77 | ** | ** | ** | ** | ** | ** | ** | 9.57 | 9.35 | 0.00 | 1.99 | 8 |
| 9 | 3.77 | ** | ** | ** | ** | ** | ** | ** | 9.79 | 6.45 | 0.00 | 3.03 | 9 |
| 10 | 3.92 | ** | ** | ** | ** | ** | ** | ** | 9.79 | 5.03 | 0.00 | 3.03 | 10 |
| 11 | 3.92 | ** | ** | ** | ** | ** | ** | ** | 9.79 | 5.96 | 1.47 | 3.03 | 11 |
| 12 | 4.21 | ** | ** | ** | ** | ** | ** | ** | 9.79 | 5.33 | 1.33 | 3.71 | 12 |
| 13 | 4.21 | ** | ** | ** | ** | ** | ** | ** | 9.35 | 4.61 | 1.07 | 3.14 | 13 |
| 14 | 4.21 | ** | ** | ** | ** | ** | ** | ** | 9.57 | 4.08 | 0.86 | 3.03 | 14 |
| 15 | 7.85 | ** | ** | ** | ** | ** | ** | ** | 10.01 | 3.83 | 0.69 | 3.25 | 15 |
| 16 | 12.30 | ** | ** | ** | ** | ** | ** | ** | 9.35 | 8.31 | 0.77 | 3.71 | 16 |
| 17 | 1.90 | ** | ** | ** | ** | ** | ** | ** | 6.80 | 7.91 | 1.19 | 3.83 | 17 |
| 18 | 0.68 | ** | ** | ** | ** | ** | ** | ** | 6.28 | 0.54 | 1.33 | 3.83 | 18 |
| 19 | 0.18 | ** | ** | ** | ** | ** | ** | 5.64 | 5.03 | 0.20 | 2.63 | 4.61 | 19 |
| 20 | 0.15 | ** | ** | ** | ** | ** | ** | 8.31 | 4.47 | 0.20 | 1.63 | 4.08 | 20 |
| 21 | 0.11 | ** | ** | ** | ** | ** | ** | 7.91 | 5.79 | 0.33 | 1.99 | 4.21 | 21 |
| 22 | 0.07 | ** | ** | ** | ** | ** | ** | 6.98 | 7.34 | 0.20 | 1.80 | 4.89 | 22 |
| 23 | 0.03 | ** | ** | ** | ** | ** | ** | 6.98 | 7.72 | 0.00 | 1.80 | 4.61 | 23 |
| 24 | 0.00 | ** | ** | ** | ** | ** | ** | 7.16 | 7.34 | 0.00 | 1.99 | 4.47 | 24 |
| 25 | 0.00 | ** | ** | ** | ** | ** | ** | 11.18 | 8.11 | 0.00 | 2.20 | 4.47 | 25 |
| 26 | 0.00 | ** | ** | ** | ** | ** | ** | 13.23 | 7.72 | 0.00 | 2.42 | 4.47 | 26 |
| 27 | 0.00 | ** | ** | ** | ** | ** | ** | 15.81 | 6.28 | 0.00 | 2.63 | 4.61 | 27 |
| 28 | ** | ** | ** | ** | ** | ** | ** | 15.81 | 4.75 | 0.00 | 3.03 | 4.61 | 28 |
| 29 | ** | ** | ** | ** | ** | ** | 14.63 | 0.00 | 0.00 | 2.54 | 4.08 | 29 | |
| 30 | ** | ** | ** | ** | ** | ** | 16.11 | 0.00 | 0.00 | 2.54 | 3.59 | 30 | |
| 31 | ** | ** | ** | ** | 13.51 | 0.00 | 3.83 | 31 | |||||
| TOTAL | 82.01* | ** | ** | ** | ** | ** | ** | 143.26* | 244.93 | 101.86 | 39.74 | 93.38 | |
| MEAN | 3.04* | ** | ** | ** | ** | ** | ** | 11.02* | 8.16 | 3.29 | 1.28 | 3.11 | |
| AC-FT | 162.66* | ** | ** | ** | ** | ** | ** | 284.15* | 485.81 | 202.04 | 78.82 | 185.22 | |
| HARRY RAHM DITCH | STATION NO. 007113.00 |
| LATITUDE 42-59-51 LONGITUDE 109-58-39 | |
| NW1/4 SW1/4 SECTION 25 TOWNSHIP 35N, RANGE 110W 6TH P.M. | |
| ELEVATION 7360.00 FT DRAINAGE AREA UNKNOWN | |
| NONCONTRIBUTING 0.00 SQ MI BASIN 15570800 | |
| SUBLETTE COUNTY | |
| DATA FROM WWRC | |
| ***TO USE THIS DATA,SEE VIC HASFURTHER*** |
| MEAN DAILY FLOW IN CFS BY WATER YEAR | |||||||||||||
| 1986 | |||||||||||||
| DAY | OCT | NOV | DEC | JAN | FEB | MAR | APR | MAY | JUNE | JULY | AUG | SEPT | DAY |
| 1 | 3.47 | 3.36 | ** | ** | ** | ** | ** | ** | 8.37 | 29.47 | 0.00 | 0.19 | 1 |
| 2 | 3.59 | 3.36 | ** | ** | ** | ** | ** | ** | 9.43 | 31.82 | 0.00 | 0.17 | 2 |
| 3 | 3.59 | 3.36 | ** | ** | ** | ** | ** | ** | 7.38 | 31.34 | 0.00 | 0.17 | 3 |
| 4 | 3.59 | ** | ** | ** | ** | ** | ** | ** | 7.96 | 31.54 | 0.00 | 0.17 | 4 |
| 5 | 3.47 | ** | ** | ** | ** | ** | ** | ** | 17.99 | 30.87 | 0.00 | 0.19 | 5 |
| 6 | 3.25 | ** | ** | ** | ** | ** | ** | ** | 6.31 | 30.87 | 0.00 | 0.17 | 6 |
| 7 | 3.47 | ** | ** | ** | ** | ** | ** | ** | 19.71 | 29.47 | 0.00 | 0.22 | 7 |
| 8 | 3.59 | ** | ** | ** | ** | ** | ** | ** | 16.36 | 25.93 | 0.00 | 0.29 | 8 |
| 9 | 3.59 | ** | ** | ** | ** | ** | ** | ** | 12.86 | 26.79 | 0.00 | 0.69 | 9 |
| 10 | 3.71 | ** | ** | ** | ** | ** | ** | ** | 8.57 | 25.09 | 0.00 | 0.69 | 10 |
| 11 | 3.59 | ** | ** | ** | ** | ** | ** | ** | 10.11 | 24.27 | 0.00 | 0.69 | 11 |
| 12 | 3.59 | ** | ** | ** | ** | ** | ** | ** | 25.93 | 23.47 | 0.00 | 0.77 | 12 |
| 13 | 3.47 | ** | ** | ** | ** | ** | ** | ** | 25.09 | 22.68 | 0.00 | 0.86 | 13 |
| 14 | 3.47 | ** | ** | ** | ** | ** | ** | ** | 24.68 | 22.68 | 0.00 | 0.96 | 14 |
| 15 | 3.47 | ** | ** | ** | ** | ** | ** | ** | 20.79 | 22.68 | 0.00 | 0.96 | 15 |
| 16 | 3.47 | ** | ** | ** | ** | ** | ** | ** | 17.65 | 16.05 | 0.00 | 1.08 | 16 |
| 17 | 3.47 | ** | ** | ** | ** | ** | ** | ** | 14.84 | 11.06 | 0.00 | 1.08 | 17 |
| 18 | 3.47 | ** | ** | ** | ** | ** | ** | ** | 13.68 | 3.46 | 0.00 | 1.48 | 18 |
| 19 | 3.47 | ** | ** | ** | ** | ** | ** | ** | 10.82 | 0.77 | 0.00 | 2.24 | 19 |
| 20 | 3.47 | ** | ** | ** | ** | ** | ** | ** | 9.43 | 0.00 | 0.00 | 2.01 | 20 |
| 21 | 3.47 | ** | ** | ** | ** | ** | ** | ** | 28.55 | 0.00 | 0.00 | 2.24 | 21 |
| 22 | 3.59 | ** | ** | ** | ** | ** | ** | 0.12 | 29.01 | 0.00 | 0.00 | 2.33 | 22 |
| 23 | 3.71 | ** | ** | ** | ** | ** | ** | 0.01 | 27.22 | 0.00 | 0.10 | 2.61 | 23 |
| 24 | 3.71 | ** | ** | ** | ** | ** | ** | 0.01 | 25.09 | 0.04 | 2.33 | 3.12 | 24 |
| 25 | 3.59 | ** | ** | ** | ** | ** | ** | 0.01 | 21.91 | 0.00 | 1.80 | 3.02 | 25 |
| 26 | 3.59 | ** | ** | ** | ** | ** | ** | 0.01 | 17.32 | 0.00 | 1.63 | 3.12 | 26 |
| 27 | 3.47 | ** | ** | ** | ** | ** | ** | 0.01 | 15.13 | 0.00 | 1.47 | 3.35 | 27 |
| 28 | 3.47 | ** | ** | ** | ** | ** | ** | 0.01 | 13.97 | 0.00 | 1.33 | 3.58 | 28 |
| 29 | 2.93 | ** | ** | ** | ** | ** | 0.77 | 13.68 | 0.00 | 1.47 | 3.35 | 29 | |
| 30 | 2.63 | ** | ** | ** | ** | ** | 0.01 | 11.81 | 0.00 | 0.96 | 3.46 | 30 | |
| 31 | 3.14 | ** | ** | ** | 5.04 | 0.00 | 0.26 | 31 | |||||
| TOTAL | 107.56 | 10.08* | ** | ** | ** | ** | ** | 6.00* | 491.65 | 440.31 | 11.35 | 45.26 | |
| MEAN | 3.47 | 3.36* | ** | ** | ** | ** | ** | .60* | 16.39 | 14.20 | 0.37 | 1.51 | |
| AC-FT | 213.34 | 19.99* | ** | ** | ** | ** | ** | 11.90* | 975.17 | 873.34 | 22.51 | 89.77 | |
| HARRY RAHM DITCH | STATION NO. 007113.00 |
| LATITUDE 42-59-51 LONGITUDE 109-58-39 | |
| NW1/4 SW1/4 SECTION 25 TOWNSHIP 35N, RANGE 110W 6TH P.M. | |
| ELEVATION 7360.00 FT DRAINAGE AREA UNKNOWN | |
| NONCONTRIBUTING 0.00 SQ MI BASIN 15570800 | |
| SUBLETTE COUNTY | |
| DATA FROM WWRC | |
| ***TO USE THIS DATA,SEE VIC HASFURTHER*** |
| MEAN DAILY FLOW IN CFS BY WATER YEAR | |||||||||||||
| 1987 | |||||||||||||
| DAY | OCT | NOV | DEC | JAN | FEB | MAR | APR | MAY | JUNE | JULY | AUG | SEPT | DAY |
| 1 | 3.82 | 0.54 | ** | ** | ** | ** | ** | ** | 4.90 | 4.47 | 0.00 | 2.53 | 1 |
| 2 | 4.33 | 0.61 | ** | ** | ** | ** | ** | ** | 5.35 | 5.99 | 0.00 | 2.62 | 2 |
| 3 | 4.07 | 0.42 | ** | ** | ** | ** | ** | ** | 5.82 | 2.06 | 0.00 | 3.88 | 3 |
| 4 | 3.82 | 0.42 | ** | ** | ** | ** | ** | ** | 4.61 | 0.77 | 0.00 | 4.12 | 4 |
| 5 | 3.58 | ** | ** | ** | ** | ** | ** | ** | 3.58 | 0.47 | 0.00 | 3.44 | 5 |
| 6 | 3.58 | ** | ** | ** | ** | ** | ** | ** | 3.23 | 0.28 | 0.00 | 2.81 | 6 |
| 7 | 3.58 | ** | ** | ** | ** | ** | ** | ** | 5.66 | 2.61 | 0.00 | 2.91 | 7 |
| 8 | 3.46 | ** | ** | ** | ** | ** | ** | ** | 5.99 | 2.71 | 0.00 | 2.91 | 8 |
| 9 | 3.46 | ** | ** | ** | ** | ** | ** | ** | 10.16 | 6.50 | 0.00 | 2.91 | 9 |
| 10 | 3.46 | ** | ** | ** | ** | ** | ** | ** | 12.15 | 10.16 | 0.00 | 2.91 | 10 |
| 11 | 3.82 | ** | ** | ** | ** | ** | ** | ** | 9.93 | 8.61 | 0.00 | 3.02 | 11 |
| 12 | 3.70 | ** | ** | ** | ** | ** | ** | 2.71 | 8.61 | 7.60 | 0.00 | 3.12 | 12 |
| 13 | 3.46 | ** | ** | ** | ** | ** | ** | 5.20 | 6.15 | 6.67 | 0.00 | 3.18 | 13 |
| 14 | 3.35 | ** | ** | ** | ** | ** | ** | 5.99 | 4.90 | 6.50 | 0.00 | 3.23 | 14 |
| 15 | 4.07 | ** | ** | ** | ** | ** | ** | 5.82 | 4.47 | 7.22 | 0.00 | 3.12 | 15 |
| 16 | 4.07 | ** | ** | ** | ** | ** | ** | 6.50 | 0.00 | 6.85 | 0.00 | 3.18 | 16 |
| 17 | 4.07 | ** | ** | ** | ** | ** | ** | 7.22 | 0.00 | 8.20 | 0.00 | 3.23 | 17 |
| 18 | 4.20 | ** | ** | ** | ** | ** | ** | 8.82 | 0.00 | 3.95 | 0.00 | 3.12 | 18 |
| 19 | 4.47 | ** | ** | ** | ** | ** | ** | 9.93 | 9.04 | 1.67 | 0.00 | 2.71 | 19 |
| 20 | 3.02 | ** | ** | ** | ** | ** | ** | 11.13 | 9.93 | 0.00 | 3.54 | 2.71 | 20 |
| 21 | 0.33 | ** | ** | ** | ** | ** | ** | 15.26 | 8.20 | 0.00 | 3.54 | 2.71 | 21 |
| 22 | 0.25 | ** | ** | ** | ** | ** | ** | 13.51 | 7.60 | 0.00 | 3.44 | 2.66 | 22 |
| 23 | 0.22 | ** | ** | ** | ** | ** | ** | 9.70 | 7.41 | 0.00 | 3.22 | 2.52 | 23 |
| 24 | 0.04 | ** | ** | ** | ** | ** | ** | 7.60 | 7.60 | 0.00 | 3.44 | 2.16 | 24 |
| 25 | 0.00 | ** | ** | ** | ** | ** | ** | 6.33 | 7.60 | 0.00 | 3.33 | 2.42 | 25 |
| 26 | 0.00 | ** | ** | ** | ** | ** | ** | 6.67 | 7.04 | 0.00 | 3.12 | 2.61 | 26 |
| 27 | 0.00 | ** | ** | ** | ** | ** | ** | 7.04 | 4.75 | 0.00 | 2.91 | 2.06 | 27 |
| 28 | 0.02 | ** | ** | ** | ** | ** | ** | 6.50 | 3.70 | 0.00 | 2.62 | 1.86 | 28 |
| 29 | 0.07 | ** | ** | ** | ** | ** | 6.67 | 3.70 | 0.00 | 2.53 | 1.67 | 29 | |
| 30 | 0.61 | ** | ** | ** | ** | ** | 5.99 | 4.07 | 0.00 | 2.53 | 1.67 | 30 | |
| 31 | 0.61 | ** | ** | ** | 5.35 | 0.00 | 2.43 | 31 | |||||
| TOTAL | 77.54 | 1.99* | ** | ** | ** | ** | ** | 153.94* | 176.15 | 93.29 | 36.65 | 84.00 | |
| MEAN | 2.50 | .50* | ** | ** | ** | ** | ** | 7.70* | 5.87 | 3.01 | 1.18 | 2.80 | |
| AC-FT | 153.80 | 3.95* | ** | ** | ** | ** | ** | 305.34* | 349.39 | 185.04 | 72.69 | 166.61 | |
HARRY RAHM DITCH STATION NO. 007113.00 LATITUDE 42-59-51 LONGITUDE 109-58-39 NW1/4SW1/4 SECTION 25 TOWNSHIP 35 N,RANGE 110 W 6TH P.M. ELEVATION 7360.00 FT DRAINAGE AREA UNKNOWN NONCONTRIBUTING 0.00 SQ MI BASIN 15570800 SUBLETTE COUNTY DATA FROM WWRC (C) ****TO USE THIS DATA, SEE VIC HASFURTHER**** MEAN DAILY FLOW IN CFS BY WATER YEAR
| HARRY RAHM DITCH | STATION NO. 007113.00 |
| LATITUDE 42-59-51 LONGITUDE 109-58-39 | |
| NW1/4 SW1/4 SECTION 25 TOWNSHIP 35N, RANGE 110W 6TH P.M. | |
| ELEVATION 7360.00 FT DRAINAGE AREA UNKNOWN | |
| NONCONTRIBUTING 0.00 SQ MI BASIN 15570800 | |
| SUBLETTE COUNTY | |
| DATA FROM WWRC | |
| ***TO USE THIS DATA,SEE VIC HASFURTHER*** |
| MEAN DAILY FLOW IN CFS BY WATER YEAR | |||||||||||||
| 1988 | |||||||||||||
| DAY | OCT | NOV | DEC | JAN | FEB | MAR | APR | MAY | JUNE | JULY | AUG | SEPT | DAY |
| 1 | 1.59 | 3.35 | ** | ** | ** | ** | ** | ** | ** | ** | ** | ** | 1 |
| 2 | 1.51 | ** | ** | ** | ** | ** | ** | ** | ** | ** | ** | ** | 2 |
| 3 | 1.21 | ** | ** | ** | ** | ** | ** | ** | ** | ** | ** | ** | 3 |
| 4 | 2.16 | ** | ** | ** | ** | ** | ** | ** | ** | ** | ** | ** | 4 |
| 5 | 3.02 | ** | ** | ** | ** | ** | ** | ** | ** | ** | ** | ** | 5 |
| 6 | 2.81 | ** | ** | ** | ** | ** | ** | ** | ** | ** | ** | ** | 6 |
| 7 | 2.91 | ** | ** | ** | ** | ** | ** | ** | ** | ** | ** | ** | 7 |
| 8 | 3.70 | ** | ** | ** | ** | ** | ** | ** | ** | ** | ** | ** | 8 |
| 9 | 4.75 | ** | ** | ** | ** | ** | ** | ** | ** | ** | ** | ** | 9 |
| 10 | 5.20 | ** | ** | ** | ** | ** | ** | ** | ** | ** | ** | ** | 10 |
| 11 | 5.35 | ** | ** | ** | ** | ** | ** | ** | ** | ** | ** | ** | 11 |
| 12 | 4.61 | ** | ** | ** | ** | ** | ** | ** | ** | ** | ** | ** | 12 |
| 13 | 4.61 | ** | ** | ** | ** | ** | ** | ** | ** | ** | ** | ** | 13 |
| 14 | 4.75 | ** | ** | ** | ** | ** | ** | ** | ** | ** | ** | ** | 14 |
| 15 | 4.75 | ** | ** | ** | ** | ** | ** | ** | ** | ** | ** | ** | 15 |
| 16 | 4.75 | ** | ** | ** | ** | ** | ** | ** | ** | ** | ** | ** | 16 |
| 17 | 4.75 | ** | ** | ** | ** | ** | ** | ** | ** | ** | ** | ** | 17 |
| 18 | 4.75 | ** | ** | ** | ** | ** | ** | ** | ** | ** | ** | ** | 18 |
| 19 | 4.75 | ** | ** | ** | ** | ** | ** | ** | ** | ** | ** | ** | 19 |
| 20 | 4.75 | ** | ** | ** | ** | ** | ** | ** | ** | ** | ** | ** | 20 |
| 21 | 5.05 | ** | ** | ** | ** | ** | ** | ** | ** | ** | ** | ** | 21 |
| 22 | 5.12 | ** | ** | ** | ** | ** | ** | ** | ** | ** | ** | ** | 22 |
| 23 | 4.47 | ** | ** | ** | ** | ** | ** | ** | ** | ** | ** | ** | 23 |
| 24 | 4.47 | ** | ** | ** | ** | ** | ** | ** | ** | ** | ** | ** | 24 |
| 25 | 4.47 | ** | ** | ** | ** | ** | ** | ** | ** | ** | ** | ** | 25 |
| 26 | 4.41 | ** | ** | ** | ** | ** | ** | ** | ** | ** | ** | ** | 26 |
| 27 | 4.34 | ** | ** | ** | ** | ** | ** | ** | ** | ** | ** | ** | 27 |
| 28 | 4.41 | ** | ** | ** | ** | ** | ** | ** | ** | ** | ** | ** | 28 |
| 29 | 4.41 | ** | ** | ** | ** | ** | ** | ** | ** | ** | ** | ** | 29 |
| 30 | 4.07 | ** | ** | ** | ** | ** | ** | ** | ** | ** | ** | 30 | |
| 31 | 3.35 | ** | ** | ** | ** | ** | ** | 31 | |||||
| TOTAL | 125.25 | 3.35* | ** | ** | ** | ** | ** | ** | ** | ** | ** | ** | |
| MEAN | 4.04 | 3.35* | ** | ** | ** | ** | ** | ** | ** | ** | ** | ** | |
| AC-FT | 248.43 | 6.64* | ** | ** | ** | ** | ** | ** | ** | ** | ** | ** | |
Source: Wyoming Water Resources Data System, March 20, 2000
Highland Canal, Pine Creek
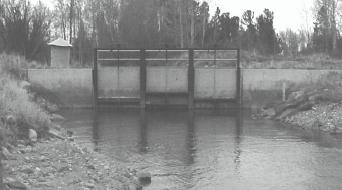 |
Diversion Description: Diversion consists of three 6' by 6' slide gates. The headgate is attached to the Fremont Lake Dam.1 |
| |
| Conveyance Description: Open Channel Canal, approximately 22 miles in length.1 |
Wyoming Water Rights Summary:
| Priority Date (M-D-Y) | Permit Number |
Permitted Use | Acres | Flow (cfs) |
Cumulative Flow (cfs) | Comments |
| 02-21-1908 | 8238 | Irrigation | 5,177.34 | 73.49 | 73.49 | |
| 08-10-1934 | 4944E | Domestic, Irrigation, Stock | 73.49 | 1,153.82 AF Secondary Supply from Fremont Lake Reservoir (4453R and 4465R) (335.00 acres served) | ||
| 01-12-1944 | 5361E | Irrigation, Stock | 232.22 | 3.32 | 76.81 | |
| 03-13-1950 | 5503E | Irrigation, Stock | 438.00 | 6.25 | 83.06 |
Storage Rights: Fremont Lake Reservoir.
Estimated Canal Losses: Considerable higher than typical (40%) losses are experienced in the higher reaches of the canal due to the porous nature of the soil. However, a majority of these losses are re-captured by the lower reaches of the canal.1
Irrigation Practices: Lands are flood irrigated.1
Crop Types / Consumptive Use: Less than 600 acres are alfalfa hay; remaining lands are native grass hay and pasture.1
Return Flows: Approximately 70% of the return flows are delivered to Pole Creek at Fall Creek, and 30% to West Fork New Fork River above Pole Creek.2
Other Operational Information: The canal is initially turned on in mid-April for stock water use. By approximately mid-May and lasting until mid-July, the canal experiences its highest flows. In mid-August (during haying), the canal is reduced again to stock-water flows. Typically, the canal is turned off by the first of November.1
|
Highland Canal, Pine Creek , Diversion Data
| Wateryear | May | June | July | August | September | |||||
| Average (cfs) | Monthly Total (AF) | Average (cfs) | Monthly Total (AF) | Average (cfs) | Monthly Total (AF) | Average (cfs) | Monthly Total (AF) | Average (cfs) | Monthly Total (AF) | |
| 1980 | 55.50 | 3,412.56 | 158.37 | 9,423.67 | 116.16 | 7,142.40 | 35.69 | 2,194.49 | 14.19 | 844.36 |
| 1981 | 40.29 | 2,477.34 | 163.81 | 9,747.37 | 103.93 | 6,390.41 | 38.85 | 2,388.79 | ||
| 1982 | 138.82 | 8,230.61 | 146.05 | 8,980.26 | 43.56 | 2,678.40 | 22.92 | 1,363.83 | ||
| 1983 | 175.85 | 10,463.80 | 131.47 | 8,083.78 | 50.97 | 3,134.02 | ||||
| 1984 | 120.34 | 7,160.73 | 80.46 | 4,947.29 | 20.22 | 1,243.28 | ||||
| 1985 | 67.66 | 4,160.25 | 167.55 | 9,969.92 | 110.06 | 6,767.33 | 23.03 | 1,416.06 | 30.83 | 1,843.51 |
| 1986 | 19.60 | 1,205.26 | 208.53 | 12,408.60 | 98.84 | 6,077.36 | 35.03 | 2,154.05 | 29.17 | 1,735.54 |
| 1987 | 169.53 | 10,087.74 | 63.54 | 3,906.92 | 29.72 | 1,827.41 | ||||
| 1988 | 62.64 | 3,851.31 | 195.53 | 11,635.04 | 87.03 | 5,351.40 | 28.81 | 1,771.24 | 16.85 | 1,002.84 |
| 1989 | 48.82 | 3,001.59 | 215.00 | 12,793.39 | 163.74 | 10,068.10 | 37.66 | 2,315.70 | 21.41 | 1,273.79 |
| 1990 | 73.97 | 4,548.10 | 191.57 | 11,399.01 | 160.65 | 9,877.69 | 37.65 | 2,314.71 | 41.53 | 2,471.40 |
| 1991 | 36.75 | 2,259.57 | 161.87 | 9,631.74 | 116.68 | 7,174.21 | 36.45 | 2,241.32 | 48.37 | 2,878.02 |
| 1992 | 122.26 | 7,517.36 | 177.63 | 10,569.92 | 100.19 | 6,160.66 | 39.45 | 2,425.79 | 34.73 | 2,066.78 |
| 1993 | 37.84 | 2,326.61 | 184.13 | 10,956.69 | 145.39 | 8,939.50 | 40.13 | 2,467.44 | 57.77 | 3,437.36 |
| 1994 | 128.28 | 7,887.91 | 212.77 | 12,660.50 | 111.19 | 6,837.02 | 24.61 | 1,513.39 | 21.70 | 1,291.24 |
| 1995 | 53.29 | 3,276.69 | 167.70 | 9,978.84 | 133.81 | 8,227.44 | 70.26 | 4,320.00 | 74.03 | 4,405.29 |
| 1996 | 65.67 | 4,037.89 | 227.34 | 13,527.67 | 132.77 | 8,163.71 | 54.04 | 3,322.79 | 35.51 | 2,112.99 |
| 1997 | 65.28 | 4,013.91 | 30.79 | 1,832.13 | 94.33 | 5,800.13 | 46.42 | 2,854.25 | 63.09 | 3,754.12 |
| 1998 | 71.24 | 4,380.38 | 150.43 | 8,951.21 | 141.83 | 8,720.79 | 36.83 | 2,264.59 | 46.44 | 2,763.37 |
| Averages: | 63.27 | 3,890.45 | 169.32 | 10,075.19 | 117.80 | 7,242.97 | 38.39 | 2,360.41 | 37.24 | 2,211.70 |
Data:
1980: 5/13, turned on; 5/14, 16 cfs; 5/16, 36 cfs; 5/20, 34 cfs; 5/21, 100 cfs; 5/24, 110 cfs; 5/27, 164 cfs; 6/4, 110 cfs; 6/9, 110 cfs; 6/10, 135 cfs; 6/11, 164 cfs; 6/13, 190 cfs; 6/17, 180 cfs; 6/24, 180 cfs; 6/26, 180 cfs; 6/30, 164 cfs; 7/3, 180 cfs; 7/7, 156 cfs; 7/14, 156 cfs; 7/21, 78 cfs; 7/25, 63 cfs; 7/29, 53 cfs; 8/1, 50 cfs; 8/4, 50 cfs; 8/7, 50 cfs; 8/11, 36 cfs; 8/13, 34 cfs; 8/20, 34 cfs; 9/4, 17 cfs; 9/17, 17 cfs; 9/26, 16 cfs.
1981: 5/14, 9 cfs; 5/18, 34 cfs; 5/28, 95 cfs; 6/1, 164 cfs; 6/9, 164 cfs; 6/15, 154 cfs; 6/18, 170 cfs; 6/26, 164 cfs; 7/8, 170 cfs; 7/15, 102 cfs; 7/21, 78 cfs; 7/23, 62 cfs; 7/24, 51 cfs; 7/30, 41 cfs; 8/6, 33 cfs; 8/11, 40 cfs; 8/26, 31 cfs.
1982: 5/24, 42 cfs; 5/25, 71 cfs; 5/28, 70 cfs; 6/2, 100 cfs; 6/7, 107 cfs; 6/9, 100 cfs; 6/14, 105 cfs; 6/17, 152 cfs; 6/22, 175 cfs; 6/24, 185 cfs; 6/28, 175 cfs; 6/30, 180 cfs; 7/6, 175 cfs; 7/14, 175 cfs; 7/19, 165 cfs; 8/2, 42 cfs; 8/29, 45 cfs; 9/6, 35 cfs; 9/20, 36 cfs.
1983: 5/24, 10 cfs (est); 5/31, 80 cfs; 6/6, 1 35 cfs; 6/13, 193 cfs; 6/22, 197 cfs; 6/30, 205 cfs; 7/5, 197 cfs; 7/11, 220 cfs; 7/19, 43 cfs; 7/27, 92 cfs; 8/19, 40 cfs; 9/6, 34 cfs.
1984: 5/21, off; 5/25, 18 cfs; 5/30, 81 cfs; 6/9, 105 cfs; 6/12, 95 cfs; 6/15, 99 cfs; 6/18, 115 cfs; 6/20, 142 cfs; 6/25, 162 cfs; 7/2, 141 cfs; 7/9, 130 cfs; 7/16, 95 cfs; 7/23, 23 cfs; 8/21, 20 cfs (est); 10/4, 10 cfs (est).
1985: 5/13, 42.4 cfs; 5/22, 37 cfs; 5/30, 169 cfs; 6/27, 135 cfs; 7/16, 90 cfs; 7/30, 45 cfs; 8/12, 20.5 cfs; 8/28, 10 cfs (est); 9/5, 17 cfs (est); 9/17, 16 cfs (est). (USGS figures used.)
1986: 6/28, 105 cfs. (USGS figures used.)
1987: 5/18, 153 cfs; 5/22, 174 cfs; 6/18, 181 cfs; 6/23, 164 cfs; 7/1, 132 cfs; 7/9, 79 cfs; 7/23, 36 cfs; 8/28, 33 cfs.
1993-1995: Data Recorder Installed. See attached sheets.
1996: 5/10, 10.0 cfs (est); 5/14, 25.0 cfs (est); 6/11, 287 cfs; 6/15, 216 cfs; 6/17, 220 cfs; 6/21, 204 cfs; 6/24, 220 cfs; 6/25, 220 cfs; 7/1, 204 cfs; 7/3, 235 cfs; 7/8, 185 cfs; 7/15, 167 cfs; 7/23, 61.8 cfs; 7/25, 60.6 cfs; 7/29, 49.1 cfs; 8/1, 42.8 cfs; 8/6, 42.8 cfs; 8/13, 42.8 cfs; 8/19, 78.6 cfs; 8/26, 60.6 cfs; 8/30, 45.8 cfs; 9/4, 60.6 cfs; 9/12, 42.8 cfs; 9/16, 42.8 cfs; 9/24, 35.2 cfs.
1997: 5/12, 45 cfs; 6/2, 163 cfs; 6/12, 270 cfs; 7/5, 122 cfs; 7/7, 126 cfs; 7/15, 118 cfs; 7/19, 97.2 cfs; 7/24, 44.5 cfs; 7/29, 46.4 cfs; 7/30, 51 cfs; 8/7, 44 cfs; 8/12, 44 cfs; 8/18, 45 cfs; 8/25, 44 cfs; 9/4, 65.6 cfs; 9/10, 65.6 cfs; 9/23, 65.6 cfs; 9/30, 65.6 cfs.
1998: Data Recorder Installed. (USGS figures used.)
Supply: 1980, below average; 1981, slightly below average; 1982, average (late peak); 1983, above average; 1984, above average; 1985, below average; 1986, average to slightly above average; 1988: very below average; 1989, below average; 1990, below average; 1991, slightly below average; 1992, below average; 1993, average; 1994, below average; 1995, average to above average; 1996, average; 1997, average; 1998, average to above average.
Source: State Engineer's Office, Annual Hydrographers' Reports.
| 1993 | |||||
|---|---|---|---|---|---|
| May | June | July | Aug. | Sept. | |
| 1 | 163.0 | 174.0 | 78.0 | 63.0 | |
| 2 | 186.0 | 175.0 | 78.0 | 63.0 | |
| 3 | 192.0 | 154.0 | 78.0 | 63.0 | |
| 4 | 192.0 | 124.0 | 78.0 | 63.0 | |
| 5 | 161.0 | 125.0 | 45.0 | 64.0 | |
| 6 | 145.0 | 125.0 | 35.0 | 63.0 | |
| 7 | 140.0 | 127.0 | 40.0 | 64.0 | |
| 8 | 130.0 | 126.0 | 40.0 | 64.0 | |
| 9 | 161.0 | 141.0 | 40.0 | 64.0 | |
| 10 | 182.0 | 174.0 | 38.0 | 64.0 | |
| 11 | 187.0 | 173.0 | 33.0 | 64.0 | |
| 12 | 192.0 | 172.0 | 28.0 | 65.0 | |
| 13 | 199.0 | 173.0 | 28.0 | 64.0 | |
| 14 | 201.0 | 173.0 | 28.0 | 65.0 | |
| 15 | 23.0 | 208.0 | 172.0 | 28.0 | 65.0 |
| 16 | 39.0 | 216.0 | 173.0 | 29.0 | 65.0 |
| 17 | 36.0 | 206.0 | 172.0 | 32.0 | 65.0 |
| 18 | 41.0 | 193.0 | 173.0 | 28.0 | 65.0 |
| 19 | 48.0 | 192.0 | 172.0 | 30.0 | 65.0 |
| 20 | 49.0 | 194.0 | 171.0 | 31.0 | 64.0 |
| 21 | 50.0 | 197.0 | 171.0 | 31.0 | 64.0 |
| 22 | 50.0 | 202.0 | 168.0 | 31.0 | 64.0 |
| 23 | 56.0 | 200.0 | 151.0 | 31.0 | 56.0 |
| 24 | 67.0 | 197.0 | 140.0 | 31.0 | 39.0 |
| 25 | 79.0 | 188.0 | 140.0 | 30.0 | 39.0 |
| 26 | 88.0 | 184.0 | 116.0 | 30.0 | 39.0 |
| 27 | 94.0 | 186.0 | 101.0 | 30.0 | 38.0 |
| 28 | 96.0 | 189.0 | 101.0 | 36.0 | 38.0 |
| 29 | 111.0 | 195.0 | 101.0 | 46.0 | 38.0 |
| 30 | 118.0 | 182.0 | 101.0 | 46.0 | 38.0 |
| 31 | 136.0 | 89.0 | 57.0 | ||
| CFS days | 1181.00 | 5560.00 | 4548.00 | 1244.00 | 1735.00 |
| Average (cfs) | 38.10 | 185.33 | 146.71 | 40.13 | 57.83 |
| 1994 | |||||
| May | June | July | Aug. | Sept. | |
| 1 | 0.4 | 247.0 | 186.0 | 29.0 | 24.0 |
| 2 | 0.4 | 245.0 | 183.0 | 27.0 | 24.0 |
| 3 | 23.0 | 240.0 | 181.0 | 23.0 | 23.0 |
| 4 | 48.0 | 237.0 | 178.0 | 23.0 | 23.0 |
| 5 | 49.0 | 242.0 | 175.0 | 23.0 | 23.0 |
| 6 | 52.0 | 245.0 | 172.0 | 23.0 | 23.0 |
| 7 | 48.0 | 248.0 | 169.0 | 23.0 | 22.0 |
| 8 | 66.0 | 248.0 | 166.0 | 23.0 | 22.0 |
| 9 | 80.0 | 242.0 | 163.0 | 23.0 | 22.0 |
| 10 | 81.0 | 236.0 | 160.0 | 22.0 | 22.0 |
| 11 | 83.0 | 231.0 | 161.0 | 22.0 | 22.0 |
| 12 | 86.0 | 227.0 | 178.0 | 22.0 | 21.0 |
| 13 | 89.0 | 227.0 | 169.0 | 22.0 | 21.0 |
| 14 | 94.0 | 229.0 | 141.0 | 22.0 | 22.0 |
| 15 | 96.0 | 226.0 | 138.0 | 22.0 | 22.0 |
| 16 | 117.0 | 202.0 | 136.0 | 22.0 | 21.0 |
| 17 | 129.0 | 201.0 | 77.0 | 20.0 | 21.0 |
| 18 | 138.0 | 199.0 | 55.0 | 35.0 | 21.0 |
| 19 | 155.0 | 198.0 | 70.0 | 35.0 | 21.0 |
| 20 | 154.0 | 199.0 | 69.0 | 35.0 | 21.0 |
| 21 | 167.0 | 201.0 | 68.0 | 35.0 | 21.0 |
| 22 | 180.0 | 203.0 | 68.0 | 24.0 | 21.0 |
| 23 | 194.0 | 209.0 | 67.0 | 15.0 | 21.0 |
| 24 | 204.0 | 193.0 | 67.0 | 21.0 | 21.0 |
| 25 | 206.0 | 164.0 | 66.0 | 25.0 | 21.0 |
| 26 | 212.0 | 163.0 | 38.0 | 25.0 | 21.0 |
| 27 | 237.0 | 162.0 | 30.0 | 25.0 | 21.0 |
| 28 | 248.0 | 161.0 | 29.0 | 25.0 | 21.0 |
| 29 | 244.0 | 170.0 | 29.0 | 24.0 | 21.0 |
| 30 | 242.0 | 188.0 | 29.0 | 24.0 | 21.0 |
| 31 | 244.0 | 29.0 | 24.0 | ||
| CFS days | 3966.80 | 6383.00 | 3447.00 | 763.00 | 651.00 |
| Average (cfs) | 127.96 | 212.77 | 111.19 | 24.61 | 21.70 |
| 1995 | |||||
| May | June | July | Aug. | Sept. | |
| 1 | 16 | 83 | 220 | 69 | 72 |
| 2 | 15 | 97 | 215 | 69 | 87 |
| 3 | 15 | 107 | 195 | 69 | 90 |
| 4 | 33 | 119 | 185 | 69 | 89 |
| 5 | 43 | 133 | 183 | 70 | 89 |
| 6 | 43 | 150 | 181 | 70 | 88 |
| 7 | 42 | 146 | 182 | 71 | 88 |
| 8 | 39 | 148 | 186 | 71 | 78 |
| 9 | 39 | 154 | 193 | 71 | 58 |
| 10 | 39 | 150 | 197 | 71 | 41 |
| 11 | 39 | 146 | 199 | 71 | 58 |
| 12 | 39 | 141 | 195 | 71 | 78 |
| 13 | 39 | 150 | 153 | 71 | 78 |
| 14 | 38 | 167 | 129 | 72 | 77 |
| 15 | 37 | 173 | 145 | 63 | 77 |
| 16 | 37 | 170 | 159 | 72 | 76 |
| 17 | 46 | 179 | 150 | 72 | 75 |
| 18 | 66 | 178 | 140 | 72 | 75 |
| 19 | 78 | 176 | 117 | 71 | 75 |
| 20 | 77 | 179 | 92 | 71 | 74 |
| 21 | 76 | 179 | 72 | 71 | 73 |
| 22 | 76 | 181 | 45 | 71 | 73 |
| 23 | 77 | 185 | 57 | 71 | 72 |
| 24 | 75 | 189 | 67 | 71 | 71 |
| 25 | 74 | 210 | 66 | 70 | 70 |
| 26 | 77 | 221 | 71 | 70 | 69 |
| 27 | 79 | 230 | 71 | 70 | 69 |
| 28 | 77 | 227 | 71 | 70 | 68 |
| 29 | 76 | 229 | 71 | 70 | 67 |
| 30 | 73 | 234 | 71 | 69 | 66 |
| 31 | 72 | 70 | 69 | ||
| CFS days | 1652.00 | 5031.00 | 4148.00 | 2178.00 | 2221.00 |
| Average (cfs) | 53.29 | 167.70 | 133.81 | 70.26 | 74.03 |
| 1998 | |||||
| May | June | July | Aug. | Sept. | |
| 1 | 45.8 | 145 | 200 | 39.8 | 49.6 |
| 2 | 46.3 | 151 | 209 | 39.3 | 49.6 |
| 3 | 46.8 | 157 | 209 | 38.7 | 49.6 |
| 4 | 47.4 | 149 | 209 | 38.2 | 49.0 |
| 5 | 47.9 | 153 | 209 | 37.7 | 48.5 |
| 6 | 48.5 | 153 | 209 | 37.3 | 47.9 |
| 7 | 49.6 | 148 | 209 | 36.3 | 47.4 |
| 8 | 55.7 | 146 | 181 | 36.3 | 46.8 |
| 9 | 59.5 | 142 | 167 | 35.9 | 46.3 |
| 10 | 65.5 | 139 | 149 | 36.3 | 45.8 |
| 11 | 71.6 | 140 | 124 | 35.9 | 45.8 |
| 12 | 72.8 | 145 | 110 | 35.9 | 45.2 |
| 13 | 71.6 | 151 | 110 | 35.9 | 44.7 |
| 14 | 71.6 | 157 | 153 | 35.9 | 47.9 |
| 15 | 72.2 | 160 | 173 | 35.9 | 55.1 |
| 16 | 71.6 | 164 | 172 | 35.9 | 54.6 |
| 17 | 70.4 | 155 | 162 | 35.4 | 52.4 |
| 18 | 71.0 | 146 | 157 | 35.4 | 52.4 |
| 19 | 70.4 | 142 | 156 | 35.4 | 54.6 |
| 20 | 69.2 | 145 | 156 | 34.4 | 54.0 |
| 21 | 67.9 | 146 | 154 | 34.0 | 53.5 |
| 22 | 68.5 | 147 | 152 | 34.4 | 48.5 |
| 23 | 68.5 | 157 | 152 | 34.0 | 43.6 |
| 24 | 67.9 | 165 | 73.4 | 33.5 | 43.1 |
| 25 | 67.9 | 158 | 49.0 | 25.3 | 43.1 |
| 26 | 67.3 | 148 | 65.5 | 24.6 | 39.3 |
| 27 | 74.1 | 148 | 71.6 | 24.2 | 34.4 |
| 28 | 106 | 152 | 71.0 | 50.1 | 34.0 |
| 29 | 120 | 152 | 69.8 | 50.1 | 33.5 |
| 30 | 135 | 152 | 63.1 | 50.1 | 33.0 |
| 31 | 140 | 51.2 | 49.6 | ||
| CFS days | 2208.50 | 4513.00 | 4396.60 | 1141.70 | 1393.20 |
| Average (cfs) | 71.24 | 150.43 | 141.83 | 36.83 | 46.44 |
High Line Ditch, Lake Creek
Diversion Description: Diversion consists of a single 24" slide gate.1
Conveyance Description: Open Channel Canal, approximately 8 miles in length.1
Wyoming Water Rights Summary:
| Priority Date (M-D-Y) | Permit Number |
Permitted Use | Acres | Flow (cfs) |
Cumulative Flow (cfs) | Comments |
| 07-29-1910 | 10038 | Domestic, Irrigation, Stock | 332.00 | 4.75 | 4.75 | |
| 10-21-1912 | 2710E | Domestic, Irrigation | 785.00 | 11.20 | 15.95 | |
| 09-10-1930 | 4712E | Irrigation | 261.00 | 3.72 | 19.67 |
Storage Rights: None.
Estimated Canal Losses: Information not available at time of report.
Irrigation Practices: Information not available at time of report.
Crop Types / Consumptive Use: Information not available at time of report.
Return Flows: Return flows are delivered to West Fork New Fork River at Willow Creek.2
Other Operational Information: Information not available at time of report.
|
High Line Ditch, Lake Creek, Diversion Data
Data:
1993: 6/23, 58.00 cfs.
1994: 6/18, 44.00 cfs.
Supply: 1980, below average; 1981, slightly below average; 1982, average (late peak); 1983, above average; 1984, above average; 1985, below average; 1986, average to slightly above average; 1988: very below average; 1989, below average; 1990, below average; 1991, slightly below average; 1992, below average; 1993, average; 1994, below average; 1995, average to above average; 1996, average; 1997, average; 1998, average to above average.
Source: State Engineer's Office, Annual Hydrographers' Reports.
Jenkins Ditch, West Fork New Fork River
Diversion Description: Diversion consists of a wood stop log headgate.1
Conveyance Description: Open Channel Canal, approximately 3 miles in length.1
Wyoming Water Rights Summary:
| Priority Date (M-D-Y) | Permit Number |
Permitted Use | Acres | Flow (cfs) |
Cumulative Flow (cfs) | Comments |
| 11-11-1903 | 5855 | Irrigation | 41.70 AF Secondary Supply stored in New Fork Lake Reservoir (480Res) (30.00 acres served) | |||
| 11-11-1903 | 4859E | Irrigation | 313.03 AF Secondary Supply stored in New Fork Lake Reservoir (480Res) (225.20 acres served) | |||
| 11-11-1903 | 5515E | Irrigation | 854.85 AF Secondary Supply stored in New Fork Lake Reservoir (480Res) (615.00 acres served) | |||
| 02-06-1911 | 12239 | Domestic, Irrigation | 1550.00 | 22.14 | 22.14 | |
| 06-11-1929 | 4829E | Irrigation | 188.50 | 2.68 | 24.82 | |
| 11-10-1953 | 5701E | Irrigation, Stock | 200.00 | 2.85 | 27.67 |
Storage Rights: New Fork Lake Reservoir.
Estimated Canal Losses: Information not available at time of report.
Irrigation Practices: Information not available at time of report.
Crop Types / Consumptive Use: Information not available at time of report.
Return Flows: Return flows are delivered to Duck Creek at Kitchen and Sunset Reservoir.2
Other Operational Information: Information not available at time of report.
|
Jenkins Ditch, West Fork New Fork River, Diversion Data
| Wateryear | May | June | July | August | September | |||||
| Average (cfs) | Monthly Total (AF) | Average (cfs) | Monthly Total (AF) | Average (cfs) | Monthly Total (AF) | Average (cfs) | Monthly Total (AF) | Average (cfs) | Monthly Total (AF) | |
| 1980 | ||||||||||
| 1981 | ||||||||||
| 1982 | ||||||||||
| 1983 | ||||||||||
| 1984 | 0.41 | 25.15 | 23.78 | 1,414.99 | 22.63 | 1,391.25 | 1.62 | 99.65 | 2.45 | 146.08 |
| 1985 | 22.13 | 1,317.02 | 12.08 | 742.87 | 1.36 | 83.83 | 5.50 | 326.98 | ||
| 1986 | 21.94 | 1,305.42 | 13.69 | 841.49 | 0.18 | 10.89 | ||||
| 1987 | 8.00 | 491.98 | 18.10 | 1,077.30 | 9.69 | 595.68 | 0.59 | 36.44 | 1.34 | 79.60 |
| 1988 | 0.93 | 56.99 | ||||||||
| 1989 | ||||||||||
| 1990 | 2.27 | 139.58 | 2.22 | 132.10 | 1.60 | 98.38 | ||||
| 1991 | ||||||||||
| 1992 | ||||||||||
| 1993 | ||||||||||
| 1994 | ||||||||||
| 1995 | ||||||||||
| 1996 | ||||||||||
| 1997 | ||||||||||
| 1998 | ||||||||||
| Averages: | 2.90 | 178.42 | 17.64 | 1,049.37 | 11.94 | 733.93 | 0.94 | 57.70 | 3.10 | 184.22 |
Data:
1990: 5/15, 5.5 cfs; 6/7, 1.8 cfs (est); 7/18, 3.2 cfs.
Supply: 1980, below average; 1981, slightly below average; 1982, average (late peak); 1983, above average; 1984, above average; 1985, below average; 1986, average to slightly above average; 1988: very below average; 1989, below average; 1990, below average; 1991, slightly below average; 1992, below average; 1993, average; 1994, below average; 1995, average to above average; 1996, average; 1997, average; 1998, average to above average.
Source: State Engineer's Office, Annual Hydrographers' Reports.
| JENKINS DITCH | STATION NO. 0077105.00 |
| LATITUDE 42-59-51 LONGITUDE 109-58-39 | |
| SE1/4NE1/4 SECTION 20 TOWNSHIP 35 N, RANGE 110 W 6TH P.M. | |
| ELEVATION 7485.00 FT DRAINAGE AREA UNKNOWN | |
| NONCONTRIBUTING 0.00 SQ MI BASIN 15570000 | |
| SUBLETTE COUNTY DATA FROM WWRC (C) | |
| ***TO USE THIS DATA, SEE VIC HASFURTHER*** |
| MEAN DAILY FLOW IN CFS BY WATER YEAR | |||||||||||||
| 1984 | |||||||||||||
| DAY | OCT | NOV | DEC | JAN | FEB | MAR | APR | MAY | JUNE | JULY | AUG | SEPT | DAY |
| 1 | ** | ** | ** | ** | ** | ** | ** | ** | 5.87 | 30.20 | 2.52 | 0.72 | 1 |
| 2 | ** | ** | ** | ** | ** | ** | ** | ** | 8.62 | 30.20 | 1.43 | 0.19 | 2 |
| 3 | ** | ** | ** | ** | ** | ** | ** | ** | 18.60 | 30.20 | 0.78 | 0.09 | 3 |
| 4 | ** | ** | ** | ** | ** | ** | ** | ** | 24.20 | 30.50 | 0.27 | 0.09 | 4 |
| 5 | ** | ** | ** | ** | ** | ** | ** | ** | 23.80 | 31.00 | 1.63 | 0.11 | 5 |
| 6 | ** | ** | ** | ** | ** | ** | ** | ** | 25.80 | 31.00 | 0.94 | 5.44 | 6 |
| 7 | ** | ** | ** | ** | ** | ** | ** | ** | 25.20 | 31.30 | 0.30 | 4.54 | 7 |
| 8 | ** | ** | ** | ** | ** | ** | ** | ** | 24.50 | 31.50 | 0.11 | 3.46 | 8 |
| 9 | ** | ** | ** | ** | ** | ** | ** | ** | 24.20 | 31.50 | 0.65 | 1.91 | 9 |
| 10 | ** | ** | ** | ** | ** | ** | ** | ** | 24.70 | 31.80 | 1.20 | 1.63 | 10 |
| 11 | ** | ** | ** | ** | ** | ** | ** | ** | 25.20 | 33.10 | 1.74 | 1.53 | 11 |
| 12 | ** | ** | ** | ** | ** | ** | ** | ** | 24.00 | 32.00 | 2.29 | 1.43 | 12 |
| 13 | ** | ** | ** | ** | ** | ** | ** | ** | 23.60 | 29.20 | 2.83 | 0.78 | 13 |
| 14 | ** | ** | ** | ** | ** | ** | ** | ** | 23.40 | 29.00 | 2.83 | 0.49 | 14 |
| 15 | ** | ** | ** | ** | ** | ** | ** | 0.00 | 23.80 | 29.20 | 1.68 | 0.20 | 15 |
| 16 | ** | ** | ** | ** | ** | ** | ** | 0.00 | 26.10 | 28.20 | 0.26 | 1.43 | 16 |
| 17 | ** | ** | ** | ** | ** | ** | ** | 0.00 | 25.60 | 28.20 | 0.12 | 5.04 | 17 |
| 18 | ** | ** | ** | ** | ** | ** | ** | 0.00 | 25.20 | 28.50 | 0.11 | 4.66 | 18 |
| 19 | ** | ** | ** | ** | ** | ** | ** | 0.00 | 23.80 | 27.00 | 0.98 | 4.54 | 19 |
| 20 | ** | ** | ** | ** | ** | ** | ** | 0.00 | 23.80 | 25.40 | 1.12 | 4.66 | 20 |
| 21 | ** | ** | ** | ** | ** | ** | ** | 0.00 | 24.00 | 25.60 | 0.36 | 4.66 | 21 |
| 22 | ** | ** | ** | ** | ** | ** | ** | 0.00 | 25.40 | 25.80 | 0.09 | 3.46 | 22 |
| 23 | ** | ** | ** | ** | ** | ** | ** | 0.00 | 25.40 | 24.50 | 0.09 | 3.86 | 23 |
| 24 | ** | ** | ** | ** | ** | ** | ** | 0.00 | 25.40 | 16.20 | 3.27 | 3.36 | 24 |
| 25 | ** | ** | ** | ** | ** | ** | ** | 0.00 | 25.40 | 2.67 | 3.00 | 3.00 | 25 |
| 26 | ** | ** | ** | ** | ** | ** | ** | 0.00 | 25.40 | 2.35 | 3.00 | 3.00 | 26 |
| 27 | ** | ** | ** | ** | ** | ** | ** | 0.00 | 25.80 | 1.43 | 5.04 | 2.60 | 27 |
| 28 | ** | ** | ** | ** | ** | ** | ** | 2.52 | 28.20 | 1.80 | 3.56 | 2.37 | 28 |
| 29 | ** | ** | ** | ** | ** | ** | ** | 2.52 | 28.70 | 1.09 | 3.27 | 2.23 | 29 |
| 30 | ** | ** | ** | ** | ** | ** | 3.56 | 29.70 | 0.49 | 2.67 | 2.17 | 30 | |
| 31 | ** | ** | ** | ** | 4.08 | 0.49 | 2.10 | 31 | |||||
| TOTAL | ** | ** | ** | ** | ** | ** | ** | 12.68* | 713.39 | 701.42 | 50.24 | 73.65 | |
| MEAN | ** | ** | ** | ** | ** | ** | ** | .75* | 23.78 | 22.63 | 1.62 | 2.46 | |
| AC-FT | ** | ** | ** | ** | ** | ** | ** | 25.15* | 1414.99 | 1391.25 | 99.65 | 146.08 | |
| JENKINS DITCH | STATION NO. 0077105.00 |
| LATITUDE 42-59-51 LONGITUDE 109-58-39 | |
| SE1/4NE1/4 SECTION 20 TOWNSHIP 35 N, RANGE 110 W 6TH P.M. | |
| ELEVATION 7485.00 FT DRAINAGE AREA UNKNOWN | |
| NONCONTRIBUTING 0.00 SQ MI BASIN 15570000 | |
| SUBLETTE COUNTY DATA FROM WWRC (C) | |
| ***TO USE THIS DATA, SEE VIC HASFURTHER*** |
| MEAN DAILY FLOW IN CFS BY WATER YEAR | |||||||||||||
| 1985 | |||||||||||||
| DAY | OCT | NOV | DEC | JAN | FEB | MAR | APR | MAY | JUNE | JULY | AUG | SEPT | DAY |
| 1 | 1.91 | ** | ** | ** | ** | ** | ** | ** | 13.19 | 1.47 | 0.85 | 6.14 | 1 |
| 2 | 1.91 | ** | ** | ** | ** | ** | ** | ** | 18.18 | 4.58 | 1.13 | 3.88 | 2 |
| 3 | 1.63 | ** | ** | ** | ** | ** | ** | ** | 23.47 | 12.22 | 2.99 | 1.80 | 3 |
| 4 | 1.48 | ** | ** | ** | ** | ** | ** | ** | 21.61 | 25.68 | 4.86 | 1.92 | 4 |
| 5 | 1.38 | ** | ** | ** | ** | ** | ** | ** | 22.07 | 26.97 | 0.45 | 2.32 | 5 |
| 6 | 1.29 | ** | ** | ** | ** | ** | ** | ** | 24.44 | 25.68 | 0.31 | 0.45 | 6 |
| 7 | 1.21 | ** | ** | ** | ** | ** | ** | ** | 25.94 | 24.69 | 0.08 | 0.22 | 7 |
| 8 | 1.05 | ** | ** | ** | ** | ** | ** | ** | 25.94 | 25.94 | 0.14 | 0.26 | 8 |
| 9 | 0.98 | ** | ** | ** | ** | ** | ** | ** | 26.71 | 23.95 | 0.33 | 0.22 | 9 |
| 10 | 1.01 | ** | ** | ** | ** | ** | ** | ** | 25.68 | 23.24 | 1.13 | 0.13 | 10 |
| 11 | 1.01 | ** | ** | ** | ** | ** | ** | ** | 23.24 | 22.30 | 1.38 | 0.64 | 11 |
| 12 | 1.05 | ** | ** | ** | ** | ** | ** | ** | 23.24 | 22.53 | 0.64 | 6.51 | 12 |
| 13 | 1.01 | ** | ** | ** | ** | ** | ** | ** | 23.95 | 22.07 | 0.38 | 3.00 | 13 |
| 14 | 1.01 | ** | ** | ** | ** | ** | ** | ** | 24.20 | 22.30 | 0.38 | 2.48 | 14 |
| 15 | 1.01 | ** | ** | ** | ** | ** | ** | ** | 24.20 | 22.07 | 0.38 | 2.48 | 15 |
| 16 | 1.01 | ** | ** | ** | ** | ** | ** | ** | 24.20 | 22.07 | 0.12 | 3.82 | 16 |
| 17 | 2.83 | ** | ** | ** | ** | ** | ** | ** | 26.97 | 21.61 | 0.00 | 0.00 | 17 |
| 18 | 2.92 | ** | ** | ** | ** | ** | ** | ** | 24.44 | 4.86 | 0.00 | 0.00 | 18 |
| 19 | 3.09 | ** | ** | ** | ** | ** | ** | ** | 24.93 | 1.13 | 0.52 | 11.29 | 19 |
| 20 | 3.46 | ** | ** | ** | ** | ** | ** | ** | 25.43 | 0.56 | 0.00 | 16.61 | 20 |
| 21 | 3.76 | ** | ** | ** | ** | ** | ** | 2.48 | 25.68 | 0.26 | 0.00 | 14.16 | 21 |
| 22 | 3.76 | ** | ** | ** | ** | ** | ** | 2.48 | 26.19 | 9.67 | 0.00 | 11.14 | 22 |
| 23 | 3.86 | ** | ** | ** | ** | ** | ** | 2.48 | 26.45 | 0.33 | 0.00 | 11.29 | 23 |
| 24 | 3.86 | ** | ** | ** | ** | ** | ** | 3.82 | 26.97 | 1.47 | 0.00 | 11.29 | 24 |
| 25 | 3.76 | ** | ** | ** | ** | ** | ** | 11.75 | 21.84 | 0.56 | 0.00 | 11.29 | 25 |
| 26 | 3.76 | ** | ** | ** | ** | ** | ** | 11.60 | 23.47 | 0.92 | 0.00 | 10.80 | 26 |
| 27 | ** | ** | ** | ** | ** | ** | ** | 11.44 | 23.00 | 0.92 | 0.00 | 8.17 | 27 |
| 28 | ** | ** | ** | ** | ** | ** | ** | 11.29 | 15.65 | 0.92 | 0.08 | 8.17 | 28 |
| 29 | ** | ** | ** | ** | ** | ** | 11.29 | 1.80 | 1.13 | 10.80 | 7.72 | 29 | |
| 30 | ** | ** | ** | ** | ** | ** | 13.36 | 0.92 | 1.38 | 8.17 | 6.65 | 30 | |
| 31 | ** | ** | ** | ** | 13.03 | 1.05 | 6.89 | 31 | |||||
| TOTAL | 55.01* | ** | ** | ** | ** | ** | ** | 95.02* | 664.00 | 374.53 | 42.01 | 164.85 | |
| MEAN | 2.12* | ** | ** | ** | ** | ** | ** | 8.64* | 22.13 | 12.08 | 1.36 | 5.50 | |
| AC-FT | 109.11* | ** | ** | ** | ** | ** | ** | 188.47* | 1317.02 | 742.87 | 83.33 | 326.98 | |
| JENKINS DITCH | STATION NO. 0077105.00 |
| LATITUDE 42-59-51 LONGITUDE 109-58-39 | |
| SE1/4NE1/4 SECTION 20 TOWNSHIP 35 N, RANGE 110 W 6TH P.M. | |
| ELEVATION 7485.00 FT DRAINAGE AREA UNKNOWN | |
| NONCONTRIBUTING 0.00 SQ MI BASIN 15570000 | |
| SUBLETTE COUNTY DATA FROM WWRC (C) | |
| ***TO USE THIS DATA, SEE VIC HASFURTHER*** |
| MEAN DAILY FLOW IN CFS BY WATER YEAR | |||||||||||||
| 1986 | |||||||||||||
| DAY | OCT | NOV | DEC | JAN | FEB | MAR | APR | MAY | JUNE | JULY | AUG | SEPT | DAY |
| 1 | 7.72 | 0.22 | ** | ** | ** | ** | ** | ** | 13.29 | 31.37 | 0.95 | ** | 1 |
| 2 | 2.48 | 0.18 | ** | ** | ** | ** | ** | ** | 14.04 | 31.04 | 1.02 | ** | 2 |
| 3 | 0.48 | 0.13 | ** | ** | ** | ** | ** | ** | 14.04 | 31.37 | 1.16 | ** | 3 |
| 4 | 0.02 | ** | ** | ** | ** | ** | ** | ** | 13.66 | 32.69 | 0.32 | ** | 4 |
| 5 | 0.02 | ** | ** | ** | ** | ** | ** | ** | 14.04 | 29.45 | 0.19 | ** | 5 |
| 6 | 0.06 | ** | ** | ** | ** | ** | ** | ** | 14.62 | 19.35 | 0.08 | ** | 6 |
| 7 | 2.48 | ** | ** | ** | ** | ** | ** | ** | 17.97 | 19.59 | 0.08 | ** | 7 |
| 8 | 1.21 | ** | ** | ** | ** | ** | ** | ** | 17.31 | 19.83 | 0.07 | ** | 8 |
| 9 | 0.64 | ** | ** | ** | ** | ** | ** | ** | 16.87 | 19.59 | 0.60 | ** | 9 |
| 10 | 0.04 | ** | ** | ** | ** | ** | ** | ** | 19.83 | 19.35 | 0.15 | ** | 10 |
| 11 | 0.02 | ** | ** | ** | ** | ** | ** | ** | 18.20 | 18.65 | 0.10 | ** | 11 |
| 12 | 0.19 | ** | ** | ** | ** | ** | ** | ** | 24.46 | 18.43 | 0.05 | ** | 12 |
| 13 | 5.15 | ** | ** | ** | ** | ** | ** | ** | 24.74 | 18.43 | 0.05 | ** | 13 |
| 14 | 1.21 | ** | ** | ** | ** | ** | ** | ** | 25.86 | 18.43 | 0.05 | ** | 14 |
| 15 | 0.48 | ** | ** | ** | ** | ** | ** | ** | 24.46 | 18.43 | 0.37 | ** | 15 |
| 16 | 0.06 | ** | ** | ** | ** | ** | ** | ** | 24.19 | 17.31 | 0.14 | ** | 16 |
| 17 | 0.01 | ** | ** | ** | ** | ** | ** | ** | 23.64 | 17.31 | 0.06 | ** | 17 |
| 18 | 0.01 | ** | ** | ** | ** | ** | ** | ** | 23.64 | 17.09 | 0.05 | ** | 18 |
| 19 | 0.01 | ** | ** | ** | ** | ** | ** | ** | 23.11 | 13.11 | ** | ** | 19 |
| 20 | 0.11 | ** | ** | ** | ** | ** | ** | ** | 23.37 | 5.42 | ** | ** | 20 |
| 21 | 1.58 | ** | ** | ** | ** | ** | ** | ** | 25.58 | 3.08 | ** | ** | 21 |
| 22 | 0.60 | ** | ** | ** | ** | ** | ** | ** | 25.30 | 1.02 | ** | ** | 22 |
| 23 | 0.48 | ** | ** | ** | ** | ** | ** | ** | 26.15 | 1.09 | ** | ** | 23 |
| 24 | 0.18 | ** | ** | ** | ** | ** | ** | 0.56 | 27.03 | 0.64 | ** | ** | 24 |
| 25 | 0.02 | ** | ** | ** | ** | ** | ** | 0.36 | 27.32 | 0.45 | ** | ** | 25 |
| 26 | 0.01 | ** | ** | ** | ** | ** | ** | 0.27 | 26.73 | 0.42 | ** | ** | 26 |
| 27 | 0.01 | ** | ** | ** | ** | ** | ** | 0.68 | 27.03 | 0.39 | ** | ** | 27 |
| 28 | 0.45 | ** | ** | ** | ** | ** | ** | 1.32 | 27.32 | 0.25 | ** | ** | 28 |
| 29 | 2.32 | ** | ** | ** | ** | ** | 3.46 | 27.03 | 0.22 | ** | ** | 29 | |
| 30 | 0.85 | ** | ** | ** | ** | ** | 3.66 | 27.32 | 0.16 | ** | ** | 30 | |
| 31 | 0.48 | ** | ** | ** | 12.93 | 0.29 | ** | 31 | |||||
| TOTAL | 29.38 | .53* | ** | ** | ** | ** | ** | 23.24* | 658.15 | 424.25 | 5.49* | ** | |
| MEAN | 0.95 | .18* | ** | ** | ** | ** | ** | 2.91* | 21.94 | 13.69 | .31* | ** | |
| AC-FT | 58.27 | 1.05* | ** | ** | ** | ** | ** | 46.10* | 1305.42 | 841.49 | 10.89* | ** | |
| JENKINS DITCH | STATION NO. 0077105.00 |
| LATITUDE 42-59-51 LONGITUDE 109-58-39 | |
| SE1/4NE1/4 SECTION 20 TOWNSHIP 35 N, RANGE 110 W 6TH P.M. | |
| ELEVATION 7485.00 FT DRAINAGE AREA UNKNOWN | |
| NONCONTRIBUTING 0.00 SQ MI BASIN 15570000 | |
| SUBLETTE COUNTY DATA FROM WWRC (C) | |
| ***TO USE THIS DATA, SEE VIC HASFURTHER*** |
| MEAN DAILY FLOW IN CFS BY WATER YEAR | |||||||||||||
| 1987 | |||||||||||||
| DAY | OCT | NOV | DEC | JAN | FEB | MAR | APR | MAY | JUNE | JULY | AUG | SEPT | DAY |
| 1 | ** | ** | ** | ** | ** | ** | ** | ** | 18.05 | 19.42 | 2.96 | 0.01 | 1 |
| 2 | ** | ** | ** | ** | ** | ** | ** | ** | 17.38 | 19.42 | 2.60 | 0.29 | 2 |
| 3 | ** | ** | ** | ** | ** | ** | ** | ** | 17.16 | 3.52 | 0.46 | 1.98 | 3 |
| 4 | ** | ** | ** | ** | ** | ** | ** | ** | 17.16 | 1.13 | 0.38 | 1.98 | 4 |
| 5 | ** | ** | ** | ** | ** | ** | ** | ** | 17.16 | 0.63 | 0.42 | 1.98 | 5 |
| 6 | ** | ** | ** | ** | ** | ** | ** | ** | 17.16 | 0.42 | 0.52 | 1.87 | 6 |
| 7 | ** | ** | ** | ** | ** | ** | ** | ** | 17.38 | 19.19 | 0.50 | 1.77 | 7 |
| 8 | ** | ** | ** | ** | ** | ** | ** | ** | 17.82 | 21.08 | 0.52 | 1.66 | 8 |
| 9 | ** | ** | ** | ** | ** | ** | ** | ** | 19.42 | 19.42 | 0.46 | 1.66 | 9 |
| 10 | ** | ** | ** | ** | ** | ** | ** | ** | 19.42 | 20.84 | 0.42 | 1.66 | 10 |
| 11 | ** | ** | ** | ** | ** | ** | ** | ** | 18.50 | 20.12 | 0.52 | 1.51 | 11 |
| 12 | ** | ** | ** | ** | ** | ** | ** | ** | 18.50 | 19.89 | 0.32 | 1.29 | 12 |
| 13 | ** | ** | ** | ** | ** | ** | ** | 3.52 | 18.50 | 19.89 | 0.99 | 1.29 | 13 |
| 14 | ** | ** | ** | ** | ** | ** | ** | 9.02 | 18.50 | 19.19 | 0.50 | 1.29 | 14 |
| 15 | ** | ** | ** | ** | ** | ** | ** | 14.61 | 16.94 | 19.19 | 0.99 | 1.29 | 15 |
| 16 | ** | ** | ** | ** | ** | ** | ** | 4.66 | 3.36 | 18.96 | 0.00 | 1.29 | 16 |
| 17 | ** | ** | ** | ** | ** | ** | ** | 4.87 | 1.98 | 19.19 | 0.00 | 1.29 | 17 |
| 18 | ** | ** | ** | ** | ** | ** | ** | 5.31 | 25.60 | 17.82 | 0.20 | 1.29 | 18 |
| 19 | ** | ** | ** | ** | ** | ** | ** | 7.10 | 23.04 | 13.79 | 0.00 | 1.29 | 19 |
| 20 | ** | ** | ** | ** | ** | ** | ** | 14.00 | 20.60 | 0.80 | 0.00 | 1.29 | 20 |
| 21 | ** | ** | ** | ** | ** | ** | ** | 12.42 | 20.60 | 0.23 | 0.00 | 1.29 | 21 |
| 22 | ** | ** | ** | ** | ** | ** | ** | 12.62 | 20.12 | 0.23 | 0.74 | 1.21 | 22 |
| 23 | ** | ** | ** | ** | ** | ** | ** | 11.86 | 20.36 | 0.13 | 0.50 | 1.17 | 23 |
| 24 | ** | ** | ** | ** | ** | ** | ** | 13.20 | 20.60 | 0.32 | 0.74 | 1.13 | 24 |
| 25 | ** | ** | ** | ** | ** | ** | ** | 19.42 | 20.60 | 2.09 | 1.29 | 1.13 | 25 |
| 26 | ** | ** | ** | ** | ** | ** | ** | 20.12 | 20.36 | 1.87 | 0.74 | 1.13 | 26 |
| 27 | ** | ** | ** | ** | ** | ** | ** | 20.60 | 18.96 | 1.21 | 0.63 | 1.13 | 27 |
| 28 | ** | ** | ** | ** | ** | ** | ** | 19.65 | 19.19 | 0.03 | 0.42 | 1.38 | 28 |
| 29 | ** | ** | ** | ** | ** | ** | ** | 18.96 | 19.30 | 0.00 | 0.32 | 1.29 | 29 |
| 30 | ** | ** | ** | ** | ** | ** | 18.05 | 19.42 | 0.15 | 0.23 | 1.29 | 30 | |
| 31 | ** | ** | ** | ** | 18.05 | 0.15 | 0.00 | 31 | |||||
| TOTAL | ** | ** | ** | ** | ** | ** | ** | 248.04* | 543.14 | 300.32 | 18.37 | 40.13 | |
| MEAN | ** | ** | ** | ** | ** | ** | ** | 13.05* | 18.10 | 9.69 | 0.59 | 1.34 | |
| AC-FT | ** | ** | ** | ** | ** | ** | ** | 491.98* | 1077.30 | 595.68 | 36.44 | 79.60 | |
| JENKINS DITCH | STATION NO. 0077105.00 |
| LATITUDE 42-59-51 LONGITUDE 109-58-39 | |
| SE1/4NE1/4 SECTION 20 TOWNSHIP 35 N, RANGE 110 W 6TH P.M. | |
| ELEVATION 7485.00 FT DRAINAGE AREA UNKNOWN | |
| NONCONTRIBUTING 0.00 SQ MI BASIN 15570000 | |
| SUBLETTE COUNTY DATA FROM WWRC (C) | |
| ***TO USE THIS DATA, SEE VIC HASFURTHER*** |
| MEAN DAILY FLOW IN CFS BY WATER YEAR | |||||||||||||
| 1988 | |||||||||||||
| DAY | OCT | NOV | DEC | JAN | FEB | MAR | APR | MAY | JUNE | JULY | AUG | SEPT | DAY |
| 1 | 1.29 | 1.13 | ** | ** | ** | ** | ** | 0.00 | ** | ** | ** | ** | 1 |
| 2 | 1.29 | ** | ** | ** | ** | ** | ** | 0.00 | ** | ** | ** | ** | 2 |
| 3 | 1.21 | ** | ** | ** | ** | ** | ** | 0.00 | ** | ** | ** | ** | 3 |
| 4 | 0.86 | ** | ** | ** | ** | ** | ** | 0.00 | ** | ** | ** | ** | 4 |
| 5 | 0.01 | ** | ** | ** | ** | ** | ** | 0.00 | ** | ** | ** | ** | 5 |
| 6 | 4.35 | ** | ** | ** | ** | ** | ** | 0.00 | ** | ** | ** | ** | 6 |
| 7 | 2.34 | ** | ** | ** | ** | ** | ** | 0.00 | ** | ** | ** | ** | 7 |
| 8 | 2.34 | ** | ** | ** | ** | ** | ** | 0.00 | ** | ** | ** | ** | 8 |
| 9 | 2.34 | ** | ** | ** | ** | ** | ** | 0.00 | ** | ** | ** | ** | 9 |
| 10 | 2.34 | ** | ** | ** | ** | ** | ** | 0.00 | ** | ** | ** | ** | 10 |
| 11 | 2.34 | ** | ** | ** | ** | ** | ** | 0.00 | ** | ** | ** | ** | 11 |
| 12 | 2.09 | ** | ** | ** | ** | ** | ** | 0.00 | ** | ** | ** | ** | 12 |
| 13 | 2.21 | ** | ** | ** | ** | ** | ** | 0.00 | ** | ** | ** | ** | 13 |
| 14 | 2.13 | ** | ** | ** | ** | ** | ** | 0.00 | ** | ** | ** | ** | 14 |
| 15 | 1.98 | ** | ** | ** | ** | ** | ** | 0.00 | ** | ** | ** | ** | 15 |
| 16 | 1.98 | ** | ** | ** | ** | ** | ** | 0.00 | ** | ** | ** | ** | 16 |
| 17 | 1.98 | ** | ** | ** | ** | ** | ** | 0.00 | ** | ** | ** | ** | 17 |
| 18 | 1.87 | ** | ** | ** | ** | ** | ** | 0.00 | ** | ** | ** | ** | 18 |
| 19 | 1.87 | ** | ** | ** | ** | ** | ** | 0.00 | ** | ** | ** | ** | 19 |
| 20 | 2.09 | ** | ** | ** | ** | ** | ** | 0.00 | ** | ** | ** | ** | 20 |
| 21 | 1.06 | ** | ** | ** | ** | ** | ** | 0.00 | ** | ** | ** | ** | 21 |
| 22 | 1.13 | ** | ** | ** | ** | ** | ** | 0.00 | ** | ** | ** | ** | 22 |
| 23 | 0.92 | ** | ** | ** | ** | ** | ** | 0.00 | ** | ** | ** | ** | 23 |
| 24 | 0.80 | ** | ** | ** | ** | ** | ** | 0.00 | ** | ** | ** | ** | 24 |
| 25 | 1.47 | ** | ** | ** | ** | ** | ** | 0.00 | ** | ** | ** | ** | 25 |
| 26 | 1.56 | ** | ** | ** | ** | ** | ** | 1.37 | ** | ** | ** | ** | 26 |
| 27 | 1.56 | ** | ** | ** | ** | ** | ** | 2.74 | ** | ** | ** | ** | 27 |
| 28 | 1.56 | ** | ** | ** | ** | ** | ** | 4.10 | ** | ** | ** | ** | 28 |
| 29 | 1.56 | ** | ** | ** | ** | ** | ** | 5.47 | ** | ** | ** | ** | 29 |
| 30 | 1.47 | ** | ** | ** | ** | 0.00 | 6.84 | ** | ** | ** | ** | 30 | |
| 31 | 0.86 | ** | ** | ** | 8.21 | ** | ** | 31 | |||||
| TOTAL | 52.86 | 1.13* | ** | ** | ** | ** | 0.00* | 56.99 | ** | ** | ** | ** | |
| MEAN | 1.71 | 1.13* | ** | ** | ** | ** | 0.00* | 0.93 | ** | ** | ** | ** | |
| AC-FT | 104.85 | 2.24* | ** | ** | ** | ** | 0.00* | 56.99 | ** | ** | ** | ** | |
Source: Wyoming Water Resources Data System, March 20, 2000.
Jorgensen Ditch, East Fork New Fork River
Diversion Description: Diversion consists of a single 18" slide gate. No diversion dam exists.1
Conveyance Description: Open Channel Canal, approximately 3 miles in length.
Wyoming Water Rights Summary:
| Priority Date (M-D-Y) | Permit Number |
Permitted Use | Acres | Flow (cfs) |
Cumulative Flow (cfs) | Comments |
| 12-11-1897 | 1687 | Irrigation | 789.00 | 11.27 | 11.27 | |
| 10-16-1901 | 730E | Irrigation | 220.00 | 3.14 | 14.41 | |
| 02-14-1902 | 786E | Irrigation | 155.00 | 2.21 | 16.62 | |
| 10-29-1921 | 4285E | Irrigation | 156.00 | 2.23 | 18.85 |
Storage Rights: None.
Estimated Canal Losses: Information not available at time of report.
Irrigation Practices: Information not available at time of report.
Crop Types / Consumptive Use: Information not available at time of report.
Return Flows: Return flows are delivered to Cottonwood Creek above East Fork River.2
Other Operational Information: Information not available at time of report.
|
Jorgensen Ditch, East Fork New Fork River, Diversion Data
| Wateryear | May | June | July | August | September | |||||
| Average (cfs) | Monthly Total (AF) | Average (cfs) | Monthly Total (AF) | Average (cfs) | Monthly Total (AF) | Average (cfs) | Monthly Total (AF) | Average (cfs) | Monthly Total (AF) | |
| 1980 | ||||||||||
| 1981 | ||||||||||
| 1982 | ||||||||||
| 1983 | ||||||||||
| 1984 | ||||||||||
| 1985 | ||||||||||
| 1986 | ||||||||||
| 1987 | ||||||||||
| 1988 | 7.84 | 466.51 | ||||||||
| 1989 | ||||||||||
| 1990 | ||||||||||
| 1991 | ||||||||||
| 1992 | 17.61 | 1,047.87 | ||||||||
| 1993 | 83.11 | 5,110.12 | ||||||||
| 1994 | 27.53 | 1,692.75 | 21.51 | 1,279.93 | 12.67 | 779.05 | 1.40 | 86.08 | ||
| 1995 | 11.35 | 697.88 | 21.84 | 1,299.57 | 21.68 | 1,333.05 | 4.39 | 269.93 | 1.27 | 75.57 |
| 1996 | ||||||||||
| 1997 | ||||||||||
| 1998 | ||||||||||
| Averages: | 19.44 | 1,195.32 | 17.20 | 1,023.47 | 17.18 | 1,056.05 | 29.63 | 1,822.04 | 1.27 | 75.57 |
Data:
1981: 7/6, 15 cfs.
1987: 5/14, 23.5 cfs; 7/14, off.
1988: 4/12, 0 cfs; 5/25, 0 cfs; 6/18, 8 cfs; 6/26, 10.1 cfs; 6/27, 16.6 cfs; 7/1, 14.2 cfs.
1989: 4/14, 3 cfs; 4/20, 0 cfs; 5/3, 8 cfs; 6/26, 10 cfs.
1990: 6/18, 15.0 cfs (est); 7/11, 8.0 cfs (est).
1992: 5/29, 20.00 cfs; 6/8, 15.00 cfs; 6/10, 18.00 cfs; 6/11, 18.50 cfs; 7/10, 17.00 cfs.
1993: 4/29, 5/3, off; 6/14, 37.80 cfs; 7/27, off; 9/2, 150 cfs.
1994: 5/3, 15.00 cfs; 5/23, 38.60 cfs; 6/19, 18.60 cfs; 6/20, 15.80 cfs; 7/18, 15.50 cfs; 8/4, off; 9/3, 3.00 cfs.
1995: 4/10, off; 4/18, 1.5 cfs (est); 4/26, 2.0 cfs; 5/24, 15.0 cfs; 6/26, 25.0 cfs; 7/6, 24.8 cfs; 7/17, 24 cfs; 8/16, 2.5 cfs; 8/30, off; 9/21, 3.5 cfs (est).
1996: 5/4, 2.0 cfs; 6/26, 27 cfs (est).
1997: 7/15, 12.1 cfs.
Supply: 1980, below average; 1981, slightly below average; 1982, average (late peak); 1983, above average; 1984, above average; 1985, below average; 1986, average to slightly above average; 1988: very below average; 1989, below average; 1990, below average; 1991, slightly below average; 1992, below average; 1993, average; 1994, below average; 1995, average to above average; 1996, average; 1997, average; 1998, average to above average.
Source: State Engineer's Office, Annual Hydrographers' Reports.
King Number 2 Ditch, Silver Creek
Diversion Description: Diversion consists of two 36" slide gates.1
Conveyance Description: Open Channel Canal, approximately 3 miles in length.1
Wyoming Water Rights Summary:
| Priority Date (M-D-Y) | Permit Number |
Permitted Use | Acres | Flow (cfs) |
Cumulative Flow (cfs) | Comments |
| 12-12-1907 | 8111 | Domestic, Irrigation, Stock | 1,148.49 | 16.40 | 16.40 |
Storage Rights: None.
Estimated Canal Losses: Information not available at time of report.
Irrigation Practices: Information not available at time of report.
Crop Types / Consumptive Use: Information not available at time of report.
Return Flows: Return flows are delivered to East Fork River at Cottonwood Creek.2
Other Operational Information: Information not available at time of report.
|
King Number 2 Ditch, Silver Creek, Diversion Data
Data:
1992: 6/25, 36.00 cfs; 7/10 30.00 cfs.
1994: 6/28, 26.0 cfs, 8/4. off; 9/15, 3.50 cfs.
1995: 4/10, off; 4/26, 7.0 cfs: 5/24, 12.5 cfs; 7/6, 30.0 cfs (est); 9/21, 3.5 cfs.
1996: 5/4, 3.5 cfs (est).
1997: 6/16, 50.8 cfs.
Supply: 1980, below average; 1981, slightly below average; 1982, average (late peak); 1983, above average; 1984, above average; 1985, below average; 1986, average to slightly above average; 1988: very below average; 1989, below average; 1990, below average; 1991, slightly below average; 1992, below average; 1993, average; 1994, below average; 1995, average to above average; 1996, average; 1997, average; 1998, average to above average.
Source: State Engineer's Office, Annual Hydrographers' Reports.
Lee Ditch / Pine Creek Number 1 Canal, Pine Creek
Diversion Description: Diversion consists of three 6' by 5' slide gates mounted on a concrete structure. A rock diversion dam exists.1
Conveyance Description: Open Channel Canal, approximately 7 miles in length.1
Wyoming Water Rights Summary:
| Priority Date (M-D-Y) | Permit Number |
Permitted Use | Acres | Flow (cfs) |
Cumulative Flow (cfs) | Comments |
| 01-04-1898 | 1696 | Irrigation | 76.00 | 1.07 | 1.07 | |
| 12-01-1898 | 392E | Irrigation | 245.00 | 3.50 | 4.57 | |
| 02-25-1901 | 626E | Irrigation | 2,780.81 | 39.66 | 44.23 | |
| 08-05-1901 | 692E | Irrigation | 58.00 | 0.82 | 45.05 | |
| 05-13-1909 | 2038E | Irrigation | 122.00 | 1.74 | 46.79 | |
| 08-10-1934 | 4951E | Domestic, Irrigation, Stock | 46.79 | 3,134.37 AF Secondary Supply from Fremont Lake Reservoir (4453R and 4465R) (910.00 acres served) | ||
| 07-15-1949 | 5484E | Domestic, Irrigation, Stock | 318.00 | 4.55 | 51.34 |
Storage Rights: Fremont Lake Reservoir.
Estimated Canal Losses: No significant losses are experienced. In fact, minor gains are experienced from seepage of other ditches.1
Irrigation Practices: Lands are flood irrigated.1
Crop Types / Consumptive Use: Lands are native grass hay and pasture.1
Return Flows: Return flows are delivered to West Fork New Fork River above Pole Creek.2
Other Operational Information: The canal is typically turned on the first of May and off the first of September.1
|
Lee Ditch / Pine Creek Number 1 Canal, Pine Creek Diversion Data
| Wateryear | May | June | July | August | September | |||||
| Average (cfs) | Monthly Total (AF) | Average (cfs) | Monthly Total (AF) | Average (cfs) | Monthly Total (AF) | Average (cfs) | Monthly Total (AF) | Average (cfs) | Monthly Total (AF) | |
| 1974 | 47.08 | 2,895.07 | 84.57 | 5,032.06 | 82.03 | 5,043.63 | 14.52 | 892.56 | 18.96 | 1,128.20 |
| 1975 | 52.94 | 3,149.91 | 73.28 | 4,505.81 | 34.78 | 2,138.80 | 22.30 | 1,327.00 | ||
| 1976 | 69.63 | 4,143.07 | 75.09 | 4,617.32 | 16.39 | 1,007.60 | 17.35 | 1,032.40 | ||
| 1978 | 25.48 | 1,566.94 | 75.44 | 4,489.19 | 81.42 | 5,006.28 | 18.55 | 1,140.50 | 12.83 | 763.64 |
| 1980 | 19.00 | 1,130.58 | 14.63 | 899.56 | 43.60 | 2,680.86 | 9.30 | 553.39 | ||
| 1981 | 45.55 | 2,710.41 | 53.47 | 3,287.74 | 35.15 | 2,161.29 | ||||
| 1982 | 72.24 | 4,298.58 | 71.11 | 4,372.38 | 38.43 | 2,362.97 | ||||
| 1983 | 49.08 | 2,920.46 | 61.69 | 3,793.17 | 49.72 | 3,057.16 | ||||
| 1984 | 62.15 | 3,698.18 | 43.45 | 2,671.64 | ||||||
| 1985 | 22.51 | 1,384.09 | 51.87 | 3,086.48 | 48.93 | 3,008.59 | 22.10 | 1,358.88 | ||
| 1986 | ||||||||||
| 1987 | 37.40 | 2,299.64 | 52.04 | 3,096.60 | 20.73 | 1,274.64 | ||||
| 1988 | 38.54 | 2,369.73 | ||||||||
| 1989 | ||||||||||
| 1990 | 26.39 | 1,570.31 | ||||||||
| 1991 | 45.10 | 2,683.64 | ||||||||
| 1992 | 24.54 | 1,508.91 | 39.43 | 2,346.25 | 29.78 | 1,831.10 | 17.76 | 1,092.02 | 12.30 | 731.90 |
| 1993 | 50.90 | 3,028.76 | 52.86 | 3,250.23 | 15.44 | 949.37 | 9.44 | 561.72 | ||
| 1994 | 11.54 | 709.57 | 34.95 | 2,079.67 | 41.18 | 2,532.06 | 26.60 | 1,635.57 | 10.73 | 638.48 |
| 1995 | 24.86 | 1,528.58 | 35.52 | 2,113.59 | 28.84 | 1,773.30 | 14.16 | 870.66 | 9.16 | 545.06 |
| 1996 | 13.73 | 844.22 | 71.78 | 4,271.21 | 69.58 | 4,278.31 | ||||
| 1997 | 46.19 | 2,748.50 | 52.47 | 3,226.25 | ||||||
| 1998 | 38.30 | 2,354.98 | ||||||||
| Averages: | 25.89 | 1,592.13 | 51.83 | 3,084.08 | 52.17 | 3,207.87 | 27.54 | 1,693.09 | 13.60 | 809.09 |
Data:
1980: 5/16, 52 cfs. 5/28, off; 6/4, 9 cfs; 6/9, 32 cfs; 6/13, 62 cfs; 6/15, 51 cfs; 6/21, washed out; 7/18, turned on; 7/21, 32 cfs; 7/25, 36 cfs; 8/1, 41 cfs; 8/4, 41 cfs; 8/11, 36 cfs; 8/20, 55 cfs; 9/4, 32 cfs; 9/15, off; 9/17, off.
1981: 6/9, 44 cfs; 6/15, 52 cfs; 6/17, 62 cfs; 6/26, 74 cfs; 7/6, 60 cfs; 7/15, 52 cfs; 7/24, 53 cfs; 7/30, 41 cfs; 8/6, 40 cfs; 8/11, 38 cfs; 8/29, 39 cfs.
1982: 5/24, 56 cfs; 6/2, 63 cfs; 6/9, 55 cfs; 6/17, 80 cfs; 6/18, 86 cfs; 6/24, 86 cfs; 6/29, 75 cfs; 7/9, 75 cfs; 7/14, 75 cfs; 7/19, 75 cfs; 8/2, 55 cfs; 9/6, 15 cfs.
1983: 5/24, off; 5/31, 15 cfs; 6/22, 65 cfs; 6/27, 68 cfs; 7/5, 72 cfs; 7/11, 67 cfs; 7/19, 56 cfs; 7/27, 55 cfs; 8/19, 56 cfs; 9/6, 16 cfs.
1984: 5/21, 29 cfs; 5/30, 58 cfs; 6/9, 58 cfs; 6/12, 43 cfs; 6/18, 80 cfs; 6/27, 80 cfs; 7/9, 76 cfs; 7/16, 71 cfs; 7/23, 80 cfs; 10/4, 6 cfs.
1985: 5/13, off; 5/22, 46.9 cfs; 6/6, 52.2 cfs; 7/16, 51.5 cfs; 7/30, 42.5 cfs; 8/7, 40 cfs; 8/28, 23 cfs; 9/5, 19 cfs.
1987: 5/13, 37.3 cfs; 5/19, 69.9 cfs; 6/3, 57.3 cfs; 7/16, 39.8 cfs.
1988: 6/28, 62 cfs; 7/5, 54 cfs; 7/14, 44 cfs; 7/18, 33 cfs; 7/27, 23 cfs; 8/1, 26 cfs; 8/4, 25 cfs; 8/8, 30 cfs.
1990: 5/17, 48.5 cfs; 5/24, 57.3 cfs; 6/13, 22.2 cfs; 7/12, 22.1 cfs.
1991: 6/13, 70.2 cfs; 7/3, 81.25 cfs.
1992: 5/6, 0.00 cfs; 5/27, 50.00 cfs; 6/3, 42.00 cfs; 6/16, 40.00 cfs; 7/17, 30.00 cfs; 8/21, 15.00 cfs; 9/4, 15.00 cfs; 9/28, 12.00 cfs.
1993: 5/17, off; 5/28, 35.80 cfs; 7/5, 66.00 cfs; 7/7, 68.00 cfs; 8/16, 10.00 cfs; 8/23, 10.50 cfs; 9/20, 10.00 cfs; 9/23, 10.00 cfs; 9/25, 10.00 cfs; 9/29, 10.00 cfs.
1994: 5/2, 5/4, 5/9, 5/12, off; 5/24, 25.00 cfs; 6/14, 30.00 cfs; 6/16, 35.00 cfs; 6/24, 42.60 cfs; 7/6, 45.00 cfs; 7/20, 43.00 cfs; 8/1, 30.00 cfs; 8/11, 25.00 cfs; 8/22, 30.00 cfs; 9/8, 12.00 cfs; 9/20, 20.00 cfs; 9/21, 20.00 cfs.
1995: 4/3, 4/30, off; 5/1, 20 cfs; 5/7, 23.0 cfs; 5/13, 24.5 cfs; 5/25, 25.0 cfs; 6/3, 35.0 cfs; 6/9, 35.0 cfs; 6/24, 38.2 cfs; 7/1, 30 cfs (est); 7/31, 28.0 cfs; 8/2, 12.5 cfs (est); 8/24, 15.0 cfs; 9/5, 15.0 cfs; 9/22, 10.28 cfs.
1996: 5/10, off; 5/14, 4.5 cfs (est); 6/25, 91.5 cfs; 7/8, 95 cfs; 7/25, 45 cfs (est); 8/13, 40.0 cfs (est).
1997: 6/12, 90 cfs (est); 7/7, 45.1 cfs; 7/30, 70 cfs (est).
1998: 5/25, 36.75 cfs; 7/29, 53.1 cfs; 9/3, 24.3 cfs.
Supply: 1980, below average; 1981, slightly below average; 1982, average (late peak); 1983, above average; 1984, above average; 1985, below average; 1986, average to slightly above average; 1988: very below average; 1989, below average; 1990, below average; 1991, slightly below average; 1992, below average; 1993, average; 1994, below average; 1995, average to above average; 1996, average; 1997, average; 1998, average to above average.
Source: State Engineer's Office, Annual Hydrographers' Reports.
| LEE DITCH OR PINE CREEK NO 1 DITCH BY PINEDALE | STATION NO. 006050.00 |
| LATITUDE 42-53-17 LONGITUDE 109-52-11 | |
| SW1/4SE1/4 SECTION 28 TOWNSHIP 34 N, RANGE 109 W 6TH P.M. | |
| ELEVATION 7210.00 FT DRAINAGE AREA UNKNOWN | |
| NONCONTRIBUTING AREA UNKNOWN BASIN 15570500 | |
| SUBLETTE COUNTY DATA FROM WATER COMMISSIONERS (P) |
| MEAN DAILY FLOW IN CFS BY WATER YEAR | |||||||||||||
| 1974 | |||||||||||||
| DAY | OCT | NOV | DEC | JAN | FEB | MAR | APR | MAY | JUNE | JULY | AUG | SEPT | DAY |
| 1 | ** | ** | ** | ** | ** | ** | ** | ** | 76.00 | 82.00 | 12.00 | 18.00 | 1 |
| 2 | ** | ** | ** | ** | ** | ** | ** | ** | 76.00 | 81.00 | 12.00 | 18.00 | 2 |
| 3 | ** | ** | ** | ** | ** | ** | ** | ** | 78.00 | 80.10 | 12.00 | 18.00 | 3 |
| 4 | ** | ** | ** | ** | ** | ** | ** | ** | 80.00 | 79.00 | 12.00 | 18.00 | 4 |
| 5 | ** | ** | ** | ** | ** | ** | ** | ** | 82.00 | 78.00 | 12.00 | 18.00 | 5 |
| 6 | ** | ** | ** | ** | ** | ** | ** | ** | 84.00 | 77.00 | 12.00 | 19.00 | 6 |
| 7 | ** | ** | ** | ** | ** | ** | ** | ** | 86.00 | 76.00 | 12.00 | 19.00 | 7 |
| 8 | ** | ** | ** | ** | ** | ** | ** | 30.00 | 86.00 | 75.00 | 12.00 | 19.00 | 8 |
| 9 | ** | ** | ** | ** | ** | ** | ** | 30.00 | 86.00 | 74.00 | 12.00 | 19.00 | 9 |
| 10 | ** | ** | ** | ** | ** | ** | ** | 36.70 | 86.00 | 73.00 | 12.00 | 19.00 | 10 |
| 11 | ** | ** | ** | ** | ** | ** | ** | 43.50 | 86.00 | 72.00 | 12.00 | 19.00 | 11 |
| 12 | ** | ** | ** | ** | ** | ** | ** | 48.70 | 86.00 | 71.00 | 12.00 | 19.00 | 12 |
| 13 | ** | ** | ** | ** | ** | ** | ** | 57.70 | 86.00 | 69.00 | 12.00 | 19.00 | 13 |
| 14 | ** | ** | ** | ** | ** | ** | ** | 58.00 | 86.00 | 67.00 | 12.00 | 19.00 | 14 |
| 15 | ** | ** | ** | ** | ** | ** | ** | 59.00 | 86.00 | 64.40 | 12.00 | 19.00 | 15 |
| 16 | ** | ** | ** | ** | ** | ** | ** | 60.00 | 86.00 | 62.00 | 12.00 | 19.00 | 16 |
| 17 | ** | ** | ** | ** | ** | ** | ** | 61.00 | 86.00 | 61.00 | 12.00 | 19.00 | 17 |
| 18 | ** | ** | ** | ** | ** | ** | ** | 62.00 | 86.00 | 49.00 | 12.00 | 19.00 | 18 |
| 19 | ** | ** | ** | ** | ** | ** | ** | 63.00 | 86.00 | 57.00 | 18.00 | 19.00 | 19 |
| 20 | ** | ** | ** | ** | ** | ** | ** | 66.00 | 86.00 | 55.00 | 18.00 | 19.00 | 20 |
| 21 | ** | ** | ** | ** | ** | ** | ** | 66.00 | 86.00 | 12.00 | 18.00 | 19.00 | 21 |
| 22 | ** | ** | ** | ** | ** | ** | ** | 66.00 | 86.00 | 12.00 | 18.00 | 19.00 | 22 |
| 23 | ** | ** | ** | ** | ** | ** | ** | 66.00 | 86.00 | 12.00 | 18.00 | 19.00 | 23 |
| 24 | ** | ** | ** | ** | ** | ** | ** | 66.00 | 86.00 | 12.00 | 18.00 | 19.00 | 24 |
| 25 | ** | ** | ** | ** | ** | ** | ** | 68.00 | 86.00 | 12.00 | 18.00 | 19.00 | 25 |
| 26 | ** | ** | ** | ** | ** | ** | ** | 72.00 | 86.00 | 12.00 | 18.00 | 19.00 | 26 |
| 27 | ** | ** | ** | ** | ** | ** | ** | 76.00 | 86.00 | 12.00 | 18.00 | 19.80 | 27 |
| 28 | ** | ** | ** | ** | ** | ** | ** | 76.00 | 86.00 | 12.00 | 18.00 | 20.00 | 28 |
| 29 | ** | ** | ** | ** | ** | ** | 76.00 | 86.00 | 12.00 | 18.00 | 20.00 | 29 | |
| 30 | ** | ** | ** | ** | ** | ** | 76.00 | 83.00 | 12.00 | 18.00 | 20.00 | 30 | |
| 31 | ** | ** | ** | ** | 76.00 | 12.00 | 18.00 | 31 | |||||
| TOTAL | ** | ** | ** | ** | ** | ** | ** | 1459.60* | 2537.00 | 1534.50 | 450.00 | 568.80 | |
| MEAN | ** | ** | ** | ** | ** | ** | ** | 60.82* | 84.57 | 49.50 | 14.52 | 18.96 | |
| AC-FT | ** | ** | ** | ** | ** | ** | ** | 2895.07* | 5032.06 | 3043.63 | 892.56 | 1128.20 | |
| LEE DITCH OR PINE CREEK NO 1 DITCH BY PINEDALE | STATION NO. 006050.00 |
| LATITUDE 42-53-17 LONGITUDE 109-52-11 | |
| SW1/4SE1/4 SECTION 28 TOWNSHIP 34 N, RANGE 109 W 6TH P.M. | |
| ELEVATION 7210.00 FT DRAINAGE AREA UNKNOWN | |
| NONCONTRIBUTING AREA UNKNOWN BASIN 15570500 | |
| SUBLETTE COUNTY DATA FROM WATER COMMISSIONERS (P) |
| MEAN DAILY FLOW IN CFS BY WATER YEAR | |||||||||||||
| 1975 | |||||||||||||
| DAY | OCT | NOV | DEC | JAN | FEB | MAR | APR | MAY | JUNE | JULY | AUG | SEPT | DAY |
| 1 | 20.00 | ** | ** | ** | ** | ** | ** | ** | 40.00 | 80.50 | 57.00 | 22.80 | 1 |
| 2 | 20.00 | ** | ** | ** | ** | ** | ** | ** | 42.00 | 80.00 | 56.00 | 22.50 | 2 |
| 3 | 20.00 | ** | ** | ** | ** | ** | ** | ** | 44.00 | 81.00 | 56.00 | 21.00 | 3 |
| 4 | 20.10 | ** | ** | ** | ** | ** | ** | ** | 46.00 | 81.00 | 55.20 | 20.50 | 4 |
| 5 | 20.00 | ** | ** | ** | ** | ** | ** | ** | 44.00 | 81.00 | 55.00 | 20.10 | 5 |
| 6 | 20.00 | ** | ** | ** | ** | ** | ** | ** | 44.00 | 81.00 | 34.90 | 20.50 | 6 |
| 7 | 20.00 | ** | ** | ** | ** | ** | ** | ** | 46.00 | 81.00 | 32.00 | 20.50 | 7 |
| 8 | 20.00 | ** | ** | ** | ** | ** | ** | ** | 48.00 | 81.38 | 30.00 | 22.00 | 8 |
| 9 | 19.00 | ** | ** | ** | ** | ** | ** | ** | 51.00 | 81.00 | 29.00 | 22.00 | 9 |
| 10 | 19.00 | ** | ** | ** | ** | ** | ** | ** | 54.00 | 81.00 | 30.00 | 25.75 | 10 |
| 11 | 18.00 | ** | ** | ** | ** | ** | ** | ** | 58.00 | 81.00 | 31.00 | 25.00 | 11 |
| 12 | 18.00 | ** | ** | ** | ** | ** | ** | ** | 58.18 | 79.00 | 31.80 | 23.00 | 12 |
| 13 | 18.00 | ** | ** | ** | ** | ** | ** | ** | 53.00 | 79.00 | 32.00 | 23.00 | 13 |
| 14 | 18.00 | ** | ** | ** | ** | ** | ** | ** | 48.00 | 78.00 | 32.00 | 22.00 | 14 |
| 15 | 16.00 | ** | ** | ** | ** | ** | ** | ** | 43.00 | 77.00 | 32.50 | 22.50 | 15 |
| 16 | 16.00 | ** | ** | ** | ** | ** | ** | ** | 29.00 | 75.00 | 33.00 | 22.50 | 16 |
| 17 | 16.00 | ** | ** | ** | ** | ** | ** | ** | 32.00 | 74.50 | 34.00 | 22.50 | 17 |
| 18 | 15.00 | ** | ** | ** | ** | ** | ** | ** | 36.00 | 72.00 | 34.90 | 22.50 | 18 |
| 19 | 14.00 | ** | ** | ** | ** | ** | ** | ** | 40.00 | 71.00 | 34.00 | 22.50 | 19 |
| 20 | 14.00 | ** | ** | ** | ** | ** | ** | ** | 44.00 | 70.00 | 32.00 | 22.50 | 20 |
| 21 | ** | ** | ** | ** | ** | ** | ** | ** | 49.00 | 69.00 | 32.00 | 22.50 | 21 |
| 22 | ** | ** | ** | ** | ** | ** | ** | ** | 54.00 | 69.00 | 32.00 | 22.50 | 22 |
| 23 | ** | ** | ** | ** | ** | ** | ** | ** | 59.00 | 68.70 | 31.00 | 22.50 | 23 |
| 24 | ** | ** | ** | ** | ** | ** | ** | ** | 64.90 | 67.00 | 30.00 | 22.00 | 24 |
| 25 | ** | ** | ** | ** | ** | ** | ** | ** | 69.00 | 66.00 | 29.00 | 22.00 | 25 |
| 26 | ** | ** | ** | ** | ** | ** | ** | ** | 74.00 | 65.00 | 30.00 | 21.90 | 26 |
| 27 | ** | ** | ** | ** | ** | ** | ** | 29.70 | 78.00 | 64.00 | 32.00 | 22.00 | 27 |
| 28 | ** | ** | ** | ** | ** | ** | ** | 30.00 | 80.00 | 62.00 | 32.50 | 22.00 | 28 |
| 29 | ** | ** | ** | ** | ** | ** | 30.00 | 80.00 | 60.60 | 22.50 | 23.00 | 29 | |
| 30 | ** | ** | ** | ** | ** | ** | 30.00 | 80.00 | 58.00 | 22.50 | 23.00 | 30 | |
| 31 | ** | ** | ** | ** | 37.30 | 57.00 | 22.50 | 31 | |||||
| TOTAL | 361.10* | ** | ** | ** | ** | ** | ** | 157.00* | 1588.08 | 2271.68 | 1078.30 | 669.05 | |
| MEAN | 18.06* | ** | ** | ** | ** | ** | ** | 31.40* | 52.94 | 73.28 | 34.78 | 22.30 | |
| AC-FT | 716.23* | ** | ** | ** | ** | ** | ** | 311.40* | 3149.91 | 4505.81 | 2138.78 | 1327.04 | |
| LEE DITCH OR PINE CREEK NO 1 DITCH BY PINEDALE | STATION NO. 006050.00 |
| LATITUDE 42-53-17 LONGITUDE 109-52-11 | |
| SW1/4SE1/4 SECTION 28 TOWNSHIP 34 N, RANGE 109 W 6TH P.M. | |
| ELEVATION 7210.00 FT DRAINAGE AREA UNKNOWN | |
| NONCONTRIBUTING AREA UNKNOWN BASIN 15570500 | |
| SUBLETTE COUNTY DATA FROM WATER COMMISSIONERS (P) |
| MEAN DAILY FLOW IN CFS BY WATER YEAR | |||||||||||||
| 1976 | |||||||||||||
| DAY | OCT | NOV | DEC | JAN | FEB | MAR | APR | MAY | JUNE | JULY | AUG | SEPT | DAY |
| 1 | 26.00 | ** | ** | ** | ** | ** | ** | ** | 70.00 | 73.00 | 20.00 | 16.00 | 1 |
| 2 | 25.70 | ** | ** | ** | ** | ** | ** | ** | 73.00 | 78.50 | 19.50 | 16.50 | 2 |
| 3 | 25.70 | ** | ** | ** | ** | ** | ** | ** | 76.00 | 80.00 | 19.00 | 16.00 | 3 |
| 4 | 25.00 | ** | ** | ** | ** | ** | ** | ** | 80.50 | 82.00 | 19.00 | 15.00 | 4 |
| 5 | 25.00 | ** | ** | ** | ** | ** | ** | ** | 80.00 | 84.00 | 19.00 | 16.00 | 5 |
| 6 | 24.00 | ** | ** | ** | ** | ** | ** | ** | 80.00 | 86.00 | 19.00 | 18.00 | 6 |
| 7 | 23.00 | ** | ** | ** | ** | ** | ** | ** | 80.00 | 88.00 | 19.00 | 19.50 | 7 |
| 8 | 22.00 | ** | ** | ** | ** | ** | ** | ** | 80.00 | 90.00 | 19.00 | 19.00 | 8 |
| 9 | 21.00 | ** | ** | ** | ** | ** | ** | ** | 79.50 | 92.00 | 19.00 | 18.00 | 9 |
| 10 | 20.20 | ** | ** | ** | ** | ** | ** | ** | 79.00 | 19.00 | 19.50 | 17.00 | 10 |
| 11 | 19.00 | ** | ** | ** | ** | ** | ** | ** | 78.00 | 90.00 | 19.00 | 16.00 | 11 |
| 12 | 18.00 | ** | ** | ** | ** | ** | ** | ** | 78.00 | 85.00 | 19.00 | 15.00 | 12 |
| 13 | 17.00 | ** | ** | ** | ** | ** | ** | ** | 70.00 | 78.00 | 18.00 | 14.10 | 13 |
| 14 | 16.50 | ** | ** | ** | ** | ** | ** | ** | 68.00 | 70.00 | 18.00 | 13.00 | 14 |
| 15 | 16.00 | ** | ** | ** | ** | ** | ** | ** | 66.00 | 70.00 | 17.00 | 12.00 | 15 |
| 16 | 15.00 | ** | ** | ** | ** | ** | ** | ** | 64.00 | 69.00 | 16.00 | 13.00 | 16 |
| 17 | 14.50 | ** | ** | ** | ** | ** | ** | ** | 62.00 | 69.00 | 15.00 | 14.00 | 17 |
| 18 | 14.00 | ** | ** | ** | ** | ** | ** | ** | 60.00 | 69.00 | 13.50 | 15.00 | 18 |
| 19 | 13.00 | ** | ** | ** | ** | ** | ** | ** | 59.70 | 68.70 | 13.00 | 16.00 | 19 |
| 20 | 12.00 | ** | ** | ** | ** | ** | ** | 39.70 | 58.00 | 68.00 | 13.00 | 17.10 | 20 |
| 21 | 11.00 | ** | ** | ** | ** | ** | ** | 44.00 | 62.00 | 68.00 | 12.00 | 18.00 | 21 |
| 22 | 10.00 | ** | ** | ** | ** | ** | ** | 48.00 | 66.00 | 67.00 | 12.00 | 19.00 | 22 |
| 23 | 9.00 | ** | ** | ** | ** | ** | ** | 52.00 | 70.50 | 67.00 | 12.00 | 22.00 | 23 |
| 24 | 8.00 | ** | ** | ** | ** | ** | ** | 57.00 | 67.00 | 66.00 | 11.00 | 21.00 | 24 |
| 25 | 7.00 | ** | ** | ** | ** | ** | ** | 58.00 | 63.00 | 66.00 | 11.00 | 21.00 | 25 |
| 26 | ** | ** | ** | ** | ** | ** | ** | 59.90 | 60.60 | 67.00 | 16.00 | 21.00 | 26 |
| 27 | ** | ** | ** | ** | ** | ** | ** | 61.00 | 62.00 | 68.00 | 16.50 | 21.00 | 27 |
| 28 | ** | ** | ** | ** | ** | ** | ** | 63.00 | 64.00 | 69.70 | 16.00 | 21.00 | 28 |
| 29 | ** | ** | ** | ** | ** | ** | 65.00 | 66.00 | 69.00 | 16.00 | 21.30 | 29 | |
| 30 | ** | ** | ** | ** | ** | ** | 67.00 | 66.00 | 68.00 | 16.00 | 21.00 | 30 | |
| 31 | ** | ** | ** | ** | 69.00 | 67.00 | 16.00 | 31 | |||||
| TOTAL | 437.60* | ** | ** | ** | ** | ** | ** | 683.60* | 2088.80 | 2327.90 | 508.00 | 520.50 | |
| MEAN | 17.50* | ** | ** | ** | ** | ** | ** | 56.97* | 69.63 | 75.09 | 16.39 | 17.35 | |
| AC-FT | 867.97* | ** | ** | ** | ** | ** | ** | 1355.90* | 4143.07 | 4617.32 | 1007.60 | 1032.40 | |
| LEE DITCH OR PINE CREEK NO 1 DITCH BY PINEDALE | STATION NO. 006050.00 |
| LATITUDE 42-53-17 LONGITUDE 109-52-11 | |
| SW1/4SE1/4 SECTION 28 TOWNSHIP 34 N, RANGE 109 W 6TH P.M. | |
| ELEVATION 7210.00 FT DRAINAGE AREA UNKNOWN | |
| NONCONTRIBUTING AREA UNKNOWN BASIN 15570500 | |
| SUBLETTE COUNTY DATA FROM WATER COMMISSIONERS (P) |
| MEAN DAILY FLOW IN CFS BY WATER YEAR | |||||||||||||
| 1978 | |||||||||||||
| DAY | OCT | NOV | DEC | JAN | FEB | MAR | APR | MAY | JUNE | JULY | AUG | SEPT | DAY |
| 1 | 17.00 | ** | ** | ** | ** | ** | ** | ** | 51.00 | 79.00 | 40.00 | 6.00 | 1 |
| 2 | 17.00 | ** | ** | ** | ** | ** | ** | ** | 51.00 | 85.00 | 39.00 | 6.00 | 2 |
| 3 | 17.00 | ** | ** | ** | ** | ** | ** | ** | 51.00 | 86.00 | 38.00 | 6.00 | 3 |
| 4 | 17.00 | ** | ** | ** | ** | ** | ** | ** | 51.00 | 86.00 | 37.00 | 6.00 | 4 |
| 5 | 17.00 | ** | ** | ** | ** | ** | ** | ** | 51.30 | 86.00 | 35.00 | 6.00 | 5 |
| 6 | 17.00 | ** | ** | ** | ** | ** | ** | ** | 51.00 | 86.00 | 34.00 | 6.00 | 6 |
| 7 | 17.00 | ** | ** | ** | ** | ** | ** | ** | 56.00 | 86.00 | 33.00 | 6.00 | 7 |
| 8 | 17.00 | ** | ** | ** | ** | ** | ** | ** | 61.00 | 86.00 | 31.00 | 7.00 | 8 |
| 9 | 17.00 | ** | ** | ** | ** | ** | ** | 22.00 | 66.00 | 86.00 | 29.00 | 8.00 | 9 |
| 10 | 17.00 | ** | ** | ** | ** | ** | ** | 22.00 | 71.00 | 86.00 | 27.00 | 9.00 | 10 |
| 11 | 17.00 | ** | ** | ** | ** | ** | ** | 23.00 | 76.00 | 86.00 | 25.00 | 10.00 | 11 |
| 12 | 17.00 | ** | ** | ** | ** | ** | ** | 24.00 | 81.00 | 86.00 | 23.00 | 11.00 | 12 |
| 13 | 17.00 | ** | ** | ** | ** | ** | ** | 25.00 | 87.00 | 86.00 | 21.00 | 12.00 | 13 |
| 14 | 17.00 | ** | ** | ** | ** | ** | ** | 26.00 | 87.00 | 86.00 | 19.00 | 12.00 | 14 |
| 15 | 17.00 | ** | ** | ** | ** | ** | ** | 27.00 | 87.00 | 86.00 | 17.00 | 12.00 | 15 |
| 16 | 17.00 | ** | ** | ** | ** | ** | ** | 28.00 | 87.00 | 86.00 | 15.00 | 12.00 | 16 |
| 17 | 17.00 | ** | ** | ** | ** | ** | ** | 29.00 | 87.00 | 86.00 | 13.00 | 12.00 | 17 |
| 18 | 17.00 | ** | ** | ** | ** | ** | ** | 30.00 | 87.00 | 86.00 | 12.00 | 12.00 | 18 |
| 19 | 17.00 | ** | ** | ** | ** | ** | ** | 31.00 | 87.00 | 86.00 | 11.00 | 13.00 | 19 |
| 20 | 18.00 | ** | ** | ** | ** | ** | ** | 32.00 | 87.00 | 84.00 | 9.00 | 13.00 | 20 |
| 21 | 18.00 | ** | ** | ** | ** | ** | ** | 33.00 | 87.00 | 84.00 | 7.00 | 13.00 | 21 |
| 22 | 18.00 | ** | ** | ** | ** | ** | ** | 35.00 | 87.00 | 82.00 | 6.00 | 14.00 | 22 |
| 23 | 18.00 | ** | ** | ** | ** | ** | ** | 37.00 | 87.00 | 80.00 | 6.00 | 16.00 | 23 |
| 24 | 18.00 | ** | ** | ** | ** | ** | ** | 39.00 | 87.00 | 78.00 | 6.00 | 18.00 | 24 |
| 25 | 18.00 | ** | ** | ** | ** | ** | ** | 41.00 | 87.00 | 76.00 | 6.00 | 20.00 | 25 |
| 26 | 18.00 | ** | ** | ** | ** | ** | ** | 43.00 | 87.00 | 74.00 | 6.00 | 22.00 | 26 |
| 27 | 18.00 | ** | ** | ** | ** | ** | ** | 45.00 | 85.00 | 72.00 | 6.00 | 23.00 | 27 |
| 28 | 18.00 | ** | ** | ** | ** | ** | ** | 47.00 | 83.00 | 70.00 | 6.00 | 24.00 | 28 |
| 29 | 17.00 | ** | ** | ** | ** | ** | 49.00 | 81.00 | 68.00 | 6.00 | 25.00 | 29 | |
| 30 | 17.00 | ** | ** | ** | ** | ** | 51.00 | 79.00 | 66.00 | 6.00 | 25.00 | 30 | |
| 31 | ** | ** | ** | ** | 51.00 | 64.00 | 6.00 | 31 | |||||
| TOTAL | 519.00* | ** | ** | ** | ** | ** | ** | 790.00* | 2263.30 | 2524.00 | 575.00 | 385.00 | |
| MEAN | 17.30* | ** | ** | ** | ** | ** | ** | 34.35* | 75.44 | 81.42 | 18.55 | 12.83 | |
| AC-FT | 1029.42* | ** | ** | ** | ** | ** | ** | 1566.94* | 4489.19 | 5006.28 | 1140.50 | 763.64 | |
Source: Wyoming Water Resources Data System, March 20, 2000
Overland Ditch, East Fork New Fork River
Diversion Description: Diversion consists of a single 40" by 40" slide gate mounted on a concrete structure.1
Conveyance Description: Open Channel Canal, approximately 6« miles in length.1
Wyoming Water Rights Summary:
| Priority Date (M-D-Y) | Permit Number |
Permitted Use | Acres | Flow (cfs) |
Cumulative Flow (cfs) | Comments |
| 09-03-1906 | 1617E | Irrigation | 1,485.00 | 21.19 | 21.19 |
Storage Rights: None.
Estimated Canal Losses: Typical losses (10%) are experienced.1
Irrigation Practices: Lands are flood irrigated.1
Crop Types / Consumptive Use: Lands are native grass hay and pasture.1
Return Flows: Return flows are delivered to Muddy Creek above East Fork River.2
Other Operational Information: The canal is typically turned on the first of May and off in mid-July.1
|
Overland Ditch, East Fork New Fork River, Diversion Data
| Wateryear | May | June | July | August | September | |||||
| Average (cfs) | Monthly Total (AF) | Average (cfs) | Monthly Total (AF) | Average (cfs) | Monthly Total (AF) | Average (cfs) | Monthly Total (AF) | Average (cfs) | Monthly Total (AF) | |
| 1980 | 16.55 | 1,017.62 | 44.27 | 2,634.25 | 31.45 | 1,933.79 | ||||
| 1981 | 21.22 | 1,304.77 | 48.93 | 2,911.54 | 8.60 | 528.79 | ||||
| 1982 | 13.10 | 805.49 | 52.18 | 3,104.93 | 46.17 | 2,838.88 | 7.08 | 435.53 | 12.51 | 744.40 |
| 1983 | 47.70 | 2,838.35 | 51.34 | 3,156.77 | ||||||
| 1984 | 45.61 | 2,713.98 | 55.35 | 3,403.34 | ||||||
| 1985 | 10.32 | 634.55 | 0.00 | 0.00 | 0.00 | 0.00 | ||||
| 1986 | ||||||||||
| 1987 | ||||||||||
| 1988 | 39.08 | 2,325.42 | ||||||||
| 1989 | 4.10 | 252.02 | ||||||||
| 1990 | ||||||||||
| 1991 | ||||||||||
| 1992 | 40.37 | 2,482.25 | ||||||||
| 1993 | ||||||||||
| 1994 | 42.84 | 2,215.40 | 45.04 | 2,680.07 | 29.38 | 1,806.51 | 6.35 | 390.45 | ||
| 1995 | 14.11 | 867.59 | 30.15 | 1,794.05 | 33.13 | 2,037.08 | 15.47 | 951.21 | 4.20 | 249.92 |
| 1996 | ||||||||||
| 1997 | ||||||||||
| 1998 | ||||||||||
| Averages: | 23.56 | 1,448.85 | 44.12 | 2,625.32 | 32.66 | 2,007.87 | 7.23 | 444.25 | 5.76 | 342.64 |
Data:
1980: 4/30, on - 6 cfs; 5/6, 12 cfs; 5/12, 11 cfs; 5/21, 12 cfs, 5/29, 40 cfs; 6/3, 30 cfs; 6/11, 51 cfs; 6/23, 45 cfs; 6/30, 59 cfs; 7/9, 51 cfs; 7/15, 44 cfs; 7/21, off.
1981: 4/24, 6 cfs; 5/8, 14 cfs; 5/14, 12 cfs; 5/27,38 cfs; 6/10, 54 cfs; 6/17, 44 cfs; 7/6, 44 cfs; 7/7, 15 cfs; 7/11, off.
1982: 5/14, 9 cfs; 6/3, 44 cfs; 6/18, 51 cfs; 6/23, 65 cfs; 7/2, 59 cfs; 7/8, 60 cfs; 7/16, 57 cfs; 7/23, 25 cfs; 8/3, off; 9/22, 13 cfs; 10/5, 7 cfs.
1983: 5/17, off; 5/24, 11 cfs; 6/7, 34 cfs; 6/17, 42 cfs; 6/24, 55 cfs; 6/29, 51 cfs; 7/6, 52 cfs; 7/12, 51 cfs; 7/19, off; 7/27, off.
1984: 5/18, off; 5/22, 11 cfs; 6/1, 45 cfs; 6/9, 40 cfs; 6/12, 43 cfs; 6/29, 52 cfs; 7/6, 66 cfs; 7/16, 42 cfs; 9/25, off.
1985: 7/6, 40 cfs; 7/15, off; 7/31, off; 8/6, off; 8/14, off; 9/5, off.
1986: 6/26, 55.4; 9/9, off; 9/23, 2.5 cfs (est.).
1987: 5/14, 62.7 cfs; 7/14, off.
1988: 4/12, 0; 5/25, 55.5 cfs; 6/26, 32.3 cfs; 7/1, 6.8.
1989: 4/14, 0 cfs; 5/3, 20 cfs; 5/13, 30 cfs; 6/26, 30 cfs; 7/13, 0 cfs; 8/3, 0 cfs.
1990: 7/11, 25.0 cfs (est).
1991: 7/11, 42.0 cfs.
1992: 5/6, 60.00 cfs; 5/29, 45.00 cfs; 6/8, 35.00 cfs; 6/9, 34.5 cfs; 6/10, 25.00 cfs; 6/11, 25.8 cfs.
1993: 6/18, 53.8 cfs; 7/27, off; 9/2, 2.00 cfs.
1994: 5/3, off; 5/23, 63.00 cfs; 6/19, 48.60 cfs; 6/20, 28.10 cfs; 7/18, 35.00 cfs; 8/4, 8.00 cfs; 9/15, off.
1995: 4/10, off; 4/18, off; 4/26, off; 5/24, 20.6 cfs; 6/26, 35.0 cfs; 7/6, 36.6 cfs; 7/17, 35 cfs (est); 8/16, 12.5 cfs (est.); 8/30, 12 cfs (est); 9/21, off.
1996: 5/4, 12.0 cfs (est.); 6/26, 68.0 cfs (arrive), 1.48 cfs (depart).
1997: 5/27, 28 cfs (est); 9/4, 6.0 cfs (est).
Supply: 1980, below average; 1981, slightly below average; 1982, average (late peak); 1983, above average; 1984, above average; 1985, below average; 1986, average to slightly above average; 1988: very below average; 1989, below average; 1990, below average; 1991, slightly below average; 1992, below average; 1993, average; 1994, below average; 1995, average to above average; 1996, average; 1997, average; 1998, average to above average.
Source: State Engineer's Office, Annual Hydrographers' Reports.
Overland Ditch, Green River
Diversion Description: Information not available at time of report.
Conveyance Description: Open Channel Canal, approximately 4 miles in length.1
Wyoming Water Rights Summary:
| Priority Date (M-D-Y) | Permit Number |
Permitted Use | Acres | Flow (cfs) |
Cumulative Flow (cfs) | Comments |
| 10-15-1897 | 1625 | Irrigation | 14.00 | 0.20 | 0.20 | POD/MOC change from a portion of Hill Ditch |
| 09-18-1899 | 2274 | Irrigation | 432.00 | 6.17 | 6.37 | POD/MOC change from Harman Ditch |
| 07-08-1911 | 10930 | Domestic, Irrigation | 498.33 | 7.12 | 13.49 | |
| 12-01-1911 | 2583E | Domestic, Irrigation | 521.78 | 7.44 | 20.93 | POD/MOC change from a portion of Hill Ditch |
| 05-07-1971 | 6424E | Irrigation | 211.63 | 3.03 | 23.96 |
Storage Rights: None.
Estimated Canal Losses: Information not available at time of report.
Irrigation Practices: Information not available at time of report.
Crop Types / Consumptive Use: Information not available at time of report.
Return Flows: Return flows are delivered to Green River at New Fork River.2
Other Operational Information: Information not available at time of report.
|
Overland Ditch, Green River, Diversion Data
| Wateryear | May | June | July | August | September | |||||
| Average (cfs) | Monthly Total (AF) | Average (cfs) | Monthly Total (AF) | Average (cfs) | Monthly Total (AF) | Average (cfs) | Monthly Total (AF) | Average (cfs) | Monthly Total (AF) | |
| 1975 | 38.82 | 2,310.15 | 55.55 | 3,415.59 | ||||||
| 1976 | 13.77 | 846.74 | 52.40 | 3,118.01 | 42.94 | 2,604.40 | ||||
| 1978 | 56.77 | 3,377.85 | 44.48 | 2,735.21 | ||||||
| 1980 | ||||||||||
| 1981 | ||||||||||
| 1982 | ||||||||||
| 1983 | ||||||||||
| 1984 | ||||||||||
| 1985 | ||||||||||
| 1986 | ||||||||||
| 1987 | ||||||||||
| 1988 | ||||||||||
| 1989 | ||||||||||
| 1990 | ||||||||||
| 1991 | ||||||||||
| 1992 | ||||||||||
| 1993 | ||||||||||
| 1994 | ||||||||||
| 1995 | ||||||||||
| 1996 | ||||||||||
| 1997 | ||||||||||
| 1998 | ||||||||||
| Averages: | 13.77 | 846.74 | 49.33 | 2,935.34 | 47.66 | 2,930.40 | ||||
| OVERLAND DITCH | STATION NO. 006120.00 |
| LATITUDE 0-00-00 LONGITUDE 0-00-00 | |
| SECTION 0 TOWNSHIP 0, RANGE 0 P.M. | |
| ELEVATION UNKNOWN DRAINAGE AREA UNKNOWN | |
| NONCONTRIBUTING AREA UNKNOWN BASIN UNKNOWN | |
| DATA FROM WATER COMMISSIONERS (P) |
| MEAN DAILY FLOW IN CFS BY WATER YEAR | |||||||||||||
| 1975 | |||||||||||||
| DAY | OCT | NOV | DEC | JAN | FEB | MAR | APR | MAY | JUNE | JULY | AUG | SEPT | DAY |
| 1 | ** | ** | ** | ** | ** | ** | ** | ** | 40.00 | 40.00 | 32.00 | ** | 1 |
| 2 | ** | ** | ** | ** | ** | ** | ** | ** | 43.00 | 40.00 | 32.00 | ** | 2 |
| 3 | ** | ** | ** | ** | ** | ** | ** | ** | 43.00 | 68.00 | 30.00 | ** | 3 |
| 4 | ** | ** | ** | ** | ** | ** | ** | ** | 40.00 | 68.00 | 25.00 | ** | 4 |
| 5 | ** | ** | ** | ** | ** | ** | ** | ** | 35.00 | 68.00 | 20.00 | ** | 5 |
| 6 | ** | ** | ** | ** | ** | ** | ** | ** | 35.00 | 68.00 | 15.00 | ** | 6 |
| 7 | ** | ** | ** | ** | ** | ** | ** | ** | 30.00 | 68.00 | ** | ** | 7 |
| 8 | ** | ** | ** | ** | ** | ** | ** | ** | 30.00 | 68.60 | ** | ** | 8 |
| 9 | ** | ** | ** | ** | ** | ** | ** | ** | 25.00 | 68.00 | ** | ** | 9 |
| 10 | ** | ** | ** | ** | ** | ** | ** | ** | 25.00 | 69.00 | ** | ** | 10 |
| 11 | ** | ** | ** | ** | ** | ** | ** | ** | 20.00 | 69.00 | ** | ** | 11 |
| 12 | ** | ** | ** | ** | ** | ** | ** | ** | 20.00 | 69.00 | ** | ** | 12 |
| 13 | ** | ** | ** | ** | ** | ** | ** | ** | 20.70 | 69.00 | ** | ** | 13 |
| 14 | ** | ** | ** | ** | ** | ** | ** | ** | 20.00 | 69.00 | ** | ** | 14 |
| 15 | ** | ** | ** | ** | ** | ** | ** | ** | 25.00 | 69.00 | ** | ** | 15 |
| 16 | ** | ** | ** | ** | ** | ** | ** | ** | 35.00 | 69.00 | ** | ** | 16 |
| 17 | ** | ** | ** | ** | ** | ** | ** | ** | 44.50 | 69.00 | ** | ** | 17 |
| 18 | ** | ** | ** | ** | ** | ** | ** | ** | 45.00 | 69.00 | ** | ** | 18 |
| 19 | ** | ** | ** | ** | ** | ** | ** | ** | 46.00 | 65.00 | ** | ** | 19 |
| 20 | ** | ** | ** | ** | ** | ** | ** | ** | 47.00 | 60.00 | ** | ** | 20 |
| 21 | ** | ** | ** | ** | ** | ** | ** | ** | 48.00 | 55.00 | ** | ** | 21 |
| 22 | ** | ** | ** | ** | ** | ** | ** | ** | 49.00 | 50.00 | ** | ** | 22 |
| 23 | ** | ** | ** | ** | ** | ** | ** | ** | 50.00 | 45.00 | ** | ** | 23 |
| 24 | ** | ** | ** | ** | ** | ** | ** | ** | 51.00 | 35.50 | ** | ** | 24 |
| 25 | ** | ** | ** | ** | ** | ** | ** | ** | 52.50 | 35.00 | ** | ** | 25 |
| 26 | ** | ** | ** | ** | ** | ** | ** | ** | 53.00 | 34.00 | ** | ** | 26 |
| 27 | ** | ** | ** | ** | ** | ** | ** | ** | 54.00 | 33.00 | ** | ** | 27 |
| 28 | ** | ** | ** | ** | ** | ** | ** | ** | 50.00 | 33.00 | ** | ** | 28 |
| 29 | ** | ** | ** | ** | ** | ** | ** | 46.00 | 33.00 | ** | ** | 29 | |
| 30 | ** | ** | ** | ** | ** | ** | ** | 42.00 | 33.00 | ** | ** | 30 | |
| 31 | ** | ** | ** | ** | ** | 32.93 | ** | 31 | |||||
| TOTAL | ** | ** | ** | ** | ** | ** | ** | ** | 1164.70 | 1722.03 | 154.00* | ** | |
| MEAN | ** | ** | ** | ** | ** | ** | ** | ** | 38.82 | 55.55 | 25.67* | ** | |
| AC-FT | ** | ** | ** | ** | ** | ** | ** | ** | 2310.15 | 3415.59 | 305.45* | ** | |
| OVERLAND DITCH | STATION NO. 006120.00 |
| LATITUDE 0-00-00 LONGITUDE 0-00-00 | |
| SECTION 0 TOWNSHIP 0, RANGE 0 P.M. | |
| ELEVATION UNKNOWN DRAINAGE AREA UNKNOWN | |
| NONCONTRIBUTING AREA UNKNOWN BASIN UNKNOWN | |
| DATA FROM WATER COMMISSIONERS (P) |
| MEAN DAILY FLOW IN CFS BY WATER YEAR | |||||||||||||
| 1976 | |||||||||||||
| DAY | OCT | NOV | DEC | JAN | FEB | MAR | APR | MAY | JUNE | JULY | AUG | SEPT | DAY |
| 1 | ** | ** | ** | ** | ** | ** | ** | ** | 51.00 | 64.00 | ** | ** | 1 |
| 2 | ** | ** | ** | ** | ** | ** | ** | ** | 53.00 | 64.00 | ** | ** | 2 |
| 3 | ** | ** | ** | ** | ** | ** | ** | ** | 53.00 | 64.00 | ** | ** | 3 |
| 4 | ** | ** | ** | ** | ** | ** | ** | ** | 53.00 | 63.00 | ** | ** | 4 |
| 5 | ** | ** | ** | ** | ** | ** | ** | ** | 53.00 | 63.00 | ** | ** | 5 |
| 6 | ** | ** | ** | ** | ** | ** | ** | 13.00 | 55.00 | 61.00 | ** | ** | 6 |
| 7 | ** | ** | ** | ** | ** | ** | ** | 13.00 | 55.00 | 61.00 | ** | ** | 7 |
| 8 | ** | ** | ** | ** | ** | ** | ** | 13.00 | 55.00 | 59.00 | ** | ** | 8 |
| 9 | ** | ** | ** | ** | ** | ** | ** | 12.00 | 55.00 | 57.00 | ** | ** | 9 |
| 10 | ** | ** | ** | ** | ** | ** | ** | 12.00 | 55.00 | 55.00 | ** | ** | 10 |
| 11 | ** | ** | ** | ** | ** | ** | ** | 11.00 | 55.00 | 53.00 | ** | ** | 11 |
| 12 | ** | ** | ** | ** | ** | ** | ** | 10.00 | 55.00 | 51.00 | ** | ** | 12 |
| 13 | ** | ** | ** | ** | ** | ** | ** | 9.00 | 40.00 | 49.00 | ** | ** | 13 |
| 14 | ** | ** | ** | ** | ** | ** | ** | 9.00 | 40.00 | 47.00 | ** | ** | 14 |
| 15 | ** | ** | ** | ** | ** | ** | ** | 8.00 | 40.00 | 45.00 | ** | ** | 15 |
| 16 | ** | ** | ** | ** | ** | ** | ** | 7.00 | 40.00 | 42.70 | ** | ** | 16 |
| 17 | ** | ** | ** | ** | ** | ** | ** | 6.00 | 40.00 | 43.00 | ** | ** | 17 |
| 18 | ** | ** | ** | ** | ** | ** | ** | 4.00 | 40.00 | 43.00 | ** | ** | 18 |
| 19 | ** | ** | ** | ** | ** | ** | ** | 4.00 | 40.00 | 43.00 | ** | ** | 19 |
| 20 | ** | ** | ** | ** | ** | ** | ** | 3.00 | 45.00 | 44.50 | ** | ** | 20 |
| 21 | ** | ** | ** | ** | ** | ** | ** | 3.00 | 50.00 | 43.00 | ** | ** | 21 |
| 22 | ** | ** | ** | ** | ** | ** | ** | 4.00 | 55.00 | 41.00 | ** | ** | 22 |
| 23 | ** | ** | ** | ** | ** | ** | ** | 5.00 | 55.00 | 39.00 | ** | ** | 23 |
| 24 | ** | ** | ** | ** | ** | ** | ** | 6.00 | 58.00 | 37.00 | ** | ** | 24 |
| 25 | ** | ** | ** | ** | ** | ** | ** | 7.00 | 61.00 | 35.00 | ** | ** | 25 |
| 26 | ** | ** | ** | ** | ** | ** | ** | 42.00 | 64.00 | 33.00 | ** | ** | 26 |
| 27 | ** | ** | ** | ** | ** | ** | ** | 41.90 | 64.00 | 31.00 | ** | ** | 27 |
| 28 | ** | ** | ** | ** | ** | ** | ** | 43.00 | 64.00 | ** | ** | ** | 28 |
| 29 | ** | ** | ** | ** | ** | ** | ** | 45.00 | 64.00 | ** | ** | ** | 29 |
| 30 | ** | ** | ** | ** | ** | ** | 47.00 | 64.00 | ** | ** | ** | 30 | |
| 31 | ** | ** | ** | ** | 49.00 | ** | ** | 31 | |||||
| TOTAL | ** | ** | ** | ** | ** | ** | ** | 426.90* | 1572.00 | 1331.20* | ** | ** | |
| MEAN | ** | ** | ** | ** | ** | ** | ** | 16.42* | 52.40 | 49.30* | ** | ** | |
| AC-FT | ** | ** | ** | ** | ** | ** | ** | 846.74* | 3118.01 | 2640.40* | ** | ** | |
| OVERLAND DITCH | STATION NO. 006120.00 |
| LATITUDE 0-00-00 LONGITUDE 0-00-00 | |
| SECTION 0 TOWNSHIP 0, RANGE 0 P.M. | |
| ELEVATION UNKNOWN DRAINAGE AREA UNKNOWN | |
| NONCONTRIBUTING AREA UNKNOWN BASIN UNKNOWN | |
| DATA FROM WATER COMMISSIONERS (P) |
| MEAN DAILY FLOW IN CFS BY WATER YEAR | |||||||||||||
| 1978 | |||||||||||||
| DAY | OCT | NOV | DEC | JAN | FEB | MAR | APR | MAY | JUNE | JULY | AUG | SEPT | DAY |
| 1 | ** | ** | ** | ** | ** | ** | ** | ** | 46.00 | 63.00 | ** | ** | 1 |
| 2 | ** | ** | ** | ** | ** | ** | ** | ** | 44.00 | 52.00 | ** | ** | 2 |
| 3 | ** | ** | ** | ** | ** | ** | ** | ** | 46.00 | 52.00 | ** | ** | 3 |
| 4 | ** | ** | ** | ** | ** | ** | ** | ** | 48.00 | 52.00 | ** | ** | 4 |
| 5 | ** | ** | ** | ** | ** | ** | ** | ** | 50.00 | 58.00 | ** | ** | 5 |
| 6 | ** | ** | ** | ** | ** | ** | ** | ** | 52.00 | 52.00 | ** | ** | 6 |
| 7 | ** | ** | ** | ** | ** | ** | ** | ** | 54.00 | 52.00 | ** | ** | 7 |
| 8 | ** | ** | ** | ** | ** | ** | ** | ** | 56.00 | 63.00 | ** | ** | 8 |
| 9 | ** | ** | ** | ** | ** | ** | ** | ** | 56.00 | 63.00 | ** | ** | 9 |
| 10 | ** | ** | ** | ** | ** | ** | ** | ** | 56.00 | 61.00 | ** | ** | 10 |
| 11 | ** | ** | ** | ** | ** | ** | ** | ** | 56.00 | 59.00 | ** | ** | 11 |
| 12 | ** | ** | ** | ** | ** | ** | ** | ** | 56.00 | 57.00 | ** | ** | 12 |
| 13 | ** | ** | ** | ** | ** | ** | ** | ** | 56.00 | 54.00 | ** | ** | 13 |
| 14 | ** | ** | ** | ** | ** | ** | ** | ** | 56.00 | 53.00 | ** | ** | 14 |
| 15 | ** | ** | ** | ** | ** | ** | ** | ** | 58.00 | 53.00 | ** | ** | 15 |
| 16 | ** | ** | ** | ** | ** | ** | ** | ** | 59.00 | 53.00 | ** | ** | 16 |
| 17 | ** | ** | ** | ** | ** | ** | ** | ** | 59.00 | 52.00 | ** | ** | 17 |
| 18 | ** | ** | ** | ** | ** | ** | ** | ** | 59.00 | 51.00 | ** | ** | 18 |
| 19 | ** | ** | ** | ** | ** | ** | ** | ** | 59.00 | 50.00 | ** | ** | 19 |
| 20 | ** | ** | ** | ** | ** | ** | ** | 25.00 | 59.00 | 49.00 | ** | ** | 20 |
| 21 | ** | ** | ** | ** | ** | ** | ** | 27.00 | 59.00 | 49.00 | ** | ** | 21 |
| 22 | ** | ** | ** | ** | ** | ** | ** | 30.00 | 59.00 | 48.00 | ** | ** | 22 |
| 23 | ** | ** | ** | ** | ** | ** | ** | 35.00 | 59.00 | 48.00 | ** | ** | 23 |
| 24 | ** | ** | ** | ** | ** | ** | ** | 40.00 | 63.00 | 47.00 | ** | ** | 24 |
| 25 | ** | ** | ** | ** | ** | ** | ** | 40.00 | 63.00 | 45.00 | ** | ** | 25 |
| 26 | ** | ** | ** | ** | ** | ** | ** | 42.00 | 63.00 | 43.00 | ** | ** | 26 |
| 27 | ** | ** | ** | ** | ** | ** | ** | 44.00 | 63.00 | ** | ** | ** | 27 |
| 28 | ** | ** | ** | ** | ** | ** | ** | 46.00 | 63.00 | ** | ** | ** | 28 |
| 29 | ** | ** | ** | ** | ** | ** | 48.00 | 63.00 | ** | ** | ** | 29 | |
| 30 | ** | ** | ** | ** | ** | ** | 50.00 | 63.00 | ** | ** | ** | 30 | |
| 31 | ** | ** | ** | ** | 48.00 | ** | ** | 31 | |||||
| TOTAL | ** | ** | ** | ** | ** | ** | ** | 475.00* | 1703.00 | 1379.00* | ** | ** | |
| MEAN | ** | ** | ** | ** | ** | ** | ** | 39.58* | 56.77 | 53.04* | ** | ** | |
| AC-FT | ** | ** | ** | ** | ** | ** | ** | 942.15* | 3377.85 | 2735.21* | ** | ** | |
Paradise Canal, West Fork New Fork River
Diversion Description: Information not available at time of report.
Conveyance Description: Open Channel Canal.
Wyoming Water Rights Summary:
| Priority Date (M-D-Y) | Permit Number |
Permitted Use | Acres | Flow (cfs) |
Cumulative Flow (cfs) | Comments |
| 09-30-1952 | 21100 | Domestic, Irrigation, Stock | 1,705.00 | 24.36 | 24.36 | |
| 06-22-1954 | 5801E | Irrigation | 72.00 | 1.04 | 25.40 | |
| 11-19-1974 | 6562E | Irrigation, Stock | 16.00 | 0.28 | 25.68 | |
| 11-19-1974 | 6564E | Irrigation | 145.00 | 2.07 | 27.75 | |
| 11-19-1974 | 6572E | Irrigation, Stock | 80.00 | 1.19 | 28.94 |
Storage Rights: None.
Estimated Canal Losses: Information not available at time of report.
Irrigation Practices: Information not available at time of report.
Crop Types / Consumptive Use: Information not available at time of report.
Return Flows: Approximately 40% of the return flows are delivered to West Fork New Fork River near New Fork, approximately 40% to New Fork River near Bertram Ditch, and approximately 20% to New Fork River near Big Piney.1
Other Operational Information: Information not available at time of report.
|
Paradise Canal, West Fork New Fork River, Diversion Data
| Wateryear | May | June | July | August | September | |||||
| Average (cfs) | Monthly Total (AF) | Average (cfs) | Monthly Total (AF) | Average (cfs) | Monthly Total (AF) | Average (cfs) | Monthly Total (AF) | Average (cfs) | Monthly Total (AF) | |
| 1975 | 38.53 | 2,368.90 | 88.13 | 5,244.29 | 72.30 | 4,445.75 | 56.78 | 3,491.10 | 30.88 | 1,837.70 |
| 1976 | 13.96 | 858.21 | 85.60 | 5,093.47 | 73.95 | 4,546.91 | 49.95 | 3,071.40 | 34.17 | 2,033.10 |
| 1978 | 73.27 | 4,359.67 | 67.16 | 4,129.58 | 57.84 | 3,556.40 | 31.47 | 1,872.40 | ||
| 1980 | 15.07 | 926.26 | 75.01 | 4,463.40 | 99.23 | 6,101.41 | 75.50 | 4,642.31 | 39.57 | 2,354.58 |
| 1981 | 34.27 | 2,107.18 | 112.10 | 6,670.41 | 101.72 | 6,254.52 | 55.30 | 3,400.26 | 38.00 | 2,261.16 |
| 1982 | 100.78 | 5,996.83 | 88.06 | 5,414.60 | 34.47 | 2,119.48 | 34.28 | 2,039.80 | ||
| 1983 | 81.08 | 4,824.60 | 66.79 | 4,106.76 | 21.76 | 1,337.97 | ||||
| 1984 | 55.95 | 3,329.26 | 60.06 | 3,692.95 | 33.34 | 2,050.00 | ||||
| 1985 | 36.59 | 2,249.83 | 77.59 | 4,616.93 | 36.73 | 2,258.44 | 19.73 | 1,213.15 | ||
| 1986 | ||||||||||
| 1987 | 50.81 | 3,123.97 | 61.11 | 3,636.30 | ||||||
| 1988 | ||||||||||
| 1989 | 40.73 | 2,504.13 | 14.53 | 893.55 | ||||||
| 1990 | ||||||||||
| 1991 | ||||||||||
| 1992 | ||||||||||
| 1993 | ||||||||||
| 1994 | 22.23 | 1,366.87 | ||||||||
| 1995 | ||||||||||
| 1996 | 67.69 | 4,162.10 | 59.66 | 3,668.35 | 26.62 | 1,584.00 | ||||
| 1997 | 43.72 | 2,688.24 | 88.24 | 5,250.64 | 73.14 | 4,497.20 | 48.72 | 2,995.68 | 26.76 | 1,592.33 |
| 1998 | 31.22 | 1,919.64 | 79.78 | 4,747.24 | 68.35 | 4,202.68 | 39.27 | 2,414.62 | 27.02 | 1,607.80 |
| Averages: | 33.02 | 2,030.32 | 81.55 | 4,854.75 | 70.45 | 4,332.08 | 42.08 | 2,587.22 | 32.09 | 1,909.21 |
Data:
1980: 5/15, 25 cfs; 5/27, 27 cfs; 6/4, 40 cfs; 6/10, 69 cfs; 6/18, 80 cfs; 6/27, 100 cfs; 7/9, 107 cfs; 7/15, 107 cfs; 7/29, 85 cfs; 8/21, 74 cfs; 9/22, 48 cfs.
1981: 5/15, 44 cfs; 6/1, 81 cfs; 6/9, 120 cfs; 6/25, 114 cfs; 7/7, 116 Cfs; 7/20, 101 cfs; 8/4, 64 cfs; 8/11, 58 cfs; 8/27, 48 cfs; 9/28, 38 cfs.
1982: 5/24, 20 cfs (est); 6/2, 40 cfs; 6/7, 81 cfs; 6/18, 125 cfs; 6/28, 115cfs; 7/9, 125 cfs; 7/16, 120 cfs; 7/23, 43 cfs; 8/5, 25 cfs; 8/27, 43 cfs; 10/5, 26 cfs.
1983: 5/24, off; 6/1, 10 cfs (est); 6/3, 50 cfs; 6/7, 50 cfs; 6/19, 95 cfs; 6/24, 125 cfs; 7/5, 70 cfs; 7/11, 88 cfs; 7;1 9, 65 cfs; 7/27, 50 cfs; 8/22, 20 cfs.
1984: 5/17, off; 6/1, 72; 6/9, 53 cfs; 6/12, 47 cfs; 6/27, 57 cfs; 7/6, 80 cfs; 7/20, 55 cfs; 7/30, 39 cfs; 8/24, 50 cfs.
1985: 5/13, 45.1 cfs; 6/7, 83.5 cfs; 6/27, 74.0 cfs; 7/18, 30.0 cfs; 7/30, 17.5 cfs; 8/6, 38.0 cfs; 8/13, 34.5 cfs; 8/21, 4.5 cfs; 8/27, 3 cfs; 9/5, 11 cfs; 10/25, off.
1986: 6/17, 128.8 cfs; 9/2, 17 cfs.
1987: 5/11, 79 cfs; 6/1, 71 cfs; 7/13, 43.3 cfs; 8/26, 39 cfs.
1989: 4/14, 12.5 cfs; 7/7, 70 cfs; 8/1, 31 cfs; 8/18, 22 cfs.
1990: 7/13, 42.8 cfs.
1994: 5/13, off; 7/29, 48.20 cfs; 8/15, 15.40 cfs; 9/7, 19.00 cfs.
1996: 5/2, 10.0 cfs (est); 7/1, 100 cfs (est); 7/15, 65 cfs (est); 8/1, 46 cfs (est); 8/15, 70.0 cfs (est); 9/20, 32 cfs (est).
1997-1998: Data Recorder Installed. See Attached Sheets.
Supply: 1980, below average; 1981, slightly below average; 1982, average (late peak); 1983, above average; 1984, above average; 1985, below average; 1986, average to slightly above average; 1988: very below average; 1989, below average; 1990, below average; 1991, slightly below average; 1992, below average; 1993, average; 1994, below average; 1995, average to above average; 1996, average; 1997, average; 1998, average to above average.
Source: State Engineer's Office, Annual Hydrographers' Reports.
| 1997 | |||||
|---|---|---|---|---|---|
| May | June | July | Aug. | Sept. | |
| 1 | 76.0 | 97.9 | 65.7 | 30.0 | |
| 2 | 79.7 | 99.1 | 64.9 | 30.0 | |
| 3 | 71.5 | 96.7 | 64.9 | 30.0 | |
| 4 | 77.8 | 88.9 | 61.9 | 29.6 | |
| 5 | 82.7 | 89.9 | 66.5 | 29.3 | |
| 6 | 86.8 | 81.7 | 64.9 | 28.6 | |
| 7 | 9.0 | 81.7 | 97.9 | 63.4 | 28.6 |
| 8 | 9.2 | 85.7 | 109 | 63.4 | 28.6 |
| 9 | 9.4 | 85.7 | 132 | 62.6 | 28.2 |
| 10 | 9.6 | 86.8 | 100 | 64.2 | 27.9 |
| 11 | 9.2 | 97.9 | 62.6 | 64.2 | 29.5 |
| 12 | 10.6 | 83.7 | 64.9 | 54.2 | 31.9 |
| 13 | 11.3 | 85.7 | 69.0 | 50.4 | 30.4 |
| 14 | 10.6 | 82.7 | 64.2 | 45.8 | 28.9 |
| 15 | 11.6 | 82.7 | 62.6 | 46.3 | 28.2 |
| 16 | 21.1 | 80.7 | 61.9 | 44.7 | 29.3 |
| 17 | 37.3 | 79.7 | 64.2 | 44.1 | 28.6 |
| 18 | 31.1 | 78.8 | 61.1 | 43.6 | 28.2 |
| 19 | 49.8 | 81.7 | 76.9 | 43.1 | 27.9 |
| 20 | 62.6 | 85.7 | 74.2 | 42.1 | 21.7 |
| 21 | 69.0 | 88.9 | 64.9 | 41.6 | 22.5 |
| 22 | 74.2 | 86.8 | 61.1 | 42.1 | 23.9 |
| 23 | 77.8 | 89.9 | 63.4 | 43.6 | 23.3 |
| 24 | 72.4 | 109 | 64.9 | 38.6 | 23.0 |
| 25 | 70.7 | 108 | 62.6 | 33.4 | 23.0 |
| 26 | 68.1 | 107 | 49.8 | 33.0 | 23.0 |
| 27 | 64.2 | 103 | 50.4 | 31.9 | 22.7 |
| 28 | 72.4 | 103 | 49.2 | 32.6 | 22.5 |
| 29 | 75.1 | 100 | 49.2 | 31.5 | 22.2 |
| 30 | 77.8 | 97.9 | 48.6 | 30.7 | 21.4 |
| 31 | 78.8 | 48.6 | 30.4 | ||
| CFS days | 1,092.90 | 2,647.20 | 2,267.40 | 1,510.30 | 802.90 |
| Average (cfs) | 35.25 | 88.24 | 73.14 | 48.72 | 26.76 |
| 1998 | |||||
| May | June | July | Aug. | Sept. | |
| 1 | 1.0 | 78.9 | 81.2 | 38.3 | 37.5 |
| 2 | 1.0 | 87.0 | 81.4 | 37.9 | 35.3 |
| 3 | 1.0 | 87.0 | 81.6 | 37.9 | 34.2 |
| 4 | 4.2 | 67.2 | 81.6 | 32.4 | 32.1 |
| 5 | 16.5 | 54.7 | 78.3 | 26.6 | 30.7 |
| 6 | 17.0 | 77.0 | 87.0 | 37.5 | 29.7 |
| 7 | 7.4 | 77.0 | 84.9 | 44.9 | 29.4 |
| 8 | 6.7 | 73.2 | 88.4 | 44.5 | 28.1 |
| 9 | 12.5 | 74.4 | 81.6 | 42.7 | 28.1 |
| 10 | 11.7 | 71.4 | 73.8 | 41.5 | 28.4 |
| 11 | 11.7 | 78.9 | 73.8 | 41.1 | 27.8 |
| 12 | 14.0 | 77.6 | 73.8 | 39.9 | 27.2 |
| 13 | 20.3 | 75.1 | 72.0 | 39.1 | 28.1 |
| 14 | 19.5 | 76.3 | 71.4 | 38.7 | 27.8 |
| 15 | 19.5 | 80.9 | 69.6 | 38.7 | 26.0 |
| 16 | 19.0 | 89.8 | 68.4 | 38.3 | 25.4 |
| 17 | 19.0 | 91.3 | 66.6 | 40.7 | 25.1 |
| 18 | 19.0 | 89.1 | 68.4 | 45.3 | 24.2 |
| 19 | 20.3 | 82.2 | 72.6 | 44.9 | 24.0 |
| 20 | 36.4 | 78.3 | 70.2 | 42.3 | 23.7 |
| 21 | 37.5 | 77.0 | 69.0 | 39.9 | 24.0 |
| 22 | 37.5 | 75.7 | 65.5 | 35.3 | 24.2 |
| 23 | 37.5 | 82.9 | 63.2 | 30.0 | 24.2 |
| 24 | 37.5 | 93.5 | 63.8 | 34.9 | 24.0 |
| 25 | 42.3 | 90.6 | 63.8 | 39.1 | 24.0 |
| 26 | 71.4 | 82.9 | 60.5 | 42.7 | 24.0 |
| 27 | 76.3 | 80.9 | 43.6 | 41.9 | 23.7 |
| 28 | 81.6 | 80.9 | 41.9 | 41.1 | 23.5 |
| 29 | 82.9 | 80.9 | 41.1 | 41.1 | 23.3 |
| 30 | 96.4 | 80.9 | 40.7 | 39.9 | 23.0 |
| 31 | 89.1 | 39.1 | 39.3 | ||
| CFS days | 967.70 | 2,393.50 | 2,118.80 | 1,218.40 | 810.70 |
| Average (cfs) | 31.22 | 79.78 | 68.35 | 39.30 | 27.02 |
| PARADISE CANAL 2.5 MILES BELOW HEADGATE | STATION NO. 006020.00 |
| LATITUDE 42-44-35 LONGITUDE 109-44-32 | |
| SE1/4 NE1/4 NW1/4 SECTION 17 TOWNSHIP 32N, RANGE 108W 6TH P.M. | |
| ELEVATION 7000.00 FT DRAINAGE AREA UNKNOWN | |
| NONCONTRIBUTING AREA UNKNOWN BASIN 15570000 | |
| SUBLETTE COUNTY DATA FROM WATER COMMISSIONERS (P) |
| MEAN DAILY FLOW IN CFS BY WATER YEAR | |||||||||||||
| 1974 | |||||||||||||
| DAY | OCT | NOV | DEC | JAN | FEB | MAR | APR | MAY | JUNE | JULY | AUG | SEPT | DAY |
| 1 | ** | ** | ** | ** | ** | ** | ** | 15.00 | 80.00 | 87.00 | 69.00 | 40.00 | 1 |
| 2 | ** | ** | ** | ** | ** | ** | ** | 15.00 | 81.00 | 86.00 | 69.00 | 40.00 | 2 |
| 3 | ** | ** | ** | ** | ** | ** | ** | 15.00 | 82.00 | 85.00 | 68.00 | 39.00 | 3 |
| 4 | ** | ** | ** | ** | ** | ** | ** | 15.00 | 84.00 | 84.00 | 68.00 | 39.00 | 4 |
| 5 | ** | ** | ** | ** | ** | ** | ** | 15.00 | 86.00 | 83.00 | 67.10 | 38.00 | 5 |
| 6 | ** | ** | ** | ** | ** | ** | ** | 15.20 | 87.00 | 82.00 | 67.00 | 38.00 | 6 |
| 7 | ** | ** | ** | ** | ** | ** | ** | 21.50 | 89.00 | 81.00 | 67.00 | 38.00 | 7 |
| 8 | ** | ** | ** | ** | ** | ** | ** | 27.50 | 90.00 | 80.00 | 66.00 | 38.00 | 8 |
| 9 | ** | ** | ** | ** | ** | ** | ** | 33.00 | 90.00 | 79.00 | 66.00 | 37.00 | 9 |
| 10 | ** | ** | ** | ** | ** | ** | ** | 39.00 | 90.00 | 78.00 | 65.00 | 37.00 | 10 |
| 11 | ** | ** | ** | ** | ** | ** | ** | 39.50 | 90.00 | 77.00 | 64.00 | 36.00 | 11 |
| 12 | ** | ** | ** | ** | ** | ** | ** | 39.50 | 90.00 | 76.00 | 63.00 | 35.00 | 12 |
| 13 | ** | ** | ** | ** | ** | ** | ** | 39.50 | 90.00 | 75.00 | 62.00 | 34.00 | 13 |
| 14 | ** | ** | ** | ** | ** | ** | ** | 39.50 | 90.00 | 74.00 | 61.00 | 33.00 | 14 |
| 15 | ** | ** | ** | ** | ** | ** | ** | 39.50 | 90.00 | 73.00 | 60.00 | 32.00 | 15 |
| 16 | ** | ** | ** | ** | ** | ** | ** | 39.50 | 90.00 | 72.00 | 59.00 | 31.00 | 16 |
| 17 | ** | ** | ** | ** | ** | ** | ** | 39.80 | 90.00 | 72.00 | 59.00 | 30.00 | 17 |
| 18 | ** | ** | ** | ** | ** | ** | ** | 40.00 | 90.00 | 71.00 | 58.00 | 29.00 | 18 |
| 19 | ** | ** | ** | ** | ** | ** | ** | 41.50 | 90.00 | 70.00 | 57.00 | 29.00 | 19 |
| 20 | ** | ** | ** | ** | ** | ** | ** | 41.70 | 90.00 | 69.00 | 55.00 | 28.00 | 20 |
| 21 | ** | ** | ** | ** | ** | ** | ** | 42.50 | 90.00 | 68.00 | 53.00 | 27.00 | 21 |
| 22 | ** | ** | ** | ** | ** | ** | ** | 43.00 | 89.00 | 66.00 | 51.00 | 26.00 | 22 |
| 23 | ** | ** | ** | ** | ** | ** | ** | 43.00 | 89.00 | 65.00 | 49.00 | 25.00 | 23 |
| 24 | ** | ** | ** | ** | ** | ** | ** | 43.00 | 89.00 | 64.00 | 47.00 | 24.00 | 24 |
| 25 | ** | ** | ** | ** | ** | ** | ** | 44.00 | 88.00 | 63.00 | 45.00 | 23.00 | 25 |
| 26 | ** | ** | ** | ** | ** | ** | ** | 45.50 | 88.00 | 62.00 | 43.00 | 22.00 | 26 |
| 27 | ** | ** | ** | ** | ** | ** | ** | 49.00 | 88.00 | 61.40 | 41.00 | 21.50 | 27 |
| 28 | ** | ** | ** | ** | ** | ** | ** | 49.00 | 88.00 | 61.00 | 41.00 | 20.00 | 28 |
| 29 | ** | ** | ** | ** | ** | ** | 64.50 | 88.00 | 60.00 | 40.00 | 19.00 | 29 | |
| 30 | ** | ** | ** | ** | ** | ** | 79.60 | 88.00 | 59.00 | 40.00 | 18.00 | 30 | |
| 31 | ** | ** | ** | ** | 80.00 | 58.00 | 40.00 | 31 | |||||
| TOTAL | ** | ** | ** | ** | ** | ** | ** | 1194.30 | 2644.00 | 2241.40 | 1760.10 | 926.50 | |
| MEAN | ** | ** | ** | ** | ** | ** | ** | 38.53 | 88.13 | 72.30 | 56.78 | 30.88 | |
| AC-FT | ** | ** | ** | ** | ** | ** | ** | 2368.86 | 5244.29 | 4445.75 | 3491.11 | 1837.68 | |
| PARADISE CANAL 2.5 MILES BELOW HEADGATE | STATION NO. 006020.00 |
| LATITUDE 42-44-35 LONGITUDE 109-44-32 | |
| SE1/4 NE1/4 NW1/4 SECTION 17 TOWNSHIP 32N, RANGE 108W 6TH P.M. | |
| ELEVATION 7000.00 FT DRAINAGE AREA UNKNOWN | |
| NONCONTRIBUTING AREA UNKNOWN BASIN 15570000 | |
| SUBLETTE COUNTY DATA FROM WATER COMMISSIONERS (P) |
| MEAN DAILY FLOW IN CFS BY WATER YEAR | |||||||||||||
| 1976 | |||||||||||||
| DAY | OCT | NOV | DEC | JAN | FEB | MAR | APR | MAY | JUNE | JULY | AUG | SEPT | DAY |
| 1 | ** | ** | ** | ** | ** | ** | ** | ** | 68.00 | 92.00 | 56.00 | 40.00 | 1 |
| 2 | ** | ** | ** | ** | ** | ** | ** | ** | 74.00 | 95.00 | 52.00 | 39.00 | 2 |
| 3 | ** | ** | ** | ** | ** | ** | ** | ** | 78.00 | 95.00 | 48.00 | 38.50 | 3 |
| 4 | ** | ** | ** | ** | ** | ** | ** | ** | ** | 91.00 | 44.00 | 38.00 | 4 |
| 5 | ** | ** | ** | ** | ** | ** | ** | ** | 83.96 | 88.00 | 40.00 | 37.00 | 5 |
| 6 | ** | ** | ** | ** | ** | ** | ** | ** | 85.00 | 85.00 | 36.00 | 37.00 | 6 |
| 7 | ** | ** | ** | ** | ** | ** | ** | ** | 87.00 | 82.00 | 36.00 | 36.00 | 7 |
| 8 | ** | ** | ** | ** | ** | ** | ** | ** | 90.00 | 80.00 | 36.00 | 35.50 | 8 |
| 9 | ** | ** | ** | ** | ** | ** | ** | ** | 90.00 | 80.00 | 36.00 | 35.00 | 9 |
| 10 | ** | ** | ** | ** | ** | ** | ** | ** | 90.00 | 79.00 | 36.00 | 35.00 | 10 |
| 11 | ** | ** | ** | ** | ** | ** | ** | ** | 90.00 | 78.00 | 61.50 | 34.00 | 11 |
| 12 | ** | ** | ** | ** | ** | ** | ** | ** | 90.00 | 77.00 | 61.00 | 33.00 | 12 |
| 13 | ** | ** | ** | ** | ** | ** | ** | ** | 85.00 | 76.00 | 61.00 | 33.00 | 13 |
| 14 | ** | ** | ** | ** | ** | ** | ** | ** | 80.00 | 75.00 | 61.00 | 32.00 | 14 |
| 15 | ** | ** | ** | ** | ** | ** | ** | ** | 75.00 | 74.00 | 61.00 | 31.00 | 15 |
| 16 | ** | ** | ** | ** | ** | ** | ** | 8.00 | 80.00 | 73.00 | 60.00 | 30.00 | 16 |
| 17 | ** | ** | ** | ** | ** | ** | ** | 8.25 | 85.00 | 72.00 | 60.00 | 30.00 | 17 |
| 18 | ** | ** | ** | ** | ** | ** | ** | 9.00 | 90.00 | 69.00 | 59.00 | 31.00 | 18 |
| 19 | ** | ** | ** | ** | ** | ** | ** | 9.00 | 95.00 | 67.00 | 58.00 | 31.00 | 19 |
| 20 | ** | ** | ** | ** | ** | ** | ** | 10.00 | 96.00 | 64.40 | 57.00 | 32.00 | 20 |
| 21 | ** | ** | ** | ** | ** | ** | ** | 12.00 | 97.00 | 64.00 | 56.00 | 32.00 | 21 |
| 22 | ** | ** | ** | ** | ** | ** | ** | 14.00 | 98.00 | 64.00 | 55.00 | 33.00 | 22 |
| 23 | ** | ** | ** | ** | ** | ** | ** | 18.00 | 99.00 | 64.00 | 54.00 | 34.00 | 23 |
| 24 | ** | ** | ** | ** | ** | ** | ** | 22.00 | 100.00 | 64.00 | 52.00 | 35.00 | 24 |
| 25 | ** | ** | ** | ** | ** | ** | ** | 28.00 | 100.00 | 64.00 | 50.00 | 35.00 | 25 |
| 26 | ** | ** | ** | ** | ** | ** | ** | 34.43 | 98.00 | 64.00 | 48.00 | 35.00 | 26 |
| 27 | ** | ** | ** | ** | ** | ** | ** | 40.00 | 95.00 | 64.00 | 46.00 | 34.00 | 27 |
| 28 | ** | ** | ** | ** | ** | ** | ** | 46.00 | 91.00 | 64.00 | 44.00 | 34.00 | 28 |
| 29 | ** | ** | ** | ** | ** | ** | ** | 52.00 | 88.00 | 64.00 | 42.00 | 33.00 | 29 |
| 30 | ** | ** | ** | ** | ** | ** | 58.00 | 90.00 | 64.00 | 42.00 | 32.00 | 30 | |
| 31 | ** | ** | ** | ** | 64.00 | 60.00 | 40.00 | 31 | |||||
| TOTAL | ** | ** | ** | ** | ** | ** | ** | 432.68* | 2567.96* | 2292.40 | 1548.50 | 1025.00 | |
| MEAN | ** | ** | ** | ** | ** | ** | ** | 27.04* | 88.55* | 73.95 | 49.95 | 34.17 | |
| AC-FT | ** | ** | ** | ** | ** | ** | ** | 858.21* | 5093.47* | 4546.91 | 3071.40 | 2033.06 | |
| PARADISE CANAL 2.5 MILES BELOW HEADGATE | STATION NO. 006020.00 |
| LATITUDE 42-44-35 LONGITUDE 109-44-32 | |
| SE1/4 NE1/4 NW1/4 SECTION 17 TOWNSHIP 32N, RANGE 108W 6TH P.M. | |
| ELEVATION 7000.00 FT DRAINAGE AREA UNKNOWN | |
| NONCONTRIBUTING AREA UNKNOWN BASIN 15570000 | |
| SUBLETTE COUNTY DATA FROM WATER COMMISSIONERS (P) |
| MEAN DAILY FLOW IN CFS BY WATER YEAR | |||||||||||||
| 1978 | |||||||||||||
| DAY | OCT | NOV | DEC | JAN | FEB | MAR | APR | MAY | JUNE | JULY | AUG | SEPT | DAY |
| 1 | ** | ** | ** | ** | ** | ** | ** | ** | 72.00 | 76.00 | 72.00 | 38.00 | 1 |
| 2 | ** | ** | ** | ** | ** | ** | ** | ** | 72.00 | 76.00 | 72.00 | 38.00 | 2 |
| 3 | ** | ** | ** | ** | ** | ** | ** | ** | 72.00 | 76.00 | 71.00 | 38.00 | 3 |
| 4 | ** | ** | ** | ** | ** | ** | ** | ** | 72.00 | 75.00 | 70.00 | 37.00 | 4 |
| 5 | ** | ** | ** | ** | ** | ** | ** | ** | 72.00 | 75.00 | 69.00 | 37.00 | 5 |
| 6 | ** | ** | ** | ** | ** | ** | ** | ** | 72.00 | 74.00 | 67.00 | 37.00 | 6 |
| 7 | ** | ** | ** | ** | ** | ** | ** | ** | 72.00 | 74.00 | 65.00 | 36.00 | 7 |
| 8 | ** | ** | ** | ** | ** | ** | ** | ** | 72.00 | 73.00 | 63.00 | 36.00 | 8 |
| 9 | ** | ** | ** | ** | ** | ** | ** | ** | 72.00 | 73.00 | 61.00 | 36.00 | 9 |
| 10 | ** | ** | ** | ** | ** | ** | ** | ** | 72.00 | 72.00 | 59.00 | 36.00 | 10 |
| 11 | ** | ** | ** | ** | ** | ** | ** | ** | 72.00 | 72.00 | 57.00 | 36.00 | 11 |
| 12 | ** | ** | ** | ** | ** | ** | ** | ** | 72.00 | 71.00 | 55.00 | 36.00 | 12 |
| 13 | ** | ** | ** | ** | ** | ** | ** | ** | 72.00 | 71.00 | 53.00 | 36.00 | 13 |
| 14 | ** | ** | ** | ** | ** | ** | ** | ** | 72.00 | 70.00 | 51.00 | 36.00 | 14 |
| 15 | ** | ** | ** | ** | ** | ** | ** | ** | 72.00 | 69.00 | 68.00 | 35.00 | 15 |
| 16 | ** | ** | ** | ** | ** | ** | ** | ** | 72.00 | 68.00 | 66.00 | 35.00 | 16 |
| 17 | ** | ** | ** | ** | ** | ** | ** | ** | 72.00 | 67.00 | 64.00 | 35.00 | 17 |
| 18 | ** | ** | ** | ** | ** | ** | ** | 25.00 | 72.00 | 66.00 | 62.00 | 34.00 | 18 |
| 19 | ** | ** | ** | ** | ** | ** | ** | 25.00 | 72.00 | 65.00 | 60.00 | 34.00 | 19 |
| 20 | ** | ** | ** | ** | ** | ** | ** | 35.00 | 73.00 | 64.00 | 58.00 | 34.00 | 20 |
| 21 | ** | ** | ** | ** | ** | ** | ** | 35.00 | 74.00 | 63.00 | 56.00 | 34.00 | 21 |
| 22 | ** | ** | ** | ** | ** | ** | ** | 50.00 | 75.00 | 62.00 | 54.00 | 34.00 | 22 |
| 23 | ** | ** | ** | ** | ** | ** | ** | 50.00 | 76.00 | 62.00 | 53.00 | 34.00 | 23 |
| 24 | ** | ** | ** | ** | ** | ** | ** | 70.00 | 76.00 | 61.00 | 52.00 | 32.00 | 24 |
| 25 | ** | ** | ** | ** | ** | ** | ** | 72.00 | 76.00 | 61.00 | 51.00 | 30.00 | 25 |
| 26 | ** | ** | ** | ** | ** | ** | ** | 72.00 | 76.00 | 60.00 | 49.00 | 28.00 | 26 |
| 27 | ** | ** | ** | ** | ** | ** | ** | 72.00 | 76.00 | 59.00 | 47.00 | 8.00 | 27 |
| 28 | ** | ** | ** | ** | ** | ** | ** | 72.00 | 76.00 | 58.00 | 45.00 | 8.00 | 28 |
| 29 | ** | ** | ** | ** | ** | ** | 72.00 | 76.00 | 57.00 | 43.00 | 8.00 | 29 | |
| 30 | ** | ** | ** | ** | ** | ** | 72.00 | 76.00 | 56.00 | 41.00 | 8.00 | 30 | |
| 31 | ** | ** | ** | ** | 72.00 | 56.00 | 39.00 | 31 | |||||
| TOTAL | ** | ** | ** | ** | ** | ** | ** | 794.00* | 2198.00 | 2082.00 | 1793.00 | 944.00 | |
| MEAN | ** | ** | ** | ** | ** | ** | ** | 56.71* | 73.27 | 67.16 | 57.84 | 31.47 | |
| AC-FT | ** | ** | ** | ** | ** | ** | ** | 1574.88* | 4359.67 | 4129.58 | 3556.36 | 1872.40 | |
Source: Wyoming Water Resources Data System, March 20, 2000.
Pole Creek Number 2 Ditch, East Fork New Fork River
Diversion Description: Diversion consists of three 36" slide gates mounted on sections of CMP culvert.1
Conveyance Description: Open Channel Canal, approximately 3 miles in length.1
Wyoming Water Rights Summary:
| Priority Date (M-D-Y) | Permit Number |
Permitted Use | Acres | Flow (cfs) |
Cumulative Flow (cfs) | Comments |
| 06-10-1899 | 2161 | Irrigation | 1,568.00 | 22.65 | 22.65 | |
| 05-21-1908 | 1875E | Domestic, Irrigation, Stock | 234.00 | 3.33 | 25.98 |
Storage Rights: None.
Estimated Canal Losses: Greater than typical losses (25%) are experienced due to the presence of cobbles in the soil.1
Irrigation Practices: Lands are flood irrigated.1
Crop Types / Consumptive Use: Lands are native grass hay and pasture.1
Return Flows: Return flows are delivered to East Fork River at Muddy Creek.2
Other Operational Information: The canal is typically turned on the first of May and off in mid-July.1
|
Pole Creek Number 2 Ditch, East Fork New Fork River, Diversion Data
| Wateryear | May | June | July | August | September | |||||
| Average (cfs) | Monthly Total (AF) | Average (cfs) | Monthly Total (AF) | Average (cfs) | Monthly Total (AF) | Average (cfs) | Monthly Total (AF) | Average (cfs) | Monthly Total (AF) | |
| 1976 | 0.96 | 57.09 | 1.02 | 62.61 | ||||||
| 1978 | 81.90 | 4,873.39 | 83.71 | 5,147.10 | 21.52 | 1,323.00 | 19.40 | 1,154.40 | ||
| 1980 | 53.62 | 3,296.97 | 45.90 | 2,731.24 | ||||||
| 1981 | ||||||||||
| 1982 | 65.33 | 3,887.40 | 35.47 | 2,180.97 | 9.09 | 558.92 | ||||
| 1983 | 51.10 | 3,040.66 | 41.46 | 2,549.28 | ||||||
| 1984 | 46.43 | 2,762.78 | 24.72 | 1,519.97 | 0.00 | 0.00 | ||||
| 1985 | 13.40 | 823.93 | 61.28 | 3,646.41 | 40.63 | 2,498.24 | 1.94 | 119.29 | ||
| 1986 | ||||||||||
| 1987 | 16.31 | 1,002.86 | 2.67 | 158.88 | 16.20 | 996.10 | ||||
| 1988 | 19.79 | 1,216.84 | 55.17 | 3,282.84 | 32.68 | 2,009.41 | ||||
| 1989 | ||||||||||
| 1990 | 5.11 | 304.07 | ||||||||
| 1991 | 20.14 | 1,238.36 | 35.75 | 2,127.27 | ||||||
| 1992 | 20.79 | 1,237.09 | ||||||||
| 1993 | 22.93 | 1,364.43 | 39.98 | 2,458.27 | 19.84 | 1,219.91 | 0.95 | 56.53 | ||
| 1994 | 10.09 | 620.41 | 30.59 | 1,820.23 | 22.54 | 1,385.93 | 1.14 | 70.10 | 2.17 | 129.12 |
| 1995 | 9.97 | 613.03 | 26.09 | 1,552.46 | 17.83 | 1,096.32 | 2.42 | 148.80 | ||
| 1996 | 22.00 | 1,352.73 | ||||||||
| 1997 | ||||||||||
| 1998 | 36.43 | 2,167.44 | 46.50 | 2,859.09 | 0.77 | 47.36 | ||||
| Averages: | 14.95 | 919.24 | 37.26 | 2,223.71 | 34.81 | 2,140.26 | 186.30 | 498.16 | 7.51 | 446.68 |
Data:
1980: 6/9, 85 cfs; 6/17, 67 cfs; 6/28, 74 cfs; 7/7, 80 cfs; 7/17, 45 cfs; 7/29, off.
1981: 5/27, 30 cfs; 7/20, 40 cfs; 8/4, off.
1982: 5/24, 42 cfs; 6/18, 75 cfs; 6/30, 61 cfs; 7/9, 37 cfs; 7/16, 37 cfs; 7/22, 30 cfs; 8/27, off.
1983: 5/25, 3 cfs (est); 6/7, 37 cfs; 6/17, 43 cfs; 6/24, 77 cfs; 6/28, 78 cfs; 7/12, 60 cfs; 7/19, 45 cfs; 7/27, off.
1984: 5/17, 1 cfs (est); 5/30, 2 cfs (est); 6/12, 55 cfs; 6/18, 80 cfs; 6/25, 78 cfs; 7/2, 85 cfs; 7/13, 67 cfs; 7/23, 8/20, off.
1985: 5/15, 2 cfs (est); 6/2, 49.5 cfs; 6/27, 71.5 cfs; 7/16, 52.0 cfs; 7/30, 8/22, off; 8/28, 20.0 cfs.
1986: 6/17, 85.6 cfs; 9/12, off.
1987: 5/13, 47.6 cfs; 6/2, 3.4 cfs; 6/18, 57 cfs; 8/3, off; 9/8, 43 cfs
1988: 5/13, 23 cfs; 6/26, 66 cfs; 7/5, 52 cfs; 8/5, 0 cfs.
1990: 6/6, 8.6 cfs; 7/12, 1.5 cfs.
1991: 5/9, 8.95 cfs; 6/19, 73.83 cfs.
1992: 4/8, 2.00 cfs; 5/27, 18.00 cfs; 6/3, 25.00 cfs; 7/14, 12.00 cfs; 9/2, 2.00 cfs.
1993: 5/19, 15.80 cfs; 6/21, 21.90 cfs; 7/8, 45.00 cfs; 7/30, 35.50 cfs; 8/6, 40.00 cfs; 8/25, 2.50 cfs; 9/1, 3.00 cfs; 9/20, off.
1994: 5/12, 10.00 cfs; 5/26, 18.80 cfs; 6/1, 18.30 cfs; 6/7, 33.90 cfs; 6/14, 35.00 cfs; 6/22, 30.00 cfs; 7/25, 21.80 cfs; 8/5, 8/23, off; 8/30, 3.50 cfs; 9/8, 4.00 cfs; 9/19, 3.00 cfs.
1995: 4/16, 4/17, off; 5/4, 4.0 cfs; 5/10, 5.0 cfs; 5/31, 19.0 cfs (est); 6/5, 18.8 cfs; 6/27, 33.8 cfs; 8/3, 3.5 cfs (est); 9/14, off.
1996: 5/1, 9.0 cfs (est); 5/13, 12.0 cfs (est); 7/1, 44 cfs (est); 8/1, off.
1997: 8/15, off.
1998: 6/16, 72.6 cfs; 7/10, 73.4 cfs; 7/31, 1 cfs (est); 8/21, 1.37 cfs.
Supply: 1980, below average; 1981, slightly below average; 1982, average (late peak); 1983, above average; 1984, above average; 1985, below average; 1986, average to slightly above average; 1988: very below average; 1989, below average; 1990, below average; 1991, slightly below average; 1992, below average; 1993, average; 1994, below average; 1995, average to above average; 1996, average; 1997, average; 1998, average to above average.
Source: State Engineer's Office, Annual Hydrographers' Reports.
| POLE CREEK NO.2 DITCH | STATION NO. 006090.00 |
| LATITUDE 42-51-31 LONGITUDE 109-45-06 | |
| ELEVATION UNKNOWN DRAINAGE AREA UNKNOWN | |
| NONCONTRIBUTING AREA UNKNOWN BASIN 15570410 | |
| SUBLETTE COUNTY DATA FROM WATER COMMISSIONERS (P) |
| MEAN DAILY FLOW IN CFS BY WATER YEAR | |||||||||||||
| 1976 | |||||||||||||
| DAY | OCT | NOV | DEC | JAN | FEB | MAR | APR | MAY | JUNE | JULY | AUG | SEPT | DAY |
| 1 | ** | ** | ** | ** | ** | ** | ** | ** | 14.00 | 66.00 | 49.00 | ** | 1 |
| 2 | ** | ** | ** | ** | ** | ** | ** | ** | 16.00 | 66.00 | 47.00 | 4.00 | 2 |
| 3 | ** | ** | ** | ** | ** | ** | ** | ** | 45.00 | 67.00 | 45.00 | ** | 3 |
| 4 | ** | ** | ** | ** | ** | ** | ** | ** | 46.00 | 67.00 | 43.00 | ** | 4 |
| 5 | ** | ** | ** | ** | ** | ** | ** | ** | 47.50 | 68.00 | 41.00 | ** | 5 |
| 6 | ** | ** | ** | ** | ** | ** | ** | ** | 49.00 | 68.00 | 39.00 | ** | 6 |
| 7 | ** | ** | ** | ** | ** | ** | ** | ** | 53.00 | 68.00 | 37.00 | ** | 7 |
| 8 | ** | ** | ** | ** | ** | ** | ** | ** | 55.00 | 68.00 | 35.00 | ** | 8 |
| 9 | ** | ** | ** | ** | ** | ** | ** | ** | 57.00 | 68.00 | 33.00 | ** | 9 |
| 10 | ** | ** | ** | ** | ** | ** | ** | ** | 57.00 | 68.00 | 31.00 | ** | 10 |
| 11 | ** | ** | ** | ** | ** | ** | ** | ** | 57.00 | 67.00 | ** | ** | 11 |
| 12 | ** | ** | ** | ** | ** | ** | ** | ** | 58.00 | 66.00 | ** | ** | 12 |
| 13 | ** | ** | ** | ** | ** | ** | ** | ** | 58.00 | 65.00 | ** | ** | 13 |
| 14 | ** | ** | ** | ** | ** | ** | ** | ** | 58.00 | 64.00 | ** | ** | 14 |
| 15 | ** | ** | ** | ** | ** | ** | ** | ** | 58.00 | 64.00 | ** | 2.00 | 15 |
| 16 | ** | ** | ** | ** | ** | ** | ** | ** | 58.00 | 64.00 | ** | ** | 16 |
| 17 | ** | ** | ** | ** | ** | ** | ** | ** | 59.00 | 63.00 | ** | ** | 17 |
| 18 | ** | ** | ** | ** | ** | ** | ** | ** | 60.00 | 63.00 | ** | ** | 18 |
| 19 | ** | ** | ** | ** | ** | ** | ** | ** | 62.00 | 62.00 | ** | ** | 19 |
| 20 | ** | ** | ** | ** | ** | ** | ** | ** | 64.00 | 62.00 | ** | ** | 20 |
| 21 | ** | ** | ** | ** | ** | ** | ** | ** | 66.00 | 61.00 | ** | ** | 21 |
| 22 | ** | ** | ** | ** | ** | ** | ** | ** | 68.00 | 61.00 | ** | ** | 22 |
| 23 | ** | ** | ** | ** | ** | ** | ** | ** | 70.00 | 60.00 | ** | ** | 23 |
| 24 | ** | ** | ** | ** | ** | ** | ** | ** | 70.00 | 60.00 | ** | ** | 24 |
| 25 | ** | ** | ** | ** | ** | ** | ** | ** | 70.00 | 59.00 | 2.00 | ** | 25 |
| 26 | ** | ** | ** | ** | ** | ** | ** | 4.00 | 69.00 | 58.00 | ** | ** | 26 |
| 27 | ** | ** | ** | ** | ** | ** | ** | 6.00 | 68.00 | 57.00 | ** | ** | 27 |
| 28 | ** | ** | ** | ** | ** | ** | ** | 8.00 | 67.00 | 56.00 | ** | ** | 28 |
| 29 | ** | ** | ** | ** | ** | ** | ** | 10.00 | 67.00 | 54.00 | ** | ** | 29 |
| 30 | ** | ** | ** | ** | ** | ** | 12.00 | 66.10 | 51.00 | ** | ** | 30 | |
| 31 | ** | ** | ** | ** | 14.00 | 50.00 | ** | 31 | |||||
| TOTAL | ** | ** | ** | ** | ** | ** | ** | 54.00* | 1712.60 | 1941.00 | 402.00* | 6.00* | |
| MEAN | ** | ** | ** | ** | ** | ** | ** | 9.00* | 57.09 | 62.61 | 36.55* | 3.00* | |
| AC-FT | ** | ** | ** | ** | ** | ** | ** | 107.11* | 3396.89 | 3849.92 | 797.35* | 11.90* | |
| POLE CREEK NO.2 DITCH | STATION NO. 006090.00 |
| LATITUDE 42-51-31 LONGITUDE 109-45-06 | |
| ELEVATION UNKNOWN DRAINAGE AREA UNKNOWN | |
| NONCONTRIBUTING AREA UNKNOWN BASIN 15570410 | |
| SUBLETTE COUNTY DATA FROM WATER COMMISSIONERS (P) |
| MEAN DAILY FLOW IN CFS BY WATER YEAR | |||||||||||||
| 1978 | |||||||||||||
| DAY | OCT | NOV | DEC | JAN | FEB | MAR | APR | MAY | JUNE | JULY | AUG | SEPT | DAY |
| 1 | ** | ** | ** | ** | ** | ** | ** | ** | 72.00 | 80.00 | 26.00 | 21.00 | 1 |
| 2 | ** | ** | ** | ** | ** | ** | ** | ** | 74.00 | 81.00 | 26.00 | 21.00 | 2 |
| 3 | ** | ** | ** | ** | ** | ** | ** | ** | 76.00 | 82.00 | 26.00 | 20.00 | 3 |
| 4 | ** | ** | ** | ** | ** | ** | ** | ** | 78.00 | 83.00 | 26.00 | 20.00 | 4 |
| 5 | ** | ** | ** | ** | ** | ** | ** | ** | 80.00 | 84.00 | 26.00 | 20.00 | 5 |
| 6 | ** | ** | ** | ** | ** | ** | ** | ** | 82.00 | 85.00 | 26.00 | 20.00 | 6 |
| 7 | ** | ** | ** | ** | ** | ** | ** | ** | 84.00 | 85.00 | 25.00 | 20.00 | 7 |
| 8 | ** | ** | ** | ** | ** | ** | ** | ** | 86.00 | 86.00 | 25.00 | 20.00 | 8 |
| 9 | ** | ** | ** | ** | ** | ** | ** | ** | 86.00 | 87.00 | 24.00 | 20.00 | 9 |
| 10 | ** | ** | ** | ** | ** | ** | ** | ** | 86.00 | 88.00 | 24.00 | 20.00 | 10 |
| 11 | ** | ** | ** | ** | ** | ** | ** | ** | 86.00 | 89.00 | 23.00 | 20.00 | 11 |
| 12 | ** | ** | ** | ** | ** | ** | ** | ** | 86.00 | 90.00 | 23.00 | 20.00 | 12 |
| 13 | ** | ** | ** | ** | ** | ** | ** | ** | 87.00 | 90.00 | 22.00 | 20.00 | 13 |
| 14 | ** | ** | ** | ** | ** | ** | ** | ** | 87.00 | 90.00 | 22.00 | 20.00 | 14 |
| 15 | ** | ** | ** | ** | ** | ** | ** | ** | 86.00 | 90.00 | 21.00 | 20.00 | 15 |
| 16 | ** | ** | ** | ** | ** | ** | ** | ** | 85.00 | 90.00 | 20.00 | 20.00 | 16 |
| 17 | ** | ** | ** | ** | ** | ** | ** | ** | 85.00 | 90.00 | 20.00 | 20.00 | 17 |
| 18 | ** | ** | ** | ** | ** | ** | ** | ** | 84.00 | 90.00 | 19.00 | 20.00 | 18 |
| 19 | ** | ** | ** | ** | ** | ** | ** | ** | 84.00 | 90.00 | 18.00 | 19.00 | 19 |
| 20 | ** | ** | ** | ** | ** | ** | ** | ** | 83.00 | 90.00 | 18.00 | 19.00 | 20 |
| 21 | ** | ** | ** | ** | ** | ** | ** | 50.00 | 83.00 | 90.00 | 18.00 | 19.00 | 21 |
| 22 | ** | ** | ** | ** | ** | ** | ** | 52.00 | 82.00 | 88.00 | 18.00 | 19.00 | 22 |
| 23 | ** | ** | ** | ** | ** | ** | ** | 54.00 | 82.00 | 86.00 | 18.00 | 19.00 | 23 |
| 24 | ** | ** | ** | ** | ** | ** | ** | 56.00 | 81.00 | 82.00 | 18.00 | 18.00 | 24 |
| 25 | ** | ** | ** | ** | ** | ** | ** | 58.00 | 80.00 | 80.00 | 18.00 | 18.00 | 25 |
| 26 | ** | ** | ** | ** | ** | ** | ** | 60.00 | 79.00 | 78.00 | 18.00 | 18.00 | 26 |
| 27 | ** | ** | ** | ** | ** | ** | ** | 62.00 | 78.00 | 76.00 | 19.00 | 18.00 | 27 |
| 28 | ** | ** | ** | ** | ** | ** | ** | 64.00 | 78.00 | 73.00 | 19.00 | 18.00 | 28 |
| 29 | ** | ** | ** | ** | ** | ** | 66.00 | 78.00 | 70.00 | 20.00 | 18.00 | 29 | |
| 30 | ** | ** | ** | ** | ** | ** | 68.00 | 79.00 | 67.00 | 20.00 | 17.00 | 30 | |
| 31 | ** | ** | ** | ** | 70.00 | 65.00 | 21.00 | 31 | |||||
| TOTAL | ** | ** | ** | ** | ** | ** | ** | 660.00* | 2457.00 | 2595.00 | 667.00 | 582.00 | |
| MEAN | ** | ** | ** | ** | ** | ** | ** | 60.00* | 81.90 | 83.71 | 21.52 | 19.40 | |
| AC-FT | ** | ** | ** | ** | ** | ** | ** | 1309.09* | 4873.39 | 5147.10 | 1322.97 | 1154.38 | |
Source: Wyoming Water Resources Data System, March 20, 2000.
Rocky Mountain Ditch, East Fork New Fork River
Diversion Description: Diversion consists of a single 18" slide gate. No diversion dam exists.1
Conveyance Description: Open Channel Canal, approximately 3 miles in length.1
Wyoming Water Rights Summary:
| Priority Date (M-D-Y) | Permit Number |
Permitted Use | Acres | Flow (cfs) |
Cumulative Flow (cfs) | Comments |
| 06-06-1898 | 1851 | Irrigation | 299.00 | 4.25 | 4.25 | |
| 05-31-1899 | 434E | Irrigation | 289.00 | 4.12 | 8.37 | |
| 05-23-1900 | 539E | Irrigation | 415.00 | 5.89 | 14.26 | |
| 11-14-1901 | 740E | Irrigation | 78.00 | 1.11 | 15.37 | |
| 08-20-1909 | 2173E | Irrigation | 192.00 | 2.74 | 18.11 | Permitted Source "East Fork New Fork River and Cottonwood Creek" |
Storage Rights: None.
Estimated Canal Losses: Information not available at time of report.
Irrigation Practices: Information not available at time of report.
Crop Types / Consumptive Use: Information not available at time of report.
Return Flows: Return flows are delivered to Cottonwood Creek above East Fork River.2
Other Operational Information: Information not available at time of report.
|
Rocky Mountain Ditch, East Fork New Fork River, Diversion Data
| Wateryear | May | June | July | August | September | |||||
| Average (cfs) | Monthly Total (AF) | Average (cfs) | Monthly Total (AF) | Average (cfs) | Monthly Total (AF) | Average (cfs) | Monthly Total (AF) | Average (cfs) | Monthly Total (AF) | |
| 1980 | ||||||||||
| 1981 | ||||||||||
| 1982 | ||||||||||
| 1983 | ||||||||||
| 1984 | ||||||||||
| 1985 | 7.50 | 460.96 | ||||||||
| 1986 | ||||||||||
| 1987 | ||||||||||
| 1988 | ||||||||||
| 1989 | ||||||||||
| 1990 | ||||||||||
| 1991 | ||||||||||
| 1992 | 17.79 | 1,058.58 | ||||||||
| 1993 | ||||||||||
| 1994 | 22.72 | 1,397.00 | 20.84 | 1,240.07 | 12.40 | 762.45 | 0.70 | 43.04 | ||
| 1995 | 13.65 | 839.31 | 26.21 | 1,559.60 | 30.04 | 1,847.09 | 13.90 | 854.68 | ||
| 1996 | ||||||||||
| 1997 | ||||||||||
| 1998 | ||||||||||
| Averages: | 18.19 | 1,118.15 | 22.00 | 1,309.09 | 16.65 | 1,023.43 | 7.30 | 448.86 | ||
Data:
1981: 7/6, 15 cfs; 10/2, 7 cfs.
1985: 7/7, 20.8 cfs; 7/8, 18.5 cfs; 7/31, off; 8/6, off; 8/14, 1.0 cfs (est); 9/25, 0.5 cfs (est).
1988: 4/12, 0 cfs; 6/18, 15 cfs; 6/26, 20.6 cfs; 6/27, 15.4 cfs.
1989: 4/21, 15 cfs; 5/3, 13 cfs; 6/26, 28 cfs; 8/3, 1 cfs.
1990: 7/11, 15.0 cfs (est).
1992: 5/29, 18.00 cfs; 6/8, 30.00 cfs; 6/10, 15.00 cfs; 6/11, 15.00 cfs; 7/10, 14.00 cfs.
1993: 4/29, 5/3, off; 6/14, 36.30 cfs; 7/27, off, 9/2, 2.00 cfs.
1994: 5/3, 15.00 cfs; 5/23, 29.80 cfs; 6/19, 21.90 cfs; 6/20, 15.00 cfs; 7/18, 15.00 cfs; 8/4, 1.00 cfs; 9/3, off.
1995: 4/10, off; 4/26, 2.5 cfs; 5/24, 18.0 cfs; 6/26, 30.0 cfs (est); 7/6, 30 cfs; 7/17, 34.1 cfs; 8/16, 12 cfs; 8/30, 12 cfs.
1996: 5/4, off; 6/26, 39 cfs (est).
Supply: 1980, below average; 1981, slightly below average; 1982, average (late peak); 1983, above average; 1984, above average; 1985, below average; 1986, average to slightly above average; 1988: very below average; 1989, below average; 1990, below average; 1991, slightly below average; 1992, below average; 1993, average; 1994, below average; 1995, average to above average; 1996, average; 1997, average; 1998, average to above average.
Source: State Engineer's Office, Annual Hydrographers' Reports.
Sill, Ditch, West Fork New Fork River
Diversion Description: Diversion consists of a wood stop log headgate. No diversion dam exists.1
Conveyance Description: Open Channel Canal, approximately 2 miles in length.1
Wyoming Water Rights Summary:
| Priority Date (M-D-Y) | Permit Number |
Permitted Use | Acres | Flow (cfs) |
Cumulative Flow (cfs) | Comments |
| 06-02-1898 | 1849 | Irrigation | 560.00 | 7.95 | 7.95 | |
| 11-01-1901 | 729E | Irrigation | 190.00 | 2.71 | 10.66 | |
| 06-04-1903 | 1140E | Irrigation | 329.00 | 4.67 | 15.33 | |
| 06-28-1906 | 1571E | Irrigation | 271.00 | 3.87 | 19.20 | |
| 07-05-1907 | 1762E | Irrigation | 49.00 | 0.70 | 19.90 |
Storage Rights: None.
Estimated Canal Losses: Information not available at time of report.
Irrigation Practices: Information not available at time of report.
Crop Types / Consumptive Use: Information not available at time of report.
Return Flows: Return flows are delivered to West Fork New Fork River above Pole Creek.2
Other Operational Information: Information not available at time of report.
|
Sill Ditch, West Fork New Fork River, Diversion Data
| Wateryear | May | June | July | August | September | |||||
| Average (cfs) | Monthly Total (AF) | Average (cfs) | Monthly Total (AF) | Average (cfs) | Monthly Total (AF) | Average (cfs) | Monthly Total (AF) | Average (cfs) | Monthly Total (AF) | |
| 1976 | 31.33 | 1,864.26 | 33.52 | 2,060.83 | 13.65 | 839.01 | 2.27 | 134.88 | ||
| 1980 | 39.77 | 2,366.48 | 35.71 | 2,195.72 | ||||||
| 1981 | 25.75 | 1,532.23 | 25.71 | 1,580.85 | ||||||
| 1982 | 36.88 | 2,194.51 | 45.37 | 2,789.69 | 11.01 | 676.98 | 0.00 | 0.00 | ||
| 1983 | 45.39 | 2,700.89 | 37.16 | 2,284.88 | ||||||
| 1984 | 42.06 | 2,502.74 | 17.96 | 1,104.32 | ||||||
| 1985 | 13.40 | 823.93 | 48.75 | 2,900.83 | 33.84 | 2,080.74 | ||||
| 1986 | 23.87 | 1,470.27 | ||||||||
| 1987 | 32.63 | 1,941.62 | ||||||||
| 1988 | ||||||||||
| 1989 | 22.76 | 1,354.31 | 16.55 | 1,017.62 | ||||||
| 1990 | 34.62 | 2,060.03 | ||||||||
| 1991 | ||||||||||
| 1992 | ||||||||||
| 1993 | ||||||||||
| 1994 | 10.58 | 650.54 | 21.72 | 1,292.43 | 23.55 | 1,448.03 | 7.73 | 475.30 | ||
| 1995 | 13.72 | 843.61 | 31.13 | 1,852.36 | 36.11 | 2,220.32 | ||||
| 1996 | 21.79 | 1,339.81 | ||||||||
| 1997 | ||||||||||
| 1998 | ||||||||||
| Averages: | 12.15 | 747.07 | 33.59 | 1,998.69 | 29.75 | 1,829.35 | 10.80 | 663.76 | 1.13 | 67.44 |
Data:
1980: 5/28, 21 cfs; 6/4, 34 cfs; 6/17, 42 cfs; 6/27, 44 cfs; 7/17, 43 cfs; 7/25, 37 cfs; 7/30, off.
1981: 6/9, 30 cfs; 7/7, 43 cfs; 7/24, 15 cfs; 7/30, 2 cfs; 8/7, off.
1982: 5/24, 28 cfs; 6/9, 34 cfs; 6/18, 28 cfs; 6/24, 49 cfs; 6/29, 47 cfs; 7/7, 56 cfs; 7/19, 46 cfs; 8/5, 22 cfs; 8/27, 9/24, off.
1983: 5/31, 29 cfs; 6/3, 30 cfs; 6/22, 55 cfs; 6/27, 55 cfs; 7/7, 55 cfs; 7/11, 48 cfs; 7/19, 39 cfs; 7/27, 28 cfs.
1984: 5/22, 10 cfs; 5/30, 8 cfs; 6/11, 49 cfs; 6/27, 47 cfs; 7/3, 37 cfs; 7/10, 38 cfs; 7/11, 36 cfs; 7/21, off.
1985: 5/23, 14.2 cfs; 6/6, 42.7 cfs; 6/27, 57.5 cfs; 7/22, 33.5 cfs; 7/30, off.
1986: 5/22, 31.5 cfs; 6/18, 47 cfs.
1987: 5/13, 2 cfs; 6/1, 38 cfs; 6/23, 51 cfs.
1989: 6/15, 52 cfs; 7/3, 31 cfs; 8/1, 0 cfs.
1990: 5/21, 6.2 cfs; 6/13, 38.0 cfs (est); 6/29, 38.0 cfs (est); 7/7, 31.0 cfs (est).
1993: 6/3, 43.30 cfs; 8/4, off.
1994: 5/13, 15.60 cfs; 6/13, 21.00 cfs; 7/2, 25.00 cfs; 7/22, 25.00 cfs; 8/15, 3.50 cfs; 9/7, 9.50 cfs.
1995: 4/12, 6.0 cfs; 5/25, 15.5 cfs; 6/7, 20.0 cfs; 6/21, 40 cfs (est); 7/18, 40 cfs (est); 8/9, 15 cfs (est).
1996: 6/25, 44.1 cfs; 7/25, 16.0 cfs (est).
Supply: 1980, below average; 1981, slightly below average; 1982, average (late peak); 1983, above average; 1984, above average; 1985, below average; 1986, average to slightly above average; 1988: very below average; 1989, below average; 1990, below average; 1991, slightly below average; 1992, below average; 1993, average; 1994, below average; 1995, average to above average; 1996, average; 1997, average; 1998, average to above average.
Source: State Engineer's Office, Annual Hydrographers' Reports.
| SILL DITCH | STATION NO. 006065.00 |
| LATITUDE 42-50-39 LONGITUDE 109-52-13 | |
| NE1/4 SW1/4 NW1/4 SECTION 9 TOWNSHIP 33N, RANGE 109W 6TH P.M. | |
| ELEVATION 7150.00 FT DRAINAGE AREA UNKNOWN | |
| NONCONTRIBUTING AREA UNKNOWN BASIN 15570000 | |
| SUBLETTE COUNTY DATA FROM WATER COMMISSIONERS (P) |
| MEAN DAILY FLOW IN CFS BY WATER YEAR | |||||||||||||
| 1976 | |||||||||||||
| DAY | OCT | NOV | DEC | JAN | FEB | MAR | APR | MAY | JUNE | JULY | AUG | SEPT | DAY |
| 1 | ** | ** | ** | ** | ** | ** | ** | ** | 25.00 | 36.00 | 21.00 | 6.00 | 1 |
| 2 | ** | ** | ** | ** | ** | ** | ** | ** | 25.00 | 37.00 | 20.00 | 5.00 | 2 |
| 3 | ** | ** | ** | ** | ** | ** | ** | ** | 25.00 | 37.00 | 19.00 | 3.00 | 3 |
| 4 | ** | ** | ** | ** | ** | ** | ** | ** | 25.00 | 38.00 | 18.00 | 2.00 | 4 |
| 5 | ** | ** | ** | ** | ** | ** | ** | ** | 25.00 | 38.00 | 17.00 | 2.00 | 5 |
| 6 | ** | ** | ** | ** | ** | ** | ** | ** | 26.00 | 38.00 | 16.00 | 2.00 | 6 |
| 7 | ** | ** | ** | ** | ** | ** | ** | ** | 27.00 | 38.00 | 15.00 | 2.00 | 7 |
| 8 | ** | ** | ** | ** | ** | ** | ** | ** | 29.00 | 38.00 | 15.00 | 2.00 | 8 |
| 9 | ** | ** | ** | ** | ** | ** | ** | ** | 31.50 | 38.00 | 15.00 | 2.00 | 9 |
| 10 | ** | ** | ** | ** | ** | ** | ** | ** | 33.00 | 38.00 | 15.00 | 2.00 | 10 |
| 11 | ** | ** | ** | ** | ** | ** | ** | ** | 35.00 | 38.00 | 15.00 | 2.00 | 11 |
| 12 | ** | ** | ** | ** | ** | ** | ** | ** | 35.00 | 37.00 | 15.00 | 2.00 | 12 |
| 13 | ** | ** | ** | ** | ** | ** | ** | ** | 33.00 | 37.00 | 14.00 | 2.00 | 13 |
| 14 | ** | ** | ** | ** | ** | ** | ** | ** | 31.00 | 36.00 | 14.00 | 2.00 | 14 |
| 15 | ** | ** | ** | ** | ** | ** | ** | ** | 31.00 | 36.00 | 14.00 | 2.00 | 15 |
| 16 | ** | ** | ** | ** | ** | ** | ** | ** | 32.00 | 35.00 | 13.00 | 2.00 | 16 |
| 17 | ** | ** | ** | ** | ** | ** | ** | ** | 33.00 | 35.00 | 13.00 | 2.00 | 17 |
| 18 | ** | ** | ** | ** | ** | ** | ** | ** | 34.00 | 34.00 | 13.00 | 2.00 | 18 |
| 19 | ** | ** | ** | ** | ** | ** | ** | ** | 35.00 | 34.00 | 12.00 | 2.00 | 19 |
| 20 | ** | ** | ** | ** | ** | ** | ** | 20.00 | 35.00 | 33.00 | 12.00 | 2.00 | 20 |
| 21 | ** | ** | ** | ** | ** | ** | ** | 20.00 | 34.00 | 33.00 | 12.00 | 2.00 | 21 |
| 22 | ** | ** | ** | ** | ** | ** | ** | 21.00 | 33.00 | 32.00 | 12.00 | 2.00 | 22 |
| 23 | ** | ** | ** | ** | ** | ** | ** | 21.00 | 33.00 | 32.00 | 12.00 | 2.00 | 23 |
| 24 | ** | ** | ** | ** | ** | ** | ** | 22.00 | 32.40 | 31.00 | 12.00 | 2.00 | 24 |
| 25 | ** | ** | ** | ** | ** | ** | ** | 22.00 | 32.00 | 31.00 | 12.00 | 2.00 | 25 |
| 26 | ** | ** | ** | ** | ** | ** | ** | 23.40 | 33.00 | 29.00 | 12.00 | 2.00 | 26 |
| 27 | ** | ** | ** | ** | ** | ** | ** | 24.00 | 33.00 | 27.00 | 11.00 | 2.00 | 27 |
| 28 | ** | ** | ** | ** | ** | ** | ** | 24.00 | 34.00 | 25.00 | 10.00 | 2.00 | 28 |
| 29 | ** | ** | ** | ** | ** | ** | ** | 24.00 | 35.00 | 23.00 | 9.00 | 2.00 | 29 |
| 30 | ** | ** | ** | ** | ** | ** | 24.00 | 35.00 | 23.00 | 8.00 | 2.00 | 30 | |
| 31 | ** | ** | ** | ** | 25.00 | 22.00 | 7.00 | 31 | |||||
| TOTAL | ** | ** | ** | ** | ** | ** | ** | 270.40* | 939.90 | 1039.00 | 423.00 | 68.00 | |
| MEAN | ** | ** | ** | ** | ** | ** | ** | 22.53* | 31.33 | 33.52 | 13.65 | 2.27 | |
| AC-FT | ** | ** | ** | ** | ** | ** | ** | 536.33* | 1864.26 | 2060.83 | 839.01 | 134.88 | |
Source: Wyoming Water Resources Data System, March 20, 2000.
Tibbals Ditch, East Fork New Fork River
Diversion Description: Diversion consists of a single 40" wide wood plank stop log structure.1
Conveyance Description: Open Channel Canal, approximately 2 1/2 miles in length.1
Wyoming Water Rights Summary:
| Priority Date (M-D-Y) | Permit Number |
Permitted Use | Acres | Flow (cfs) |
Cumulative Flow (cfs) | Comments |
| 11-25-1901 | 3559 | Irrigation | 1,417.66 | 20.25 | 20.25 | |
| 06-18-1908 | 1916E | Irrigation | 28.00 | 0.40 | 20.65 |
Storage Rights: None.
Estimated Canal Losses: Typical losses (10%) are experienced.1
Irrigation Practices: Lands are flood irrigated.1
Crop Types / Consumptive Use: Lands are native grass hay and pasture.1
Return Flows: Return flows are delivered to East Fork River at Muddy Creek.2
Other Operational Information: The canal is typically turned on the first of May and off in mid-July.1
|
Tibbals Ditch, East Fork New Fork River, Diversion Data
| Wateryear | May | June | July | August | September | |||||
| Average (cfs) | Monthly Total (AF) | Average (cfs) | Monthly Total (AF) | Average (cfs) | Monthly Total (AF) | Average (cfs) | Monthly Total (AF) | Average (cfs) | Monthly Total (AF) | |
| 1975 | 4.19 | 257.65 | 35.37 | 2,104.76 | 41.96 | 2,580.30 | 10.61 | 652.34 | 3.62 | 215.42 |
| 1976 | 8.74 | 537.12 | 35.92 | 2,137.19 | 32.99 | 2,028.69 | 8.84 | 543.27 | 4.22 | 251.19 |
| 1978 | 10.81 | 664.46 | 37.97 | 2,259.17 | 26.84 | 1,650.25 | 7.35 | 452.23 | 4.47 | 265.78 |
| 1980 | 17.47 | 1,074.19 | 41.25 | 2,454.55 | 19.54 | 1,201.47 | 5.10 | 313.59 | 6.20 | 368.93 |
| 1981 | 17.67 | 1,086.49 | 30.92 | 1,839.87 | 14.49 | 890.96 | 8.21 | 504.81 | 5.78 | 343.93 |
| 1982 | 33.26 | 1,979.11 | 19.20 | 1,180.56 | 11.15 | 685.59 | 9.09 | 540.89 | ||
| 1983 | 18.23 | 1,084.76 | 13.20 | 811.64 | 17.26 | 1,061.28 | ||||
| 1984 | 18.06 | 1,074.64 | 27.05 | 1,663.24 | 20.80 | 1,278.94 | 36.20 | 2,154.05 | ||
| 1985 | 11.84 | 704.53 | 16.76 | 1,030.53 | 6.77 | 416.27 | 11.83 | 703.93 | ||
| 1986 | ||||||||||
| 1987 | 8.82 | 524.83 | ||||||||
| 1988 | ||||||||||
| 1989 | 47.07 | 2,894.22 | 44.73 | 2,661.62 | 17.30 | 1,063.74 | ||||
| 1990 | ||||||||||
| 1991 | ||||||||||
| 1992 | 18.42 | 1,096.07 | ||||||||
| 1993 | 20.21 | 1,242.66 | 4.17 | 256.40 | ||||||
| 1994 | ||||||||||
| 1995 | 13.95 | 857.75 | 25.40 | 1,511.40 | 28.81 | 1,771.46 | 13.59 | 835.62 | 6.12 | 364.17 |
| 1996 | ||||||||||
| 1997 | 41.71 | 2,481.82 | ||||||||
| 1998 | ||||||||||
| Averages: | 17.51 | 1,076.82 | 28.71 | 1,708.17 | 23.47 | 1,442.99 | 10.35 | 636.39 | 9.73 | 578.70 |
Data:
1980: 4/28, on; 4/30, 3 cfs; 5/6, 3 cfs; 5/13, 2 cfs; 5/20, 31 cfs; 5/21, 37 cfs; 5/29, 31 cfs; 6/3, 25 cfs; 6/10, 49 cfs; 6/18, 31 cfs; 6/23, 56 cfs; 6/30, 43 cfs; 7/9, 26 cfs; 7/15, 16 cfs; 7/22, 13 cfs; 7/24, 13 cfs; 7/28, 10 cfs; 8/8, 7 cfs; 8/12, 5 cfs; 8/21, 3 cfs; 9/22, 8 cfs; 9/29, 7 cfs.
1981: 4/24, 7.5 cfs; 5/8, 13 cfs; 5/14, 10 cfs; 5/28, 31 cfs; 6/4, 19 cfs; 6/9, 45 cfs; 6/17, 31 cfs; 6/25, 29 cfs; 7/7, 19 cfs; 7/15, 16 cfs; 7/20, 10 cfs; 8/4, 9 cfs; 8/13, 8 cfs; 8/27, 8 cfs; 10/2, 4 cfs (est).
1982: 5/24, 18 cfs; 6/2, 23 cfs; 6/9, 15 cfs; 6/18, 40 cfs; 6/22, 47 cfs; 7/2, 30 cfs; 7/8, 18 cfs; 7/16, 28 cfs; 7/25, 9 cfs; 8/3, 5 cfs; 8/27, 16 cfs; 9/22, 10 cfs.
1983: 5/24, off; 6/1, 13 cfs; 6/7, 13 cfs; 6/19, 21 cfs; 6/24, 23 cfs; 7/6, 20 cfs; 7/12, 12 cfs; 7/19, 3 cfs (est); 7/27, 16 cfs; 8/22, 19 cfs; 9/12, 7 cfs.
1984: 5/18, off; 5/22, 13 cfs; 6/1, 25 cfs; 6/9, 7 cfs; 6/12, 4 cfs (est); 6/14, 18 cfs; 6/29, 26 cfs; 7/6, 3 cfs (est); 7/11, 26 cfs; 7/11, 6 cfs; 7/19, 15 cfs; 7/23, 62 cfs; 7/30, 47 cfs; 8/24, 4 cfs (est); 9/25, 70 cfs.
1985: 6/7, 22.9 cfs; 7/5, 4.0 cfs; 7/13, 22.9 cfs; 7/19, 20.8 cfs; 7/24, 20.8 cfs; 7/31, 18.5 cfs; 8/19, 0.2 cfs (est); 9/5, 9.8 cfs; 9/25, 14.0 cfs; 10/25, 11.0 cfs.
1986: 6/19, 7.5 cfs; 7/9, 5.3 cfs; 9/9, 0.5 cfs (est).
1987: 5/14, 27.7 cfs; 6/18, 6.5 cfs; 7/14, 1 cfs; 8/31, 7.5 cfs.
1988: 4/12, 4 cfs; 6/26, 5 cfs; 7/1, 6.8 cfs.
1989: 4/14, 6 cfs; 4/21, 7 cfs; 4/29, 8 cfs; 5/13, 54 cfs; 5/23, 57 cfs; 6/26, 40 cfs; 7/17, 16 cfs; 8/3, 0 cfs.
1990: 7/11, 22.4 cfs.
1992: 5/29, 17.00 cfs; 6/8, 15.00 cfs; 6/10, 21.00 cfs; 6/11, 20.00 cfs; 7/10, 18.00 cfs.
1993: 4/29, 12.00 cfs; 5/3, 12.3 cfs; 6/14, 36.80 cfs; 7/27, 8.10 cfs; 9/2, 1.00 cfs.
1995: 4/10, 4.0 cfs (est); 4/18, 8.5 cfs; 4/26,10.0 cfs (est); 5/24, 15.0 cfs; 6/26, 30.0 cfs; 7/6, 33.3 cfs; 7/17, 30 cfs (est); 8/16, 12 cfs; 8/30, 10 cfs (est); 9/21, 8.5 cfs.
1996: 5/4, 8.5 cfs (est); 6/26, 9 cfs (est); 9/21, 7.0 cfs (est).
1997: 5/27, 20 cfs (est); 6/16, 53.1 cfs; 7/15, 13.0 cfs.
Supply: 1980, below average; 1981, slightly below average; 1982, average (late peak); 1983, above average; 1984, above average; 1985, below average; 1986, average to slightly above average; 1988: very below average; 1989, below average; 1990, below average; 1991, slightly below average; 1992, below average; 1993, average; 1994, below average; 1995, average to above average; 1996, average; 1997, average; 1998, average to above average.
Source: State Engineer's Office, Annual Hydrographers' Reports.
| TIBBALS DITCH | STATION NO. 006100.00 |
| LATITUDE 0-00-00 LONGITUDE 0-00-00 | |
| SECTION 0 TOWNSHIP 0, RANGE 0 P.M. | |
| ELEVATION UNKNOWN DRAINAGE AREA UNKNOWN | |
| NONCONTRIBUTING AREA UNKNOWN BASIN UNKNOWN | |
| DATA FROM WATER COMMISSIONERS (P) |
| MEAN DAILY FLOW IN CFS BY WATER YEAR | |||||||||||||
| 1975 | |||||||||||||
| DAY | OCT | NOV | DEC | JAN | FEB | MAR | APR | MAY | JUNE | JULY | AUG | SEPT | DAY |
| 1 | ** | ** | ** | ** | ** | ** | ** | ** | 16.00 | 62.20 | 29.00 | 4.50 | 1 |
| 2 | ** | ** | ** | ** | ** | ** | ** | ** | 19.00 | 60.00 | 25.00 | 4.50 | 2 |
| 3 | ** | ** | ** | ** | ** | ** | ** | ** | 21.00 | 59.00 | 20.00 | 4.50 | 3 |
| 4 | ** | ** | ** | ** | ** | ** | ** | ** | 25.00 | 58.00 | 20.00 | 4.53 | 4 |
| 5 | ** | ** | ** | ** | ** | ** | ** | ** | 25.00 | 57.00 | 15.00 | 4.50 | 5 |
| 6 | ** | ** | ** | ** | ** | ** | ** | ** | 25.00 | 56.00 | 13.00 | 4.00 | 6 |
| 7 | ** | ** | ** | ** | ** | ** | ** | ** | 25.00 | 55.00 | 12.10 | 4.00 | 7 |
| 8 | ** | ** | ** | ** | ** | ** | ** | ** | 25.00 | 54.00 | 12.00 | 3.50 | 8 |
| 9 | ** | ** | ** | ** | ** | ** | ** | ** | 25.00 | 51.60 | 12.00 | 3.50 | 9 |
| 10 | ** | ** | ** | ** | ** | ** | ** | ** | 25.00 | 52.00 | 12.00 | 3.50 | 10 |
| 11 | ** | ** | ** | ** | ** | ** | ** | ** | 24.25 | 64.10 | 11.00 | 3.50 | 11 |
| 12 | ** | ** | ** | ** | ** | ** | ** | 3.40 | 26.00 | 60.00 | 11.00 | 3.50 | 12 |
| 13 | ** | ** | ** | ** | ** | ** | ** | 4.00 | 28.00 | 56.00 | 11.40 | 3.50 | 13 |
| 14 | ** | ** | ** | ** | ** | ** | ** | 4.00 | 31.00 | 52.00 | 11.00 | 3.84 | 14 |
| 15 | ** | ** | ** | ** | ** | ** | ** | 4.00 | 33.00 | 46.00 | 11.00 | 3.50 | 15 |
| 16 | ** | ** | ** | ** | ** | ** | ** | 5.00 | 35.00 | 41.50 | 10.00 | 3.50 | 16 |
| 17 | ** | ** | ** | ** | ** | ** | ** | 5.00 | 38.00 | 38.00 | 10.00 | 3.50 | 17 |
| 18 | ** | ** | ** | ** | ** | ** | ** | 5.00 | 41.50 | 35.00 | 9.00 | 3.50 | 18 |
| 19 | ** | ** | ** | ** | ** | ** | ** | 5.00 | 35.00 | 32.00 | 9.00 | 3.50 | 19 |
| 20 | ** | ** | ** | ** | ** | ** | ** | 5.00 | 31.00 | 29.00 | 8.00 | 3.50 | 20 |
| 21 | ** | ** | ** | ** | ** | ** | ** | 6.00 | 36.00 | 29.00 | 7.00 | 3.50 | 21 |
| 22 | ** | ** | ** | ** | ** | ** | ** | 6.00 | 41.00 | 27.00 | 6.00 | 3.50 | 22 |
| 23 | ** | ** | ** | ** | ** | ** | ** | 6.00 | 46.00 | 24.00 | 6.00 | 3.50 | 23 |
| 24 | ** | ** | ** | ** | ** | ** | ** | 6.00 | 53.00 | 23.50 | 5.00 | 3.50 | 24 |
| 25 | ** | ** | ** | ** | ** | ** | ** | 7.00 | 60.00 | 11.00 | 4.89 | 3.24 | 25 |
| 26 | ** | ** | ** | ** | ** | ** | ** | 7.00 | 45.40 | 18.00 | 5.00 | 3.00 | 26 |
| 27 | ** | ** | ** | ** | ** | ** | ** | 7.50 | 46.00 | 23.00 | 5.00 | 3.00 | 27 |
| 28 | ** | ** | ** | ** | ** | ** | ** | 8.00 | 60.00 | 26.00 | 5.00 | 3.00 | 28 |
| 29 | ** | ** | ** | ** | ** | ** | 10.00 | 60.00 | 29.00 | 4.50 | 3.00 | 29 | |
| 30 | ** | ** | ** | ** | ** | ** | 12.00 | 60.00 | 31.00 | 4.50 | 3.00 | 30 | |
| 31 | ** | ** | ** | ** | 14.00 | 31.00 | 4.50 | 31 | |||||
| TOTAL | ** | ** | ** | ** | ** | ** | ** | 129.90* | 1061.15 | 1300.90 | 328.89 | 108.61 | |
| MEAN | ** | ** | ** | ** | ** | ** | ** | 6.50* | 35.37 | 41.96 | 10.61 | 3.62 | |
| AC-FT | ** | ** | ** | ** | ** | ** | ** | 257.65* | 2104.76 | 2580.30 | 652.34 | 215.42 | |
| TIBBALS DITCH | STATION NO. 006100.00 |
| LATITUDE 0-00-00 LONGITUDE 0-00-00 | |
| SECTION 0 TOWNSHIP 0, RANGE 0 P.M. | |
| ELEVATION UNKNOWN DRAINAGE AREA UNKNOWN | |
| NONCONTRIBUTING AREA UNKNOWN BASIN UNKNOWN | |
| DATA FROM WATER COMMISSIONERS (P) |
| MEAN DAILY FLOW IN CFS BY WATER YEAR | |||||||||||||
| 1976 | |||||||||||||
| DAY | OCT | NOV | DEC | JAN | FEB | MAR | APR | MAY | JUNE | JULY | AUG | SEPT | DAY |
| 1 | ** | ** | ** | ** | ** | ** | ** | ** | 33.00 | 55.80 | 14.00 | 4.00 | 1 |
| 2 | ** | ** | ** | ** | ** | ** | ** | ** | 36.00 | 55.00 | 10.00 | 2.00 | 2 |
| 3 | ** | ** | ** | ** | ** | ** | ** | ** | 39.50 | 53.00 | 6.00 | 2.00 | 3 |
| 4 | ** | ** | ** | ** | ** | ** | ** | ** | 39.00 | 51.00 | 5.00 | 2.00 | 4 |
| 5 | ** | ** | ** | ** | ** | ** | ** | ** | 39.00 | 47.00 | 5.00 | 2.00 | 5 |
| 6 | ** | ** | ** | ** | ** | ** | ** | ** | 39.00 | 43.00 | 5.00 | 2.00 | 6 |
| 7 | ** | ** | ** | ** | ** | ** | ** | ** | 39.00 | 37.80 | 5.00 | 2.00 | 7 |
| 8 | ** | ** | ** | ** | ** | ** | ** | ** | 39.00 | 34.00 | 5.00 | 2.00 | 8 |
| 9 | ** | ** | ** | ** | ** | ** | ** | ** | 39.50 | 33.00 | 5.00 | 6.60 | 9 |
| 10 | ** | ** | ** | ** | ** | ** | ** | ** | 39.00 | 32.00 | 17.10 | 6.00 | 10 |
| 11 | ** | ** | ** | ** | ** | ** | ** | ** | 39.00 | 31.00 | 16.00 | 6.00 | 11 |
| 12 | ** | ** | ** | ** | ** | ** | ** | 7.50 | 39.00 | 29.50 | 15.00 | 5.00 | 12 |
| 13 | ** | ** | ** | ** | ** | ** | ** | 7.00 | 35.00 | 26.00 | 12.00 | 5.00 | 13 |
| 14 | ** | ** | ** | ** | ** | ** | ** | 7.00 | 30.00 | 23.00 | 12.00 | 5.00 | 14 |
| 15 | ** | ** | ** | ** | ** | ** | ** | 7.00 | 26.00 | 20.70 | 11.00 | 4.00 | 15 |
| 16 | ** | ** | ** | ** | ** | ** | ** | 6.00 | 26.00 | 20.00 | 10.00 | 4.00 | 16 |
| 17 | ** | ** | ** | ** | ** | ** | ** | 6.00 | 26.50 | 20.00 | 9.00 | 4.00 | 17 |
| 18 | ** | ** | ** | ** | ** | ** | ** | 6.00 | 25.00 | 20.00 | 8.00 | 4.00 | 18 |
| 19 | ** | ** | ** | ** | ** | ** | ** | 5.00 | 25.00 | 39.50 | 7.00 | 4.00 | 19 |
| 20 | ** | ** | ** | ** | ** | ** | ** | 5.20 | 25.00 | 38.00 | 6.00 | 4.00 | 20 |
| 21 | ** | ** | ** | ** | ** | ** | ** | 5.00 | 26.00 | 36.00 | 5.00 | 5.00 | 21 |
| 22 | ** | ** | ** | ** | ** | ** | ** | 7.00 | 28.00 | 36.00 | 5.00 | 5.00 | 22 |
| 23 | ** | ** | ** | ** | ** | ** | ** | 10.00 | 30.00 | 33.00 | 12.10 | 5.00 | 23 |
| 24 | ** | ** | ** | ** | ** | ** | ** | 14.00 | 31.00 | 31.00 | 11.00 | 5.20 | 24 |
| 25 | ** | ** | ** | ** | ** | ** | ** | 18.00 | 36.00 | 30.00 | 10.00 | 5.00 | 25 |
| 26 | ** | ** | ** | ** | ** | ** | ** | 24.00 | 41.00 | 29.00 | 10.70 | 5.00 | 26 |
| 27 | ** | ** | ** | ** | ** | ** | ** | 24.10 | 46.00 | 28.00 | 10.00 | 5.00 | 27 |
| 28 | ** | ** | ** | ** | ** | ** | ** | 25.00 | 51.00 | 26.50 | 9.00 | 5.00 | 28 |
| 29 | ** | ** | ** | ** | ** | ** | ** | 27.00 | 55.00 | 24.00 | 8.00 | 5.00 | 29 |
| 30 | ** | ** | ** | ** | ** | ** | 29.00 | 55.00 | 22.00 | 5.00 | 5.20 | 30 | |
| 31 | ** | ** | ** | ** | 31.00 | 18.00 | 5.00 | 31 | |||||
| TOTAL | ** | ** | ** | ** | ** | ** | ** | 270.80* | 1077.50 | 1022.80 | 273.90 | 127.00 | |
| MEAN | ** | ** | ** | ** | ** | ** | ** | 13.54* | 35.92 | 32.99 | 8.84 | 4.23 | |
| AC-FT | ** | ** | ** | ** | ** | ** | ** | 537.12* | 2137.19 | 2028.69 | 543.27 | 251.90 | |
| TIBBALS DITCH | STATION NO. 006100.00 |
| LATITUDE 0-00-00 LONGITUDE 0-00-00 | |
| SECTION 0 TOWNSHIP 0, RANGE 0 P.M. | |
| ELEVATION UNKNOWN DRAINAGE AREA UNKNOWN | |
| NONCONTRIBUTING AREA UNKNOWN BASIN UNKNOWN | |
| DATA FROM WATER COMMISSIONERS (P) |
| MEAN DAILY FLOW IN CFS BY WATER YEAR | |||||||||||||
| 1978 | |||||||||||||
| DAY | OCT | NOV | DEC | JAN | FEB | MAR | APR | MAY | JUNE | JULY | AUG | SEPT | DAY |
| 1 | 5.00 | ** | ** | ** | ** | ** | ** | ** | 21.00 | 38.00 | 12.00 | 4.00 | 1 |
| 2 | 5.00 | ** | ** | ** | ** | ** | ** | ** | 21.00 | 36.00 | 10.00 | 4.00 | 2 |
| 3 | 5.00 | ** | ** | ** | ** | ** | ** | ** | 22.00 | 34.00 | 10.00 | 4.00 | 3 |
| 4 | 5.00 | ** | ** | ** | ** | ** | ** | ** | 25.00 | 32.00 | 10.00 | 4.00 | 4 |
| 5 | 5.00 | ** | ** | ** | ** | ** | ** | ** | 28.00 | 31.00 | 10.00 | 4.00 | 5 |
| 6 | 5.00 | ** | ** | ** | ** | ** | ** | ** | 45.00 | 27.00 | 10.00 | 4.00 | 6 |
| 7 | 4.00 | ** | ** | ** | ** | ** | ** | ** | 45.00 | 25.00 | 10.00 | 4.00 | 7 |
| 8 | 4.00 | ** | ** | ** | ** | ** | ** | ** | 44.00 | 23.00 | 10.00 | 4.00 | 8 |
| 9 | 4.00 | ** | ** | ** | ** | ** | ** | 10.00 | 42.00 | 21.00 | 10.00 | 4.00 | 9 |
| 10 | 4.00 | ** | ** | ** | ** | ** | ** | 10.00 | 40.00 | 31.00 | 9.00 | 4.00 | 10 |
| 11 | 4.00 | ** | ** | ** | ** | ** | ** | 10.00 | 38.00 | 31.00 | 9.00 | 4.00 | 11 |
| 12 | 3.00 | ** | ** | ** | ** | ** | ** | 10.00 | 36.00 | 31.00 | 9.00 | 4.00 | 12 |
| 13 | 3.00 | ** | ** | ** | ** | ** | ** | 10.00 | 36.00 | 30.00 | 9.00 | 4.00 | 13 |
| 14 | 3.00 | ** | ** | ** | ** | ** | ** | 10.00 | 34.00 | 30.00 | 8.00 | 4.00 | 14 |
| 15 | 3.00 | ** | ** | ** | ** | ** | ** | 11.00 | 34.00 | 29.00 | 8.00 | 4.00 | 15 |
| 16 | 2.00 | ** | ** | ** | ** | ** | ** | 11.00 | 36.00 | 29.00 | 8.00 | 4.00 | 16 |
| 17 | 2.00 | ** | ** | ** | ** | ** | ** | 12.00 | 38.00 | 28.00 | 7.00 | 5.00 | 17 |
| 18 | 2.00 | ** | ** | ** | ** | ** | ** | 13.00 | 38.00 | 26.00 | 7.00 | 5.00 | 18 |
| 19 | 1.00 | ** | ** | ** | ** | ** | ** | 14.00 | 40.00 | 24.00 | 6.00 | 5.00 | 19 |
| 20 | 1.00 | ** | ** | ** | ** | ** | ** | 15.00 | 40.00 | 24.00 | 5.00 | 5.00 | 20 |
| 21 | ** | ** | ** | ** | ** | ** | ** | 16.00 | 42.00 | 24.00 | 5.00 | 5.00 | 21 |
| 22 | ** | ** | ** | ** | ** | ** | ** | 17.00 | 44.00 | 24.00 | 5.00 | 5.00 | 22 |
| 23 | ** | ** | ** | ** | ** | ** | ** | 17.00 | 26.00 | 24.00 | 5.00 | 5.00 | 23 |
| 24 | ** | ** | ** | ** | ** | ** | ** | 18.00 | 48.00 | 24.00 | 5.00 | 5.00 | 24 |
| 25 | ** | ** | ** | ** | ** | ** | ** | 18.00 | 48.00 | 24.00 | 5.00 | 5.00 | 25 |
| 26 | ** | ** | ** | ** | ** | ** | ** | 18.00 | 46.00 | 24.00 | 5.00 | 5.00 | 26 |
| 27 | ** | ** | ** | ** | ** | ** | ** | 18.00 | 43.00 | 24.00 | 5.00 | 5.00 | 27 |
| 28 | ** | ** | ** | ** | ** | ** | ** | 19.00 | 40.00 | 24.00 | 4.00 | 5.00 | 28 |
| 29 | ** | ** | ** | ** | ** | ** | 19.00 | 40.00 | 24.00 | 4.00 | 5.00 | 29 | |
| 30 | ** | ** | ** | ** | ** | ** | 19.00 | 39.00 | 20.00 | 4.00 | 5.00 | 30 | |
| 31 | ** | ** | ** | ** | 20.00 | 16.00 | 4.00 | 31 | |||||
| TOTAL | 70.00* | ** | ** | ** | ** | ** | ** | 335.00* | 1139.00 | 832.00 | 228.00 | 134.00 | |
| MEAN | 3.50* | ** | ** | ** | ** | ** | ** | 14.57* | 37.97 | 26.84 | 7.35 | 4.47 | |
| AC-FT | 138.84* | ** | ** | ** | ** | ** | ** | 664.46* | 2259.17 | 1650.25 | 452.23 | 265.78 | |
Source: Wyoming Water Resources Data System, March 20, 2000.
Wardell Ditch, Green River
Diversion Description: Diversion consists of a single 6' steel panel headgate. No diversion dam exists.1
Conveyance Description: Open Channel Canal, approximately 5 miles in length.1
Wyoming Water Rights Summary
| Priority Date (M-D-Y) | Permit Number |
Permitted Use | Acres | Flow (cfs) |
Cumulative Flow (cfs) | Comments |
| 02-04-1898 | 1738 | Irrigation | 130.00 | 1.85 | 1.85 | |
| 06-20-1900 | 551E | Irrigation | 225.00 | 3.26 | 5.11 | |
| 04-03-1903 | 1014E | Irrigation | 113.00 | 1.61 | 6.72 | |
| 01-13-1915 | 3107E | Irrigation | 262.83 | 2.75 | 9.47 | |
| 07-31-1930 | 4684E | Irrigation | 110.00 | 1.57 | 11.04 |
Storage Rights: None.
Estimated Canal Losses: Typical (10%).1
Irrigation Practices: Information not available at time of report.
Crop Types / Consumptive Use: Information not available at time of report.
Return Flows: Return flows are delivered to Green River at Alkali Creek.2
Other Operational Information: Information not available at time of report.
|
Wardell Ditch, Green River, Diversion Data
No Diversion Data Available.
Wright Ditch, West Fork New Fork River
Diversion Description: Diversion dam consists of a wood stop log headgate. No diversion dam exists.1
Conveyance Description: Open Channel Canal, approximately 2 miles in length.1
Wyoming Water Rights Summary
| Priority Date (M-D-Y) | Permit Number |
Permitted Use | Acres | Flow (cfs) |
Cumulative Flow (cfs) | Comments |
| 05-27-1898 | 1844 | Irrigation | 275.00 | 3.92 | 3.92 | |
| 05-15-1899 | 424E | Irrigation | 305.00 | 4.35 | 8.27 | |
| 02-06-1904 | 1161E | Irrigation | 315.00 | 4.50 | 12.77 | |
| 06-11-1929 | 4832E | Irrigation | 48.10 | 0.69 | 13.46 |
Storage Rights: None.
Estimated Canal Losses: Information not available at time of report.
Irrigation Practices: Information not available at time of report.
Crop Types / Consumptive Use: Information not available at time of report.
Return Flows: Return flows are delivered to West Fork New Fork River north of Cora.2
Other Operational Information: Information not available at time of report.
|
Wright Ditch, West Fork New Fork River, Diversion Data
| Wateryear | May | June | July | August | September | |||||
| Average (cfs) | Monthly Total (AF) | Average (cfs) | Monthly Total (AF) | Average (cfs) | Monthly Total (AF) | Average (cfs) | Monthly Total (AF) | Average (cfs) | Monthly Total (AF) | |
| 1980 | ||||||||||
| 1981 | ||||||||||
| 1982 | ||||||||||
| 1983 | ||||||||||
| 1984 | 34.07 | 2,027.31 | 26.35 | 1,620.48 | 5.55 | 341.18 | 5.67 | 337.67 | ||
| 1985 | 11.64 | 715.97 | 31.06 | 1,848.34 | 20.97 | 1,289.24 | 0.87 | 53.38 | 1.03 | 61.15 |
| 1986 | 29.81 | 1,773.58 | 13.14 | 807.83 | 5.72 | 351.63 | 20.81 | 1,238.20 | ||
| 1987 | 21.53 | 1,323.97 | 31.18 | 1,855.44 | 14.34 | 881.47 | 1.09 | 66.90 | 4.18 | 248.91 |
| 1988 | ||||||||||
| 1989 | ||||||||||
| 1990 | ||||||||||
| 1991 | ||||||||||
| 1992 | ||||||||||
| 1993 | ||||||||||
| 1994 | 0.00 | 0.00 | 2.23 | 132.96 | ||||||
| 1995 | ||||||||||
| 1996 | ||||||||||
| 1997 | ||||||||||
| 1998 | ||||||||||
| Averages: | 11.06 | 679.98 | 25.67 | 1,527.53 | 18.70 | 1,149.76 | 3.31 | 203.27 | 7.92 | 471.48 |
Data:
1989: 6/5, 32 cfs.
1994: 5/13, 6/13, dry; 7/2, 12.00 cfs; 9/7, dry.
Source: State Engineer's Office, Annual Hydrographers' Reports.
Supply: 1980, below average; 1981, slightly below average; 1982, average (late peak); 1983, above average; 1984, above average; 1985, below average; 1986, average to slightly above average; 1988: very below average; 1989, below average; 1990, below average; 1991, slightly below average; 1992, below average; 1993, average; 1994, below average; 1995, average to above average; 1996, average; 1997, average; 1998, average to above average.
| WRIGHT DITCH | STATION NO. 007104.00 |
| LATITUDE 42-59-51 LONGITUDE 109-58-39 | |
| NE1/4 SW1/4 SECTION 20 TOWNSHIP 35, RANGE 110 W 6TH P.M. | |
| ELEVATION 7440.00 FT DRAINAGE AREA UNKNOWN | |
| NONCONTRIBUTING 0.00 SQ MI BASIN 15570000 | |
| SUBLETTE COUNTY DATA FROM WWRC (C) | |
| ***TO USE THIS DATA, SEE VIC HASFURTHER*** |
| MEAN DAILY FLOW IN CFS BY WATER YEAR | |||||||||||||
| 1984 | |||||||||||||
| DAY | OCT | NOV | DEC | JAN | FEB | MAR | APR | MAY | JUNE | JULY | AUG | SEPT | DAY |
| 1 | ** | ** | ** | ** | ** | ** | ** | ** | 10.70 | 36.60 | 5.48 | 5.75 | 1 |
| 2 | ** | ** | ** | ** | ** | ** | ** | ** | 10.60 | 35.80 | 5.56 | 5.75 | 2 |
| 3 | ** | ** | ** | ** | ** | ** | ** | ** | 10.30 | 16.40 | 5.52 | 5.75 | 3 |
| 4 | ** | ** | ** | ** | ** | ** | ** | ** | 21.90 | 8.99 | 5.45 | 5.75 | 4 |
| 5 | ** | ** | ** | ** | ** | ** | ** | ** | 37.00 | 8.64 | 5.41 | 5.75 | 5 |
| 6 | ** | ** | ** | ** | ** | ** | ** | ** | 42.00 | 8.51 | 5.45 | 5.75 | 6 |
| 7 | ** | ** | ** | ** | ** | ** | ** | ** | 41.60 | 22.10 | 5.48 | 5.75 | 7 |
| 8 | ** | ** | ** | ** | ** | ** | ** | ** | 40.70 | 42.40 | 5.45 | 5.75 | 8 |
| 9 | ** | ** | ** | ** | ** | ** | ** | ** | 40.30 | 42.00 | 5.37 | 5.75 | 9 |
| 10 | ** | ** | ** | ** | ** | ** | ** | ** | 40.70 | 42.00 | 5.37 | 5.75 | 10 |
| 11 | ** | ** | ** | ** | ** | ** | ** | ** | 41.10 | 40.70 | 5.37 | 5.75 | 11 |
| 12 | ** | ** | ** | ** | ** | ** | ** | ** | 40.30 | 42.90 | 5.33 | 5.75 | 12 |
| 13 | ** | ** | ** | ** | ** | ** | ** | ** | 39.40 | 42.90 | 5.33 | 5.75 | 13 |
| 14 | ** | ** | ** | ** | ** | ** | ** | ** | 38.60 | 43.80 | 5.33 | 5.71 | 14 |
| 15 | ** | ** | ** | ** | ** | ** | ** | ** | 34.30 | 43.30 | 5.41 | 5.67 | 15 |
| 16 | ** | ** | ** | ** | ** | ** | ** | ** | 38.20 | 39.00 | 5.48 | 5.67 | 16 |
| 17 | ** | ** | ** | ** | ** | ** | ** | ** | 38.60 | 39.40 | 5.48 | 5.67 | 17 |
| 18 | ** | ** | ** | ** | ** | ** | ** | ** | 37.00 | 39.90 | 5.48 | 5.67 | 18 |
| 19 | ** | ** | ** | ** | ** | ** | ** | 6.80 | 34.70 | 37.80 | 5.52 | 5.67 | 19 |
| 20 | ** | ** | ** | ** | ** | ** | ** | 6.80 | 34.30 | 31.10 | 5.52 | 5.67 | 20 |
| 21 | ** | ** | ** | ** | ** | ** | ** | 6.84 | 34.70 | 33.60 | 5.52 | 5.67 | 21 |
| 22 | ** | ** | ** | ** | ** | ** | ** | 6.76 | 29.40 | 34.30 | 5.52 | 5.67 | 22 |
| 23 | ** | ** | ** | ** | ** | ** | ** | 6.59 | 35.10 | 30.10 | 6.14 | 5.67 | 23 |
| 24 | ** | ** | ** | ** | ** | ** | ** | 6.76 | 35.40 | 11.80 | 5.83 | 5.63 | 24 |
| 25 | ** | ** | ** | ** | ** | ** | ** | 6.84 | 35.80 | 6.06 | 5.79 | 5.60 | 25 |
| 26 | ** | ** | ** | ** | ** | ** | ** | 6.76 | 35.80 | 7.40 | 5.79 | 5.56 | 26 |
| 27 | ** | ** | ** | ** | ** | ** | ** | 7.49 | 35.80 | 6.97 | 5.71 | 5.52 | 27 |
| 28 | ** | ** | ** | ** | ** | ** | ** | 7.90 | 35.40 | 6.02 | 5.71 | 5.48 | 28 |
| 29 | ** | ** | ** | ** | ** | ** | ** | 8.16 | 35.80 | 5.52 | 5.71 | 5.48 | 29 |
| 30 | ** | ** | ** | ** | ** | ** | 11.00 | 36.60 | 5.48 | 5.75 | 5.48 | 30 | |
| 31 | ** | ** | ** | ** | 11.00 | 5.52 | 5.75 | 31 | |||||
| TOTAL | ** | ** | ** | ** | ** | ** | ** | 99.70* | 1022.10 | 816.99 | 172.01 | 170.24 | |
| MEAN | ** | ** | ** | ** | ** | ** | ** | 7.67* | 34.07 | 26.35 | 5.55 | 5.67 | |
| AC-FT | ** | ** | ** | ** | ** | ** | ** | 197.75* | 2027.31 | 1620.48 | 341.18 | 337.67 | |
| WRIGHT DITCH | STATION NO. 007104.00 |
| LATITUDE 42-59-51 LONGITUDE 109-58-39 | |
| NE1/4 SW1/4 SECTION 20 TOWNSHIP 35, RANGE 110 W 6TH P.M. | |
| ELEVATION 7440.00 FT DRAINAGE AREA UNKNOWN | |
| NONCONTRIBUTING 0.00 SQ MI BASIN 15570000 | |
| SUBLETTE COUNTY DATA FROM WWRC (C) | |
| ***TO USE THIS DATA, SEE VIC HASFURTHER*** |
| MEAN DAILY FLOW IN CFS BY WATER YEAR | |||||||||||||
| 1985 | |||||||||||||
| DAY | OCT | NOV | DEC | JAN | FEB | MAR | APR | MAY | JUNE | JULY | AUG | SEPT | DAY |
| 1 | 5.48 | ** | ** | ** | ** | ** | ** | ** | 24.40 | 0.39 | 0.16 | 1.28 | 1 |
| 2 | 5.52 | ** | ** | ** | ** | ** | ** | ** | 26.63 | 0.10 | 0.14 | 3.07 | 2 |
| 3 | 5.45 | ** | ** | ** | ** | ** | ** | ** | 29.02 | 14.54 | 0.13 | 5.96 | 3 |
| 4 | 5.45 | ** | ** | ** | ** | ** | ** | ** | 33.18 | 32.91 | 0.23 | 2.09 | 4 |
| 5 | 5.45 | ** | ** | ** | ** | ** | ** | ** | 32.37 | 31.57 | 0.71 | 1.16 | 5 |
| 6 | 5.45 | ** | ** | ** | ** | ** | ** | ** | 33.46 | 31.57 | 0.71 | 0.71 | 6 |
| 7 | 5.45 | ** | ** | ** | ** | ** | ** | ** | 36.00 | 29.27 | 0.64 | 0.43 | 7 |
| 8 | 5.41 | ** | ** | ** | ** | ** | ** | ** | 36.00 | 60.82 | 0.52 | 0.52 | 8 |
| 9 | 5.41 | ** | ** | ** | ** | ** | ** | ** | 36.59 | 61.25 | 0.47 | 0.58 | 9 |
| 10 | 5.41 | ** | ** | ** | ** | ** | ** | 13.83 | 36.30 | 60.38 | 0.39 | 0.71 | 10 |
| 11 | 5.45 | ** | ** | ** | ** | ** | ** | 8.64 | 36.00 | 60.82 | 0.39 | 0.58 | 11 |
| 12 | 5.41 | ** | ** | ** | ** | ** | ** | 7.19 | 35.43 | 59.95 | 0.52 | 1.89 | 12 |
| 13 | 5.41 | ** | ** | ** | ** | ** | ** | 6.55 | 34.57 | 58.25 | 0.58 | 1.56 | 13 |
| 14 | 5.41 | ** | ** | ** | ** | ** | ** | 10.65 | 34.29 | 25.72 | 0.58 | 1.05 | 14 |
| 15 | 5.41 | ** | ** | ** | ** | ** | ** | 15.28 | 36.00 | 24.83 | 0.64 | 0.52 | 15 |
| 16 | 5.37 | ** | ** | ** | ** | ** | ** | 15.28 | 36.30 | 24.61 | 0.86 | 0.58 | 16 |
| 17 | 5.33 | ** | ** | ** | ** | ** | ** | 15.43 | 36.30 | 22.51 | 2.53 | 0.64 | 17 |
| 18 | 5.30 | ** | ** | ** | ** | ** | ** | 15.89 | 36.30 | 0.26 | 3.38 | 0.58 | 18 |
| 19 | 5.33 | ** | ** | ** | ** | ** | ** | 15.59 | 36.00 | 0.19 | 1.28 | 0.86 | 19 |
| 20 | 5.30 | ** | ** | ** | ** | ** | ** | 18.54 | 36.59 | 1.41 | 0.35 | 0.47 | 20 |
| 21 | 5.26 | ** | ** | ** | ** | ** | ** | 18.37 | 35.14 | 7.19 | 0.58 | 0.47 | 21 |
| 22 | 5.26 | ** | ** | ** | ** | ** | ** | 18.54 | 35.14 | 9.76 | 0.52 | 1.28 | 22 |
| 23 | 5.26 | ** | ** | ** | ** | ** | ** | 18.37 | 34.85 | 10.31 | 0.52 | 0.71 | 23 |
| 24 | 5.22 | ** | ** | ** | ** | ** | ** | 19.62 | 35.43 | 10.88 | 0.78 | 0.52 | 24 |
| 25 | 5.26 | ** | ** | ** | ** | ** | ** | 20.93 | 32.64 | 8.73 | 1.05 | 0.47 | 25 |
| 26 | 5.22 | ** | ** | ** | ** | ** | ** | 19.62 | 30.02 | 0.23 | 1.56 | 0.52 | 26 |
| 27 | ** | ** | ** | ** | ** | ** | ** | 19.62 | 29.02 | 0.78 | 3.07 | 0.52 | 27 |
| 28 | ** | ** | ** | ** | ** | ** | ** | 19.43 | 16.21 | 0.21 | 1.41 | 0.52 | 28 |
| 29 | ** | ** | ** | ** | ** | ** | 20.17 | 1.05 | 0.19 | 0.22 | 0.35 | 29 | |
| 30 | ** | ** | ** | ** | ** | ** | 22.11 | 0.64 | 0.19 | 0.43 | 0.23 | 30 | |
| 31 | ** | ** | ** | ** | 21.32 | 0.17 | 1.56 | 31 | |||||
| TOTAL | 139.68* | ** | ** | ** | ** | ** | ** | 360.97* | 931.87 | 649.99 | 26.91 | 30.83 | |
| MEAN | 5.37* | ** | ** | ** | ** | ** | ** | 16.41* | 31.06 | 20.97 | 0.87 | 1.03 | |
| AC-FT | 277.05* | ** | ** | ** | ** | ** | ** | 715.97* | 1848.34 | 1289.34 | 53.38 | 61.15 | |
| WRIGHT DITCH | STATION NO. 007104.00 |
| LATITUDE 42-59-51 LONGITUDE 109-58-39 | |
| NE1/4 SW1/4 SECTION 20 TOWNSHIP 35, RANGE 110 W 6TH P.M. | |
| ELEVATION 7440.00 FT DRAINAGE AREA UNKNOWN | |
| NONCONTRIBUTING 0.00 SQ MI BASIN 15570000 | |
| SUBLETTE COUNTY DATA FROM WWRC (C) | |
| ***TO USE THIS DATA, SEE VIC HASFURTHER*** |
| MEAN DAILY FLOW IN CFS BY WATER YEAR | |||||||||||||
| 1986 | |||||||||||||
| DAY | OCT | NOV | DEC | JAN | FEB | MAR | APR | MAY | JUNE | JULY | AUG | SEPT | DAY |
| 1 | 0.21 | 7.19 | ** | ** | ** | ** | ** | ** | 20.31 | 29.34 | 0.02 | 7.69 | 1 |
| 2 | 0.23 | 0.52 | ** | ** | ** | ** | ** | ** | 22.25 | 28.10 | 0.20 | 8.23 | 2 |
| 3 | 0.28 | 0.43 | ** | ** | ** | ** | ** | ** | 23.02 | 27.49 | 4.65 | 12.06 | 3 |
| 4 | 0.26 | ** | ** | ** | ** | ** | ** | ** | 21.75 | 26.90 | 1.50 | 13.01 | 4 |
| 5 | 0.26 | ** | ** | ** | ** | ** | ** | ** | 23.81 | 26.60 | 1.73 | 14.37 | 5 |
| 6 | 0.26 | ** | ** | ** | ** | ** | ** | ** | 30.63 | 26.60 | 0.02 | 18.50 | 6 |
| 7 | 0.35 | ** | ** | ** | ** | ** | ** | ** | 39.35 | 26.90 | 0.17 | 18.44 | 7 |
| 8 | 0.35 | ** | ** | ** | ** | ** | ** | ** | 35.13 | 26.60 | 6.13 | 19.61 | 8 |
| 9 | 0.28 | ** | ** | ** | ** | ** | ** | ** | 30.96 | 26.31 | 6.13 | 22.00 | 9 |
| 10 | 0.26 | ** | ** | ** | ** | ** | ** | ** | 27.19 | 25.46 | 6.31 | 22.51 | 10 |
| 11 | 0.26 | ** | ** | ** | ** | ** | ** | ** | 30.96 | 25.18 | 6.05 | 20.31 | 11 |
| 12 | 0.23 | ** | ** | ** | ** | ** | ** | ** | 37.39 | 24.90 | 8.01 | 18.07 | 12 |
| 13 | 0.23 | ** | ** | ** | ** | ** | ** | ** | 38.95 | 23.81 | 8.93 | 22.76 | 13 |
| 14 | 0.23 | ** | ** | ** | ** | ** | ** | ** | 37.77 | 18.94 | 9.05 | 22.76 | 14 |
| 15 | 0.23 | ** | ** | ** | ** | ** | ** | ** | 34.77 | 17.44 | 7.69 | 23.02 | 15 |
| 16 | 0.23 | ** | ** | ** | ** | ** | ** | ** | 32.30 | 9.81 | 7.17 | 23.02 | 16 |
| 17 | 0.23 | ** | ** | ** | ** | ** | ** | ** | 31.29 | 6.68 | 7.27 | 23.28 | 17 |
| 18 | 0.23 | ** | ** | ** | ** | ** | ** | ** | 30.30 | 6.59 | 0.11 | 23.54 | 18 |
| 19 | 0.23 | ** | ** | ** | ** | ** | ** | ** | 28.10 | 2.30 | 6.40 | 23.81 | 19 |
| 20 | 0.23 | ** | ** | ** | ** | ** | ** | ** | 27.49 | 0.55 | 7.07 | 23.81 | 20 |
| 21 | 0.23 | ** | ** | ** | ** | ** | ** | ** | 34.14 | 0.12 | 6.88 | 23.81 | 21 |
| 22 | 0.23 | ** | ** | ** | ** | ** | ** | ** | 31.96 | 0.12 | 6.22 | 24.08 | 22 |
| 23 | 0.32 | ** | ** | ** | ** | ** | ** | ** | 30.30 | 0.12 | 5.62 | 24.62 | 23 |
| 24 | 0.28 | ** | ** | ** | ** | ** | ** | 0.31 | 29.34 | 0.09 | 8.81 | 25.46 | 24 |
| 25 | 0.28 | ** | ** | ** | ** | ** | ** | 0.17 | 29.02 | 0.08 | 8.23 | 25.74 | 25 |
| 26 | 0.28 | ** | ** | ** | ** | ** | ** | 0.17 | 28.10 | 0.07 | 8.23 | 25.46 | 26 |
| 27 | 0.28 | ** | ** | ** | ** | ** | ** | 0.20 | 27.49 | 0.06 | 7.92 | 25.46 | 27 |
| 28 | 0.26 | ** | ** | ** | ** | ** | ** | 0.15 | 26.90 | 0.04 | 7.80 | 23.81 | 28 |
| 29 | 15.59 | ** | ** | ** | ** | ** | 0.08 | 26.90 | 0.03 | 7.69 | 22.00 | 29 | |
| 30 | 4.94 | ** | ** | ** | ** | ** | 0.15 | 26.31 | 0.03 | 7.58 | 23.02 | 30 | |
| 31 | 9.66 | ** | ** | ** | 6.88 | 0.02 | 7.69 | 31 | |||||
| TOTAL | 37.42 | 8.14* | ** | ** | ** | ** | ** | 8.11* | 894.18 | 407.28 | 177.28 | 624.26 | |
| MEAN | 1.21 | 2.71* | ** | ** | ** | ** | ** | 1.01* | 29.81 | 13.14 | 5.72 | 20.81 | |
| AC-FT | 74.22 | 16.15* | ** | ** | ** | ** | ** | 16.09* | 1773.58 | 807.83 | 351.63 | 1238.20 | |
| WRIGHT DITCH | STATION NO. 007104.00 |
| LATITUDE 42-59-51 LONGITUDE 109-58-39 | |
| NE1/4 SW1/4 SECTION 20 TOWNSHIP 35, RANGE 110 W 6TH P.M. | |
| ELEVATION 7440.00 FT DRAINAGE AREA UNKNOWN | |
| NONCONTRIBUTING 0.00 SQ MI BASIN 15570000 | |
| SUBLETTE COUNTY DATA FROM WWRC (C) | |
| ***TO USE THIS DATA, SEE VIC HASFURTHER*** |
| MEAN DAILY FLOW IN CFS BY WATER YEAR | |||||||||||||
| 1987 | |||||||||||||
| DAY | OCT | NOV | DEC | JAN | FEB | MAR | APR | MAY | JUNE | JULY | AUG | SEPT | DAY |
| 1 | 23.02 | 0.00 | ** | ** | ** | ** | ** | ** | 31.78 | 30.47 | 0.23 | 2.78 | 1 |
| 2 | 23.54 | 0.00 | ** | ** | ** | ** | ** | ** | 32.46 | 28.89 | 0.34 | 2.78 | 2 |
| 3 | 23.28 | 0.00 | ** | ** | ** | ** | ** | ** | 31.45 | 10.68 | 3.66 | 2.78 | 3 |
| 4 | 17.44 | 0.00 | ** | ** | ** | ** | ** | ** | 31.45 | 8.54 | 4.01 | 2.78 | 4 |
| 5 | 10.89 | ** | ** | ** | ** | ** | ** | ** | 31.12 | 8.89 | 2.78 | 2.78 | 5 |
| 6 | 10.89 | ** | ** | ** | ** | ** | ** | ** | 30.79 | 8.77 | 1.75 | 2.78 | 6 |
| 7 | 10.89 | ** | ** | ** | ** | ** | ** | ** | 31.45 | 31.45 | 1.59 | 2.78 | 7 |
| 8 | 10.89 | ** | ** | ** | ** | ** | ** | ** | 32.46 | 32.12 | 1.45 | 2.78 | 8 |
| 9 | 10.89 | ** | ** | ** | ** | ** | ** | ** | 35.26 | 27.09 | 1.45 | 2.11 | 9 |
| 10 | 0.00 | ** | ** | ** | ** | ** | ** | ** | 36.37 | 26.51 | 0.90 | 1.00 | 10 |
| 11 | 0.00 | ** | ** | ** | ** | ** | ** | ** | 34.54 | 29.83 | 0.23 | 1.00 | 11 |
| 12 | 0.00 | ** | ** | ** | ** | ** | ** | ** | 34.54 | 30.79 | 0.82 | 0.62 | 12 |
| 13 | 0.00 | ** | ** | ** | ** | ** | ** | 32.46 | 34.19 | 28.28 | 0.09 | 0.62 | 13 |
| 14 | 0.00 | ** | ** | ** | ** | ** | ** | 33.84 | 34.19 | 20.53 | 0.34 | 1.20 | 14 |
| 15 | 0.00 | ** | ** | ** | ** | ** | ** | 34.90 | 29.83 | 12.43 | 1.00 | 6.21 | 15 |
| 16 | 0.00 | ** | ** | ** | ** | ** | ** | 36.00 | 12.28 | 10.95 | 1.00 | 0.68 | 16 |
| 17 | 0.00 | ** | ** | ** | ** | ** | ** | 37.50 | 11.10 | 11.24 | 0.90 | 0.17 | 17 |
| 18 | 0.00 | ** | ** | ** | ** | ** | ** | 37.50 | 15.69 | 10.68 | 0.90 | 1.92 | 18 |
| 19 | 0.00 | ** | ** | ** | ** | ** | ** | 37.50 | 34.90 | 9.50 | 0.10 | 7.76 | 19 |
| 20 | 0.00 | ** | ** | ** | ** | ** | ** | 37.12 | 36.00 | 10.54 | 0.09 | 7.76 | 20 |
| 21 | 0.00 | ** | ** | ** | ** | ** | ** | 36.74 | 36.00 | 13.73 | 0.07 | 7.87 | 21 |
| 22 | 0.00 | ** | ** | ** | ** | ** | ** | 36.37 | 36.00 | 8.89 | 0.07 | 8.09 | 22 |
| 23 | 0.00 | ** | ** | ** | ** | ** | ** | 36.00 | 36.00 | 7.25 | 0.07 | 8.09 | 23 |
| 24 | 0.00 | ** | ** | ** | ** | ** | ** | 35.63 | 34.54 | 4.01 | 0.07 | 7.98 | 24 |
| 25 | 0.00 | ** | ** | ** | ** | ** | ** | 35.26 | 34.19 | 0.38 | 0.07 | 0.46 | 25 |
| 26 | 0.00 | ** | ** | ** | ** | ** | ** | 35.26 | 33.84 | 1.20 | 0.75 | 1.59 | 26 |
| 27 | 0.00 | ** | ** | ** | ** | ** | ** | 34.54 | 29.83 | 6.21 | 1.92 | 9.50 | 27 |
| 28 | 0.00 | ** | ** | ** | ** | ** | ** | 33.84 | 30.47 | 5.75 | 2.11 | 9.50 | 28 |
| 29 | 0.00 | ** | ** | ** | ** | ** | 32.80 | 31.28 | 4.01 | 2.11 | 9.50 | 29 | |
| 30 | 0.00 | ** | ** | ** | ** | ** | 32.12 | 31.45 | 3.05 | 0.08 | 9.62 | 30 | |
| 31 | 0.00 | ** | ** | ** | 32.12 | 1.75 | 2.78 | 31 | |||||
| TOTAL | 141.73 | 0.00* | ** | ** | ** | ** | ** | 667.50* | 935.45 | 444.41 | 33.73 | 125.49 | |
| MEAN | 4.57 | 0.00* | ** | ** | ** | ** | ** | 35.13* | 31.18 | 14.34 | 1.09 | 4.18 | |
| AC-FT | 281.12 | 0.00* | ** | ** | ** | ** | ** | 1323.97* | 1855.44 | 881.47 | 66.90 | 248.91 | |
| WRIGHT DITCH | STATION NO. 007104.00 |
| LATITUDE 42-59-51 LONGITUDE 109-58-39 | |
| NE1/4 SW1/4 SECTION 20 TOWNSHIP 35, RANGE 110 W 6TH P.M. | |
| ELEVATION 7440.00 FT DRAINAGE AREA UNKNOWN | |
| NONCONTRIBUTING 0.00 SQ MI BASIN 15570000 | |
| SUBLETTE COUNTY DATA FROM WWRC (C) | |
| ***TO USE THIS DATA, SEE VIC HASFURTHER*** |
| MEAN DAILY FLOW IN CFS BY WATER YEAR | |||||||||||||
| 1988 | |||||||||||||
| DAY | OCT | NOV | DEC | JAN | FEB | MAR | APR | MAY | JUNE | JULY | AUG | SEPT | DAY |
| 1 | 9.62 | 1.00 | ** | ** | ** | ** | ** | ** | ** | ** | ** | ** | 1 |
| 2 | 9.62 | ** | ** | ** | ** | ** | ** | ** | ** | ** | ** | ** | 2 |
| 3 | 9.25 | ** | ** | ** | ** | ** | ** | ** | ** | ** | ** | ** | 3 |
| 4 | 10.40 | ** | ** | ** | ** | ** | ** | ** | ** | ** | ** | ** | 4 |
| 5 | 12.91 | ** | ** | ** | ** | ** | ** | 0.00 | ** | ** | ** | ** | 5 |
| 6 | 12.59 | ** | ** | ** | ** | ** | ** | 0.00 | ** | ** | ** | ** | 6 |
| 7 | 13.07 | ** | ** | ** | ** | ** | ** | 0.00 | ** | ** | ** | ** | 7 |
| 8 | 13.40 | ** | ** | ** | ** | ** | ** | 0.00 | ** | ** | ** | ** | 8 |
| 9 | 8.31 | ** | ** | ** | ** | ** | ** | 0.00 | ** | ** | ** | ** | 9 |
| 10 | 6.95 | ** | ** | ** | ** | ** | ** | 0.00 | ** | ** | ** | ** | 10 |
| 11 | 6.86 | ** | ** | ** | ** | ** | ** | 0.00 | ** | ** | ** | ** | 11 |
| 12 | 6.76 | ** | 0.00 | ** | ** | ** | ** | 0.00 | ** | ** | ** | ** | 12 |
| 13 | 6.76 | ** | ** | ** | ** | ** | ** | 0.00 | ** | ** | ** | ** | 13 |
| 14 | 6.76 | ** | ** | ** | ** | ** | ** | 0.00 | ** | ** | ** | ** | 14 |
| 15 | 6.76 | ** | ** | ** | ** | ** | ** | 0.00 | ** | ** | ** | ** | 15 |
| 16 | 6.48 | ** | ** | ** | ** | ** | ** | 0.00 | ** | ** | ** | ** | 16 |
| 17 | 6.39 | ** | ** | ** | ** | ** | ** | ** | ** | ** | ** | ** | 17 |
| 18 | 6.39 | ** | ** | ** | ** | ** | ** | ** | ** | ** | ** | ** | 18 |
| 19 | 6.30 | ** | ** | ** | ** | ** | ** | ** | ** | ** | ** | ** | 19 |
| 20 | 6.30 | ** | ** | ** | ** | ** | ** | ** | ** | ** | ** | ** | 20 |
| 21 | 4.39 | ** | ** | ** | ** | ** | ** | ** | ** | ** | ** | ** | 21 |
| 22 | 4.01 | ** | ** | ** | ** | ** | ** | ** | ** | ** | ** | ** | 22 |
| 23 | 3.34 | ** | ** | ** | ** | ** | ** | ** | ** | ** | ** | ** | 23 |
| 24 | 3.34 | ** | ** | ** | ** | ** | ** | ** | ** | ** | ** | ** | 24 |
| 25 | 3.05 | ** | ** | ** | ** | ** | ** | ** | ** | ** | ** | ** | 25 |
| 26 | 3.05 | ** | ** | ** | ** | ** | ** | ** | ** | ** | ** | ** | 26 |
| 27 | 2.78 | ** | ** | ** | ** | ** | ** | ** | ** | ** | ** | ** | 27 |
| 28 | 1.20 | ** | ** | ** | ** | ** | ** | ** | ** | ** | ** | ** | 28 |
| 29 | 1.32 | ** | ** | ** | ** | ** | ** | ** | ** | ** | ** | ** | 29 |
| 30 | 1.32 | ** | ** | ** | ** | ** | ** | ** | ** | ** | ** | 30 | |
| 31 | 1.20 | ** | ** | ** | ** | ** | ** | 31 | |||||
| TOTAL | 200.88 | 1.00* | 0.00* | ** | ** | ** | ** | 0.00* | ** | ** | ** | ** | |
| MEAN | 6.48 | 1.00* | 0.00* | ** | ** | ** | ** | 0.00* | ** | ** | ** | ** | |
| AC-FT | 398.44 | 1.98* | 0.00* | ** | ** | ** | ** | 0.00* | ** | ** | ** | ** | |
Source: Wyoming Water Resources Data System, March 20, 2000.