Wyoming State Water Plan
Wyoming State Water Plan
Wyoming Water Development Office
6920 Yellowtail Rd
Cheyenne, WY 82002
Phone: 307-777-7626

Wyoming Water Development Office
6920 Yellowtail Rd
Cheyenne, WY 82002
Phone: 307-777-7626


This chapter presents estimates of the availability of both surface water and ground water for future uses. Surface water availability is determined by naturally available water at various points in the Basin, minus existing uses. Groundwater availability is a function of hydrogeologic conditions and current use as described in existing reports and well records.
As with all chapters in this final plan report, explicit lists of references are not provided. Instead, all references to reports, documents, maps, and personal communications are maintained in the Technical Memoranda that were prepared during the current planning process. Should the reader desire to review a complete list of references for the information presented in this chapter, the following memoranda should be consulted:
The following subsections describe the analysis of existing surface water data, creation of a spreadsheet-based surface water model, and the use of model output to estimate water availability. It should be noted that the results described herein denote physical availability over and above existing uses, which is to be distinguished from legal or permitted availability. As projects are proposed in the future, surface water physical availability will be reduced due to environmental and administrative requirements. However, physical availability is the important first step in assessing the viability of any future project. Lack of physical availability of water for a project is an obvious fatal flaw for any water development.
Study Period Selection
Modeling the Green River Basin requires selection of an appropriate period of record for hydrologic analysis. The feasibility study determined that three 12-month spreadsheet models (one each representing normal-year, dry-year, and wet-year streamflows) constitute an appropriate level of detail for a modeling tool to verify existing uses and evaluate future surface water uses. Gage flows used in the three spreadsheets are to be typical of three different conditions and are to be developed by averaging observed streamflows that occurred during historical normal, wet, or dry years. Accordingly, the objectives of this task were to:
Review of Reservoirs
Because a single annual cycle will be used to model each hydrologic condition, the normal data developed for input to the model is best derived from an operationally consistent time period. Construction or major modification of a reservoir during the study period would influence the downstream gages, hence reservoir history places significant control on selection of the study period. For this reason, major reservoirs (greater than 10,000 acre-feet) that have been constructed or modified during the past fifty years were reviewed to consider their influence on selection of the study period, with the following summarized results:
Initial screening of current basin operations suggests that the study period begin in 1971 and end in 1998. By 1971, every major existing reservoir except for Stateline was in place. A twenty-year study period (1979-1998) consistent with the post-construction period of Stateline Reservoir may be too short for a quantitative analysis. An alternative is to select 1971 through 1998 and adjust the gage below Stateline Reservoir (09220000 . East Fork of Smith Fork below Robertson) from 1971 to 1979 to reflect representative operations of Stateline Reservoir, had it existed during this time period.
Review of Streamflow Records
Analysis of available streamflow data consisted of reviewing the USGS Water-Data Report, Volume 1, Surface Water. This report lists discontinued and active surface water discharge, water quality, sediment and biological stations. This information was supplemented by a review of data reported in the SEO Annual Hydrographers Report.
Review of Hydrologic Conditions
The reservoir history and availability of gage records led to a preliminary conclusion that 1971-1998 should serve as the study period. Ideally, the modeling study period should be representative of long-term hydrologic conditions in the Basin. To analyze this aspect of the proposed study period, annual flows were reviewed for the USGS gage 09188500 Green River at Warren Bridge near Daniel (Figure III-1). This gage has the longest record of the Green River Basin gages in Wyoming (1932-1998, excluding 1993), and as an indicator of long-term versus short-term statistics, is assumed applicable to the entire Basin. Characteristics of the long-term record and the proposed study period are tabulated below:
Figure III-1 Green River at Warren Bridge, near Daniel, WY
| Characteristics of Annual Flow Series for 091885500 Green River at Warren Bridge near Daniel | ||
| 1932-1998 (excluding 1993) Record | 1971-1998 (excluding 1993) Record | |
| Mean | 367,426 | 368,744 |
| Standard Deviation | 82,724 | 99,929 |
| Three highest years | 1986 / 1997 / 1971 | 1986 / 1997 / 1971 |
| Three highest values (AF) | 556,150 / 513,080 / 499,510 | 556,150 / 513,080 / 499,510 |
| Three lowest years | 1977 / 1934 / 1992 | 1977 / 1992 / 1988 |
| Three lowest values (AF) | 203,260 / 208,720 / 213,910 | 203,260 / 213,910 / 232,330 |
The table shows that the means of the two periods are very similar. The standard deviation for the shorter period is higher due to the smaller sample size. Most notably, the short period includes the three highest annual flows of record, as well as two of the three driest. Furthermore, Figure III-1 shows that the most enduring drought of record (1987-1992) is captured in the model study period. Usually the concern is that the short period does not include extremes found in the longer record, but in this case, extremes of both wet and dry are clearly included in the proposed study period.
Selected Study Period
Based on available records, existence of reservoirs, and representativeness of the period, 1971-1998 is selected as the modeling study period. This 28-year period, on average, appears similar to long-term conditions, and includes wet, dry and normal years.
In this evaluation, traditional hydrologic techniques were used to estimate missing data. Typically, this means beginning by looking for a strong linear relationship between data that overlap in time at gages with similar hydrology. The basis of success for this procedure hinges on finding similarity in runoff characteristics between two streams, then using that similarity to "rebuild" missing data values at the deficient gage for the years when no overlap exists.
Index Gage Selection
The objective of this work was to identify gages to be used to identify normal, wet and dry years by ranking of annual flows. The gages selected as representative for this purpose were termed "index" gages. Ultimately, the top (largest annual flow amounts) 20 percent of the years were designated as wet years, the middle 60 percent designated as normal years, and the 20 percent with lowest annual flows designated as dry years. The purpose of this subtask was to select gages for this ranking task that provided coverage of the Basin, were relatively free of influence by man's activities, and which were relatively complete during the study period. Gages in operation during most, if not all, of the study period were selected for evaluation as index gages. Additionally, if a gage was in operation seasonally throughout the study period, it was included in the evaluation as a potential index gage.
Results
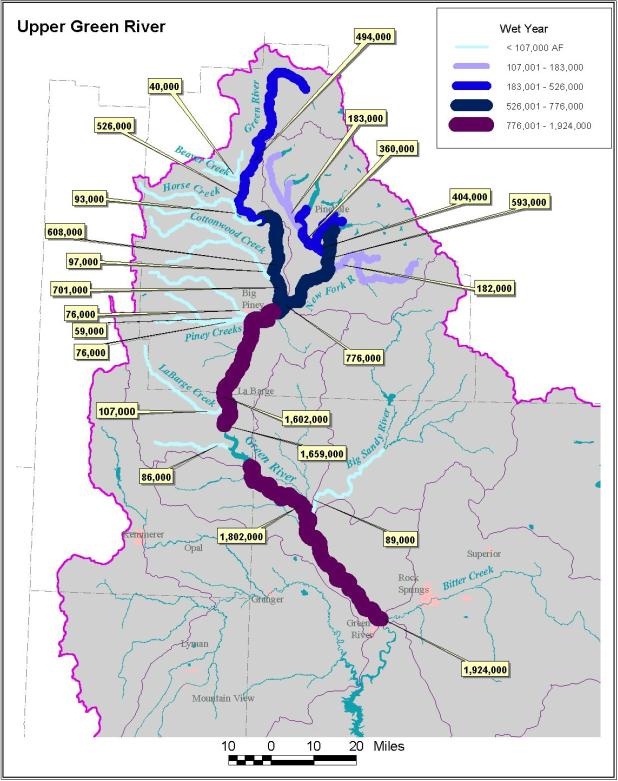
The index gages and corresponding wet and dry year selection are shown in Table III-1. There was no exact duplication of hydrologic condition (i.e. wet and dry years did not correspond at all gages all the time), so all seven index gages were used, applied to geographical areas as follows (see Figure III-2 through Figure III-5):
Table III-1 Wet, Normal and Dry Years for Green River Basin Index Gages
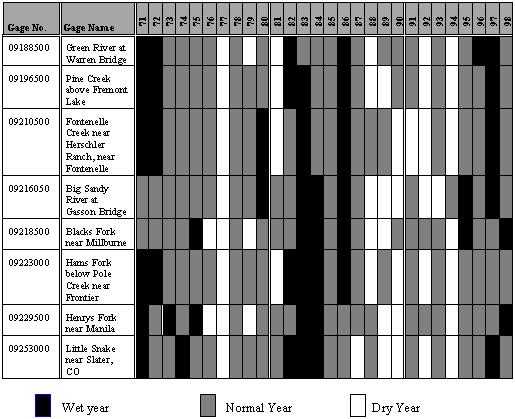
Figure III-2 Upper Green River Node Diagram

click to enlarge
Figure III-3 Blacks Fork Node Diagram

click to enlarge
Figure III-4 Henrys Fork Node Diagram

click to enlarge
Figure III-5 Little Snake River Node Diagram

click to enlarge
Spreadsheet Model Development
Spreadsheet models were developed to determine average monthly streamflow in the Basin during normal, wet, and dry years. The purpose of these models was to validate existing basin uses, assist in determining the timing and location of water available for future development, and help to assess impacts of future water supply alternatives.
This work resulted in the creation of twelve spreadsheet workbooks, one for each of the three hydrologic conditions and four distinct sub-basins:
The three workbooks for each sub-basin are yoked together with a simple menu-driven graphical user interface (GUI), effectively creating four sub-basin models.
Model Overview
For each Green River sub-basin, three models were developed, reflecting each of three hydrologic conditions: dry, normal, and wet year water supply. The spreadsheets each represent one calendar year of flows, on a monthly time step. The modelers relied on historical gage data from 1971 to 1998 to identify the hydrologic conditions for each year in the study period, as discussed in the technical memorandum for Surface Water Data Collection and Study Period Selection. Streamflow, consumptive use, diversions, irrigation returns, and reservoir conditions are the basic input data to the model. For all of these data, average values drawn from the dry, normal, or wet subset of the study period were computed for use in the spreadsheets. The models do not explicitly account for water rights, appropriations, or Compact allocations nor is the model operated based on these legal constraints. It is assumed that the historical data reflect effects of any limitations that may have been placed upon water users by water rights restrictions.
To mathematically represent each sub-basin system, the river system was divided into reaches based primarily upon the location of major tributary confluences. Each reach was then sub-divided by identifying a series of individual nodes representing diversions, reservoirs, tributary confluences, gages, or other significant water resources features. The resulting network is the simplification of the real world which the model represents. Figure III-2 through Figure III-5 (above) present node diagrams of the models developed for the Green River. Each numbered node in the figure is a node in the model.
Natural or virgin flow for each month is supplied to the model by specifying flow at every headwater node, and incremental stream gains and losses within each downstream reach. Where available, upper basin gages were selected as headwater nodes; in their absence, flow at the ungaged headwater point was estimated outside the spreadsheet.
Model output includes the diversion demand and simulated diversions at each of the diversion points, and streamflow at each of the Green River Basin nodes. Estimates of impacts associated with various water projects can be analyzed by changing input data, as decreases in available streamflow or as changes to diversions occur. New storage projects that alter the timing of streamflows or shortages may also be evaluated.
Model Development
The model was developed using Microsoft ® Excel 97. The workbooks contain macros written in Microsoft ® Excel Visual Basic programming language. The primary function of the macros is to facilitate navigation within the workbook. There are no macros that need to be executed to complete computation of any formulas or results. In other words, whenever a number is input into any cell anywhere in the workbook, the entire workbook is recalculated and updated automatically.
The delineation of a river basin by reaches and nodes is more an art than a science. The choice of nodes must consider the objectives of the study and the available data. It also must contain all the water resource features that govern the operation of the Basin. The analysis of results and their adequacy in addressing the objectives of the study are based on the input data and the configuration of the river basin by the computer model.
The following reaches and nodes are contained in each basin model:
Gage Data
Monthly stream gage data were obtained from the Wyoming Water Resources Data System (WRDS) for each of the stream gages used in the model. Linear regression techniques were used to estimate missing values for the many gages that had incomplete records. Once the gages were filled in for the study period, monthly values for Dry, Normal, and Wet conditions were averaged from the Dry, Normal, or Wet years of the study period.
Headwater inflow at several ungaged locations is also on the Gage Data worksheet. Different approaches to estimating the flow were used, depending on the complexity of the stream system and availability of data. The model uses estimated flow at ungaged headwater nodes as if they were gages.
Diversion Data
Diversions in the Green River Basin Models are attributable either to Municipal and Industrial use, or Agricultural use. The spreadsheets model only the consumptive portion of all municipal and industrial diversions. Agricultural diversion nodes fall into two categories: explicitly modeled structures, and aggregated structures. Explicitly modeled structures were structures for which adequate historical diversion records and a high confidence estimate of irrigated area were available. These structures generally served as indicators of irrigation practice throughout the Basin. Their entire diversions and resulting return flows were included in the model. For the aggregate structures, consumptive use only was modeled.
Data on the diversion data sheet are used to calculate ungaged reach gains and losses, and in some cases, inflow at ungaged headwater nodes. They are also used as the diversion demand in the Reach/Node worksheets.
Collection of agricultural diversion data is discussed in the technical memorandum Irrigation Diversion Operation and Description. These data were reviewed and ditches that had sufficient diversion data for analysis of average dry, normal and wet year conditions were selected for explicit modeling. No attempts were made to fill missing records. Diversion data for explicitly modeled structures are the average dry, normal and wet year monthly diversions, calculated from the available records.
Diversions for aggregated structures were calculated as the product of estimated irrigated acreage, monthly consumptive irrigation requirement (CIR), and the fraction of the month in which diversion was practiced. Monthly CIR is estimated as a function of latitude, precipitation, and temperature, and therefore varies for dry, normal, and wet conditions.
Municipal and industrial diversions were taken from the technical memoranda Basin Water Use Profile . Municipal and Basin Water Use Profile . Industrial. Values reported in these memoranda represent the consumptive use portion of the municipal and industrial diversions. No attempts were made to estimate return flows. With the exception of the Cheyenne Stage I and II diversions discussed below, no attempts were made to develop dry, normal and wet year municipal and industrial diversions.
Surface Water Availability
The Green River Basin spreadsheet model is a tool for identifying flows that are available to Wyoming water users for future development, and evaluating yield and impacts of potential projects at a planning level. The purpose of this task is to analyze historical runs developed during spreadsheet calibration to determine location, quantity, and timing of available flows. The calibration spreadsheets represent conditions in the four sub-basins (Little Snake, Henrys Fork, Blacks Fork, and Green River) under current levels of development for three hydrologic conditions: Dry, Normal, and Wet year water supply. Background information on the spreadsheet model can be found in other technical memos prepared for this project.
Available Flow
Each basin model is divided into a number of reaches, each composed of several nodes, or water balance points. Reaches are typically defined by gages or confluences, and represent tributary basins or subsections of the mainstem. An output worksheet in each spreadsheet model summarizes monthly flow at the downstream end of each reach, and provides the basis of this analysis.
While simulated flow at the reach terminus indicates estimated amount of water physically present, it does not fully reflect availability. If a downstream diverter has historically diverted the entire stream at its headgate, the water supply at the upper point is not available for future development; it is already needed to meet current requirements.
Available Water Determination
To determine how much of the physical supply is actually available to future uses, "available water" at a reach terminus was defined as the minimum of the physically available flow at that point, and "available water" at all downstream reaches. Thus available flow must be defined first at the most downstream point, with upstream availability calculated in stream order. These calculations were made on a monthly basis, and annual availability was computed as the sum of monthly availabilities. Note that calculating annual availability in this way yields a different value than applying the same logic to annual flows for each reach. The summation of monthly values is more accurate, reflecting constraints of downstream use on a monthly basis.
Instream Flow Right Considerations
Instream flow rights exert a demand on the river but do not affect physical supply, because the water is not removed from the stream. Thus any reach terminus located immediately upstream of a reach that contained an instream flow right had to be handled specially. That is, available flow at the upstream reach terminus was determined as the minimum of physical flow at that point, and "available water" less the instream flow requirement at the downstream reach terminus.
The two permitted instream flow rights and 32 pending instream flow applications were reviewed for applicability of the special handling described above. (See the technical memorandum.Instream Flows in Wyoming) Except for one, all the instream flow rights are located high enough in the Basin that they have no upstream reach in the model. The exception is a 1.5-mile long reach of the West Fork New Fork River, under permit #7IF. Available water at the downstream terminus of Reach 8 in the Green River sub-basin spreadsheet was calculated taking the instream flow demand into consideration.
Compact Considerations
The spreadsheet models do not contain logic to simulate curtailment of water rights on a priority basis in order to meet the State's obligations under the Upper Colorado River Basin Compact (the Compact). The models were developed to portray historical use over the study period 1971-1998. Never during that time, nor since the Compact was ratified, have diversions been curtailed pursuant to Article IV of the Compact. While the principles under which such administration should be conducted are set forth in the Compact, actual details of their application have not been worked out by the Upper Colorado River Commission. Accordingly, simulation of curtailment was outside the scope of this effort. The models could be used, however, to test the impacts of a future downstream demand representing a Compact delivery obligation.
Article XI of the Compact addresses the division of the waters of the Little Snake River, whose tributaries lie on both sides of the Colorado-Wyoming state line, and whose mainstem crosses the boundary numerous times. The Compact identifies a point 100 feet below the mouth of Savery Creek, above which pre-Compact rights are not subject to calls emanating from below the point. This administrative nuance does not alter the definition of available flow for new or future uses above the so-called Compact point, however, since they could be regulated to satisfy senior pre-Compact priority date water rights below the Compact point. Post-Compact rights, including future uses, below the Compact point, "shall be administered on the basis of an interstate priority schedule prepared by the Commission in conformity with priority dates established by the laws of the respective States," according to Article XI. Therefore, calculation of "available water" in this part of the Basin must take into consideration the needs of downstream users in Colorado. To summarize, the method of calculating available water described above, when applied to the Little Snake including the Colorado sections of the river, is in accordance with Article XI of the Compact.
Results
Table III-2 through Table III-13 summarize water availability for the four sub-basins and three hydrologic conditions on a monthly basis.
Table III-2 Available Flow for Little Snake River Basin and Dry Hydrologic
Condition
values in acre-feet
| Reach | Reach Name | Jan | Feb | Mar | Apr | May | Jun | Jul | Aug | Sep | Oct | Nov | Dec | Annual |
| 1 | North Fork Little Snake River | 436. | 431. | 814. | 3582. | 7442. | 3351. | 492. | 70. | 268. | 577. | 508. | 438. | 18409. |
| 2 | Middle Fork Little Snake River | 679. | 668. | 1457. | 7156. | 14971. | 6257. | 492. | 70. | 268. | 969. | 826. | 684. | 34497. |
| 3 | Little Snake River between Middle Fork and South Fork | 1406. | 1382. | 3015. | 14810. | 31471. | 14517. | 492. | 70. | 268. | 2006. | 1710. | 1416. | 72563. |
| 4 | South Fork Little Snake River | 257. | 253. | 552. | 2711. | 5617. | 2195. | 289. | 70. | 177. | 367. | 313. | 259. | 13060. |
| 5 | Little Snake River between South Fork and Roaring Fork Little Snake | 1663. | 1635. | 3567. | 17522. | 37074. | 16665. | 492. | 70. | 268. | 2373. | 2023. | 1675. | 85027. |
| 6 | Little Snake River between Roaring Fork and Battle Creek | 1663. | 1635. | 8814. | 20377. | 49645. | 21963. | 492. | 70. | 268. | 2373. | 2023. | 1675. | 111000. |
| 7 | Battle Creek | 967. | 993. | 2070. | 8308. | 11464. | 3490. | 429. | 70. | 268. | 1431. | 1292. | 1109. | 31890. |
| 8 | Little Snake River between Battle Creek and Slater Creek | 2378. | 2628. | 10885. | 28685. | 59873. | 21963. | 492. | 70. | 268. | 3802. | 3315. | 2783. | 137143. |
| 9 | Slater Creek | 986. | 1010. | 2022. | 7878. | 10768. | 3119. | 318. | 70. | 268. | 1422. | 1291. | 1119. | 30272. |
| 10 | Little Snake River between Slater Creek and Savery Creek | 2378. | 3221. | 12906. | 36563. | 59873. | 21963. | 492. | 70. | 268. | 3802. | 4406. | 2966. | 148911. |
| 11 | Savery Creek | 1685. | 1712. | 3687. | 12045. | 11530. | 3561. | 376. | 70. | 268. | 1870. | 1937. | 1873. | 40615. |
| 12 | Little Snake River between Savery Creek and Willow Creek | 2378. | 3221. | 16851. | 49518. | 59873. | 21963. | 492. | 70. | 268. | 3802. | 4406. | 2966. | 165810. |
| 13 | Willow Creek | 134. | 145. | 264. | 911. | 973. | 0. | 112. | 82. | 94. | 195. | 181. | 141. | 3230. |
| 14 | Little Snake River between Willow Creek and Muddy Creek | 3644. | 4549. | 16851. | 49518. | 59873. | 22629. | 911. | 520. | 436. | 4425. | 5454. | 4256. | 173067. |
| 15 | Muddy Creek | 24. | 18. | 3150. | 1560. | 1025. | 718. | 238. | 79. | 113. | 461. | 195. | 39. | 7618. |
| 16 | Little Snake River between Muddy Creek and Little Snake River near Lily, CO gage | 4472. | 5365. | 19805. | 49918. | 59873. | 28243. | 2878. | 644. | 436. | 6087. | 6620. | 5095. | 189437. |
Table III-3 Available Flow for Little Snake River Basin and Normal Hydrologic Condition
Values in acre-feet
| Reach | Reach Name | Jan | Feb | Mar | Apr | May | Jun | Jul | Aug | Sep | Oct | Nov | Dec | Annual |
| 1 | North Fork Little Snake River | 487. | 482. | 768. | 3022. | 14166. | 12396. | 2404. | 629. | 459. | 605. | 564. | 518. | 36500. |
| 2 | Middle Fork Little Snake River | 784. | 774. | 1362. | 6001. | 28794. | 24978. | 4451. | 1028. | 617. | 1027. | 942. | 848. | 71608. |
| 3 | Little Snake River between Middle Fork and South Fork | 1623. | 1602. | 2819. | 12421. | 60052. | 52683. | 10073. | 1250. | 617. | 2126. | 1950. | 1754. | 148971. |
| 4 | South Fork Little Snake River | 297. | 293. | 516. | 2274. | 10847. | 9329. | 1569. | 369. | 260. | 389. | 357. | 321. | 26822. |
| 5 | Little Snake River between South Fork and Roaring Fork Little Snake | 1921. | 1895. | 3335. | 14694. | 70882. | 61977. | 11611. | 1250. | 617. | 2515. | 2308. | 2076. | 175081. |
| 6 | Little Snake River between Roaring Fork and Battle Creek | 1921. | 3294. | 11796. | 17734. | 75301. | 75208. | 17326. | 1250. | 617. | 2515. | 2308. | 2076. | 211345. |
| 7 | Battle Creek | 1176. | 1181. | 2476. | 8078. | 28733. | 19262. | 3238. | 667. | 617. | 1434. | 1359. | 1240. | 69462. |
| 8 | Little Snake River between Battle Creek and Slater Creek | 3097. | 4475. | 14272. | 25812. | 104034. | 94470. | 18004. | 1250. | 617. | 3949. | 3666. | 3316. | 276963. |
| 9 | Slater Creek | 1182. | 1187. | 2403. | 7663. | 26974. | 17985. | 2961. | 677. | 617. | 1424. | 1354. | 1242. | 65669. |
| 10 | Little Snake River between Slater Creek and Savery Creek | 4242. | 5662. | 16675. | 33474. | 130783. | 111972. | 18004. | 1250. | 617. | 5275. | 5020. | 4558. | 337534. |
| 11 | Savery Creek | 2026. | 1997. | 3836. | 12621. | 34940. | 22007. | 3854. | 1120. | 617. | 2073. | 2101. | 2048. | 89242. |
| 12 | Little Snake River between Savery Creek and Willow Creek | 4242. | 7830. | 20954. | 47384. | 160497. | 120576. | 18004. | 1250. | 617. | 5275. | 6134. | 4616. | 397380. |
| 13 | Willow Creek | 180. | 172. | 449. | 1289. | 2226. | 1688. | 529. | 218. | 155. | 216. | 179. | 177. | 7478. |
| 14 | Little Snake River between Willow Creek and Muddy Creek | 5619. | 9450. | 20954. | 53211. | 164610. | 122097. | 20187. | 2176. | 1117. | 5459. | 6569. | 5945. | 417394. |
| 15 | Muddy Creek | 36. | 30. | 4765. | 2871. | 3080. | 1180. | 518. | 132. | 101. | 400. | 551. | 109. | 13772. |
| 16 | Little Snake River between Muddy Creek and Little Snake River near Lily, CO gage | 6446. | 10246. | 24151. | 56543. | 168774. | 127104. | 25778. | 4734. | 2436. | 7585. | 8449. | 6842. | 449088. |
Table III-4 Available Flow for Little Snake River Basin and Wet Hydrologic Condition
Values in acre-feet
| Reach | Reach Name | Jan | Feb | Mar | Apr | May | Jun | Jul | Aug | Sep | Oct | Nov | Dec | Annual |
| 1 | North Fork Little Snake River | 657. | 516. | 818. | 4190. | 19920. | 19855. | 3965. | 826. | 680. | 725. | 631. | 602. | 53386. |
| 2 | Middle Fork Little Snake River | 1133. | 845. | 1465. | 8407. | 40575. | 40349. | 7673. | 1432. | 1177. | 1275. | 1080. | 1022. | 106432. |
| 3 | Little Snake River between Middle Fork and South Fork | 2346. | 1748. | 3032. | 17398. | 84631. | 84445. | 16714. | 3115. | 2448. | 2639. | 2234. | 2115. | 222864. |
| 4 | South Fork Little Snake River | 429. | 320. | 555. | 3185. | 15284. | 15160. | 2794. | 522. | 445. | 483. | 409. | 387. | 39972. |
| 5 | Little Snake River between South Fork and Roaring Fork Little Snake | 2775. | 2068. | 3587. | 20583. | 99890. | 99571. | 19478. | 3631. | 2889. | 3122. | 2643. | 2502. | 262740. |
| 6 | Little Snake River between Roaring Fork and Battle Creek | 2775. | 2068. | 13301. | 24224. | 106992. | 116728. | 28786. | 4799. | 2889. | 3122. | 2643. | 2502. | 310829. |
| 7 | Battle Creek | 1482. | 1272. | 2475. | 8338. | 38864. | 27969. | 5514. | 1228. | 1605. | 2056. | 1658. | 1373. | 93834. |
| 8 | Little Snake River between Battle Creek and Slater Creek | 4257. | 3341. | 15776. | 32561. | 145856. | 144697. | 34300. | 4799. | 4366. | 5178. | 4302. | 3874. | 403306. |
| 9 | Slater Creek | 1469. | 1272. | 2402. | 7907. | 36451. | 26169. | 5103. | 1204. | 1583. | 2008. | 1635. | 1367. | 88569. |
| 10 | Little Snake River between Slater Creek and Savery Creek | 5726. | 4613. | 18178. | 40468. | 181986. | 170408. | 36612. | 4799. | 4366. | 7186. | 5937. | 5241. | 485518. |
| 11 | Savery Creek | 2230. | 2033. | 3554. | 12296. | 48005. | 33840. | 6678. | 1857. | 2481. | 2913. | 2531. | 2224. | 120640. |
| 12 | Little Snake River between Savery Creek and Willow Creek | 5974. | 5981. | 22288. | 54464. | 227350. | 194067. | 36612. | 4799. | 4366. | 7857. | 7732. | 6621. | 577710. |
| 13 | Willow Creek | 255. | 247. | 558. | 1700. | 3139. | 2611. | 1004. | 277. | 266. | 318. | 250. | 234. | 10860. |
| 14 | Little Snake River between Willow Creek and Muddy Creek | 7361. | 7565. | 23748. | 63058. | 240561. | 211738. | 42260. | 5700. | 5118. | 8286. | 8329. | 7416. | 631140. |
| 15 | Muddy Creek | 36. | 30. | 4765. | 2871. | 3080. | 1180. | 518. | 132. | 101. | 400. | 551. | 109. | 13772. |
| 16 | Little Snake River between Muddy Creek and Little Snake River near Lily, CO gage | 8177. | 8373. | 29155. | 66325. | 243117. | 215717. | 47410. | 9398. | 8268. | 10852. | 10250. | 8303. | 665345. |
Table III-5 Available Flow for Henrys Fork Basin and Dry Hydrologic Condition
Values in acre-feet
| Reach | Reach Name | Jan | Feb | Mar | Apr | May | Jun | Jul | Aug | Sep | Oct | Nov | Dec | Annual |
| 1 | Below Henrys Fork near Lonetree (09226000) and Beaver Creek | 541. | 473. | 1000. | 868. | 1459. | 3113. | 236. | 121. | 59. | 548. | 626. | 580. | 9624. |
| 2 | Beaver Creek | 965. | 883. | 1456. | 1331. | 1459. | 3113. | 236. | 121. | 59. | 897. | 1048. | 1019. | 12588. |
| 3 | Henrys Fork between Beaver Creek and Burnt Fork | 1506. | 1356. | 2456. | 1694. | 1459. | 3113. | 236. | 121. | 59. | 897. | 1674. | 1599. | 16170. |
| 4 | Burnt Fork | 464. | 449. | 495. | 585. | 2030. | 2995. | 581. | 435. | 298. | 639. | 562. | 497. | 10030. |
| 5 | Henrys Fork between Burnt Fork and Birch Creek | 1970. | 1805. | 3049. | 2279. | 2030. | 4004. | 581. | 435. | 298. | 1399. | 2236. | 2096. | 22181. |
| 6 | Birch Creek | 171. | 166. | 183. | 216. | 924. | 1269. | 419. | 335. | 199. | 236. | 207. | 183. | 4507. |
| 7 | Henrys Fork between Birch Creek and Henrys Fork near Manila, UT gage (09229500) | 2116. | 1939. | 3231. | 2336. | 2030. | 4004. | 581. | 435. | 298. | 1399. | 2313. | 2224. | 22906. |
Table III-6 Available Flow for Henrys Fork Basin and Normal Hydrologic Condition
Values in acre-feet
| Reach | Reach Name | Jan | Feb | Mar | Apr | May | Jun | Jul | Aug | Sep | Oct | Nov | Dec | Annual |
| 1 | Below Henrys Fork near Lonetree (09226000) and Beaver Creek | 844. | 978. | 1908. | 1870. | 6103. | 9691. | 3064. | 1310. | 588. | 862. | 1151. | 937. | 29305. |
| 2 | Beaver Creek | 1259. | 1388. | 2378. | 2418. | 6439. | 9150. | 3620. | 1397. | 934. | 1264. | 1573. | 1358. | 33179. |
| 3 | Henrys Fork between Beaver Creek and Burnt Fork | 2103. | 2366. | 4286. | 4288. | 8212. | 12875. | 3620. | 1397. | 1155. | 2126. | 2724. | 2295. | 47448. |
| 4 | Burnt Fork | 532. | 498. | 551. | 737. | 3574. | 6212. | 2306. | 1121. | 612. | 821. | 654. | 580. | 18199. |
| 5 | Henrys Fork between Burnt Fork and Birch Creek | 2636. | 2942. | 5179. | 5112. | 9994. | 15472. | 4599. | 1954. | 1666. | 2841. | 3379. | 2874. | 58645. |
| 6 | Birch Creek | 196. | 184. | 203. | 272. | 1359. | 2430. | 959. | 442. | 259. | 303. | 241. | 214. | 7062. |
| 7 | Henrys Fork between Birch Creek and Henrys Fork near Manila, UT gage (09229500) | 2817. | 3126. | 5382. | 5384. | 9994. | 15472. | 4599. | 1954. | 1666. | 2841. | 3547. | 3042. | 59821. |
Table III-7 Available Flow for Henrys Fork Basin and Wet Hydrologic Condition
Values in acre-feet
| Reach | Reach Name | Jan | Feb | Mar | Apr | May | Jun | Jul | Aug | Sep | Oct | Nov | Dec | Annual |
| 1 | Below Henrys Fork near Lonetree (09226000) and Beaver Creek | 1343. | 1012. | 2405. | 2735. | 8557. | 17944. | 8138. | 2781. | 1586. | 1904. | 1583. | 1244. | 51233. |
| 2 | Beaver Creek | 1760. | 1420. | 2886. | 3668. | 11101. | 17226. | 8992. | 3459. | 2162. | 2301. | 1999. | 1653. | 58627. |
| 3 | Henrys Fork between Beaver Creek and Burnt Fork | 3103. | 2433. | 5291. | 6403. | 15595. | 32654. | 17072. | 6193. | 3742. | 4205. | 3582. | 2897. | 103169. |
| 4 | Burnt Fork | 579. | 535. | 594. | 925. | 3501. | 11749. | 7713. | 2618. | 1359. | 1000. | 748. | 644. | 31963. |
| 5 | Henrys Fork between Burnt Fork and Birch Creek | 3778. | 3006. | 6343. | 7527. | 18668. | 38708. | 20403. | 7621. | 4742. | 5204. | 4330. | 3542. | 123873. |
| 6 | Birch Creek | 213. | 197. | 219. | 341. | 1328. | 4454. | 2940. | 989. | 511. | 369. | 276. | 238. | 12075. |
| 7 | Henrys Fork between Birch Creek and Henrys Fork near Manila, UT gage (09229500) | 3992. | 3204. | 6562. | 7868. | 18668. | 38708. | 20403. | 7621. | 4742. | 5286. | 4554. | 3750. | 125358. |
Table III-8 Available Flow for Blacks Fork Basin and Dry Hydrologic Condition
Values in acre-feet
| Reach | Reach Name | Jan | Feb | Mar | Apr | May | Jun | Jul | Aug | Sep | Oct | Nov | Dec | Annual |
| 1 | Upper Blacks Fork | 775. | 1134. | 3462. | 3180. | 4225. | 3718. | 2049. | 840. | 644. | 1200. | 1050. | 982. | 23260. |
| 2 | West Fork of Smiths Fork | 331. | 506. | 1554. | 1387. | 2696. | 1269. | 937. | 113. | 499. | 372. | 452. | 420. | 10534. |
| 3 | East Fork of Smiths Fork | 478. | 549. | 1108. | 1124. | 4093. | 4766. | 2049. | 840. | 644. | 793. | 600. | 529. | 17573. |
| 4 | Smiths Fork | 848. | 1139. | 3018. | 2794. | 4505. | 4766. | 2049. | 840. | 644. | 1884. | 1312. | 1016. | 24816. |
| 5 | Cottonwood Creek | 140. | 194. | 541. | 610. | 1306. | 77. | 0. | 0. | 0. | 195. | 191. | 171. | 3424. |
| 6 | Smiths Fork between Cottonwood Creek and Blacks Fork River | 988. | 1332. | 3559. | 3404. | 5811. | 4766. | 2049. | 840. | 644. | 2079. | 1503. | 1186. | 28163. |
| 7 | Blacks Fork between Smiths Fork and Muddy Creek | 1763. | 2466. | 7021. | 6584. | 6888. | 4766. | 2049. | 840. | 644. | 2481. | 2433. | 2168. | 40105. |
| 8 | Little Muddy Creek | 308. | 487. | 600. | 971. | 450. | 167. | 81. | 139. | 90. | 241. | 547. | 479. | 4560. |
| 9 | Upper Muddy Creek | 0. | 18. | 343. | 449. | 224. | 61. | 0. | 0. | 0. | 0. | 139. | 0. | 1234. |
| 10 | Muddy Creek below Little Muddy Creek | 308. | 505. | 943. | 1420. | 674. | 228. | 81. | 139. | 90. | 241. | 686. | 479. | 5794. |
| 11 | Blacks Fork between Muddy Creek and Hams Fork | 2071. | 3071. | 10130. | 10111. | 10946. | 5218. | 2166. | 979. | 734. | 2772. | 3207. | 2647. | 54053. |
| 12 | Hams Fork River | 961. | 1069. | 7058. | 7762. | 16874. | 7251. | 1578. | 1448. | 259. | 1668. | 1376. | 1052. | 48355. |
| 13 | Blacks Fork between Hams Fork and Blacks Fork nr Little America gage | 2783. | 4140. | 17188. | 17873. | 27820. | 12469. | 3744. | 1448. | 832. | 4439. | 4583. | 3622. | 100941. |
Table III-9 Available Flow for Blacks Fork Basin and Normal Hydrologic Condition
Values in acre-feet
| Reach | Reach Name | Jan | Feb | Mar | Apr | May | Jun | Jul | Aug | Sep | Oct | Nov | Dec | Annual |
| 1 | Upper Blacks Fork | 1366. | 1738. | 5347. | 7403. | 10309. | 11695. | 4814. | 2740. | 2111. | 1806. | 1735. | 1249. | 52313. |
| 2 | West Fork of Smiths Fork | 500. | 714. | 2286. | 2584. | 4749. | 4078. | 957. | 377. | 493. | 436. | 633. | 461. | 18266. |
| 3 | East Fork of Smiths Fork | 704. | 751. | 1657. | 1978. | 4964. | 10491. | 5081. | 2546. | 1688. | 1358. | 884. | 670. | 32772. |
| 4 | Smiths Fork | 1324. | 1625. | 4537. | 5629. | 9858. | 11907. | 6448. | 3047. | 2589. | 2008. | 1738. | 1231. | 51942. |
| 5 | Cottonwood Creek | 192. | 267. | 771. | 910. | 2362. | 1710. | 109. | 112. | 64. | 228. | 281. | 205. | 7211. |
| 6 | Smiths Fork between Cottonwood Creek and Blacks Fork River | 1516. | 1892. | 5308. | 6538. | 12219. | 13617. | 6557. | 3047. | 2589. | 2236. | 2020. | 1436. | 58976. |
| 7 | Blacks Fork between Smiths Fork and Muddy Creek | 2882. | 3630. | 10655. | 13941. | 21421. | 23177. | 7073. | 3047. | 2589. | 3188. | 3755. | 2684. | 98042. |
| 8 | Little Muddy Creek | 469. | 718. | 2168. | 5353. | 2348. | 1257. | 545. | 314. | 264. | 342. | 298. | 404. | 14479. |
| 9 | Upper Muddy Creek | 111. | 369. | 2804. | 2259. | 6962. | 2862. | 400. | 0. | 0. | 322. | 412. | 258. | 16759. |
| 10 | Muddy Creek below Little Muddy Creek | 580. | 1086. | 4972. | 7612. | 9310. | 4119. | 945. | 314. | 264. | 664. | 710. | 663. | 31238. |
| 11 | Blacks Fork between Muddy Creek and Hams Fork | 3626. | 4910. | 16842. | 22773. | 33457. | 27878. | 8176. | 3361. | 2853. | 3914. | 4696. | 3347. | 135832. |
| 12 | Hams Fork River | 2030. | 1988. | 6676. | 12840. | 28300. | 24186. | 7099. | 3041. | 3040. | 1947. | 2099. | 1683. | 94931. |
| 13 | Blacks Fork between Hams Fork and Blacks Fork nr Little America gage | 5656. | 6898. | 23518. | 35613. | 61757. | 52064. | 15276. | 5919. | 4542. | 5861. | 6796. | 4948. | 228847. |
Table III-10 Available Flow for Blacks Fork Basin and Wet Hydrologic Condition
Values in acre-feet
| Reach | Reach Name | Jan | Feb | Mar | Apr | May | Jun | Jul | Aug | Sep | Oct | Nov | Dec | Annual |
| 1 | Upper Blacks Fork | 1773. | 2157. | 6603. | 7841. | 19093. | 33210. | 14269. | 5162. | 4046. | 3109. | 2517. | 1755. | 101534. |
| 2 | West Fork of Smiths Fork | 649. | 861. | 2852. | 2963. | 6682. | 9658. | 4581. | 1458. | 1135. | 890. | 824. | 600. | 33152. |
| 3 | East Fork of Smiths Fork | 849. | 898. | 1975. | 2201. | 6335. | 18716. | 12871. | 4720. | 3451. | 1888. | 1319. | 882. | 56104. |
| 4 | Smiths Fork | 1654. | 1964. | 5553. | 6185. | 15240. | 29056. | 18554. | 8654. | 6329. | 3775. | 2693. | 1639. | 101297. |
| 5 | Cottonwood Creek | 289. | 346. | 1009. | 1081. | 2367. | 4688. | 2107. | 693. | 563. | 465. | 427. | 286. | 14322. |
| 6 | Smiths Fork between Cottonwood Creek and Blacks Fork River | 1943. | 2310. | 6562. | 7266. | 17607. | 33744. | 20661. | 9347. | 6892. | 4240. | 3120. | 1926. | 115619. |
| 7 | Blacks Fork between Smiths Fork and Muddy Creek | 3717. | 4467. | 13164. | 15107. | 36700. | 66954. | 30869. | 9998. | 7379. | 6365. | 5531. | 3680. | 203932. |
| 8 | Little Muddy Creek | 469. | 718. | 2168. | 5353. | 2348. | 1257. | 545. | 314. | 264. | 342. | 298. | 404. | 14479. |
| 9 | Upper Muddy Creek | 111. | 369. | 2804. | 2259. | 6962. | 2862. | 400. | 0. | 0. | 322. | 412. | 258. | 16759. |
| 10 | Muddy Creek below Little Muddy Creek | 580. | 1086. | 4972. | 7612. | 9310. | 4119. | 945. | 314. | 264. | 664. | 710. | 663. | 31238. |
| 11 | Blacks Fork between Muddy Creek and Hams Fork | 4296. | 5554. | 18704. | 22719. | 46010. | 77087. | 33989. | 11437. | 8803. | 7481. | 6717. | 4372. | 247168. |
| 12 | Hams Fork River | 4065. | 5605. | 8788. | 14857. | 46235. | 62688. | 21846. | 6865. | 5462. | 3104. | 3411. | 2892. | 185820. |
| 13 | Blacks Fork between Hams Fork and Blacks Fork nr Little America gage | 7226. | 9062. | 27492. | 32467. | 89150. | 139775. | 55835. | 18302. | 14265. | 10585. | 10128. | 7264. | 421550. |
Table III-11 Available Flow for Green River Basin and Dry Hydrologic Condition
Values in acre-feet
| Reach | Reach Name | Jan | Feb | Mar | Apr | May | Jun | Jul | Aug | Sep | Oct | Nov | Dec | Annual |
| 1 | Upper Green River above Warren Bridge | 5935. | 5567. | 6802. | 17403. | 44939. | 58043. | 28074. | 15919. | 12146. | 10460. | 6890. | 6658. | 218836. |
| 2 | Beaver Creek | 335. | 305. | 639. | 2261. | 1777. | 870. | 42. | 39. | 201. | 277. | 382. | 359. | 7487. |
| 3 | Green River between Beaver Creek and Horse Creek | 6332. | 5956. | 7728. | 19757. | 44939. | 58043. | 28074. | 15919. | 12146. | 10816. | 7429. | 7095. | 224233. |
| 4 | Horse Creek | 784. | 899. | 2417. | 2513. | 5072. | 4289. | 2453. | 1634. | 490. | 1113. | 1525. | 916. | 24105. |
| 5 | Green River between Horse Creek and Cottonwood Creek | 7116. | 6855. | 10145. | 22269. | 48757. | 58043. | 28074. | 15919. | 12337. | 11929. | 8954. | 8011. | 238409. |
| 6 | Cottonwood Creek | 856. | 1012. | 2842. | 2638. | 1597. | 0. | 1332. | 525. | 171. | 1381. | 1846. | 1072. | 15271. |
| 7 | Green River between Cottonwood Creek and New Fork River | 7972. | 7867. | 12987. | 24907. | 49791. | 58043. | 28074. | 15919. | 12374. | 13311. | 10799. | 9083. | 251126. |
| 8 | West Fork New Fork River above Pine Creek | 0. | 0. | 0. | 1854. | 15535. | 29488. | 7479. | 0. | 0. | 1679. | 617. | 0. | 56652. |
| 9 | Pine Creek | 4218. | 3460. | 4645. | 7507. | 24818. | 39148. | 18092. | 7787. | 5583. | 7520. | 6270. | 5319. | 134368. |
| 10 | Pole Creek | 5090. | 4216. | 5560. | 9478. | 24818. | 39148. | 20696. | 8080. | 5583. | 9537. | 7830. | 6327. | 146362. |
| 11 | Boulder Creek | 5500. | 4624. | 6136. | 10629. | 42618. | 66935. | 30185. | 11231. | 7712. | 11707. | 8723. | 6869. | 212870. |
| 12 | East Fork New Fork River | 2957. | 3196. | 4336. | 3941. | 21509. | 17287. | 8446. | 4899. | 4237. | 4259. | 4270. | 3342. | 82678. |
| 13 | New Fork River below confluence of West and East Forks | 10873. | 10550. | 14118. | 15055. | 56830. | 66935. | 44057. | 20146. | 15270. | 18493. | 16228. | 12823. | 301380. |
| 14 | Green River between New Fork River and Piney Creeks | 18969. | 18586. | 27678. | 40148. | 57368. | 66935. | 52932. | 35771. | 27534. | 31961. | 27341. | 22062. | 427285. |
| 15 | North Piney Creek | 1112. | 1274. | 3429. | 1858. | 785. | 0. | 2204. | 1629. | 193. | 1800. | 2305. | 1324. | 17913. |
| 16 | Middle Piney Creek | 992. | 1213. | 3496. | 1527. | 561. | 0. | 3435. | 2653. | 299. | 1393. | 2138. | 1188. | 18895. |
| 17 | South Piney Creek | 902. | 1035. | 2786. | 2888. | 2800. | 1062. | 1282. | 1426. | 408. | 1282. | 1756. | 1055. | 18684. |
| 18 | Green River between Piney Creeks and LaBarge Creek | 21967. | 22102. | 37383. | 46416. | 57368. | 66935. | 52932. | 41508. | 28513. | 36476. | 33556. | 25624. | 470781. |
| 19 | LaBarge Creek | 2404. | 2298. | 3595. | 4096. | 6916. | 3872. | 2936. | 2193. | 1950. | 2772. | 3082. | 2759. | 38874. |
| 20 | Green River between LaBarge Creek and Fontenelle Reservoir | 24372. | 24400. | 40602. | 50512. | 57368. | 66935. | 52932. | 43942. | 30622. | 39311. | 36667. | 28393. | 496055. |
| 21 | Fontenelle Creek | 1347. | 1297. | 1890. | 3470. | 4231. | 2939. | 610. | 565. | 934. | 1793. | 1607. | 1413. | 22095. |
| 22 | Green River between Fontenelle Reservoir and Big Sandy River | 50627. | 41291. | 40602. | 61966. | 57368. | 66935. | 52932. | 51463. | 39138. | 47695. | 49963. | 53297. | 613277. |
| 23 | Big Sandy River below Farson gage and Green River | 1550. | 1415. | 3170. | 2687. | 2178. | 2582. | 2928. | 3037. | 2950. | 3112. | 2677. | 1892. | 30177. |
| 24 | Green River between Big Sandy River and Green River near Green River gage | 50627. | 42740. | 44590. | 63005. | 57368. | 66935. | 52932. | 51463. | 39138. | 47695. | 49963. | 53297. | 619753. |
Table III-12 Available Flow for Green River Basin and Normal Hydrologic Condition
Values in acre-feet
| Reach | Reach Name | Jan | Feb | Mar | Apr | May | Jun | Jul | Aug | Sep | Oct | Nov | Dec | Annual |
| 1 | Upper Green River above Warren Bridge | 6689. | 6159. | 7726. | 16510. | 59720. | 98850. | 80423. | 29914. | 17985. | 14043. | 9305. | 7553. | 354878. |
| 2 | Beaver Creek | 676. | 635. | 894. | 7554. | 6966. | 3053. | 48. | 135. | 197. | 562. | 813. | 710. | 22243. |
| 3 | Green River between Beaver Creek and Horse Creek | 7391. | 6842. | 8780. | 24321. | 64490. | 98850. | 80423. | 29914. | 17985. | 14618. | 10216. | 8300. | 372130. |
| 4 | Horse Creek | 1051. | 1101. | 2107. | 6460. | 15209. | 16446. | 5603. | 3742. | 1179. | 1512. | 1826. | 1158. | 57393. |
| 5 | Green River between Horse Creek and Cottonwood Creek | 8442. | 7943. | 10887. | 30782. | 78265. | 112263. | 82733. | 31262. | 18595. | 16129. | 12042. | 9458. | 418801. |
| 6 | Cottonwood Creek | 1299. | 1350. | 2752. | 8430. | 9787. | 9073. | 6528. | 3599. | 1256. | 2043. | 2302. | 1430. | 49850. |
| 7 | Green River between Cottonwood Creek and New Fork River | 9741. | 9293. | 13639. | 39212. | 87407. | 119973. | 87781. | 33785. | 19595. | 18172. | 14344. | 10888. | 463832. |
| 8 | West Fork New Fork River above Pine Creek | 0. | 0. | 39. | 5777. | 21286. | 57224. | 24194. | 7536. | 2124. | 3047. | 954. | 0. | 122181. |
| 9 | Pine Creek | 4803. | 4577. | 5880. | 11430. | 34534. | 98862. | 51498. | 16933. | 10158. | 8888. | 6607. | 5377. | 259547. |
| 10 | Pole Creek | 6169. | 5857. | 7252. | 14054. | 34828. | 99118. | 60537. | 19678. | 10158. | 9275. | 8057. | 6754. | 281736. |
| 11 | Boulder Creek | 7262. | 6806. | 8348. | 16319. | 59468. | 164908. | 86225. | 27205. | 15343. | 13019. | 9694. | 8022. | 422619. |
| 12 | East Fork New Fork River | 3188. | 3237. | 4597. | 7165. | 32042. | 46727. | 20547. | 7246. | 5110. | 7659. | 6468. | 4232. | 148218. |
| 13 | New Fork River below confluence of West and East Forks | 12790. | 12531. | 16639. | 27633. | 80235. | 181813. | 116202. | 39376. | 23239. | 25771. | 21068. | 15347. | 572643. |
| 14 | Green River between New Fork River and Piney Creeks | 22585. | 21920. | 30597. | 67358. | 163844. | 246144. | 196206. | 73300. | 42759. | 43969. | 35609. | 26307. | 970598. |
| 15 | North Piney Creek | 1098. | 1239. | 2534. | 4341. | 4520. | 8033. | 8791. | 5483. | 1269. | 1739. | 2139. | 1280. | 42466. |
| 16 | Middle Piney Creek | 756. | 957. | 2268. | 3711. | 2335. | 3786. | 8835. | 6373. | 1487. | 1017. | 1714. | 906. | 34147. |
| 17 | South Piney Creek | 1207. | 1265. | 2425. | 7428. | 12187. | 10004. | 464. | 2233. | 254. | 1736. | 2100. | 1331. | 42636. |
| 18 | Green River between Piney Creeks and LaBarge Creek | 25639. | 25376. | 37819. | 82833. | 163844. | 246144. | 196206. | 88331. | 46539. | 48767. | 41698. | 29860. | 1033054. |
| 19 | LaBarge Creek | 3215. | 3033. | 4085. | 7269. | 13312. | 9118. | 6639. | 4401. | 3885. | 4646. | 4193. | 3518. | 67314. |
| 20 | Green River between LaBarge Creek and Fontenelle Reservoir | 28854. | 28409. | 41903. | 90102. | 163844. | 246144. | 196206. | 93447. | 51012. | 53667. | 45962. | 33405. | 1072953. |
| 21 | Fontenelle Creek | 1643. | 1537. | 2084. | 5729. | 12740. | 12740. | 4518. | 2062. | 1765. | 2086. | 1925. | 1751. | 50583. |
| 22 | Green River between Fontenelle Reservoir and Big Sandy River | 56650. | 56499. | 65350. | 95495. | 163844. | 246144. | 196206. | 105392. | 61884. | 59142. | 55769. | 54215. | 1216590. |
| 23 | Big Sandy River below Farson gage and Green River | 1980. | 2034. | 4730. | 6111. | 4234. | 6747. | 6033. | 5123. | 4542. | 3822. | 3171. | 2484. | 51011. |
| 24 | Green River between Big Sandy River and Green River near Green River gage | 58891. | 59204. | 73947. | 99523. | 163844. | 251899. | 214389. | 112609. | 66028. | 59142. | 55769. | 54255. | 1269499. |
Table III-13 Available Flow for Green River Basin and Wet Hydrologic Condition
Values in acre-feet
| Reach | Reach Name | Jan | Feb | Mar | Apr | May | Jun | Jul | Aug | Sep | Oct | Nov | Dec | Annual |
| 1 | Upper Green River above Warren Bridge | 7632. | 6557. | 8645. | 16682. | 82151. | 179777. | 94945. | 42993. | 23604. | 11568. | 9572. | 9557. | 493682. |
| 2 | Beaver Creek | 723. | 646. | 877. | 9492. | 16816. | 7275. | 1228. | 638. | 348. | 702. | 913. | 810. | 40467. |
| 3 | Green River between Beaver Creek and Horse Creek | 8418. | 7285. | 9937. | 26213. | 95856. | 183091. | 94945. | 42993. | 23910. | 12427. | 10633. | 10403. | 526110. |
| 4 | Horse Creek | 1248. | 1322. | 3731. | 6418. | 22623. | 31328. | 10557. | 6290. | 3109. | 2571. | 2328. | 1132. | 92658. |
| 5 | Green River between Horse Creek and Cottonwood Creek | 9667. | 8607. | 13667. | 32631. | 116449. | 211532. | 102314. | 46854. | 26812. | 14998. | 12961. | 11535. | 608028. |
| 6 | Cottonwood Creek | 1294. | 1442. | 4508. | 12234. | 19033. | 24265. | 16016. | 7683. | 3902. | 2985. | 2790. | 1284. | 97436. |
| 7 | Green River between Cottonwood Creek and New Fork River | 10961. | 10048. | 18176. | 44866. | 134569. | 234500. | 116898. | 53446. | 30622. | 17982. | 15751. | 12819. | 700637. |
| 8 | West Fork New Fork River above Pine Creek | 376. | 537. | 1451. | 9676. | 21227. | 73459. | 46053. | 13197. | 7022. | 5134. | 3492. | 1092. | 182717. |
| 9 | Pine Creek | 6218. | 5813. | 7292. | 15574. | 37566. | 124681. | 91686. | 28635. | 15055. | 10975. | 9145. | 6934. | 359575. |
| 10 | Pole Creek | 8165. | 7561. | 8848. | 18843. | 43672. | 126058. | 108776. | 35334. | 15055. | 12209. | 10504. | 8768. | 403794. |
| 11 | Boulder Creek | 9448. | 9164. | 10948. | 22327. | 69011. | 206329. | 154498. | 49157. | 24758. | 15568. | 11922. | 9924. | 593052. |
| 12 | East Fork New Fork River | 2590. | 1850. | 6723. | 8598. | 31331. | 85624. | 18685. | 4659. | 5067. | 7389. | 5308. | 4011. | 181835. |
| 13 | New Fork River below confluence of West and East Forks | 13607. | 12003. | 23205. | 36400. | 80518. | 303150. | 156347. | 54412. | 31838. | 27207. | 20962. | 16785. | 776433. |
| 14 | Green River between New Fork River and Piney Creeks | 24696. | 22216. | 42209. | 81345. | 214246. | 520231. | 273410. | 108286. | 62924. | 45501. | 37010. | 29676. | 1461752. |
| 15 | North Piney Creek | 1387. | 1554. | 5142. | 2552. | 6330. | 21756. | 16382. | 9059. | 4735. | 3277. | 2656. | 1229. | 76060. |
| 16 | Middle Piney Creek | 1131. | 1322. | 5096. | 1495. | 2798. | 14140. | 13315. | 9123. | 4681. | 2695. | 2258. | 879. | 58934. |
| 17 | South Piney Creek | 1436. | 1521. | 4299. | 7373. | 21350. | 23087. | 2666. | 5132. | 2480. | 2958. | 2679. | 1301. | 76282. |
| 18 | Green River between Piney Creeks and LaBarge Creek | 28644. | 26608. | 56741. | 92758. | 228370. | 520231. | 307332. | 132680. | 75892. | 54809. | 44760. | 33139. | 1601962. |
| 19 | LaBarge Creek | 3268. | 3459. | 5894. | 9530. | 25619. | 22859. | 10135. | 8637. | 6493. | 4723. | 3912. | 2903. | 107432. |
| 20 | Green River between LaBarge Creek and Fontenelle Reservoir | 31912. | 30067. | 62635. | 102288. | 228370. | 520231. | 318376. | 140233. | 81387. | 59707. | 47877. | 36075. | 1659158. |
| 21 | Fontenelle Creek | 1792. | 1628. | 2520. | 9443. | 23982. | 26841. | 7484. | 3402. | 2854. | 2072. | 1858. | 1710. | 85586. |
| 22 | Green River between Fontenelle Reservoir and Big Sandy River | 55141. | 53517. | 77604. | 118211. | 228370. | 520231. | 345100. | 140233. | 81387. | 79281. | 47877. | 55499. | 1802451. |
| 23 | Big Sandy River below Farson gage and Green River | 2232. | 2192. | 9553. | 12503. | 8413. | 19093. | 12192. | 6503. | 5445. | 4322. | 3995. | 2623. | 89067. |
| 24 | Green River between Big Sandy River and Green River near Green River gage | 57303. | 55888. | 91293. | 140212. | 261167. | 537167. | 345100. | 140233. | 81387. | 92410. | 64343. | 57857. | 1924360. |
| Annual Available Supply - (acre-feet per year) | |||
| Basin | Dry Condition | Normal Condition | Wet Condition |
| Little Snake | 189,000 | 449,000 | 665,000 |
| Henrys Fork | 23,000 | 60,000 | 125,000 |
| Blacks Fork | 101,000 | 229,000 | 422,000 |
| Green River | 620,000 | 1,269,000 | 1,924,000 |
Figure III-6 through Figure III-8 show the annual surface water physical availability for dry, wet, and normal year scenarios. The tabulations show annual available supply at the bottom of the system for each basin as follows:
Figure III-6 Available Flow Modeling Results, Dry Year (4 Diagrams)
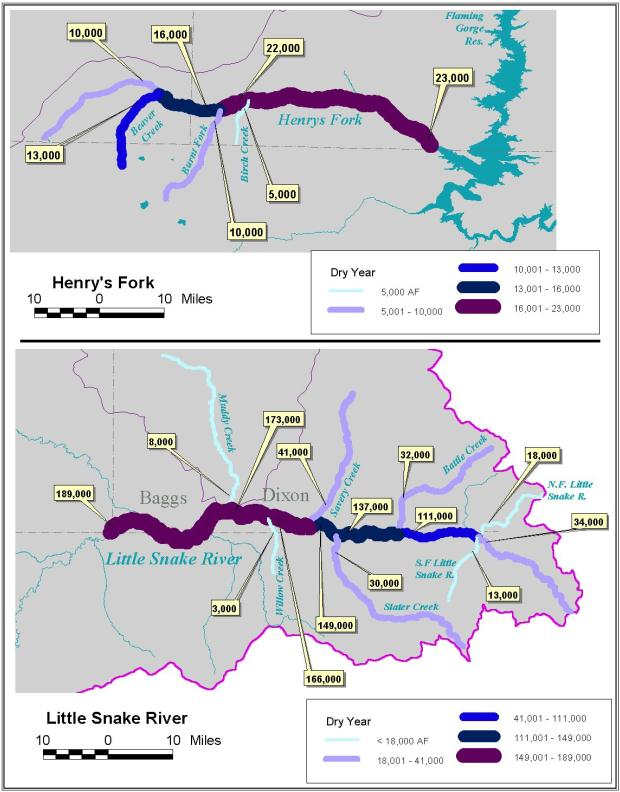
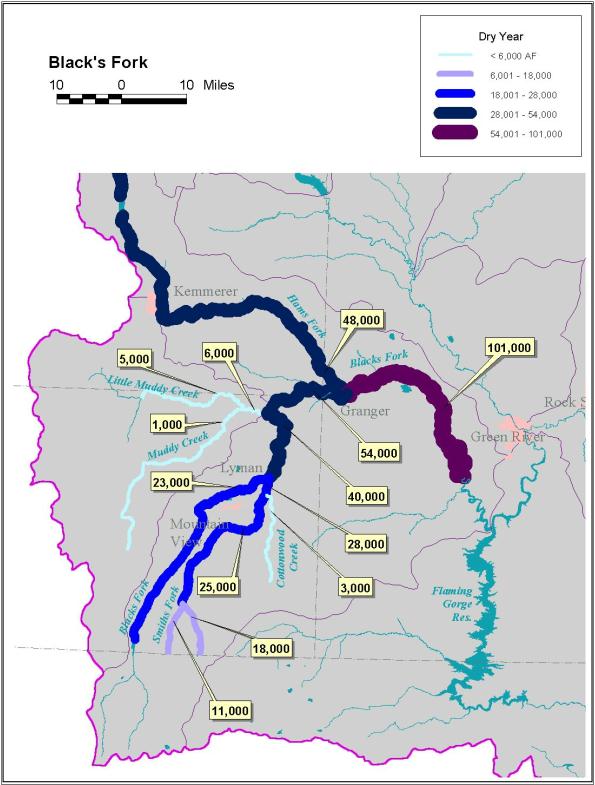
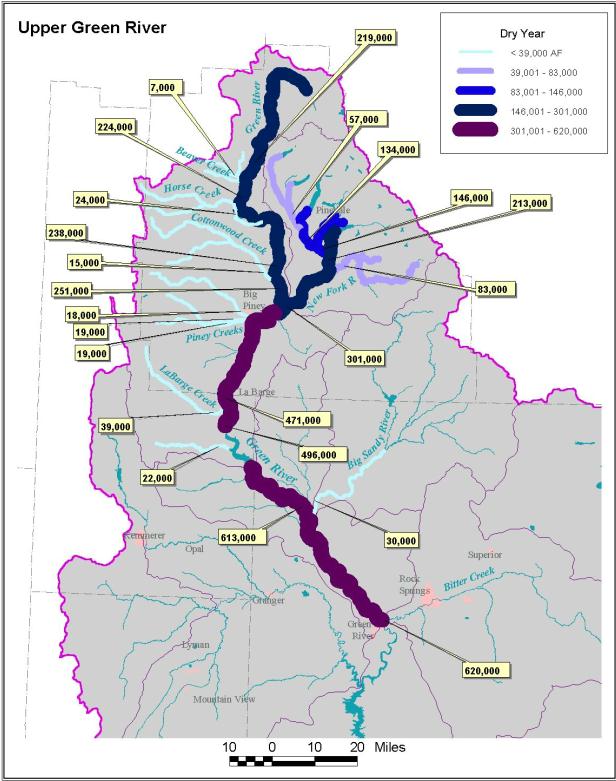
Figure III-7 Available Flow Modeling Results, Normal Year (4 Diagrams)
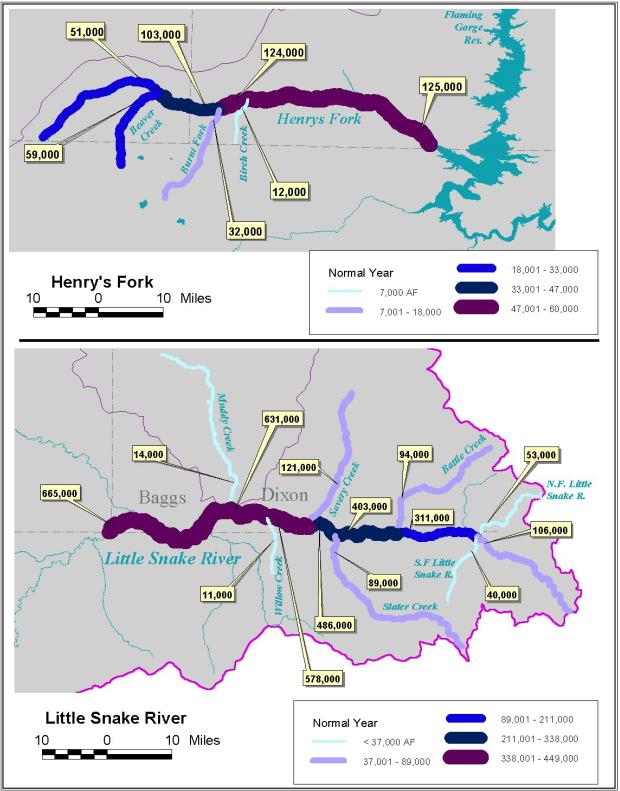
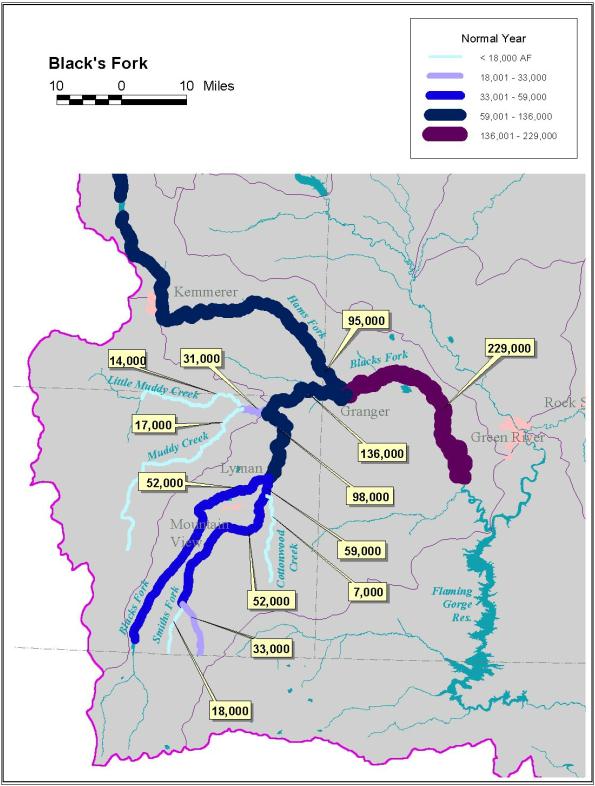
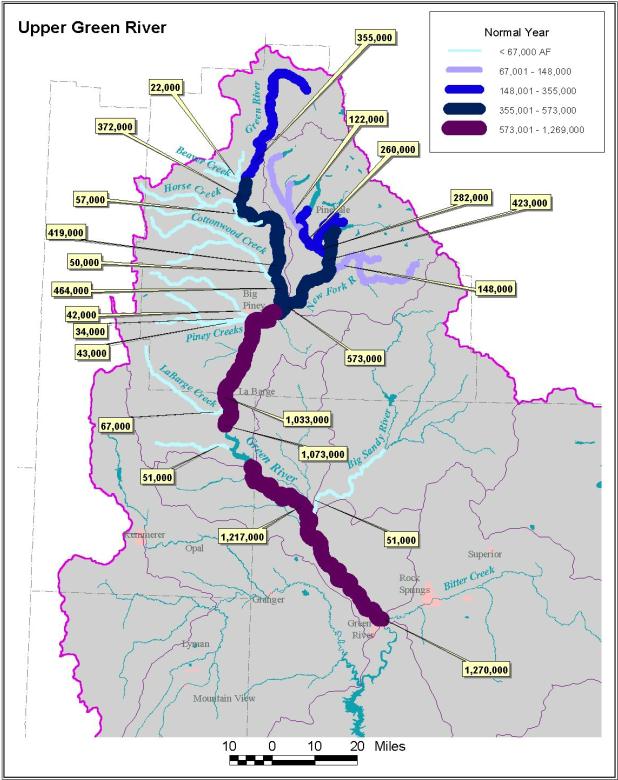
Figure III-8 Available Flow Modeling Results, Wet Year (4 Diagrams)


The following subsections describe groundwater conditions, groundwater quality, and groundwater development potential in the Greater Green River Basin of Wyoming.
Basin Overview
There has been relatively little development of the groundwater resources of Wyoming's Green River Basin. As a result, information on well yield, aquifer properties, water quality, and recharge and discharge relationships is sparse relative to other, more developed areas of the State. Well yield and aquifer data were inferred from available information from the existing wells and previous studies.
Basin Groundwater Conditions
Eight major aquifer systems have been identified within the study area. These aquifer systems (or in some cases individual aquifers) are identified by the geologic formation within which they occur. This definition allows for a simplified presentation of the relatively abundant and complex aquifers that underlie the Greater Green River Basin.
The eight major water-bearing systems are, in ascending order:
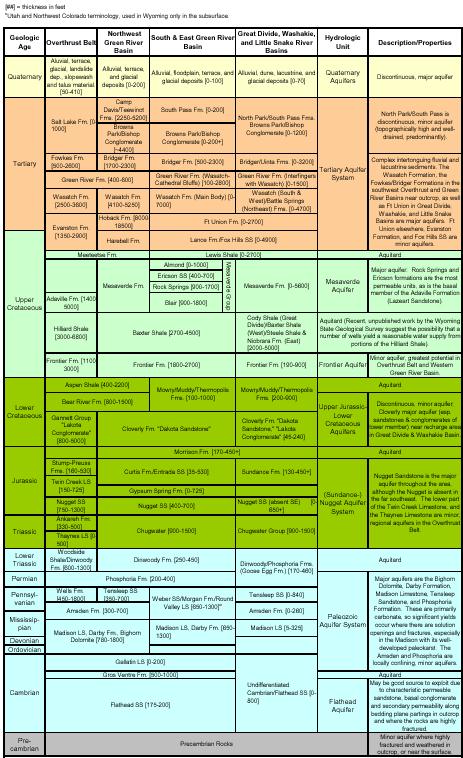
The major aquifer systems are also identified and described in Figure III-9, a Generalized Hydrostratigraphic Column. The majority of the bedrock surface exposures are Cretaceous and Tertiary age rocks. These rocks are host to several important aquifers, including the Frontier aquifer (western part of the Basin), the Mesaverde aquifer system, and the Tertiary aquifer system. The Tertiary aquifer system includes a number of water-bearing formations, including the Green River, Wasatch, Battle Springs, and Fort Union Formations.
Figure III-9 Generalized Hydrostratigraphic Column of the Greater Green River Basin, Wyoming
click to enlarge
Groundwater resources of the Basin are largely undeveloped at this time. Ground water is principally used for drinking water supplies and industrial use. The majority of the supplies are developed from Quaternary and Tertiary aquifers. Current groundwater use within the Greater Green River Basin is estimated to be between 5,300 and 7,200 acre-feet per year for all uses (estimates derived in this study).
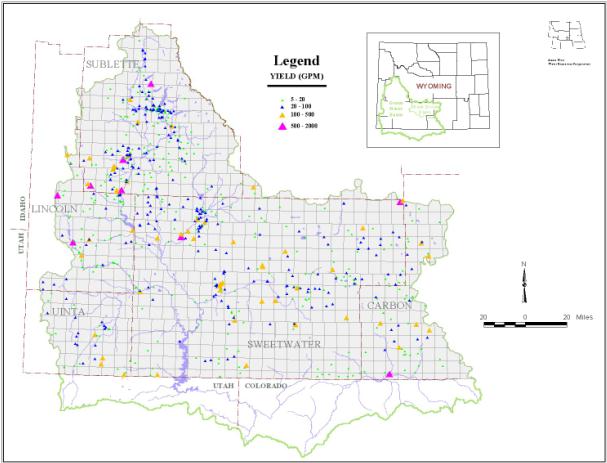
A plot of well yields derived from the US Geological Survey's Groundwater Site Inventory, or GWSI database, vary over a broad range, as shown in Figure III-10.
Figure III-10 Yields of Wells and Springs, GWSI Database
click to enlarge
Basin Groundwater Quality
Water quality data were obtained from a groundwater quality database (GWSI database) maintained by the U.S. Geological Survey. Data were retrieved for 24 parameters including major cations, major ions, dissolved metals, dissolved solids, pH, and several other parameters that serve as useful indicators of the quality of water. The data obtained for this study contain reports for over 800 analyses obtained from a total of about 600 wells and springs.
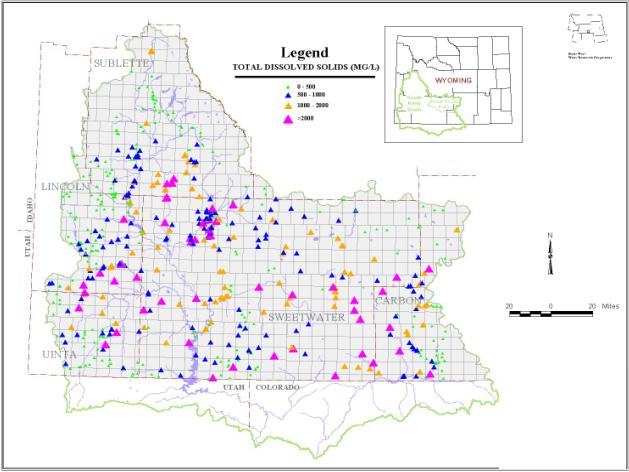
A plot of the GWSI database shown in Figure III-11 indicates no apparent tendencies in terms of the concentration of Total Dissolved Solids (TDS) by aquifer, nor does there appear to be a conspicuous tendency in the distribution of TDS concentrations across the Basin. Water quality likely varies by location within an aquifer, in relation to the depth of a well, and by aquifer.
Figure III-11 Total Dissolved Solids, Wells and Springs in GWSI Database
click to enlarge
Concentrations of TDS exceed the secondary drinking water standard in over one-half the wells sampled. Concentrations of sulfate exceed the secondary drinking water standards in about one-third of the wells sampled. Although these conditions do not necessarily prevent use of the water, there may be limitations on the types of uses for which this water is suitable. The quality of water at several locations is considered poor, and would require extensive treatment to render it suitable for drinking. There are insufficient data available to assess whether alternate groundwater sources of better quality might be available at these locations.
Groundwater Development Potential
There is virtually no information on the overall groundwater basin water budget, such that major inflow and outflow components may be quantified. Accordingly, it is difficult to evaluate the Basin's safe, long-term yield for purposes of defining future groundwater development potential.
The Basin has a total area of about 20,000 square miles (12.8 million acres). However, there are large areas of the Basin in which potential evapotranspiration (ET) significantly exceeds average rainfall. For purposes of this analysis, it is assumed that recharge is effectively zero in areas where ET significantly exceeds rainfall. In the remaining parts of the Basin, mainly the mountain and foothills areas, rainfall exceeds potential (ET). These areas have been mapped and are estimated to have an area of approximately 925,000 acres. The average "surplus" rainfall (where annual rainfall exceeds annual ET) is assumed to be about 6 inches. It is also assumed that approximately 10 percent of the surplus rainfall recharges the groundwater system. This approach yields an estimate of about 50,000 acre-feet per year of groundwater recharge, and is considered to be an approximation of basin groundwater yield. These estimates neglect the potential for interbasin movement of ground water. They also neglect the large quantity of ground water in storage that could potentially be developed without experiencing significant basin-wide impacts.
By comparison, the USGS (Martin, 1996; Glover, et al, 1998) estimates approximately 100,000 acre-feet per year of groundwater recharge by precipitation to the Tertiary-age rocks. For planning purposes, it is concluded that basin yield is on the order of between 50,000 and 100,000 acre-feet per year.
Currently, there is no evidence to suggest over-development of the principal aquifer systems. It may be concluded that there is significant potential for additional development of these aquifer systems, with little risk of depleting this resource. In fact, the lack of over-development means there is a smaller chance that aquifer storage and retrieval techniques will be successful.
There are many factors that may affect future development and availability of groundwater resources. In the case of the Quaternary-age alluvial aquifers, any future development of groundwater resources may be expected to have a direct and near-immediate impact on the adjacent rivers and streams within the alluvial system. Another factor is the potential development of ground water associated with the coal bed methane (CBM) extraction industry.
The extent to which CBM resources are developed will depend on a number of factors, including current and forecasted energy costs, and the economics of the CBM projects. One important factor affecting a project's economics is the quality of water co-produced in the recovery process. The quality of water associated with the coals is reportedly significantly worse in the Greater Green River Basin than in the Powder River Basin. Water quality standards for salinity in the Colorado River System (adopted by each state and approved by the EPA in 1974) may require that the co-produced water be reinjected or treated before discharge. The impacts of the added costs of treatment or reinjection are unclear, but may render some CBM projects uneconomical. At this time, it appears unlikely that the level of development of CBM resources in the Greater Green River Basin will match the levels of development anticipated in the Powder River Basin given current market conditions and environmental mandates.