|
Home Page
News & Information
River Basin Plans
Basin Advisory Groups
Planning Products
|
TECHNICAL MEMORANDUM
| Subject: | Wind/Bighorn River Basin Plan
Task 3A/3B – Surface Water Hydrology |
| Date: | October 2002 (Revised March 2003) |
| Prepared By: | MWH Americas, Inc. |
This Technical Memorandum reviews original data and methodologies used to develop surface water input data for the Wind/Bighorn River Basin Planning Model. The document fulfills the
reporting requirements of Task 3A and a portion of Task 3B from the contract. The portion of the scope not included in this Technical Memorandum will be covered in later Technical Memoranda.
This technical memorandum contains the following sections. Within each section are tables and figures containing the data for each of the main study area basins.
Section
Section 1 - Introduction
Section 2 - Historical Streamflow Records
Section 3 - Study Period Selection
Section 4 - Data Filling and Extension
Section 5 - Ungaged Headwaters Site Data Estimation
Section 6 - Hydrologic Year Classification
Section 7 - Summary Flow Data
Section 8 - References
Appendix A – Streamflow Gage Data Record Extension
Appendix B – Study Period Monthly Streamflow
Appendix C – Hydrologic Classification Monthly Streamflow
Section 1 - Introduction
To be consistent with previous basin plans, the Wind-Bighorn Basin will be modeled using the same methodologies as used in the feasibility studies for the Bear River Basin and the Green
River basin. The Guidelines for Development of Basin Plans (WWDC, 2001) recommended that for the purposes of the river basin plans, the hydrologic analysis be conducted for three 12-month
periods using average dry-year conditions, average average-year conditions and average wet-year conditions. Therefore, each hydrologic region in the model will have three associated
spreadsheet models representing those three hydrologic conditions. The gaged flows used in the spreadsheet model are developed by averaging recorded monthly streamflows for groups of
years falling into those three hydrologic categories during a consistent period-of-record.
A map of the Wind/Bighorn River Basin Plan study area is shown in Figure 1-1. The study area includes those Missouri River basins located in northwestern Wyoming, including those
portions of the Madison River Basin, Gallatin River Basin, Yellowstone River Basin and Wind/Bighorn River Basin located within the State of Wyoming. Table 1-1 shows the USGS
Hydrologic Unit classifications which are included in the planing area. All of the river basins are tributary to the Yellowstone River in southern Montana, which is subsequently
tributary to the Missouri River in northeastern Montana.
Table 1-1. USGS Hydrologic Units and Associated Models Included in Study Area
Hydrologic
Unit Code | Hydrologic Unit Name | Sub-Region Name(1) | Area
(acres) | Study Basin | Study Sub-Basin |
| 10020007 | Madison | Missouri Headwaters | 1,638,991 | Madison/Gallatin | Madison/Gallatin |
| 10020008 | Gallatin | Missouri Headwaters | 1,162,356 | Madison/Gallatin | Madison/Gallatin |
| 10070001 | Yellowstone Headwaters | Upper Yellowstone | 1,654,127 | Yellowstone | Yellowstone |
| 10070002 | Upper Yellowstone | Upper Yellowstone | 1,897,992 | Yellowstone | Yellowstone |
| 10070006 | Clarks Fork Yellowstone | Upper Yellowstone | 1,784,937 | Clarks Fork | Clarks Fork |
| 10080001 | Upper Wind | Big Horn | 1,628,472 | Wind | Upper Wind |
| 10080002 | Little Wind | Big Horn | 708,641 | Wind | Little Wind |
| 10080003 | Popo Agie | Big Horn | 511,611 | Wind | Not Included(2) |
| 10080004 | Muskrat | Big Horn | 466,187 | Wind | Lower Wind |
| 10080005 | Lower Wind | Big Horn | 1,084,233 | Wind | Lower Wind |
| 10080006 | Badwater | Big Horn | 538,167 | Wind | Badwater |
| 10080007 | Upper Bighorn | Big Horn | 2,217,263 | Big Horn | Upper Big Horn |
| 10080008 | Nowood | Big Horn | 1,282,397 | Big Horn | Nowood |
| 10080009 | Greybull | Big Horn | 733,218 | Big Horn | Greybull |
| 10080010 | Big Horn Lake | Big Horn | 1,150,802 | Big Horn | Big Horn Lake |
| 10080011 | Dry | Big Horn | 281,821 | Big Horn | Big Horn Lake/Greybull |
| 10080012 | North Fork Shoshone | Big Horn | 545,062 | Big Horn | Shoshone |
| 10080013 | South Fork Shoshone | Big Horn | 417,701 | Big Horn | Shoshone |
| 10080014 | Shoshone | Big Horn | 954,605 | Big Horn | Shoshone |
Notes:
(1)All Sub-Regions contained in the Missouri River Region.
(2)The Popo Agie River basin is modeled in the Popo Agie River Watershed study. This model contains an inflow node for the Popo Agie River that incorporates these results.
For purposes of the discussion herein, the Study Area has been divided into five basins: the Madison/Gallatin River Basin, the Yellowstone River Basin, the Wind River Basin and the
Bighorn River Basin. The Madison River and Gallatin River are not hydrologically connected. However, they have been grouped together because the models will be very small. The Wind
and Bighorn Rivers are actually the same river, changing names at the “Wedding of the Water” near Thermopolis. The river is called the Wind River south of the Owl Creek mountains
while it is called the Bighorn River north of the Owl Creek mountains. The river has been separated because of the clear basin distinctions that occur through the Owl Creek mountains.
There are no hydrologic connections, other than the river itself, across the mountain chain.
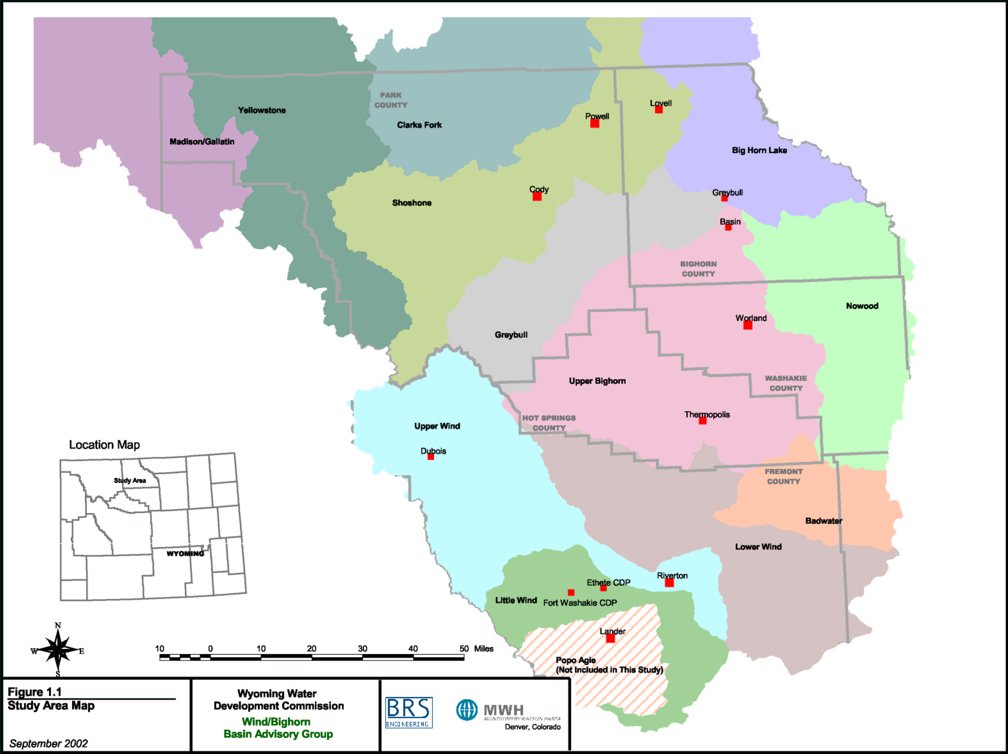
Figure 1-1. Study Area Map
Section 2 - Historical Streamflow Records
The basin spreadsheet models utilize historical data to simulate river operations on a monthly basins during average dry, average and wet years. Therefore, data collection and
reduction to useable formats within the model is the first task in the modeling effort.
Streamflow data is available for hundreds of locations throughout the study area for various periods-of-record. Streamflow gages are primarily operated and maintained by the USGS,
while the SEO has historically operated miscellaneous gages in the basin for brief periods to assist in water delivery and accounting. USGS data is available from both the Wyoming
Water Resources Data System (WRDS) and the USGS National Water Information System (NWIS) on the Internet (USGS, 2002). USGS data used in this model was researched using WRDS, then
downloaded from the Internet to facilitate incorporation into existing data reduction spreadsheets.
Separate spreadsheets for each hydrologic unit were developed to store streamflow data. Typically, the base reporting level for the USGS is average daily streamflow in cubic feet
per second (cfs). Therefore, in order to have available the most detailed records in the database, the average daily streamflow was downloaded from the Internet and stored in the
spreadsheet. Then, the spreadsheet was used to reduce daily data into total monthly flow and total annual flow in acre-feet for each month and year that data was available.
Locations of river basins, major waterways, gages and approximate irrigated lands are shown in the figures within this section. It should be noted that the irrigated lands shown
in these maps are from preliminary irrigated lands delineations and are intended only to show the locations of streamflow gages in relationship to irrigated lands. Final irrigated
lands delineations within the study area are available in the GIS coverages developed as part of the Wind/Bighorn River Basin Plan.
2.1 Madison/Gallatin River Basins
The streamflow gages located within and immediately downstream of the study area for the Madison River and Gallatin River basins are shown in Figure 2-1 and Table 2-1. There is a
streamflow gage on both the Firehole River and Gibbon River within Wyoming upstream of their confluence. In addition, there is a gage on the Madison River just downstream of the
Wyoming/Montana state line. The Firehole and Gibbon River gages ceased operations in 1996 while the Madison River gage is still operational. There are no streamflow gages on the
Gallatin River within Wyoming. The closest gage to the state line is located approximately 10 miles downstream of the state line near the Gallatin Gateway. The gage is currently
operational. However, there are small gaps in the record that required filling.
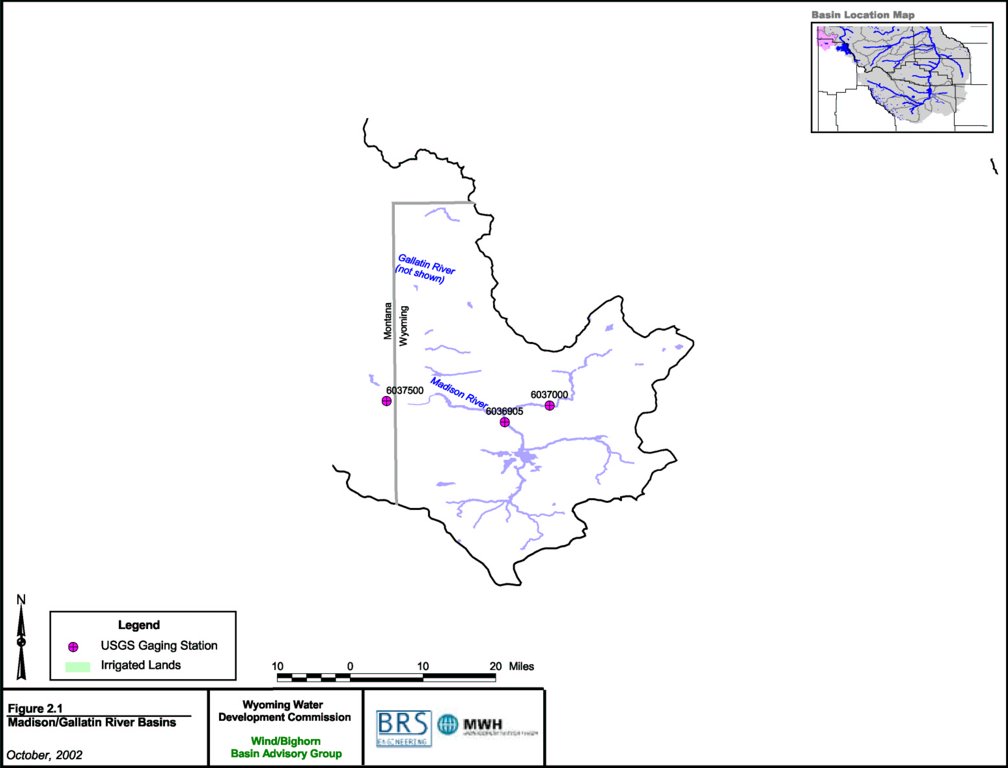
Figure 2-1. Madison and Gallatin River Basins
Table 2-1. Madison and Gallatin River Basin Streamflow Gages
| Basin | Gage
Number | Gage ID | Gage Name |
Drainage
Area
(sq. mi.) | Period of Record |
Madison/
Gallatin | 06036905 | Firehole | Firehole River near West Yellowstone, MT | 282 | Oct 1983 - Mar 1996 |
| 06037000 | Gibbon | Gibbon River near West Yellowstone, MT | 118 | Jun 1913 - Mar 1996(1) |
| 06037500 | Mad_WstY | Madison River near West Yellowstone, MT | 420 | Jul 1913 - Sep 2001(1) |
| 06043500 | Gal_GalGt2 | Gallatin River near Gallatin Gateway, MT | 825 | Aug 1889 - Sep 2001(1) |
Notes:
(1)Incomplete data within period-of-record.
2.2 Yellowstone River Basin
The streamflow gages located within the hydrologic unit are shown in Figure 2-2 and Table 2-2. The Yellowstone River at Corwin Springs (06191500) is located in
Montana, but was included in this analysis for two reasons: (1) it contains an uninterrupted long-term period-of-record which is extremely useful in data analysis and data
extension, and (2) it is located just downstream of the confluence of the Gardner River confluence, which provides a convenient terminus for the model. Four of the gages are currently operational.
Table 2-2. Yellowstone River Basin Streamflow Gages
| Basin | Gage
Number | Gage ID | Gage Name |
Drainage
Area
(sq. mi.) | Period of Record |
| Yellowstone | 06186500 | Yl_LkOut | Yellowstone River at Yellowstone Lake Outlet, YNP | 1,006 | Oct 1926 - Sep 2001(1)
| | 06187000 | Yl_CnHot | Yellowstone River near Canyon Hotel, YNP | 1,157 | Jun 1913 - Sep 1951(1) |
| 06187500 | Tow_TowF | Tower Creek at Tower Falls, YNP | 50 | Sep 1922 - Sep 1943(1) |
| 06187915 | Sod_Slv | Soda Butte Creek at Park Boundary at Silver Gate | 50 | Oct 1999 - Sep 2001 |
| 06187950 | Sod_LRS | Soda Butte Creek near Lamar Ranger Station, YNP | 99 | Oct 1988 - Sep 2001 |
| 06188000 | Lam_TRS | Lamar River near Tower Falls Ranger Station, YNP | 660 | May 1923 – Sep 2001(1) |
| 06188500 | EFBl_Mam | East Fork Blacktail Deer Creek near Mammoth, YNP | 10 | Nov 1937 - Sep 1941 |
| 06189000 | BlD_Mam | Blacktail Deer Creek near Mammoth, YNP | 15 | Nov 1937 - Sep 1993(1) |
| 06190000 | Lup_Mam | Lupine Creek near Mammoth, YNP | 5 | Nov 1937 - Sep 1941 |
| 06190500 | Gard_Mam | Gardner River at Mammoth, YNP | 200 | Sep 1922 - Oct 1938(1) |
| 06190540 | Gard_nrMam | Hot River at Mammoth, YNP | (2) | Oct 1988 - Sep 1995 |
| 06191000 | Hot_Mam | Gardner River near Mammoth, YNP | 202 | Oct 1938 - Sep 2001(1) |
| 06191500 | Yl_CSp | Yellowstone River at Corwin Springs, MT | 2,623 | May 1897 - Sep 2001(1) |
Notes:
(1)Incomplete data within period-of-record.
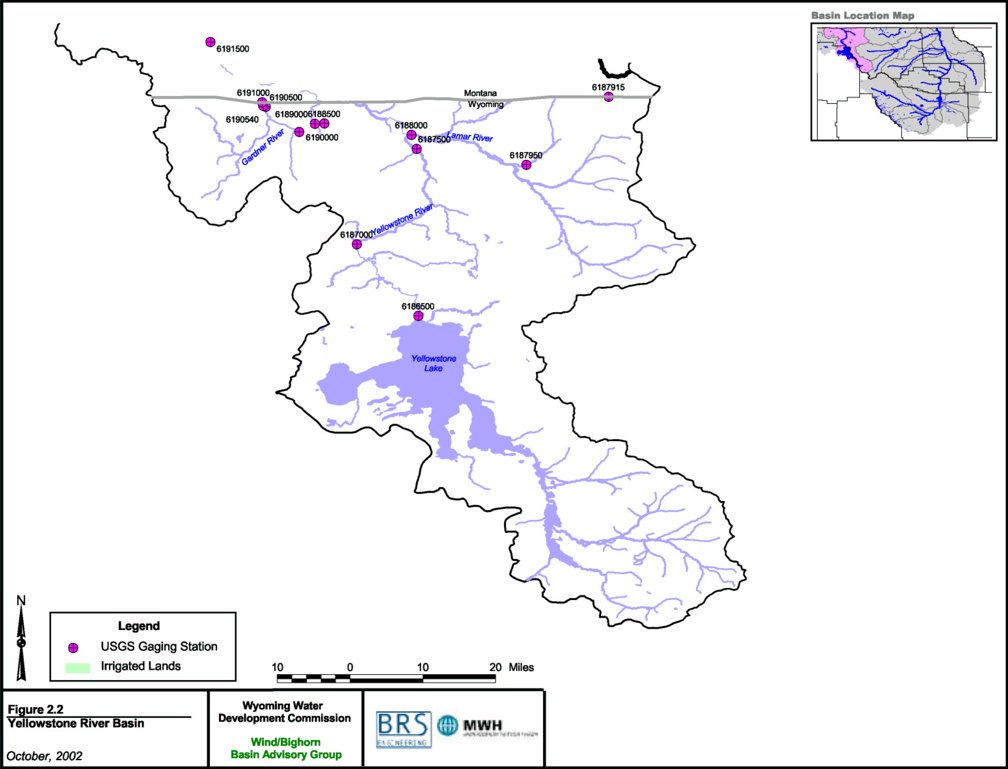
Figure 2-2. Yellowstone River Basin
2.3 Clarks Fork River Basin
A list of streamflow gages in the Clarks Fork Hydrologic Unit is shown in Figure 2-3 and Table 2-3. Gages are located on the Clarks Fork upstream of
irrigation diversions within Wyoming and immediately downstream of the Wyoming/Montana State Line. In addition, Big Sand Coulee, which is the only major tributary
that crosses the state line within the basin, also has gages upstream of the major diversions and downstream of the state line, just upstream of its confluence with
the Clarks Fork. As shown, the Clarks Fork Yellowstone River near Belfry, Montana gage (06207500) has an extensive period-of-record. This gage is located just upstream
of the confluence of the Clarks Fork and Big Sand Coulee. However, all other gages required extensive filling to be used in the model.
Table 2-3. Clarks Fork River Basin Streamflow Gages
| Basin | Gage
Number | Gage ID | Gage Name |
Drainage
Area
(sq. mi.) | Period of Record |
| Clarks Fork | 06205500 | CFk_abSqC | Clarks Fork Yellowstone River above Squaw Crk near Painter, WY | 194 | Oct 1945 - Sep 1951 |
| 06205950 | Ldg_Pnt | Lodgepole Creek at Mouth, near Painter, WY | (2) | Apr 1989 - Sep 1989 |
| 06206000 | Cfk_blCrC | Clarks Fork Yellowstone River below Crandall Ck near Painter, WY | 44 | Oct 1929 - Sep 1957(1) |
| 06206500 | Sun_Pnt | Sunlight Creek near Painter, WY | 135 | Aug 1929 - Sep 1971(1) |
| 06207000 | CFk_nrClk | Clarks Fork Yellowstone River near Clark, WY | 912 | Oct 1918 - Dec 1924 |
| 06207500 | Cfk_BlfMT | Clarks Fork Yellowstone River near Belfry, MT | 912 | Aug 1921 - Sep 2001 |
| 06207507 | BigS_nrBdg | Big Sand Coulee above St Ditch near Badger Basin, WY | 98 | May 1973 - Sep 1977(1) |
| 06207510 | BigS_Line | Big Sand Coulee at WY-MT State Line | 98 | May 1973 - Sep 1981(1) |
| 06207540 | STip_BlfMT | Silver Tip Creek near Belfry t Mt | 98 | Oct 1967 - Sep 1975 |
Notes:
(1)Incomplete data within period-of-record.
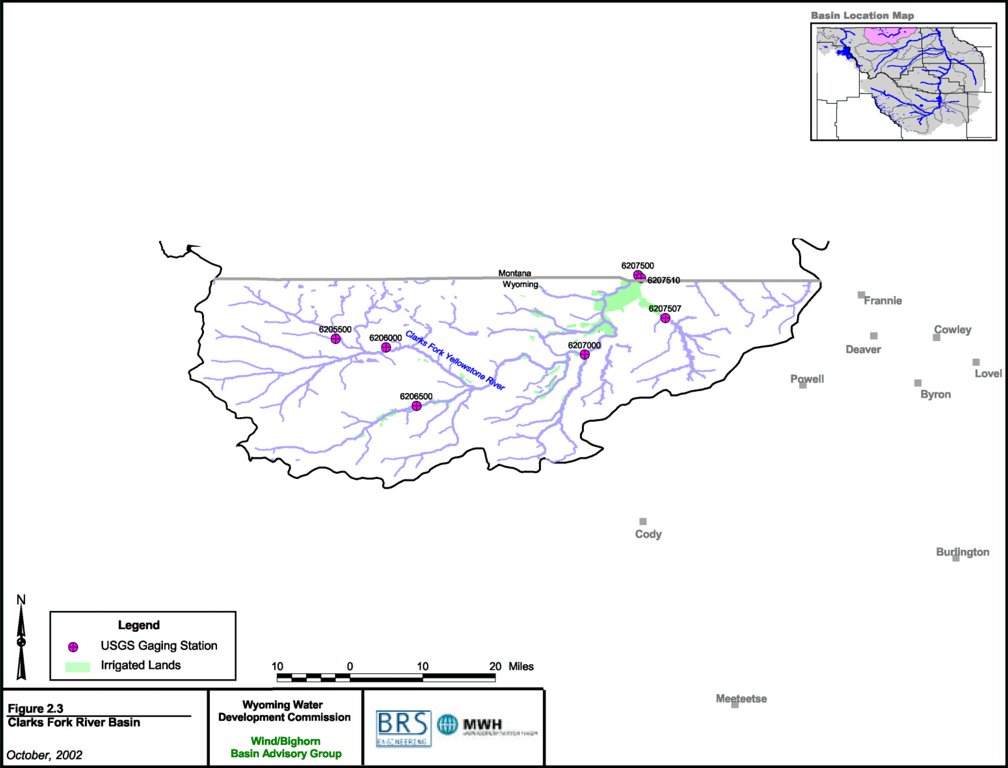
Figure 2-3. Clarks Fork River Basin
2.4 Wind River Basin
Streamflow data for the Wind River Basin are shown in Figure 2-4, Figure 2-5, Figure 2-6, Figure 2-7 and Table 2-4. Gages are located throughout the basin
on the Wind River. In addition, there are several headwaters gages located on tributaries south of the Wind River, upstream of diversions and storage for the Wind River
Irrigation Project and Riverton Unit. Streamflow gages are located on most major tributaries upstream of agricultural diversions. In addition, there are streamflow gages
on the lower portions of the Little Wind River that improved model calibration. It should be noted that only streamflow gages are presented in this section – there are
several return flow gages operated by the USGS that could be used in the model but are not shown in the following table and figures. Most of those gages shown are heavily
influenced by agricultural diversions and return flows.
Table 2-4. Wind River Basin Streamflow Gages
| Basin | Gage
Number | Gage ID | Gage Name |
Drainage
Area
(sq. mi.) | Period of Record |
| Upper Wind |
06218500 | wind_nrDub | Wind River near Dubois, WY | 232 | Oct 1945 - Sep 1992 |
| 06220000 | Wind_atDub | Wind River at Dubois, WY | 486 | Jan 1911 - Sep 1912 |
| 06220500 | EFWind_Dub | East Fork Wind River near Dubois, WY | 427 | May 1950 - Sep 1997(1) |
| 06220800 | Wind_RedCk | Wind River above Red Creek near Dubois, WY | 1,073 | Oct 1990 - Sep 2001 |
| 06221400 | Din_abLks | Dinwoody Creek above Lakes near Burris, WY | 88 | Oct 1957 - Sep 2001(1) |
| 06221500 | Din_Bur | Dinwoody Creek near Burris, WY | 100 | Jun 1918 - Sep 1958(1) |
| 06222000 | Wind_Bur | Wind River near Burris, WY | 1,236 | Oct 1950 - Sep 1953 |
| 06222500 | DryCk_Bur | Dry Creek near Burris, WY | 54 | Jun 1921 - Sep 2001(1) |
| 06222700 | CrowCk_Tip | Crow Creek near Tipperary, WY | 30 | Oct 1962 - Sep 1993 |
| 06223000 | MdCk_Len | Meadow Creek near Lenore, WY | 42 | Apr 1922 - Sep 1923(1) |
| 06223500 | WlCk_Crow | Willow Creek near Crowheart, WY | 55 | Oct 1921 - Sep 2001(1) |
| 06224000 | BlCk_abLk | Bull Lake Creek above Bull Lake, WY | 187 | Oct 1941 - Sep 2001(1) |
| 06225000 | BlLk_Len | Bull Lake Creek near Lenore, WY | 213 | Jun 1918 - Sep 2001(1) |
| 06225500 | Wind_Crow | Wind River near Crowheart, Wy | 1,891 | Oct 1945 - Sep 2001 |
| 06227600 | Wind_Kin | Wind River near Kinnear, Wy | 2,194 | Apr 1974 - Sep 2000(1) |
| 06228000 | Wind_Riv | Wind River at Riverton, Wy | 2,309 | Apr 1912 - Sep 2001(1) |
| 06236100 | wind_abBoy | Wind River above Boysen Reservoir near Shoshoni, WY | 4,390 | May 1990 - Sep 2001 |
| Little Wind |
06228350 | SFLW_abWRes | Sf L Wind R Ab Washakie Re Nr Ft Washakie, WY | 90 | Oct 1976 - Sep 2001 |
| 06228450 | SFLW_blWRes | South Fork Little Wind Riv Bel Washakie Res, WY | 94 | Oct 1988 - Sep 2001 |
| 06228500 | LW_FtWa | Little Wind River near Fort Washakie, WY | 117 | May 1921 - Sep 1940 |
| 06228800 | NFLW_nrFW | North Fork Little Wind River Nr Fort Washakie, WY | (2) | Oct 1988 - Sep 2001 |
| 06229000 | NFLW_atFW | N Fk Little Wind R At Fort Washakie, WY | 112 | May 1921 - Sep 1940 |
| 06229680 | Sage_Nork | Sage Cr Ab Norkok Meadows Cr, Nr Ft Washakie, WY | 118 | Jul 1990 - Sep 1995 |
| 06229900 | Trout_FW | Trout Creek near Fort Washakie, WY | 16 | May 1990 - Sep 2001(1) |
| 06230190 | Mill_abRL | Mill Cr Ab Ray Lake Outlet Canal, Nr Ft Washakie | 16 | May 1990 - Sep 1996 |
| 06230500 | LW_nrArap | Little Wind River near Arapahoe, WY | 618 | Oct 1950 - Sep 1953 |
| 06231000 | LW_abArap | Little Wind River above Arapahoe, WY | 660 | Oct 1979 - Sep 1995 |
| 06234000 | LW_blArap | Little Wind River below Arapahoe, WY | 1,464 | Jun 1906 - Oct 1918(1) |
| 06234500 | Beav_nrLnd | Beaver Creek near Lander, WY | 113 | Jun 1938 - Sep 1941 |
| 06235000 | Beav_nrAr | Beaver Creek near Arapahoe, WY | 354 | May 1950 - Sep 1953 |
| 06235500 | LW_Riv | Little Wind River Near Riverton, WY | 1,904 | Jun 1941 - Sep 2001 |
| Lower Wind |
06239000 | Musc_Sho | Muscrat Creek near Shoshoni, WY | 733 | Jul 1950 - Sep 1973(1) |
| 06244500 | 5mi_aPav | Fivemile Creek above WY Ca near Pavillion, WY | 118 | Oct 1949 - Sep 2001(1) |
| 06245000 | 5mi_Pav | Fivemile Creek near Pavillion, WY | 118 | Sep 1948 - Sep 1949 |
| 06250000 | 5mi_Riv | Fivemile Creek near Riverton, WY | 356 | Oct 1949 - Sep 1965S(1) |
| 06251500 | Sand_Sho | Sand Gulch near Shoshoni, WY | 19 | Sep 1948 - Sep 1953(1) |
| 06253000 | 5mi_Sho | Fivemile Creek near Shoshoni, WY | 418 | Jun 1941 - Sep 2001(1) |
| 06255500 | Poi_Sho | Poison Creek near Shoshoni, WY | 500 | Oct 1952 - Dec 1953(1) |
| 06257500 | Mud_Pav | Muddy Creek near Pavillion, WY | 267 | Apr 1949 - Sep 1973(1) |
| 06258000 | Mud_Sho | Muddy Creek near Shoshoni, WY | 332 | Mar 1949 - Sep 1983(1) |
| 06258500 | DCot_Bon | Dry Cottonwood Creek near Bonneville, WY | 165 | Oct 1949 - Sep 1953 |
| 06259000 | Wind_blBy | Wind River below Boysen Reservoir, WY | 7,701 | Jun 1951 - Sep 2001 |
| Badwater |
06256000 | Bad_Lyb | Badwater Creek at Lybyer Ranch, near Lost Cabin, WY | 131 | Oct 1948 - Sep 1968 |
| 06256500 | Bad_LC | Badwater Creek at Lost Cabin, WY | 166 | Sep 1945 - Sep 1948 |
| 06256650 | Bad_Lys | Badwater Creek at Lysite, WY | 415 | Nov 1965 - Sep 1973 |
| 06256800 | Bri_Lys | Bridger Creek near Lysite, WY | 182 | Nov 1965 - Sep 1973 |
| 06256900 | Dry_Bon | Dry Creek near Bonneville, WY | 53 | Oct 1965 - Sep 1980 |
| 06257000 | Bad_Bon | Badwater Creek at Bonneville, WY | 808 | May 1947 - Sep 1973 |
Notes:
(1)Incomplete data within period-of-record.
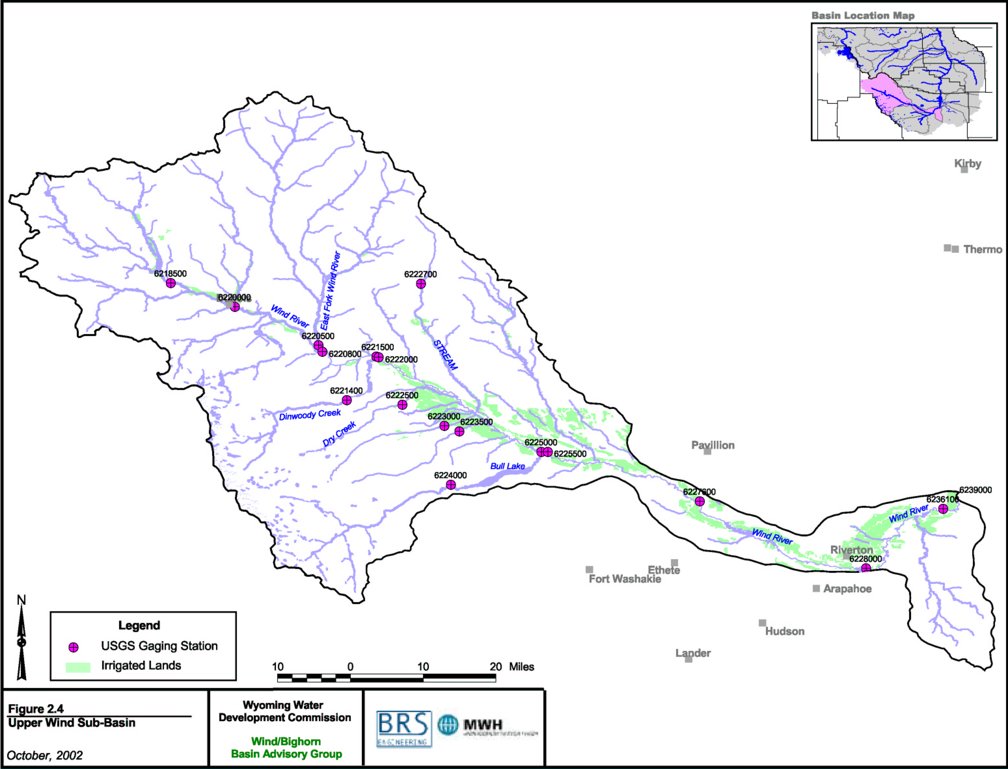
Figure 2-4. Wind River Basin - Upper Wind Sub-Basin
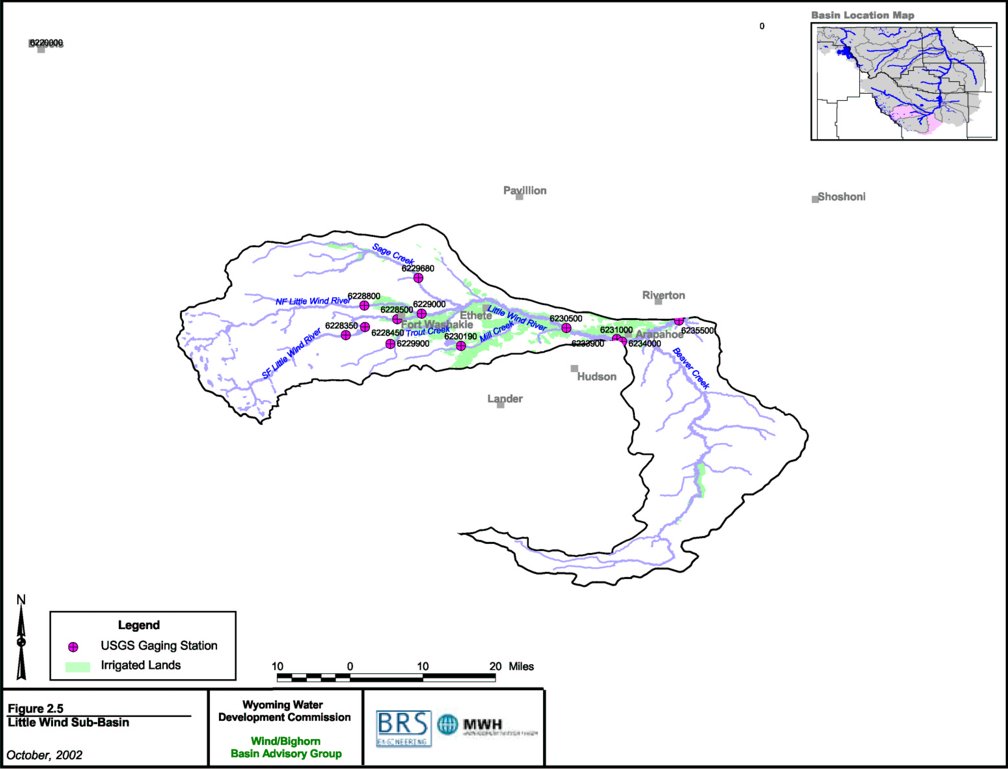
Figure 2-5. Wind River Basin - Little Wind Sub-Basin
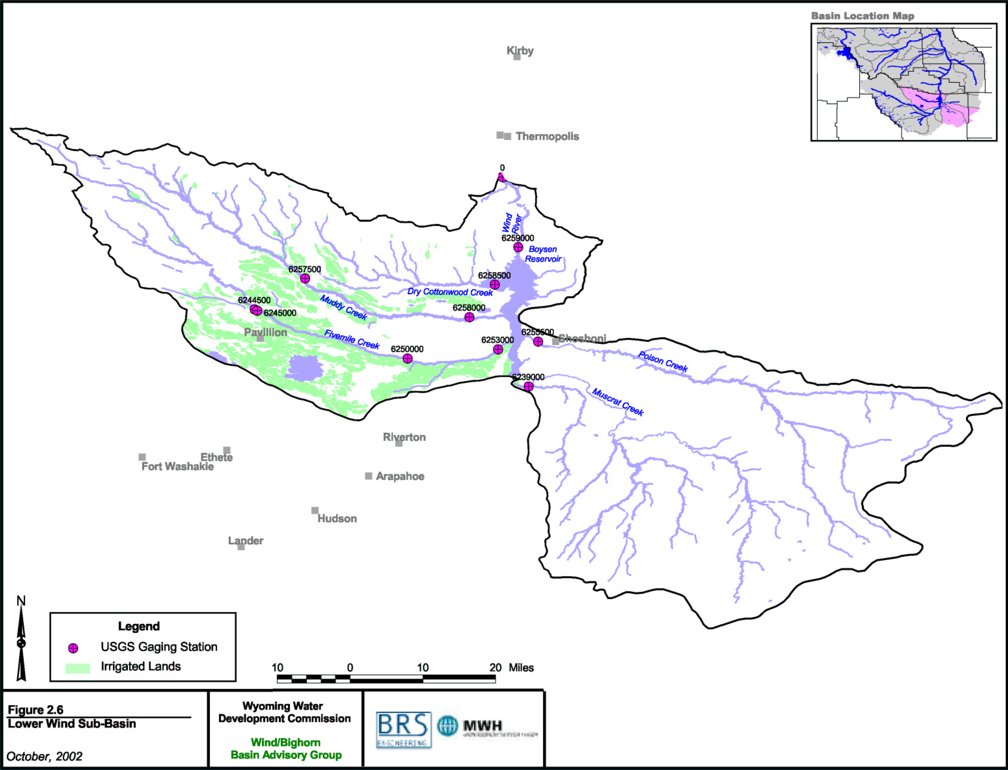
Figure 2-6. Wind River Basin - Lower Wind Sub-Basin
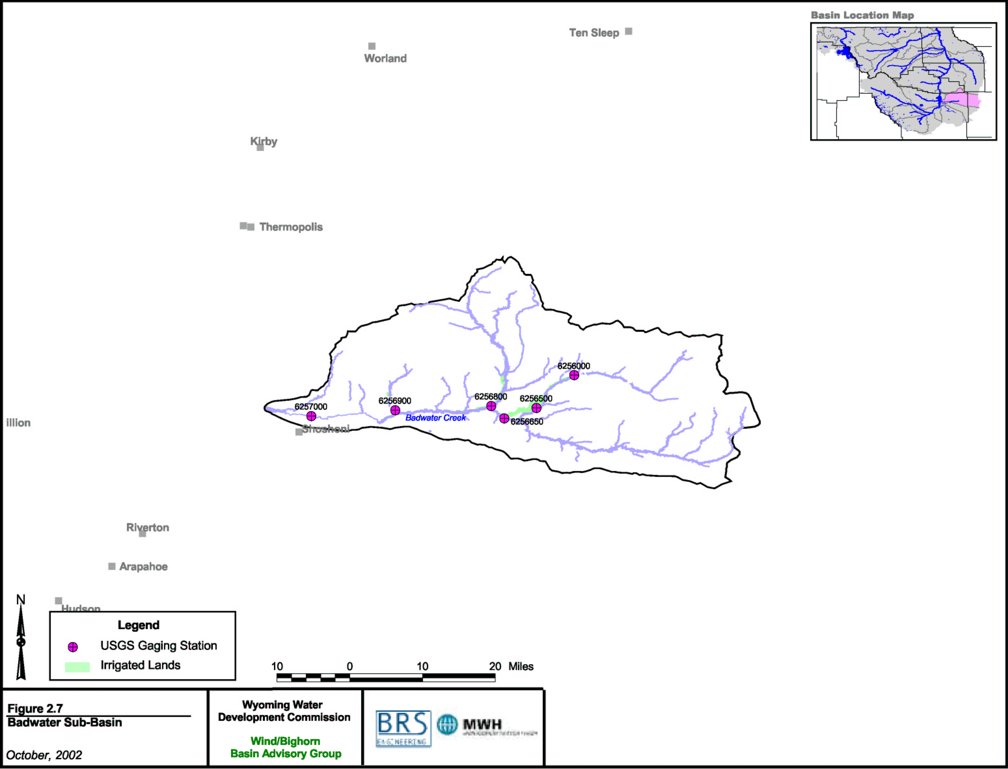
Figure 2-7. Wind River Basin - Badwater Sub-Basin
2.5 Bighorn River Basin
Streamflow gaging stations for the Bighorn River Basin are shown in Figure 2-8, Figure 2-9, Figure 2-10, Figure 2-11, Figure 2-12 and Table 2-5. Streamflow
measurements have been taken on many of the mainstem river and tributaries at some point in recent history. However, many of those gages have been decommissioned and the
number of currently active gages is considerable less than the total number of gages in the basin. The Shoshone River Basin, Greybull River Basin and portions of the Bighorn
Lake basins have either a significant number of gages or adequate gages to develop and calibrate the model, including some headwaters gages. The Upper Bighorn tributary basins
have periodic gage records that assisted in developing the model, however, model calibration was more difficult due to the large number of estimated flows that were required.
Table 2-5. Bighorn River Basin Streamflow Gages
| Basin | Gage
Number | Gage ID | Gage Name |
Drainage
Area
(sq. mi.) | Period of Record |
| Upper Bighorn |
06259500 | Bh_Therm | Bighorn River at Thermopolis, WY | 8,020 | Oct 1911 - Sep 1953(1) |
| 06260000 | SFOwl_nrAnc | South Fork Owl Creek near Anchor, WY | 87 | Oct 1940 - Sep 1995(1) |
| 06260200 | MdOwl_abAnc | Middle Fork Owl Creek above Anchor Reservoir, WY | 34 | Mar 1959 - Sep 1965 |
| 06260400 | SFOwl_blAnc | South Fork Owl Creek below Anchor Reservoir, WY | 131 | May 1959 - Sep 2001(1) |
| 06260500 | SFOwl_Crt | S F Owl Creek Ab Curtis Ranch, nr Thermopolis, WY | 144 | Oct 1943 - Sep 1959 |
| 06261000 | SFOwl_acrn | S F Owl C above C Rn near Thermopolis, WY | 149 | Oct 1938 - Sep 1943 |
| 06261500 | SFOwl_nrTh | South Fork Owl Creek Nr Thermopolis, WY | 180 | Aug 1921 - Apr 1932(1) |
| 06262000 | NFOwl_nrAnc | North Fork Owl Creek Near Anchor, WY | 55 | May 1941 - Jul 1962(1) |
| 06262300 | NFOwl_abBR | North Fork Owl Cr ab Basin Ranch nr Anchor, WY | 61 | Apr 1962 - Sep 1995(1) |
| 06262500 | NFOwl_atCR | N.F. Owl Creek at Crann Ranch nr Thermopolis, WY | 94 | Jun 1938 - Sep 1939 |
| 06263000 | NFOwl_nrTh | North Fork Owl Creek nr Thermopolis, WY | 102 | May 1930 - Sep 1932 |
| 06263500 | Mud_Th | Mud Creek nr Thermopolis Wyo | 101 | May 1938 - Sep 1939 |
| 06264000 | Owl_Th | Owl Creek near Thermopolis, Wy | 478 | Mar 1911 - Sep 1969(1) |
| 06264500 | Owl_Luc | Owl Creek near Lucerne, WY | 509 | Mar 1932 - Sep 1953(1) |
| 06265000 | Kirb_Luc | Kirby Creek near Lucerne, WY | 199 | Jul 1941 - Sep 1945 |
| 06265337 | Cot_HamD | Cottonwood C at High Island Rnch nr Hamilton Dome | 82 | Apr 1993 - Sep 2001 |
| 06265500 | Cot_Win | Cottonwood Creek at Winchester, WY | 416 | Jun 1941 - Sep 1945 |
| 06265800 | Gos_atDk | Gooseberry Creek at Dickie, WY | 95 | Oct 1957 - Sep 1978 |
| 06266000 | Gos_Grs | Gooseberry Creek near Grass Creek, WY | 142 | Oct 1945 - Sep 1957 |
| 06266500 | Gos_nrDk | Gooseberry Creek near Dickie, WY | 289 | Jun 1938 - Sep 1941(1) |
| 06267000 | Gos_Nei | Gooseberry Creek at Neiber, WY | 361 | Jun 1941 - Sep 1953(1) |
| 06267400 | Now_Colt | East Fork Nowater Creek near Colter, WY | 149 | Oct 1971 - Sep 1991 |
| 06268500 | 15mi_Wor | Fifteen Mile Creek near Worland, WY | 518 | Mar 1951 - Sep 1986(1) |
| 06268600 | Bh_Wor | Bighorn River at Worland, WY | 10,810 | Jul 1965 - Oct 1969 |
| 06269000 | Bh_nrMand | Bighorn River near Manderson, WY | 11,020 | Apr 1949 - Sep 1956(1) |
| 06269500 | Bh_atMand | Bighorn River at Manderson, WY | 11,048 | Oct 1941 - Sep 1949 |
| 06271500 | Pr_beLSol | Paintrock Creek below Lake Solitude, WY | 16 | Sep 1946 - Sep 1953(1) |
| 06274300 | Bh_Bas | Bighorn River at Basin, WY | 13,223 | Oct 1983 - Sep 2001 |
| Nowood |
06270000 | Now_Ten | Nowood River near Tensleep, WY | 803 | Jun 1938 - Sep 1992(1) |
| 06270450 | Can_beCk | Canyon Creek below Cooks Canyon, Near Tensleep, WY | 72 | Apr 1969 - Sep 1971 |
| 06270500 | Can_Ten | Canyon Creek near Tensleep, WY | 86 | Jun 1939 - Sep 1944 |
| 06271000 | Ten_Ten | Tensleep Creek near Tensleep, WY | 247 | Oct 1910 - Oct 1972(1) |
| 06272500 | Pnt_Hyat | Paintrock Creek near Hyattville, WY | 164 | Aug 1920 - Sep 1953(1) |
| 06273000 | Med_Hyat | Medicine Lodge Creek near Hyattville, WY | 87 | Oct 1943 - Sep 1973(1) |
| 06273500 | Pnt_beHyat | Paintrock Creek near Mouth Below Hyattville, WY | 376 | Aug 1910 - Dec 1922(1) |
| 06274000 | No_Bonz | Nowood River at Bonanza, WY | 1,730 | Aug 1910 - Sep 1928(1) |
| 06271500 | Pnt_LkSol | Paintrock Creek below Lake Solitude, WY | 16 | Sep 1946 - Sep 1953(1) |
| Greybull |
06274500 | Gry_PtFk | Greybull River near Pitchfork, WY | 282 | May 1946 - Sep 1971(1) |
| 06274800 | Wod_nrKir | Wood River near Kirwin, WY | 8 | Oct 1970 - Sep 1975 |
| 06274810 | Wod_atKir | Wood River at Kirwin, WY | 11 | Oct 1975 - Sep 1978 |
| 06275000 | Wod_Sun | Wood River at Sunshine, WY | 194 | Sep 1945 - Sep 1992 |
| 06275500 | Wod_Met | Wood River near Meeteetse, Wyo. | 211 | Oct 1936 - Sep 1949 |
| 06276000 | Gry_nrMet | Greybull River near Meeteetse, WY | 659 | Oct 1910 - Sep 1916(1) |
| 06276500 | Gry_atMet | Greybull River at Meeteetse, WY | 681 | Oct 1920 - Sep 2000(1) |
| 06277500 | Gry_Bas | Greybull River near Basin, WY | 1,115 | Oct 1930 - Sep 1973 |
| 06277950 | Dry_Grey | Dry Creek near Greybull, WY | 432 | Apr 1979 - Sep 1981 |
| Bighorn Lake |
06278000 | Dry_Grey | Dry Creek at Greybull, WY | 433 | Apr 1951 - Sep 1959(1) |
| 06278300 | Shl_abRes | Shell Creek above Shell Creek Reservoir, WY | 23 | Oct 1956 - Sep 2001 |
| 06278500 | Shl_nrShl | Shell Creek near Shell, WY | 145 | Oct 1940 - Sep 2001(1) |
| 06279000 | Shl_atShl | Shell Creek at Shell, WY | 256 | Apr 1914 - Sep 1924(1) |
| 06279500 | Bh_Kane | Bighorn River at Kane, WY | 15,765 | Oct 1928 - Sep 2001(1) |
| 06286250 | Bh_Lov | Bighorn River near Lovell, WY | 18,900 | Dec 1964 - Sep 1966 |
| 06286258 | BiC_Lov | Big Coulee near Lovell, WY | 30 | Apr 1970 - Sep 1978 |
| 06286260 | Crk_Lov | Crooked Creek near Lovell, WY | 119 | Dec 1964 - Nov 1967 |
| 06286270 | Porc_Lov | Porcupine Creek near Lovell, WY | 135 | Nov 1964 - Nov 1967 |
| Shoshone |
06279790 | Jones_Pah | Jones Creek at Mouth, near Pahaska, WY | 25 | Mar 1989 - Sep 1993(1) |
| 06279795 | Crow_Pah | Crow Creek at Mouth, at Pahaska, WY | 19 | Mar 1989 - Sep 1993(1) |
| 06279800 | NFSh_Pah | North Fork Shoshone River at Pahaska, WY | 108 | Apr 1989 - Sep 1990(1) |
| 06279850 | Mdi_YNP | Middle Creek at East Entrance YNP, WY | 33 | Oct 1981 - Sep 1984 |
| 06279940 | NFSh_atWap | North Fork Shoshone River at Wapiti, WY | 699 | Oct 1989 - Sep 2000 |
| 06280000 | NFSh_nrWap | North Fork Shoshone River near Wapiti, WY | 775 | Jan 1921 - Sep 1989(1) |
| 06280300 | SFSh_Val | South Fork Shoshone River near Valley, WY | 297 | Oct 1956 - Sep 2000(1) |
| 06280500 | SFSh_Ish | South Fork Shoshone River near Ishawooa, WY | 541 | Jun 1915 - Oct 1923(1) |
| 06281000 | SFSh_abBB | South Fork Shoshone R above Buffalo Bill Res, WY | 585 | May 1903 - Sep 2000(1) |
| 06281400 | Dia_nrCdy | Diamond Creek near Mouth near Cody, WY | 7 | Dec 1980 - Sep 1992 |
| 06282000 | Sh_beBB | Shoshone River Below Buffalo Bill Reservoir, WY | 1,538 | Jan 1921 - Sep 2000 |
| 06282500 | Sh_Cody | Shoshone River at Cody, WY | 1,603 | May 1902 - Dec 1909 |
| 06283000 | Sho_Corb | Shoshone River at Corbett Dam, WY | 1,793 | May 1908 - Sep 1925(1) |
| 06283800 | Sh_abWillD | Shoshone R ab Willwood Dam near Willwood, WY | (2) | Nov 1979 - Oct 1982 |
| 06284000 | Sh_atWillD | Shoshone River at Willwood Dam, WY | 1,833 | Aug 1925 - Sep 1926 |
| 06284200 | Sh_Will | Shoshone River at Willwood, WY | 1,980 | Apr 1974 - Sep 1979 |
| 06284400 | Sho_Garl | Shoshone River near Garland, WY | 2,036 | May 1958 - Sep 1979 |
| 06284500 | Bit_Garl | Bitter Creek near Garland, WY | 81 | Mar 1950 - Sep 1987(1) |
| 06284800 | Whst_Garl | Whistle Creek near Garland, WY | 101 | Jun 1958 - Sep 1987(1) |
| 06285000 | Sh_Byr | Shoshone River at Byron, WY | 2,345 | Jan 1929 - Sep 1966 |
| 06285100 | Sh_nrLov | Shoshone River near Lovell, WY | 2,350 | Oct 1966 - Sep 2000 |
| 06285400 | Sag_atSid | Sage Creek at Sidon Canal, near Deaver, WY | 341 | Jun 1958 - Sep 1987(1) |
| 06285500 | Sag_Lov | Sage Creek near Lovell, WY | 381 | May 1951 - Sep 1960 |
| 06286000 | Sho_atLov | Shoshone River at Lovell, WY(1) | 2,832 | Jun 1897 - Sep 1898 |
| 06286200 | Sh_Kane | Shoshone River at Kane, WY | 2,989 | Oct 1957 - Sep 1968 |
Notes:
(1)Incomplete data within period-of-record.
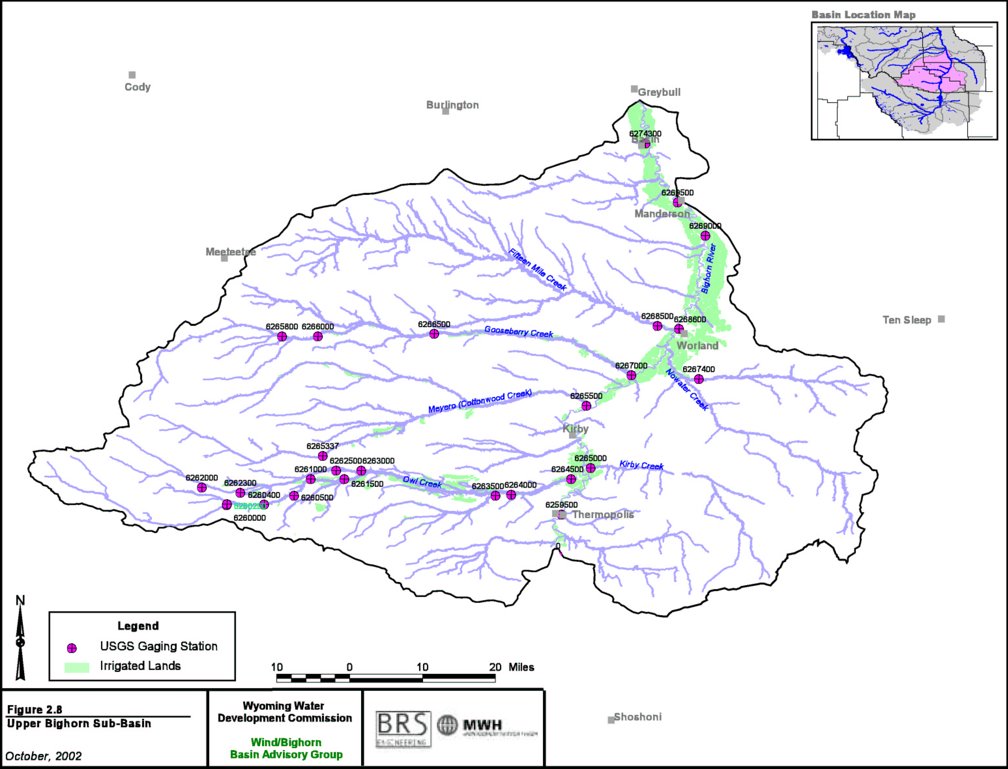
Figure 2-8. Bighorn River Basin - Upper Bighorn Sub-Basin
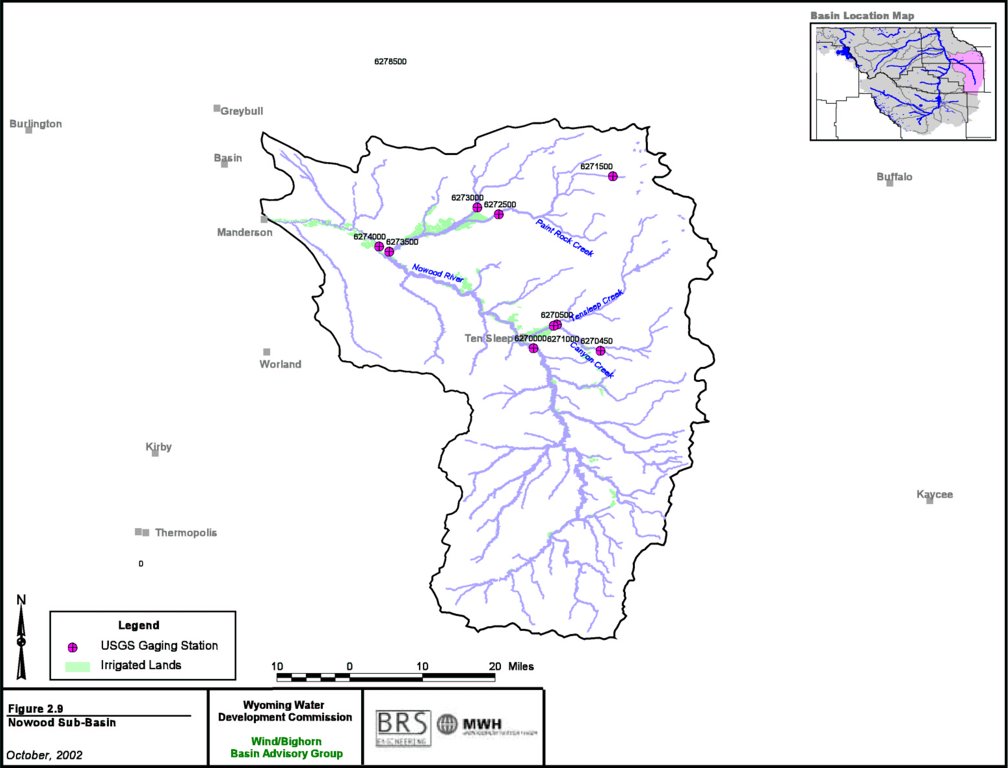
Figure 2-9. Bighorn River Basin - Nowood Sub-Basin
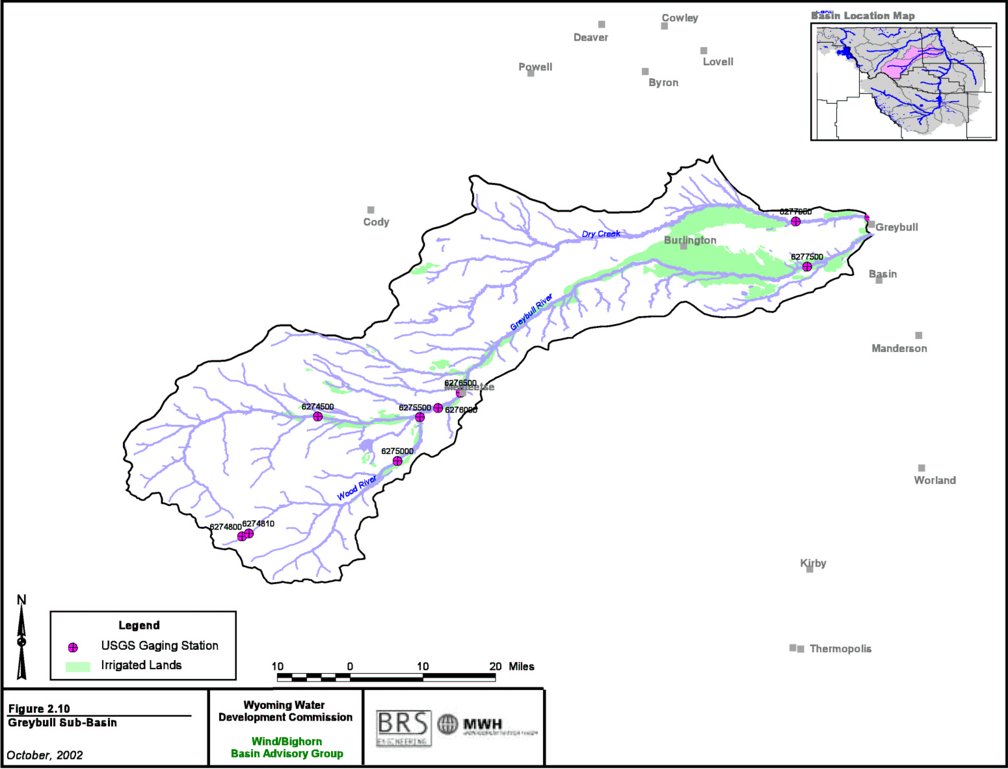
Figure 2-10. Bighorn River Basin - Greybull Sub-Basin
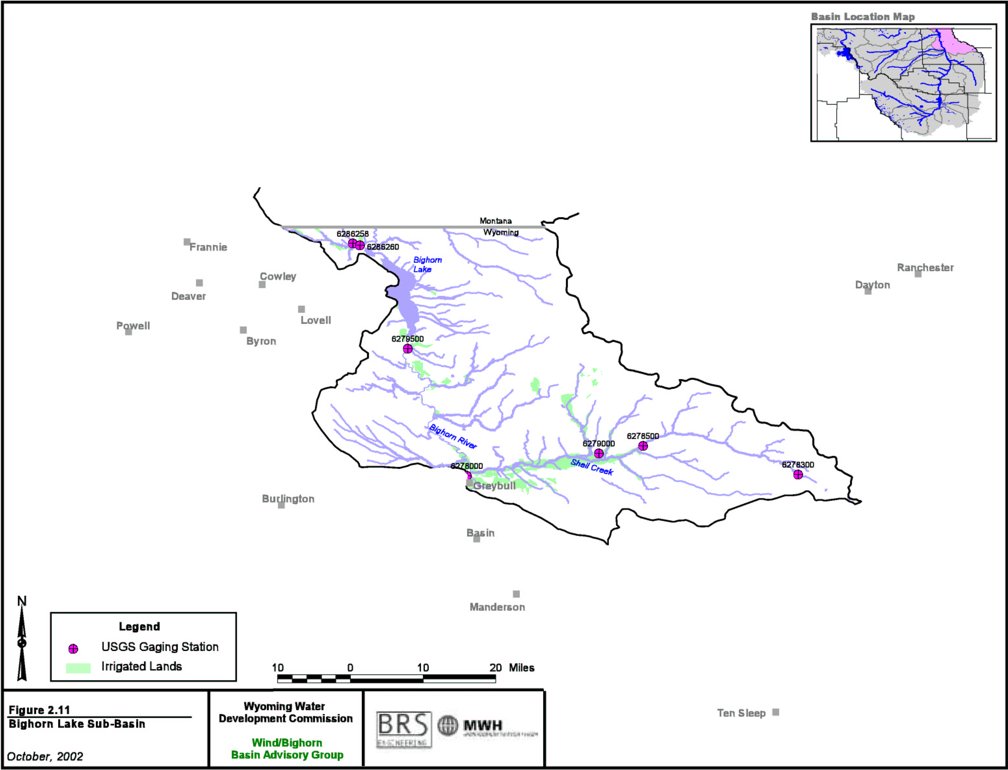
Figure 2-11. Bighorn River Basin - Bighorn Lake Sub-Basin
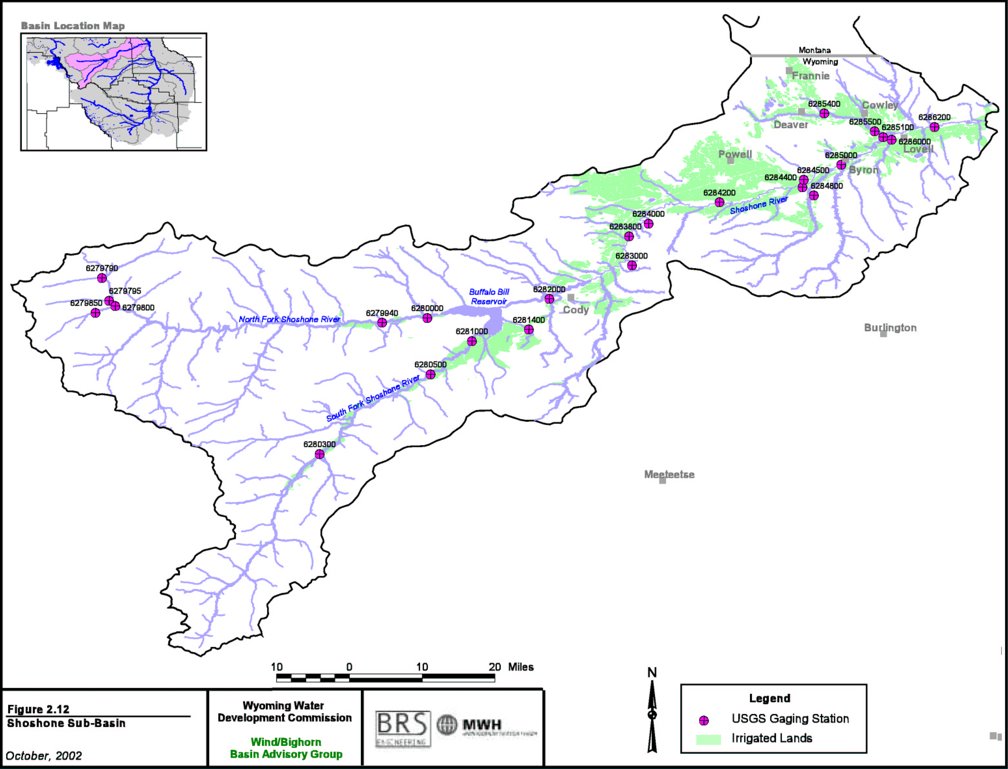
Figure 2-12. Bighorn River Basin - Shoshone Sub-Basin
Section 3 - Study Period Selection
Because historical data is not available for all gages since the inception of data collection, and to make the model less expansive and easier to use, a representative
study period has been selected from the data set. The study period is intended to be representative of the overall long-term gage records and hydrologic conditions. To
be consistent within the study period, overall patterns of basin inflows, diversions and storage must remain constant through the study period. Therefore, study periods
were selected to minimize the impacts of major reservoirs or diversion projects within the period of record. This required examination of reservoir and diversion construction
records. Streamflow statistics within each study period were checked against long-term statistics at gages with long-term records to ensure that the data was representative of the long-term period.
The following events were considered in selection of a model study period. Note that this list of events focuses primarily on significant events during the past 50 years that
could have had significant impacts on streamflow.
- Construction of Boysen Reservoir was completed in 1952. Boysen Reservoir is located on the Wind River at the entrance to Wind River Canyon north of Shoshone. The reservoir
has a capacity of approximately 760,000 acre-feet.
- Pumping plants for the Hanover-Bluff Unit were completed from 1956 through 1958. The pumping plants have a combined capacity of 240 cfs.
- Anchor Dam, located in the Owl Creek basin, was completed in 1960, and was used to temporarily store water in the mid-1960’s. However, due to seepage problems in the floor
of the reservoir, it typically does not provide any carryover storage, and is limited to only a portion of its original 17,000 acre-foot capacity.
- Construction of Yellowtail Dam, located on the Bighorn River at the Wyoming-Montana state line, was completed in 1967. Although the reservoir does not directly impact flows
in Wyoming, the reservoir is used to administer the Yellowstone River Compact requirements, and its initial filling and use in administration does have impacts on river basin management.
- In 1972, construction was completed on Lower Sunshine Reservoir, which is an off-channel reservoir in the Greybull River Basin. The reservoir has a conservation capacity of
approximately 66,000 acre-feet.
- In 1973, construction was completed on Lake Cameahwait Reservoir and Middle Cottonwood Creek Reservoir. These reservoirs are located in the Riverton Unit and primarily control
return flows from Riverton Unit irrigation. These facilities likely have only small impacts on overall river flow.
- Modifications on Buffalo Bill Dam, which is located at the confluence of the North and South Forks of the Shoshone River, were completed in 1993. The modifications included an
increase in conservation capacity of approximately 190,000 acre-feet of conservation storage. Total reservoir capacity is approximately 640,000 acre-feet.
- In 2000, construction was completed on Greybull Valley Dam, an off-channel facility tributary to the Greybull River. Total reservoir capacity is approximately 30,000 acre-feet.
- Several other minor enlargements (generally less than 5,000 acre-feet) were completed on a variety of small reservoirs throughout the study period. However, because the impact
of these reservoirs has little affect on carryover storage, their overall impacts are minimal.
As shown, there is no time period that would completely eliminate impacts of new projects within the period-of-record. However, several events occurred between the 1950s and early
1970s, which would have had a substantial impact on river flows. In addition to the major projects shown above, use of more modern irrigation practices such as gated pipe and
sprinklers also increased significantly during the early 1970’s. Therefore, for purposes of this study, a study period of 1973-2001 was chosen. This period is especially beneficial
in that for most of the basins, both the driest and wettest years on record are contained in the study period. A statistical analysis of the selected study period for each basin is detailed below.
3.1 Madison/Gallatin River Basin
In both the Madison and Gallatin River basins, because there are no major storage reservoirs or significant surface water diversions in the area, there have been few man-made
changes in river regime. Although data is available for the Madison River since the 1910’s and for the Gallatin River since the 1930’s, only more recent data is available for
the Firehole and Gibbon Rivers. To remain consistent with the other basins in this study, the 1973-2001 study period has been selected for the Madison River/Gallatin River basin model.
Table 3-1 presents a statistical summary of the period-of-record and the study period for the Madison River near West Yellowstone (06037500). As shown, the average flow
during the study period is approximately 5.6 percent higher than the long-term average. In addition, for the hydrologic year classification, all of the hydrologic year classification
averages are higher for the study period than for the long-term period-of-record (hydrologic year classification is further discussed in the following sub-section).
Table 3-1. Statistical Summary for Madison River near West Yellowstone (06037500)
| Statistic | Period-of-Record | Study Period | Difference |
| 1914 – 2001 | 1973-2001 |
| Mean | 363,725 | 384,160 | 5.6% |
| Standard Deviation | 59,319 | 58,978 | -0.6% |
| Avgerage – Dry Years | 282,765 | 321,789 | 13.8% |
| Average – Average Years | 356,965 | 373,437 | 4.6% |
| Average – Wet Years | 446,142 | 476,914 | 6.9% |
| Maximum | 571,071 | 571,071 | 0.0% | | Minimum | 243,949 | 319,163 | 30.8%
|
The cumulative departure from the mean analysis shown in Figure 3-1 indicates that there was a more severe period of sustained low flows from 1922 - 1949 and except
for a general period of lower flows from 1986 - 1994, a general trend of higher flows since that time. Two factors could be contributing to the variability in the statistical summary:
- the basin is influenced by naturally unstable groundwater inflows,
- runoff from the basin has a smaller variability from year to year, meaning small percentage changes in runoff have a more significant effect on summary statistics.
Because the general trend in the basin in river flows since 1950 is slightly higher flows than the long-term average, the period-of-record used is deemed adequate. However,
if drought studies are conducted for downstream water users in the basin (downstream of Wyoming), a longer period-of-record that accounts for the lower flow conditions earlier
in the 20th century should be used.
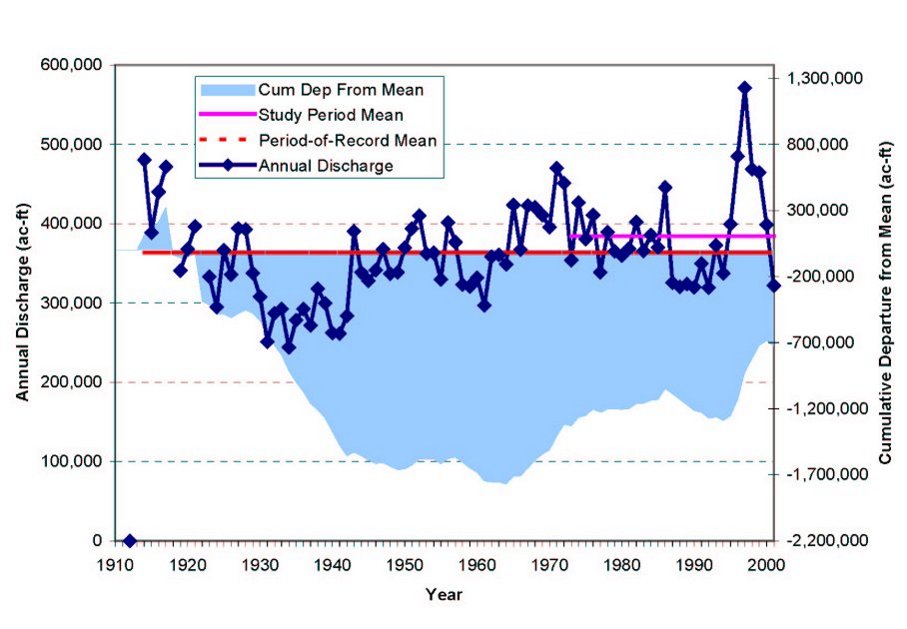
Figure 3-1. Comparison of Study Period Data to Long Term Data for Madison River near West Yellowstone (06037500)
3.2 Yellowstone River Basin
In the Yellowstone River basin, because there are no major storage reservoirs or significant surface water diversions in the area, there have been few man-made changes in
river regime. In addition, data is available in part for several gages since the mid-1920s. Therefore, the study period for the Yellowstone River model could extend back
through the years when data is available, or approximately 75 years. However, to remain consistent with the other basins in this study, the 1973-2001 study period has been
selected for the Yellowstone River model.
Table 3-2 presents a statistical summary of the period-of-record and the study period for the Yellowstone River at Corwin Springs. As shown, the average flow during
the study period is approximately 1.1 percent higher than the long-term average. For the hydrologic year classification, the drier years are slightly drier than the long-term
average, while the wet years are slightly wetter than the long-term average. This will tend to make the model slightly conservative regarding water supply. However, if excess
water were used to fill a reservoir used for carryover storage, the model may show that there is more water available during wet years to fill the reservoir than what has been
available during the long-term average (hydrologic year classification is further discussed in the following sub-section).
Table 3-2. Statistical Summary for Yellowstone River at Corwin Springs
| Statistic | Period-of-Record | Study Period | Difference |
| 1911 – 2001 | 1973-2001 |
| Mean | 2,264,672 | 2,290,531 | 1.1% | | Standard Deviation | 496,186 |
553,594 | 11.6% |
| Avgerage – Dry Years | 1,611,985 | 1,583,982 | -1.7% | | Average – Average Years |
2,242,018 | 2,259,973 | 0.8% | | Average – Wet Years |
2,986,579 | 3,083,661 | 3.3% | | Maximum | 3,733,984 | 3,733,984 |
0.0% | | Minimum | 1,377,898 | 1,432,264 | 3.9% |
The cumulative departure from the mean analysis shown in Figure 3-2 indicates that there was a more severe period of sustained low flows (1928-1946) and a more significant
period of sustained high flows (1961-1976) in the period-of-record than what is reflected in the study period. However, since the model includes on a single year analysis for each
hydrologic condition, the hydrologic year classification is conservative, and because there is no long-term carryover water supply storage in the basin, this should not affect the results.
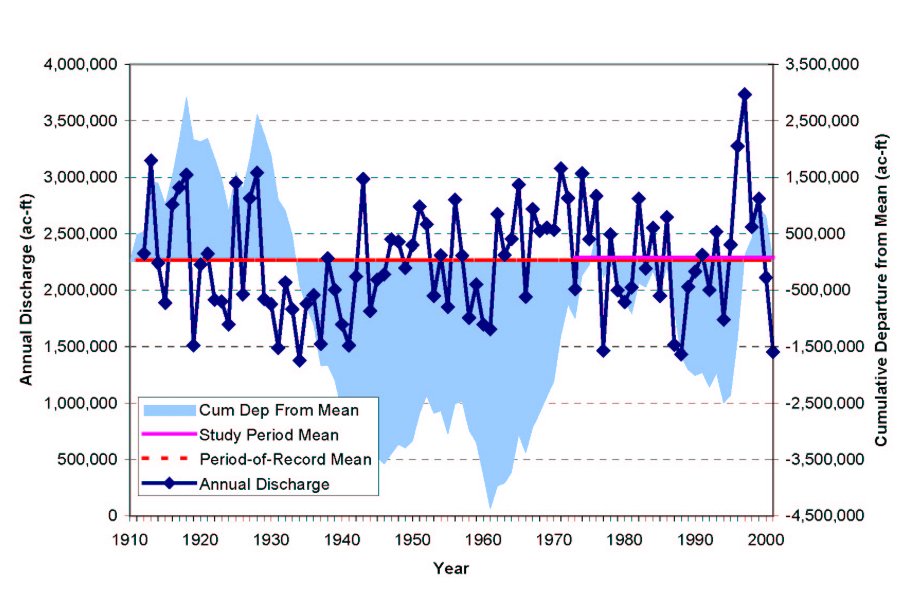
Figure 3-2. Comparison of Study Period Data to Long Term Data for Yellowstone River at Corwin Springs (06191500)
3.3 Clarks Fork River Basin
Although the Clarks Fork River basin does not have any major storage reservoirs within the study area, there are some minor diversions which affect river flows. However, in
general, operations of those diversions have not changed for many years. In addition, the diversions are relatively minor in magnitude compared with the magnitude of river
flows. Therefore, there likely has not been a significant change in river regime. Data is available in part for the Clarks Fork near Belfry gage since the early 1920s. However,
all other gages will require significant filling for use in the model. Therefore, the study period for the Clarks Fork model could extend back through the years when data is
available at the Belfry gage, or approximately 80 years. However, to remain consistent with the other basins in this study, the 1973-2001 study period has been selected for the Clarks Fork model.
Table 3-3 presents a statistical summary of the period-of-record and the study period for the Clarks Fork Yellowstone River near Belfry. As shown, the average flow
during the study period is approximately 2.0 percent less than the long-term average. In addition, the hydrologic year averages for the study period are all slightly less
than the long-term average, which results in the model being slightly conservative towards water supply in general (hydrologic year classification is further discussed in the following sub-section).
Table 3-3. Statistical Summary for Clarks Fork Yellowstone river near Belfry (06207500)
| Statistic | Period-of-Record | Study Period | Difference |
| 1922 – 2001 | 1973-2001 |
| Mean | 678,048 | 664,349 | -2.0% | | Standard Deviation | 156,308 |
170,919 | 9.3% | | Avgerage – Dry Years | 482,266 | 430,150 |
-10.8% | | Average – Average Years | 659,734 | 658,300 | -0.2% |
| Average – Wet Years | 928,773 | 915,688 | -1.4% | | Maximum | 1,075,109 |
1,075,109 | 0.0% | | Minimum | 395,919 | 395,919 | 0.0% |
The cumulative departure from the mean analysis shown in Figure 3-3 indicates that the study period will contain the most prolonged period of sustained high flows
(1969-1976) as well as a prolonged period of sustained low flows (1982-1994). In addition, the study period contains the single highest and fifth highest high flows and
six of the seven lowest flows in the period-of-record. These statistics all indicate that the period-of-record is conservatively representative of the long term data from
a water supply perspective.
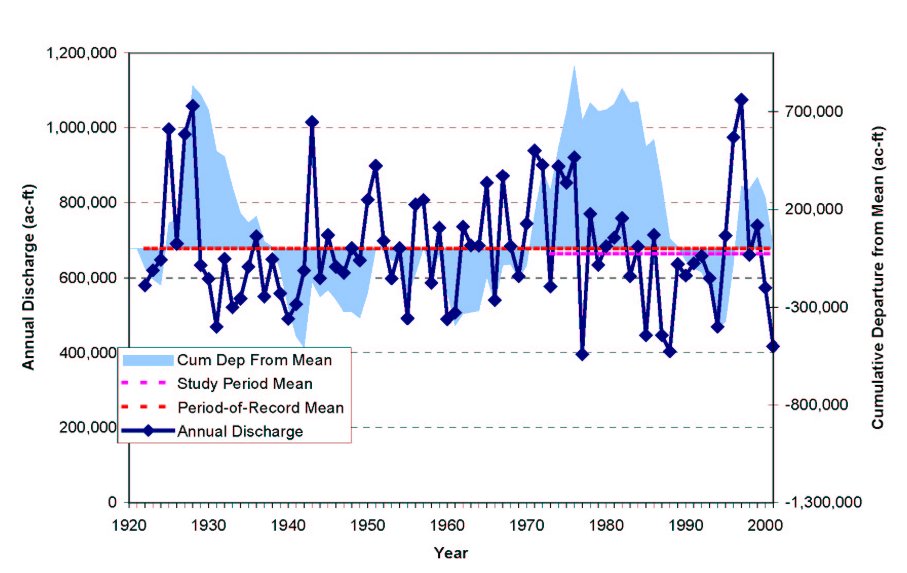
Figure 3-3. Comparison of Study Period Data to Long Term Data for Clarks Fork Yellowstone River near Belfry (06207500)
3.4 Wind River Basin
Although flows in the Wind River basin are significantly impacted by major storage reservoirs and irrigation diversions, the construction and operations of those facilities
within the basin have remained fairly constant through the study period. The two return flow reservoirs previously mentioned, Lake Cameahwait Reservoir and Middle Cottonwood
Creek Reservoir, have no impact on upstream river flows. Data is available for several gages within the basin for fairly long and significant time periods, especially gages
located in the Upper Wind basin. Records in the Little Wind River basin are shorter in length, with several of the more important gages starting recording in the late 1970s
and early 1980s or in the early 1990s. Therefore, record extensions were required for those gages.
Table 3-4 presents a statistical summary of the period-of-record and the study period for the Little Wind River near Riverton. As shown, the average flow during the
study period is approximately 2.2 percent less than the long-term average. For the hydrologic year classification, the dry and average years are slightly drier than the
long-term average, while the wet years are slightly wetter than the long-term average, which will generally make the model slightly conservative regarding water supply.
However, if excess water were used to fill a reservoir for carryover storage, the model may show that there is slightly more water available to fill the reservoir during
wet years than what has been available during the long-term average (hydrologic year classification is further discussed in the following sub-section).
Table 3-4. Statistical Summary for Little Wind near Riverton (06235500)
| Statistic | Period-of-Record | Study Period | Difference |
| 1942 – 2001 | 1973-2001 |
| Mean | 417,778 | 408,775 | -2.2% | | Standard Deviation | 151,116 |
169,197 | 12.0% | | Avgerage – Dry Years | 212,305 | 199,337 | -6.1% |
| Average – Average Years | 415,338 | 396,907 | -4.4% | | Average – Wet Years | 630,568 |
651,841 | 3.4% | | Maximum | 739,201 | 739,201 | 0.0% | | Minimum |
126,379 | 126,379 | 0.0% |
The cumulative departure from the mean analysis shown in Figure 3-4 indicates that the study period will contain a prolonged period of generally sustained low flows
(1986-1994) as well as a prolonged period of generally sustained high flows (1994-1999). In addition, the study period contains the three highest high flows and three of
the four lowest flows in the period-of-record. These statistics all indicate that the period-of-record is conservatively representative of the long term data from a water
supply perspective. It should be remembered that this gage is heavily influenced by irrigation diversions and return flows. However, if it is assumed that these demands
and return flows are relatively constant through the study period and long-term period-of-record, then the diversions and return flows do not influence the relative
comparisons. In addition, it should be noted that the dry, average and wet years used in the comparison before the study period (prior to 1973) were developed using this
gage (06235500) and not the index gage (06224000). Again, this should be negligible for this type of analysis.
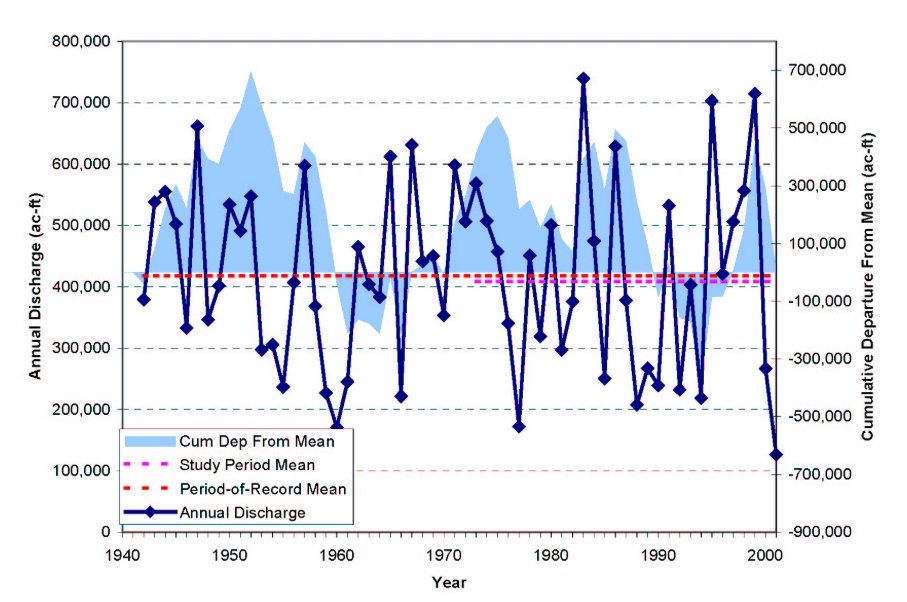
Figure 3-4. Comparison of Study Period with Long Term for Little Wind at Riverton (06235500)
3.5 Bighorn River Basin
As with the Wind River Basin, flows in the Bighorn River Basin are significantly impacted by major storage reservoirs and irrigation diversions. In the Upper Bighorn, Nowood and
Bighorn Lake River basins, the operations of the diversions and reservoirs have remained fairly constant through the study period. However, storage improvements in the Greybull
River (Greybull Valley Reservoir) and the Shoshone River (Buffalo Bill Reservoir) have had an impact on downstream flows in those basins. The impacts of these facilities are described below.
- Greybull Valley Reservoir was completed in 2000, and therefore only impacts streamflow and diversion records in the study period during 2000 and 2001. Both of these years were
dry years and the reservoir could not be completely filled. For these reasons, no adjustments were made in either streamflow or diversion records downstream (although there would be
some impacts on streamflow during periods when the reservoir was filled). For purposes of calibration, the reservoir node will be turned off. However, when the model is run, the full
reservoir storage will be accounted for.
- The enlargement of Buffalo Bill Reservoir was completed in 1993. Analysis of historical storage contents data since the enlargement shows that although the enlargement space was
filled during the wet year of 1995, the reservoir has not been drained to less than the volume of the enlargement, so its impacts to streamflow after the initial filling and its
impacts on water deliveries during dry years have not been significant. Therefore, no adjustments to the Shoshone streamflow or diversion records have been made.
Table 3-5 presents a statistical summary of the period-of-record and the study period for the Shell Creek near Shell. As shown, the average flow during the study period is approximately
0.2 percent less than the long-term average. For the hydrologic year classification, the dry years are significantly drier than the long-term average, the wet years are slightly drier
and the average years slightly wetter than the long-term averages. With the drier years, the dry years will generally make the model slightly conservative regarding water supply.
Table 3�5. Statistical Summary for Shell Creek Near Shell (06278500)
| Statistic | Period-of-Record | Study Period | Difference |
| 1941 – 2001 | 1973-2001 |
| Mean | 70,879 | 70,758 | -0.2% | | Standard Deviation | 14,258 | 13,904 |
-2.5% | | Average – Dry Years | 64,545 | 50,416 | -21.9% | | Average – Average Years |
71,812 | 72,046 | 0.3% | | Average – Wet Years | 89,192 | 87,452 | -2.0% |
| Maximum | 98,394 | 98,394 | 0.0% | | Minimum | 37,374 | 37,374 | 0.0% |
The cumulative departure from the mean analysis shown in Figure 3-5 indicates that the study period contains a consistent mix of dry and wet years. The study period does not
contain a sustained period of either wet or dry years, as is shown in other locations within the period-of-record. However, because this analysis does not explicitly simulate carryover
storage, this should not pose problems. The study period does contain both the wettest and driest years in the period-of-record. These statistics generally indicate that the period-of-record
is conservatively representative of the long term data from a water supply perspective. It should be remembered that this gage is heavily influenced by irrigation diversions and return flows.
However, if it is assumed that these demands and return flows are relatively constant through the study period and long-term period-of-record, then the diversions and return flows do not
influence the relative comparisons.
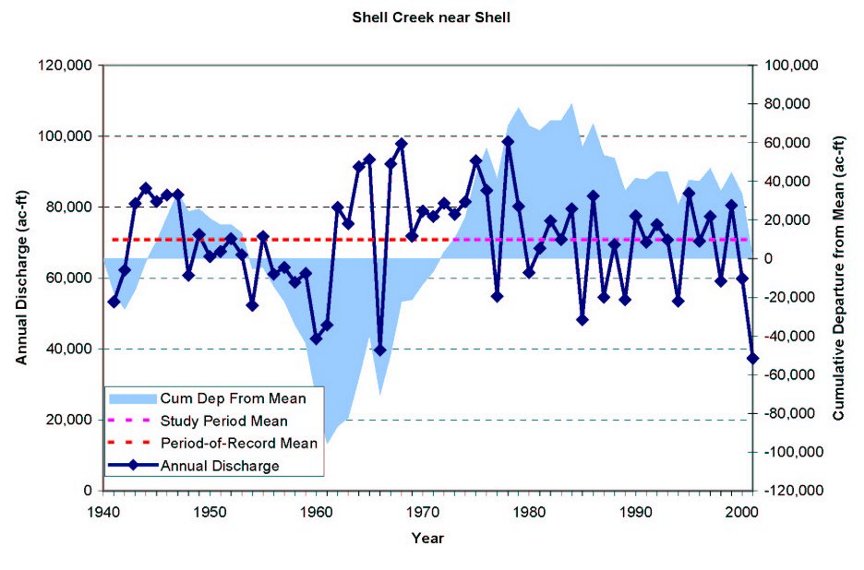
Figure 3-5. Comparison of Study Period Data to Long Term Data for Shell Creek Near Shell (06278500)
Section 4 - Data Filling and Extension
Many of the gages used in the model have an incomplete record or have periods within the record where data is missing. Therefore, in order for the gage data to be used in the model,
the period-of-record for the gage requires either extension or filling. For purposes of this analysis, the same methodologies were used for both filling of gage records and extension
of gage records. In addition, the gage records were only filled or extended for those periods in the selected study period (1973-2001). Methodologies for determining the study period
are discussed in previous sections.
Many methods can be used for filling gage records. The most common and easiest to use method is regression of measured streamflow at the dependent gage (the gage where data filling is
required) to measured streamflow at the independent gage (the gage where data exists for the missing period). Once this mathematical relationship is established, measured data from the
independent gage can be used to estimate the streamflow for the dependent gage. Typical regression relationships can be based on linear, polynomial, power or logarithmic relationships.
For this study most of the strongest relationships were found to be either linear or polynomial in nature. The measure of the degree to which the two gages correlate is typically
called the correlation coefficient (or r2 value). A correlation coefficient of 1.0 indicates perfect correlation. Therefore, those relationships with correlation coefficients closer
to 1.0 have good correlation. Typically, in streamflow data filling and extension, correlation coefficients greater than approximately 0.7 are desired. When correlation coefficients
are less than this value, then relationships are considered weak, and attempts to find gages with better relationships should be made. Correlations were developed between monthly streamflows.
For a majority of the gages, monthly regressions with nearby streamflow gages yielded acceptable correlations to fill the records. However, for the gages where correlations were weak,
attempts were made to find other relationships to fill the streamflow values. First, regressions with precipitation data were attempted. This regression is typically more valid where
snowmelt is not a significant component of streamflow, which limits its use in the study area. Another methodology that can be used is correlation between annual streamflows, then
distribution of annual streamflow to monthly streamflow using historical distributions. If the annual streamflow regression correlation was weaker than the original monthly streamflow
correlation, then the monthly regression was used. Finally, the streamflow record can be filled using regional equations based upon basin characteristics. However, this methodology is
only used in rare occasions when the correlation coefficient is extremely weak. This methodology was not used for any of the streamflow gaging stations.
4.1 Madison/Gallatin River Basin
All three stations in the Madison River Basin required data filling. Missing data for the Madison River gage was filled using a regression relationship with the Gardner River near
Mammoth (06191000) which also required filling. Correlation coefficients were 0.81 for the Madison River regression with the Gardner River while correlation coefficients were 0.89
and 0.95 for the Gibbon and Firehole River regressions, respectively. There were small gaps in Gallatin River at Gallatin Gateway data that also required filling. Again, missing data
for the gage was filled using a regression relationship with the Gardner River near Mammoth gage. A summary of the regression analysis is shown in Table 4-1.
Table 4-1. Correlation Results for Madison/Gallatin River Basin
| Basin | Gage
Number | Gage ID | Percent of
Record Filled |
Dependent
Gage | Corr. Coeff.r^2 | Correlation Equation |
| Madison/Gallatin | 06036905 | Firehole | 57% | 06037500 | 0.95 |
y = -2.0E-6x2 + 0.6751x + 699 |
| 06037000 | Gibbon | 57% | 06037500 | 0.89 | y = 2.0E-6x2 + 0.2573x -2293 |
| 06037500 | Mad_WstY | 41% | 06191000 | 0.81 | y = 0.8636x + 19478 |
| 06043500 | Gal_GalGt2 | 14% | 06191000 | 0.93 | y = -2.0E-5x2 + 4.9378x -8616 |
4.2 Yellowstone River Basin
All of the gages in the Yellowstone Headwaters Hydrologic Unit required data filling except for the Yellowstone River at Corwin Springs (06191500) gage. The Gardner River at
Mammoth Gage (06191000) was filled using the Yellowstone River at Corwin Springs gage using separate regressions for January through June and July through December to account
for the lagging effect caused on the Yellowstone River by Yellowstone Lake. The Yellowstone River at Yellowstone Lake outlet (06186500) and the Lamer River gages (06188000)
were filled using the same methodology. These gages were then used as independent gages for the remaining regressions. Correlation coefficients ranged from 0.87 to 0.98,
except for the Yellowstone River at Yellowstone Lake outlet, where the correlation coefficients were 0.87 for the January through May regression, 0.68 for the June regression
and 0.98 for the July through December regression. Regressions were not performed at various other gages due to regulation of flows or lack of data. A summary of the regression
analysis is shown in Table 4-2.
Table 4-2. Correlation Results for Yellowstone River Basin
| Basin | Gage
Number | Gage ID |
Percent of
Record Filled | Dependent
Gage | Corr. Coeff.r^2 |
Correlation Equation |
| Yellowstone | 06186500 | Yl_LkOut | 10% |
06191500 | 0.87 | y = 2.0E-8x2 + 0.1324x + 18099
(Jan-May) |
| 0.68 | y = 2.0E-7x2 + 0.0042x + 121403
(Jun) |
| 0.95 | y = -4.0E-7x2 + 0.8036x –15813
(Jul-Dec) |
| 06187000 | Yl_CnHot | 100% | 06186500 | 0.94 | y = 0.9884x + 13052 |
| 06187500 | Tow_TowF | 100% | 06191500 | 0.96 | y = 2.0E-8x2 + 0.0054x + 768 |
| 06187915 | Sod_Slv | --- | (1) |
--- |
|
| 06187950 | Sod_LRS | 55% | 06191500 | 0.94 | y = 0.0549x –1874 |
| 06188000 | Lam_TRS | 52% | 06191500 |
0.98 | y = -4.0E-8x2 + 0.4509x –15332
(Jan-Jun) |
| 0.94 | y = 2.0E-7x2 + 0.0986x –660
(Jul-Dec) |
| 06188500 | EFBl_Mam | 100% | 06191000 | 0.88 | y = 2.0E-7x2 + 0.0181x –84 |
| 06189000 | BlD_Mam | 83% | 06191000 | 0.85 | y = 0.0661x –249 |
| 06190000 | Lup_Mam | 100% | 06191000 | 0.98 | y = 0.0302x –97 |
| 06190500 | Gard_Mam | --- | (5) | --- |
|
| 06190540 | Hot_Mam | --- | (2) | --- |
|
| 06191000 | Gard_nrMam | --- | 06191500 |
0.94 | y = -1.0E-8x2 + 0.0715x + 1918
(Jan-Jun) |
| 0.94 | y = 4.0E-8x2 + 0.0143x + 5677
(Jul-Dec) |
| 06191500 | Yl_CSp | 0% | (---) | --- |
|
Notes:
(---) No regression needed.
(1) Not enough data for regression.
(2) Too regulated for regression.
(3) Too little inflow to compute.
(4)Canal, drain, etc.
(5) Gage not needed for analysis.
4.3 Clarks Fork River Basin
The Clarks Fork Yellowstone River near Belfry, Montana gage (06207500) has an extensive period-of-record. This gage is located just upstream of the confluence of the Clarks Fork
and Big Sand Coulee. However, all other gages will require extensive filling to be used in the model. The two remaining Clarks Fork gages as well as the Sunshine Creek gage (06206500)
were filled using the Belfry gage. However, not enough data was available or flows were too small for a regression of the remaining gages. Other methods of streamflow estimation were
required for these gage locations. The correlation coefficients were fairly strong for all three gages, ranging from 0.97 to 0.99. A summary of the regression analysis is shown in Table 4-3.
Table 4-3. Correlation Results for Clarks Fork River Basin
| Basin | Gage
Number | Gage ID | Percent of
Record Filled |
Dependent
Gage | Corr. Coeff.r^2 | Correlation Equation |
| Clarks Fork | 06205500 | CFk_abSqC | 100% | 06207500 | 0.97 | y = 0.4640x -2201 |
| 06205950 | Ldg_Pnt | --- | (1) | --- |
|
| 06206000 | Cfk_blCrC | 100% | 06207500 | 0.99 | y=0.8234x -4569 |
| 06206500 | Sun_Pnt | 100% | 06207500 | 0.97 | y = 0.1322x + 74 |
| 06207000 | CFk_nrClk | --- | (5) | --- |
|
| 06207500 | Cfk_BlfMT | 0% | (---) | --- |
|
| 06207507 | BigS_nrBdg | --- | (3) | --- |
|
| 06207510 | BigS_Line | --- | (2) | --- |
|
| 06207540 | STip_BlfMT | --- | (3) | --- |
|
Notes:
(---) No regression needed.
(1) Not enough data for regression.
(2) Too regulated for regression.
(3) Too little inflow to compute.
(4) Canal, drain, etc.
(5) Gage not needed for analysis.
4.4 Wind River Basin
Because of its geographic expanse, flows in the Wind River basin are derived from a variety of sources with unique influences on streamflow, such as the Wind River range,
the Owl Creek range, Beaver Rim and the high plains divide between the Wind Basin and the Platte Basin. Therefore, estimation of streamflows is unique to each sub-basin and/or
flow source. Correlation results for each of the gages in the Wind River Basin are shown in Table 4-4.
There are several currently operating gages on the Wind River and its tributaries. In addition, most gages used in the analysis have at least a portion of their data contained
within the study period. The key headwaters gage within the Upper Wind hydrologic unit is Bull Lake Creek above Bull Lake (06224000). This gage was used to fill several of the
headwaters gages in the upper portion of the hydrologic unit originating from the Wind River Range or Absaroka Range. The Wind River near Crowheart (06225500) gage was used to
fill the Wind River above Red Creek gage (06220800), while the Wind River at Riverton gage (06228000) was used to fill Wind River gages located lower in the basin. Correlation
coefficients for these regressions ranged from 0.86 to 0.95. One gage was not filled because it is too regulated for a regression analysis, while two gages were not filled because
there is not enough data for a regression analysis.
Analysis of available data shows that runoff from the Owl Creek mountains occurs at different times of the year and at different magnitudes than runoff from the Wind River range
or the Absoraka range. The only gage measuring runoff from the Owl Creek mountains in the Upper Wind hydrologic unit is the Crow Creek gage (06222700), which has data from the mid
1960’s to the mid 1990’s. There are gages on other tributaries from the Owl Creeks in the Lower Wind hydrologic unit, but these gages are more heavily influenced by irrigation
return flows and have shorter periods-of-record. Although the hydrologic characteristics are different, a regression analysis remains the preferred option for extending data if a
correlation can be found. The Bull Lake Creek above Bull Lake gage was used to extend the Crow Creek gage data with a resulting correlation coefficient was 0.75.
The South Fork above Washakie Reservoir gage, which is located above all storage and diversion influences, has data from the late 1970’s to present. In addition, the Little Wind
near Riverton gage, which is downstream of all major diversions within the basin, has data from the early 1940’s to present. There are several other gages which have data for a
portion of the study period (described in later sections), but will require filling for the remainder of the study period. The South Fork Little Wind above Washakie Rservoir gage
(06228350) was filled using the Bull Lake Creek above Bull Lake gage (06224000). Then, the gage was used to fill the South Fork Little Wind below Washakie Reservoir gage (06228450).
The Little Wind above Arapahoe gage (06231000) was filled using the Little Wind near Arapahoe gage. Although these gages are influenced by diversions, there are no major diversions
between the gages, making the correlation between the two gages relative strong. Correlation coefficients ranged from 0.59 at the Trout Creek gage (06229900) to 0.97 at the Little
Wind above Arapahoe gage. The Trout Creek gage correlation coeffecient is low, but because the tributary is relatively small, it was deemed adequate for modeling purposes. Several
gages were too regulated for data filling using headwaters gages and the Little Wind near Arapahoe (06230500) gage did not have enough data for a regression analysis. These gages
will be located in the model as flow accumulation nodes but will not be used for calibration purposes.
There are several gages within the hydrologic unit that contain a significant amount of data. However, because many of the gages flow only intermittantly and are heavily
influenced by agricultural activities, filling the missing data becomes more difficult. The Fivemile Creek near Shoshoni gage (06253000) requires filling for only six years.
However, regressions with other gages did not yield acceptable correlation coefficients. In addition, regressions with both monthly and annual precipitation also did not yield
acceptable results. Therefore, the data was filled using a regression with annual inflows into Boysen Reservoir that are not attributable to the Wind River. This data was
calculated by subtracting Wind River at Riverton flows from total Boysen Reservoir inflows. The resulting correlation coefficient was 0.45, which is significantly below a normal
acceptable level. However, because the data period filled is relatively short, because the amount of inflows to the model represented by Fivemile Creek are relatively small and
because it is the best available flow estimation technique, the results were deemed acceptable for this analysis.
The Fivemile Creek near Shoshoni gage data was used to fill several other gages in the basin. Correlation coefficients for these gages were 0.98, 0.91 and 0.53, respectively.
Again, the 0.53 is significantly lower than the desired correlation for streamflow regressions. However, because the stream is intermittant, and because its contribution to
flow is relatively small, the correlation was deemed acceptable for this analysis. The Fivemile Creek near Pavillion (06245000) and Poison Creek near Shoshoni (06255500)
gages did not have enough data in the period-of-record to perform a regression analysis with another gage. Several other gages had too little and unseasonably variable flow
to perform the regression analysis.
None of the gages in the Badwater Creek sub-basin are currently operating, with the most recent data in 1980. Therefore, all of the gages required filling before they could
be used in the model. Since these gages exhibit flow patterns which are unique to this basin orientation, existing streamflow records from other sites in the Wind River basin
could not be used as dependent gages for the regression. Therefore, the Badwater Creek at Bonneville gage was filled using annual precipitation at Black Mountain. The annual
flow was then distributed on a monthly basis using the average monthly distribution from the period-of-record flows. The Badwater Creek at Lysite (06256500) and Bridger Creek
near Lysite (06256800) gages were then filled using the Bonneville gage. Finally, the Dry Creek gage (06256900) was filled using the Lost Cabin gage. The Badwater Creek at Lost
Cabin gage (06256500) was not filled because the period-of-record was too short to regress. A summary of the regression analysis is shown in Table 4-4.
Table 4-4. Correlation Results for Wind River Basin
| Basin | Gage
Number | Gage ID | Percent of
Record Filled |
Dependent
Gage | Corr. Coeff.r^2 | Correlation Equation |
| Upper Wind |
06218500 | wind_nrDub | 31% | 06224000 | 0.82 | y = 0.4634x + 2361 |
06220000 | Wind_atDub | --- | (1) | --- |
| | 06220500 | EFWind_Dub | 24% | 06224000 | 0.85 | y = 0.7749x + 1060 |
| 06220800 | Wind_RedCk | 62% | 06225500 | 0.90 | y = 0.6110x -3105 |
| 06221400 | Din_abLks | 34% | 06224000 | 0.90 | y = 0.4349x + 863 |
| 06221500 | Din_Bur | --- | (2) | --- |
|
| 06222000 | Wind_Bur | --- | (1) | --- |
|
| 06222500 | DryCk_Bur | 64% | 06224000 | 0.95 | y = 7.0E-7x2 + 0.1255x + 50 |
| 06222700 | CrowCk_Tip | 28% | 06224000 | 0.75 | y = 0.0714x + 17 |
| 06223000 | MdCk_Len | --- | (1) | --- |
|
| 06223500 | WlCk_Crow | 67% | 06224000 | 0.86 | y = 1.0E-6x2 -0.0021x + 350 |
| 06224000 | BlCk_abLk | 0% | (---) | --- |
|
| 06225000 | BlLk_Len | 0% | (---) | --- |
|
| 06225500 | Wind_Crow | 0% | (---) | --- |
|
| 06227600 | Wind_Kin | 53% | 06228000 | 0.95 | y = 1.2547x + 564 |
| 06228000 | Wind_Riv | 0% | (---) | --- |
|
| 06236100 | wind_abBoy | 61% | 06228000 | 0.96 | y = 1.9702x + 8009 |
| Little Wind |
06228350 | SFLW_abWRes | 14% | 06224000 | 0.96 | y = 2.0E-6x2 + 0.3301x + 485 |
| 06228450 | SFLW_blWRes | 55% | 06228350 | 0.95 | y = 0.8885x + 605 |
| 06228500 | LW_FtWa | --- | (2) | --- |
|
| 06228800 | NFLW_nrFW | 55% | 06224000 | 0.93 | y = 2.0E-6x2 + 0.3302x + 815 |
| 06229000 | NFLW_atFW | --- | (2) | --- |
|
| 06229680 | Sage_Nork | 82% | 06224000 | 0.83 | y = 6.0E-7x2 -0.0074x + 289 |
| 06229900 | Trout_FW | 71% | 06224000 | 0.60 | y = 3.0E-7x2 + 0.0030x + 289 |
| 06230190 | Mill_abRL | 78% | 06224000 | 0.72 | y = 2.0E-7x2 + 0.0025x + 108 |
| 06230500 | LW_nrArap | --- | (1) | --- |
|
| 06231000 | LW_abArap | 45% | 06235500 | 0.97 | y = 2.0E-7x2 + 0.3287x -182 |
| 06234000 | LW_blArap | --- | (1)(2) | --- |
|
| 06234500 | Beav_nrLnd | --- | (2) | --- |
|
| 06235000 | Beav_nrAr | --- | (2) | --- |
|
| 06235500 | LW_Riv | 0% | (---) | --- |
|
| Lower Wind |
06239000 | Musc_Sho | --- | (2) | --- |
|
| 06244500 | 5mi_aPav | --- | (3) | --- |
|
| 06245000 | 5mi_Pav | --- | (1) | --- |
|
| 06250000 | 5mi_Riv | 100% | 06233000 | 0.98 | y = 1.8852x -197 |
| 06251500 | Sand_Sho | 100% | 06233000 | 0.91 | y = 0.1985x -18 |
| 06253000 | 5mi_Sho | 21% | (6) | 0.45 | y = 502.4x |
| 06255500 | Poi_Sho | --- | (1) | --- |
|
| 06257500 | Mud_Pav | --- | (3) | --- |
|
| 06258000 | Mud_Sho | 62% | 06253000 | 0.53 | y = 2.0E-6x2 + 0.0718x + 314 |
| 06258500 | Dcot_Bon | --- | (3) | --- |
|
| 06259000 | Wind_blBy | --- | (1) | --- |
|
| Badwater |
06256000 | Bad_Lyb | 100% | 06257000 | 0.72 | y = 9.0E-6x2 + 0.4853x + 109 |
| 0625650 | Bad_LC | --- | (1) | --- |
|
| 06256650 | Bad_Lys | 97% | 06256000 | 0.84 | y = 8.0E-5x2 + 0.5778x + 195 |
| 0625680 | Bri_Lys | 97% | 06256000 | 0.89 | y = 5.0E-5x2 + 0.2819x + 307 |
| 06256900 | Dry_Bon | 72% | 06256650 | 0.81 | y = 4.0E-6x2 + 0.0150x |
| 06257000 | Bad_Bon | 97% | (7) | 0.46 | y = 3790x –15152 |
Notes:
(---) No regression needed.
(1) Not enough data for regression.
(2) Too regulated for regression.
(3) Too little inflow to compute.
(4) Canal, drain, etc.
(5) Gage not needed for analysis.
(6) Annual Non-Wind River Computed Inflows to Boysen Reservoir
(7) Annual Black-Mountain Precipitation
4.5 Bighorn River Basin
As with the Wind River Basin, because of its geographic expanse, flows in the Bighorn River basin are derived from a variety of sources with unique influences on streamflow,
such as the Absoroka Range, the Owl Creek range, the Bighorn Mountains and the interior high plains of the Bighorn Basin. Therefore, estimation of streamflows is unique to
each sub-basin and/or flow source. Correlation results for each of the gages in the Wind River Basin are shown in Table 4-5.
The Upper Bighorn Basin does not contain any gages that have data for the entire study period, and there are only three gages that are currently operational. The Wind River
below Boysen gage (06259000) was used to fill Bighorn River gages, including the gages at Thermopolis, Worland and Basin. Correlation coefficients ranged from 0.85 to 1.00.
As expected, as the Bighorn River gages further downstream are more influenced by irrigation diversions and return flows, the data is less well correlated. Key gages in the
basins west of the Bighorn River included the USBR’s record of Anchor Reservoir computed inflow, Anchor Reservoir releases, and the South Fork of Owl Creek near Anchor
Reservoir gage (0626000). Correlation coefficients for these gages ranged from 0.57 to 0.98, with only the Gooseberry Creek at Dickie (06265800) having a correlation coefficient
less than 0.7 This correlation was determined to be acceptable because a better correlation using other gages could not be calculated.
There are currently no active gages in the Nowood River basin, and only the Nowood River at Tensleep gage (06270000) has significant data within the period-of-record Several
correlation attempts were made with nearby gages from different basins to extend the record of this gage. However, none of those attempts yielded acceptable results. Therefore,
the annual gage record was extended using the annual precipitation at Black Rock Mountain. The annual value was distributed monthly using the average monthly distribution of the
actual gage data. This gage was then used to extend the record at the Canyon Creek at Tensleep gage (06270500). The correlation coefficient was 0.65, slightly less than the
desired value of 0.70. However, no other methods or gages yielded better correlations. The remaining gages in the basin were extended using Shell Creek gages, all of which had
correlation coefficients greater than 0.90.
The Greybull River at Meeteetsee gage (06276500) is the only currently active gage in the Greybull River basin. However, the data for this gage is only collected in the late
spring, summer and early fall months when the river is not frozen. Therefore, the South Fork Shoshone at Valley gage (06280300) was used to fill the winter month flows. Although
the correlation coefficient of 0.67 is below the desired value of 0.70, the only flows filled are during the winter, which are less important in the overall annual hydrograph.
Therefore, it was deemed acceptable for this study. The remainder of the gages in the basin were filled using the Greybull River at Meeteetsee gage, with correlation coefficients
ranging from 0.74 to 0.94.
The Bighorn Lake basin contains gages along the mainstem of the Bighorn River and in several tributary sub-basins, including the Shell Creek sub-basin. Gages in the Shell Creek,
Porcupine Creek and Crooked Creek sub-basins were filled using the Shell Creek above Shell Reservoir gage, with correlation coefficients ranging from 0.79 to 0.94. The Dry Creek
gage (06278000) was filled using the Greybull River at Meeteetsee gage. The correlation coefficient for this regression was below the target of 0.7. However, because the flows in
the creek are small and there are no major diversions, the correlation was deemed acceptable.
Two gages were used to fill missing data in the Shoshone River basin. For the upper portions of the basin (above Buffalo Bill Reservoir), the South Fork Shoshone near Valley
gage (0628300) was used, while for the lower portions of the basin, the Shoshone River near Lovell gage (06285100) was used. Both of these gages have data for the entire study
period and are active gages. Correlation coefficients for the upper gages ranged from 0.66 to 0.98, with a majority greater than 0.90. Correlation coefficients for the lower basin
were all greater than 0.90. Several of the gages could not be filled because their period-of-record was not long enough, the flow was too regulated for a regression analysis.
Table 4-5. Correlation Results for Bighorn River Basin
| Basin | Gage
Number | Gage ID | Percent of
Record Filled |
Dependent
Gage | Corr. Coeff.r^2 | Correlation Equation |
| Upper Bighorn |
06259500 | Bh_Therm | 100% | 06259000 | 1.00 | y = 1.0072x + 2830 |
| 06260000 | SFOwl_nrAnc | 40% | 09999001(6) | 0.81 | y = 3.0E-5x2 + 1.0239x + 378 |
| 06260200 | MdOwl_abAnc | --- | (3) | --- |
|
| 06260400 | SFOwl_blAnc | 24% | 09999002(7) | 0.98 | y = 0.9511x + 12 |
| 06260500 | SFOwl_Crt | --- | (2) | --- |
|
| 06261000 | SFOwl_acrn | --- | (1)(2) | --- |
|
| 06261500 | SFOwl_nrTh | --- | (1)(2) | --- |
|
| 06262000 | NFOwl_nrAnc | 100% | 06260000 | 0.81 | y = 0.3515x + 44 |
| 06262300 | NFOwl_abBR | 81% | 06260000 | 0.75 | y = 0.3378x + 89 |
| 06262500 | NFOwl_atCR | --- | (1) | --- |
|
| 06263000 | NFOwl_nrTh | --- | (1) | --- |
|
| 06263500 | Mud_Th | --- | (1) | --- |
|
| 06264000 | Owl_Th | --- | (2) | --- |
|
| 06264500 | Owl_Luc | --- | (2) | --- |
|
| 06265000 | Kirb_Luc | --- | (1) | --- |
|
| 06265337 | Cot_HamD | 71% | 09999001(6) | 0.73 | y = 0.4244x + 98 |
| 06265500 | Cot_Win | --- | (1) | --- |
|
| 06265800 | Gos_atDk | 79% | 09999001(6) | 0.57 | y = 0.4687x + 244
|
| 06266000 | Gos_Grs | --- | (1)(2) | --- |
|
| 06266500 | Gos_nrDk | --- | (1) | --- |
|
| 06267000 | Gos_Nei | --- | (2) | --- |
|
| 06267400 | Now_Colt | --- | (3) | --- |
|
| 06268500 | 15mi_Wor | --- | (3) | --- |
|
| 06268600 | Bh_Wor | 100% | 06259000 | 0.91 | y = 1.0101x -16486
|
| 06269000 | Bh_nrMand | --- | (1) | --- |
|
| 06269500 | Bh_atMand | --- | (1) | --- |
|
| 06271500 | Pr_beLSol | --- | (1) | --- |
|
| 06274300 | Bh_Bas | 38% | 06259000 | 0.85 | y = 1.2616x + 3749 |
| Nowood |
06270000 | Now_Ten | 31% | Prc-BlRk | 0.00 |
|
| 06270450 | Can_beCk | --- | (1) | --- |
|
| 06270500 | Can_Ten | 100% | 06270000 | 0.65 | y = 0.1047x + 1065 |
| 06271000 | Ten_Ten | 100% | 06278300 | 0.91 | y = 2.3956x + 2752 |
| 06272500 | Pnt_Hyat | 100% | 06278500 | 0.96 | y = 1.3242x -1755 |
| 06273000 | Med_Hyat | 97% | 06278300 | 0.90 | y = 0.6754x + 571 |
| 06273500 | Pnt_beHyat | --- | (1)(2) | --- |
|
| 06274000 | No_Bonz | --- | (1)(2) | --- |
|
| 06271500 | Pnt_LkSol | --- | (1) | --- |
|
| Greybull |
06274500 | Gry_PtFk | 100% | 06276500 | 0.89 | y = 0.6108x -1196 |
| 06274800 | Wod_nrKir | 90% | 06276500 | 0.92 | y = 9.0E-8x2 + 0.0348x + 105 |
| 06274810 | Wod_atKir | 90% | 06276500 | 0.94 | y = 9.0E-7x2 + 0.0063x + 51 |
| 06275000 | Wod_Sun | 31% | 06276500 | 0.87 | y = 0.3230x + 627 |
| 06275500 | Wod_Met | 100% | 06276500 | 0.80 | y = 0.3337x + 1121 |
| 06276000 | Gry_nrMet | --- | (1) | --- |
|
| 06276500 | Gry_atMet | 51% | 06280300 | 0.67 | y = 0.7542x + 402 |
| 06277000 | BeCan_Brl | --- | (4) | --- |
|
| 06277500 | Gry_Bas | 97% | 06276500 | 0.74 | y = 3.0E-6x2 + 0.2472x + 4141 |
| 06277950 | Dry_Grey | --- | (1) | --- |
|
| Bighorn Lake |
06278000 | Dry_Grey | 100% | 06276500 | 0.51 | y = 0.0403x + 685 |
| 06278300 | Shl_abRes | 3% | (---) | --- |
|
| 06278500 | Shl_nrShl | 51% | 06278300 | 0.92 | y = 2.1704x + 2357 |
| 06279000 | Shl_atShl | --- | (1) | --- |
|
| 06279500 | Bh_Kane | 0% | (1) | --- |
|
| 06286250 | Bh_Lov | --- | (1) | --- |
|
| 06286258 | BiC_Lov | --- | (3) | --- |
|
| 06286260 | Crk_Lov | 100% | 06278300 | 0.79 | y = 3.0E-6x2 + 0.0529x + 461 |
| 06286270 | Porc_Lov | 100% | 06278300 | 0.94 | y = 1.1576x + 800 |
| Shoshone |
06279790 | Jones_Pah | 90% | 06280300 | 0.66 | y = 0.0957x + 1080 |
| 06279795 | Crow_Pah | 90% | 06280300 | 0.89 | y = -1.0E-7x2 + 0.0843x -176 |
| 06279800 | NFSh_Pah | 97% | 06280300 | 0.66 | y = 3.0E-6x2 + 0.1795x + 7410 |
| 06279850 | Mdi_YNP | 90% | 06280300 | 0.98 | y = 7.0E-7x2 + 0.0904x + 355 |
| 06279940 | NFSh_atWap | 59% | 06280300 | 0.96 | y = -8.0E-7x2 + 2.2210x -1089 |
| 06280000 | NFSh_nrWap | 64% | 06280300 | 0.95 | y = 5.0E-7x2 + 1.9994x + 1509 |
| 06280300 | SFSh_Val | 0% | (---) | --- |
|
| 06280500 | SFSh_Ish | --- | (1) | --- |
|
| 06281000 | SFSh_abBB | 3% | 06280300 | 0.96 | y = 4.0E-6x2 + 0.5169x + 1949 |
| 06281400 | Dia_nrCdy | --- | (3) | --- |
|
| 06282000 | Sh_beBB | 0% | (---) | --- |
|
| 06282500 | Sh_Cody | --- | (1) | --- |
|
| 06283000 | Sho_Corb | --- | (1) | --- |
|
| 06283800 | Sh_abWillD | 90% | 06285100 | 0.98 | y = 1.0E-6x2 + 0.4491x + 10798 |
| 06284000 | Sh_atWillD | --- | (1) | --- |
|
| 06284200 | Sh_Will | 81% | 06285100 | 0.98 | y = 7.0E-7x2 + 0.7665x + 4854 |
| 06284400 | Sho_Garl | 76% | 06285100 | 0.93 | y = 8.0E-7x2 + 0.6562x -1201 |
| 06284500 | Bit_Garl | --- | (2) | --- |
| | 06284800 |
Whst_Garl | --- | (2) | --- |
|
| 06285000 | Sh_Byr | --- | (5) | --- |
|
| 06285100 | Sh_nrLov | 0% | (---) | --- |
|
| 06285400 | Sag_atSid | --- | (2) | --- |
|
| 06285500 | Sag_Lov | --- | (2) | --- |
|
| 06286000 | Sho_atLov | --- | (1) | --- |
|
| 06286200 | Sh_Kane | 100% | 06285100 | 0.97 | y = -3.0E-7x2 + 1.1130x + 7405 |
Notes:
(---) No regression needed.(1) Not enough data for regression.
(2) Too regulated for regression.
(3) Too little inflow to compute.
(4) Canal, drain, etc.
(5) Gage not need for analysis.
(6) Anchor Reservoir computed inflows
(7) Anchor Reservoir releases
Section 5 - Ungaged Headwaters Site Data Estimation
In order for the model to accurately simulate streamflow and diversions for the entire basin, an estimation of streamflow above all diversions is required. However, in many parts of
the basin, there are no streamflow gaging stations above the most upstream diversion on the stream. Therefore, streamflow upstream of the diversion must be estimated. Two methods are
available to make these estimations:
- estimate streamflow based on regional equations which are a funtion of basin characteristics such as location, elevation and orientation;
- estimate streamflow by adding diversions and subtracting inflows from the closes downstream gage.
For most locations, the regional equation methodology was used to estimate streamflow for ungaged headwaters sites. However, in areas where this methodology yielded implausible
results, such as the streamflow being less than the actual measured diversion, or the streamflow being greater than the next downstream gage adjusted for inflows and diversions,
then the estimated headwaters flows were adjusted based on the available data. More detailed explanations are found in the detailed model description chapters.
For the study area, two sources of regional regression equations are available for estimating natural flows. The USGS (Rankl, 1994) has published monthly regression equations for
the Wind River basin based upon several physical basin characteristics, including drainage area, mean basin elevation, basin slope, maximum basin relief and mean annual precipitation.
Discharges are given for the 10, 50, 70 and 90 percent exceedance levels (Q10, Q50, Q70 and Q90). For purposes of this report, Q10 was used for wet years, Q50 was used for average
years and Q90 was used for dry years. Monthly regional regression equations for the entire state of Wyoming were developed by Miselis (1999). Equations were developed for the Wind,
Bighorn and Absoraka ranges within the study area, are a function of drainage area and precipitation. Table 5�1 presents the regression equations from these sources. As shown, the
USGS study was used for the Wind River basin (because the study was more specific to this basin) while the Miselis data was used for the other two areas. The specific set of equations
used for each site is shown in the tables for each river basin.
Physical basin data was developed through GIS using tiled 30 meter Digital Elevation Models (DEMs) from the USGS. Drainage basins were delineated using the BASIN1 extension (Petras, 2000),
with the lowest point in the drainage generally taken as the most downstream point on the stream immediately upstream of the first diversion on the stream. In some cases, this was
modified as needed to include or exclude portions of the drainage area. From the drainage area, the extension calculates several basin parameters that are used directly in the equations
or used to calculate parameters for the equations, including average slope, and minimum and maximum elevation. For most area, average annual basin precipitation was developed from the
2000 meter PRISM coverage available for the State of Wyoming (Daly and Taylor, 1997). However, it was found that for some of the higher elevations in the Wind River range, the coverage
produced much higher precipitation values that those used to develop the USGS equations, thereby producing unrealistic flow values. For these areas, the precipitation was taken directly
from the USGS report for those sub-basins where data was available in the report, or from the USGS source of information which was Plate 1b in the 1988 USGS report (Lowham, 1988).
Table 5-1. Regression Equations Used for Estimation of Natural Flow
| Month | Q10 (cfs) | Q50(cfs) | Q90(cfs) |
| Runoff From Absaroka Range (Miselis, 1999) |
| Jan | Q = 0.05927 A1.31 | Q = 0.03402 A1.37 | Q = 0.04791 A1.26 |
| Feb | Q = 0.07135 A1.26 | Q = 0.03247 A1.37 | Q = 0.03247 A1.37 |
| Mar | Q = 0.14064 A1.17 | Q = 0.05100 A1.31 | Q = 0.01385 A1.47 |
| Apr | Q = 1.08668 A1.02 | Q = 0.17865 A1.18 | Q = 0.05363 A1.30 |
| May | Q = 1.80260 A1.17 | Q = 0.84333 A1.16 | Q = 0.39274 A1.10 |
| Jun | Q = 1.79473 A1.21 | Q = 0.94254 A1.21 | Q = 0.37077 A1.25 |
| Jul | Q = 0.96739 A1.19 | Q = 0.50816 A1.18 | Q = 0.23550 A1.19 |
| Aug | Q = 0.68077 A1.09 | Q = 0.38753 A1.09 | Q = 0.17235 A1.14 |
| Sep | Q = 0.62791 A1.02 | Q = 0.31930 A1.06 | Q = 0.16719 A1.10 |
| Oct | Q = 0.58304 A1.01 | Q = 0.24406 A1.09 | Q = 0.07011 A1.25 |
| Nov | Q = 0.26835 A1.11 | Q = 0.06778 A1.30 | Q = 0.03518 A1.35 |
| Dec | Q = 0.08177 A1.28 | Q = 0.04419 A1.34 | Q = 0.00935 A1.56 |
| Runoff From Bighorn Range (Miselis, 1999) |
| Jan | Q = 0.17438 A1.03 | Q = 0.17390 A0.97 | Q = 0.14588 A0.96 |
| Feb | Q = 0.13397 A1.07 | Q = 0.14371 A1.01 | Q = 0.12379 A0.99 |
| Mar | Q = 0.23036 A0.99 | Q = 0.15718 A1.00 | Q = 0.09543 A1.04 |
| Apr | Q = 0.81846 A0.95 | Q = 0.49751 A0.84 | Q = 0.17848 A0.95 |
| May | Q = 4.76650 A0.92 | Q = 2.95597 A0.80 | Q = 0.78253 A0.83 |
| Jun | Q = 0.00003 A1.07 P4.03 | Q = 0.00087 A0.93 P2.70 | Q = 0.00020 A0.98 P2.82 |
| Jul | Q = 0.00230 A0.91 P2.30 | Q = 0.00045 A0.93 P2.50 | Q = 0.00170 A0.83 P2.03 |
| Aug | Q = 0.00778 A0.93 P1.52 | Q = 0.00030 A0.94 P2.44 | Q = 0.00355 A0.85 P1.59 |
| Sep | Q = 0.47599 A0.94 | Q = 0.37094 A0.91 | Q = 0.51357 A0.74 |
| Oct | Q = 0.41879 A0.95 | Q = 0.25281 A0.96 | Q = 0.26110 A0.91 |
| Nov | Q = 0.30917 A0.97 | Q = 0.17159 A1.01 | Q = 0.19235 A0.96 |
| Dec | Q = 0.22141 A1.01 | Q = 0.17080 A0.99 | Q = 0.15389 A0.97 |
| Runoff in Wind River Basin above Owl Creek Confluence (including Owl Creek) (USGS, 1994) |
| Jan | Q = 0.20100 A1.05 P1.57 S-0.70 | Q = 0.16000 A1.07 P1.65 S-0.77 | Q = 0.49300 A1.15 P1.70 S-1.07 |
| Feb | Q = 0.31800 A1.07 P1.55 S-0.78 | Q = 0.58500 A1.23 P1.26 R-0.74 | Q = 0.31600 A1.31 P1.36 R-0.80 |
| Mar | Q = 1.52000 A1.18 P1.13 R-0.73 | Q = 1.02000 A1.26 P1.17 R-0.78 | Q = 1.24000 A1.34 P1.07 R-0.85 |
| Apr | Q = 15.5000 A1.15 P1.25 R-0.89 | Q = 19.7000 A1.26 P0.93 R-0.95 | Q = 8.62000 A1.30 P0.80 R-0.89 |
| May | Q = 0.92500 A0.86 P2.54 R-0.69 | Q = 0.29100 A0.88 P2.72 R-0.69 | Q = 0.02380 A0.85 P3.03 R-0.57 |
| Jun | Q = 0.00451 A0.66 P2.87 | Q = 0.00042 A0.71 P3.41 | Q = 0.00010 A0.85 P3.54 E3.11 |
| Jul | Q = 0.00314 A0.94 P2.46 E3.79 | Q = 0.00042 A0.95 P2.90 E4.65 | Q = 0.00027 A1.03 P2.66 E6.08 |
| Aug | Q = 0.00126 A0.99 P2.34 E5.49 | Q = 0.00044 A1.02 P2.45 E5.29 | Q = 0.00003 A1.19 P2.88 E6.06 |
| Sep | Q = 0.00138 A1.00 P2.09 E3.62 | Q = 0.00045 A1.04 P2.21 E3.04 | Q = 0.00008 A1.09 P2.53 E3.16 |
| Oct | Q = 0.00081 A0.97 P2.14 | Q = 0.00073 A0.96 P2.02 | Q = 0.00033 A1.01 P2.04 |
| Nov | Q = 0.00223 A0.97 P1.68 | Q = 0.00201 A0.96 P1.60 | Q = 0.00139 A1.01 P1.48 |
| Dec | Q = 0.00258 A0.95 P1.56 | Q = 0.00124 A0.96 P1.67 | Q = 0.00068 A1.06 P1.56 |
| Notes: |
|
|
| (1) |
Q - Mean Monthly Discharge (cfs) | S - Basin Slope (feet/mile) | | A - Drainage Basin Area (sq. mi.) | R - Maximum Basin Relief (feet/10000 feet) | | P - Mean Annual Precipitation (in) | E – Mean Basin Elevation |
5.1 Madison/Gallatin River Basin
No natural flow nodes were needed for the Madison/Gallatin River Basin.
5.2 Yellowstone River Basin
No natural flow nodes were needed for the Yellowstone River Basin.
5.3 Clarks Fork River Basin
Several natural flow nodes were required in the Clarks Fork River Basin. Because all basins originate in the Absaroka Range, the Absaroka equation set was used for the calculations. Basin data is shown in Table 5-2.
Table 5-2. Natural Flow Data for the Clarks Fork River Basin
Sub-
Basin | Site Name | Location | Area
(sq.mi.) |
Precipitation
(in) | Slope
(ft/mile) | Relief
(ft) | Mean Elev.
(feet) |
| Clarks Fork Yellowstone | Bars Creek - Natural Flow | Absaroka | 2.2 | 25.8 | 1,596 |
3,717 | 9,266 |
| Bennett Creek – Natural Flow | Absaroka | 14.1 | 30.6 | 1,801 | 5,348 | 9,022 |
| Camp Creek – Natural Flow | Absaroka | 2.5 | 26.7 | 1,425 | 2,510 | 7,743 |
| Deadman Creek - Natural Flow | Absaroka | 1.6 | 25.5 | 1,165 | 1,791 | 7,643 |
| Dutch Charlie Creek - Natural Flow | Absaroka | 1.3 | 27.2 | 1,502 | 3,330 | 9,313 |
| Elk Creek – Natural Flow | Absaroka | 12.1 | 27.0 | 2,017 | 3,734 | 8,113 |
| Gravel Bar Creek – Natural Flow | Absaroka | 12.1 | 35.4 | 2,779 | 4,898 | 9,130 |
| Huff Creek – Native Flow | Absaroka | 4.6 | 32.8 | 2,100 | 3,583 | 8,247 |
| Line Creek – Natural Flow | Absaroka | 2.5 | 26.0 | 1,730 | 4,278 | 7,174 |
| Little Rocky Creek - Natural Flow | Absaroka | 43.5 | 32.4 | 1,725 | 5,987 | 9,163 |
| Luce Reservoir - Natural Flow | Absaroka | 1.5 | 10.3 | 1,040 | 902 | 5,069 |
| Natural Springs - Natural Flow | Absaroka | 0.4 | 29.9 | 2,465 | 2,910 | 8,009 |
| New Meyer Creek - Natural Flow | Absaroka | 7.2 | 12.9 | 1,709 | 3,881 | 6,444 |
| Paint Creek – Natural Flow | Absaroka | 8.8 | 18.6 | 1,189 | 3,169 | 7,247 |
| Pat O'Hare Creek - Natural Flow | Absaroka | 34.6 | 18.3 | 1,844 | 4,800 | 7,205 |
| Sunlight Creek - Natural Flow | Absaroka | 47.1 | 41.3 | 2,938 | 4,524 | 9,158 |
5.4 Wind River Basin
The USGS equation set was used for all drainages in the Wind River basin. As previously stated, mean annual basin precipitation calculated from the PRISM coverage produced monthly discharges
that were significantly higher than those estimated in the original USGS study, especially in the more mountainous regions and in the high runoff months. Therefore, mean annual basin
precipitation was taken directly from the USGS report for those drainages that were studied in the report. For those that were not shown in the report and were contained in the more mountainous
areas, precipitation was taken from either nearby, similar basins or estimated from Plate 1b of the Lowham report. For those not within the more mountainous areas of the Wind River range, the
PRISM coverage values were used (in the non-mountainous area, values seemed to be more in agreement). Basin characteristics are shown in Table 5-3.
Table 5-3. Natural Flow Data for the Wind River Basin
Sub-
Basin | Site Name | Location | Area
(sq.mi.) |
Precipitation
(in) | Slope
(ft/mile) | Relief
(ft) | Mean Elev.
(feet) |
| Upper Wind | Alkali Creek – Natural Flow | Wind | 8.3 | 20.0 | 1,082 |
2,126 | 8,476 |
| Bear Creek – Natural Flow | Wind | 61.9 | 23.0 | 1,665 |
5,089 | 9,222 |
| Bob Creek – Natural Flow | Wind | 23.4 | 17.0 | 1,355 |
5,541 | 9,947 |
| Dry Creek – Natural Flow | Wind | 52.3 | 22.0 | 1,562 |
6,627 | 10,284 | | East DuNoir Creek - Natural Flow | Wind | 26.9 | 22.0 |
1,882 | 4,035 | 9,596 |
| East Fork Wind River - Natural Flow | Wind | 52.0 |
20.0 | 1,881 | 4,196 | 9,893 |
| Fivemile Creek – Natural Flow | Wind |
4.1 | 17.0 | 1,089 | 2,733 | 9,037 | | Geyser Creek - Natural Flow |
Wind | 5.3 | 22.0 | 1,192 | 2,897 | 9,054 |
| Horse Creek – Natural Flow | Wind | 70.5 | 15.0 | 1,804 | 4,472 | 9,389 |
| Jakeys Fork – Natural Flow | Wind | 47.9 | 23.0 | 1,379 | 5,259 | 9,984 |
| Little Dry Creek Natural Flow | Wind | 15.8 | 22.0 | 1,421 | 5,098 | 8,688 |
| Little Horse Creek - Natural Flow | Wind | 12.4 | 15.0 | 1,003 | 2,326 | 8,274 |
| Little Warms Springs Ck - Natural Flow | Wind | 12.8 | 19.0 | 1,135 | 3,720 | 9,096 |
| Meadow Creek – Natural Flow | Wind | 8.8 | 17.0 | 1,581 | 3,645 | 8,068 |
| Meadow Creek - Natural Flow | Wind | 8.1 | 20.0 | 1,421 | 3,484 | 8,902 |
| Red Creek – Natural Flow | Wind | 14.5 | 16.0 | 1,666 | 5,223 | 8,855 |
| Red Creek - Natural Flow | Wind | 0.1 | 12.4 | 1,140 | 374 | 7,465 |
| Sixmile Creek - Natural Flow | Wind | 13.6 | 18.0 | 1,682 | 4,203 | 9,545 |
| Torrey Creek - Natural Flow | Wind | 52.7 | 21.0 | 2,065 | 5,909 | 10,257 |
| Warm Springs Creek - Natural Flow | Wind | 74.4 | 22.0 | 902 | 3,320 | 9,091 |
| West DuNoir Creek - Natural Flow | Wind | 28.1 | 22.0 | 1,328 | 3,845 | 9,260 |
| West Fork Dry Pasup Ck - Natural Flow | Wind | 20.5 | 19.5 | 1,665 | 4,423 | 8,999 |
| Wiggins Fork - Natural Flow | Wind | 204.0 | 20.0 | 2,223 | 5,646 | 9,548 |
| Willow Branch Creek - Natural Flow | Wind | 4.8 | 17.0 | 1,068 | 2,972 | 9,001 |
| Wind River - Natural Flow | Wind | 102.6 | 20.0 | 928 | 3,960 | 8,624 |
| Little Wind | Beaver Creek - Natural Flow | Wind | 78.1 | 18.1 | 777 | 3,091 |
7,329 |
| Crooked Creek - Natural Flow | Wind | 12.1 | 15.0 | 1,587 | 3,934 | 7,914 |
| Mill Creek - Natural Flow | Wind | 10.1 | 14.0 | 1,002 | 2,890 | 6,469 |
| Norkok Creek - Natural Flow | Wind | 7.4 | 13.0 | 544 | 932 | 6,093 |
| North Fork Sage Creek - Natural Flow | Wind | 25.2 | 13.0 | 1,506 | 5,049 | 8,559 |
| Pevah Creek - Natural Flow | Wind | 6.2 | 13.0 | 1,281 | 3,232 | 7,561 |
| South Fork Sage Creek - Natural Flow | Wind | 14.5 | 13.0 | 1,538 | 4,406 | 8,284 |
| Spring Creek - Natural Flow | Wind | 2.0 | 15.0 | 760 | 1,565 | 6,157 |
| Lower Wind | Bargee Creek - Natural Flow | Wind | 8.8 | 14.6 | 1,209 | 3,195 | 7,633 |
| Dry Cottonwood Creek - Natural Flow | Wind | 2.4 | 13.1 | 1,282 | 1,867 | 7,257 |
| Dry Muddy Creek - Natural Flow | Wind | 27.8 | 17.2 | 1,339 | 4,797 | 8,450 |
| East Fork Sheep Creek - Natural Flow | Wind | 2.9 | 16.5 | 1,421 | 1,775 | 8,404 |
| Five Mile Creek - Natural Flow | Wind | 4.6 | 10.6 | 405 | 820 | 6,313 |
| Gill Meadows - Natural Flow | Wind | 0.3 | 9.2 | 2,159 | 1,594 | 6,037 |
| Holland Creek – Natural Flow | Wind | 2.1 | 13.6 | 1,632 | 3,205 | 7,960 |
| Ingalls Creek - Natural Flow (Spring) | Wind | 0.2 | 11.8 | 1,441 | 1,175 | 6,086 |
| McKee Grave Creek - Natural Flow | Wind | 5.4 | 15.3 | 1,437 | 3,035 | 7,852 |
| Mexican Draw - Natural Flow | Wind | 2.1 | 11.6 | 1,211 | 1,818 | 6,176 |
| Morrison Canyon - Natural Flow | Wind | 3.7 | 12.1 | 1,738 | 1,916 | 6,655 |
| Morrison Meadows – Nat Flow (Spring) | Wind | 0.0 | 9.2 | 1,595 | 184 | 5,214 |
| Sagwup Creek - Natural Flow | Wind | 22.7 | 14.1 | 1,047 | 2,244 | 7,302 |
| Shotgun Creek – Natural Flow | Wind | 5.4 | 15.8 | 1,366 | 3,048 | 8,032 |
| Stagner Creek - Natural Flow | Wind | 2.3 | 11.3 | 1,586 | 1,962 | 6,452 |
| Warm Springs Creek - Natural Flow | Wind | 1.4 | 12.6 | 1,554 | 2,379 | 7,450 |
| West Fork Sheep Creek - Natural Flow | Wind | 6.3 | 15.6 | 1,523 | 2,769 | 8,042 |
| Wood Road Canyon - Natural Flow | Wind | 1.2 | 11.6 | 1,698 | 2,005 | 6,536 |
| Badwater | Alkali Creek - Natural Flow | Wind | 9.9 | 9.9 | 167 | 335 | 6,085 |
| Badwater Creek - Natural Flow | Wind | 19.4 | 19.4 | 982 | 3,320 | 7,242 |
| East Bridger Creek - Natural Flow | Wind | 15.9 | 15.9 | 776 | 1,027 | 6,260 |
| E-K Creek - Natural Flow | Wind | 10.9 | 10.9 | 465 | 299 | 6,373 |
| Lysite Creek - Natural Flow | Wind | 16.9 | 16.9 | 747 | 1,312 | 6,660 |
| Meadow Creek - Natural Flow | Wind | 19.4 | 19.4 | 645 | 617 | 6,829 |
| West Bridger Creek - Natural Flow | Wind | 16.6 | 16.6 | 1,092 | 2,595 | 6,532 |
| West Fork Dry Creek - Natural Flow | Wind | 15.7 | 15.7 | 1,530 | 2,572 | 7,178 |
5.5 Bighorn River Basin
Natural flow drainages in the Bighorn River Basin originate in the Owl Creek range, the Absaroka Range, the Bighorn Range and on the high plains within the basin. For those that
originate in the Owl Creek range and the high plains, the USGS equation set was used. This was done for two reasons:
When the USGS equations were developed, flow stations from the Owl Creek range were used in their development. Therefore, they can be considered valid for those areas that
were used in their development;
- Of the three equation sets, the USGS equations for the Wind River basin most closely estimate runoff in the high plains.
Because the PRISM data and the Plate 1b data are more closely correlated in the Owl Creek range, the mean annual basin precipitation calculated from the PRISM data was used in the
entire basin. Drainage basin characteristics for the Owl Creek basin are shown in Table 5-4.
Table 5-4. Natural Flow Data for the Bighorn River Basin
Sub-
Basin | Site Name | Location |
Area
(sq.mi.) | Precipitation
(in) | Slope
(ft/mile) |
Relief
(ft) | Mean Elev.
(feet) |
| Upper Bighorn | Adobe Creek - Natural Flow | Wind | 6.4 | 6.9 |
165 | 489 | 4,081 |
| Carney Creek Natural Flow | Wind | 1.8 | 15.2 | 1,512 | 3,543 | 7,926 |
| Cottonwood Creek - Natural Flow | Wind | 34.8 | 17.0 | 1,488 | 4,285 | 8,121 |
| Dry Cottonwood Creek - Natural Flow | Wind | 5.3 | 16.7 | 1,245 | 2,372 | 8,435 |
| Enos Creek - Natural Flow | Wind | 23.8 | 14.4 | 1,378 | 2,904 | 6,920 |
| Goat Creek Natural Flow | Wind | 3.3 | 14.4 | 1,326 | 3,517 | 7,462 |
| Gooseberry Creek - Natural Flow | Wind | 57.6 | 16.9 | 1,426 | 4,255 | 7,539 |
| Grass Creek - Natural Flow | Wind | 11.6 | 14.5 | 1,195 | 1,972 | 7,028 |
| Hamilton Dome Well - Natural Flow | Wind | 2.7 | 11.0 | 600 | 751 | 5,668 |
| Kirby Creek Natural Flow | Wind | 194.4 | 13.2 | 741 | 3,540 | 5,143 |
| Lake Creek Natural Flow | Wind | 4.5 | 15.7 | 1,350 | 1,348 | 7,854 |
| Little Grass Creek Natural Flow | Wind | 32.2 | 16.2 | 1,396 | 2,792 | 7,469 |
| Mayfield Wells - Natural Flow | Wind | 24.3 | 11.5 | 1,172 | 1,916 | 6,164 |
| McCumber Spring Natural Flow | Wind | 0.5 | 12.2 | 404 | 377 | 4,771 |
| Middle Fork Mud Creek - Natural Flow | Wind | 10.4 | 13.9 | 1,231 | 3,150 | 6,854 |
| Mud Creek - Natural Flow | Wind | 26.6 | 14.4 | 1,263 | 3,907 | 6,917 |
| Natural Flow Node | Wind | 0.1 | 11.9 | 83 | 62 | 5,554 |
| Natural Flow Node | Wind | 5.1 | 10.8 | 201 | 525 | 4,806 |
| North Fork Owl Creek - Natural Flow | Wind | 17.9 | 18.1 | 1,796 | 4,475 | 9,106 |
| Red Canyon Creek - Natural Flow | Wind | 87.6 | 11.7 | 877 | 3,310 | 6,005 |
| Red Creek Natural Flow | Wind | 14.5 | 15.8 | 1,302 | 3,845 | 7,717 |
| Sixmile Creek Natural Flow | Wind | 6.7 | 7.3 | 251 | 394 | 4,275 |
| South Fork Mud Creek Natural Flow | Wind | 12.9 | 13.5 | 1,148 | 3,304 | 6,718 |
| Spring Draw Natural Flow | Wind | 15.5 | 11.5 | 717 | 1,594 | 5,473 |
| Unnamed Creek Natural Flow | Wind | 2.6 | 7.3 | 241 | 344 | 4,274 |
| Un-named River - Natural Flow | Wind | 6.6 | 11.1 | 451 | 1,122 | 5,193 |
| Whitney Spring Natural Flow | Wind | 3.3 | 11.7 | 1,181 | 1,214 | 5,896 |
| Nowood | Bear Creek - Natural Flow | Wind | 11.9 | 18.3 | 1,048 |
3,104 | 7,053 |
| Beth Wells - Natural Flow | Wind | 0.1 | 10.9 | 425 | 190 | 4,565 |
| Box Elder Creek - Natural Flow | Wind | 24.8 | 15.9 | 1,177 | 3,468 | 6,422 |
| Brokenback Creek - Natural Flow | Wind | 17.2 | 20.4 | 1,263 | 3,937 | 6,862 |
| Buffalo Flat Creek - Natural Flow | Wind | 21.3 | 14.4 | 852 | 1,939 | 5,268 |
| Crooked Creek - Natural Flow | Wind | 7.5 | 16.7 | 963 | 1,919 | 6,142 |
| Deep Creek - Natural Flow | Wind | 66.4 | 20.9 | 1,063 | 3,966 | 7,473 |
| Gomer Well #1- Natural Flow | Wind | 0.3 | 9.4 | 472 | 272 | 4,547 |
| Gomer Well #2- Natural Flow | Wind | 0.8 | 10.1 | 669 | 538 | 4,696 |
| Green Beret Wells - Natural Flow | Wind | 24.0 | 20.5 | 1,160 | 4,728 | 7,089 |
| Hamilton and Walters Wells - Natural Flow | Wind | 25.2 | 15.2 | 986 | 2,516 | 5,568 | | Little Canyon Creek - Natural Flow | Wind | 16.0 | 18.6 | 1,271 | 2,638 | 6,769 | | Lone Tree Creek - Natural Flow | Wind | 9.5 | 15.9 | 829 | 2,051 | 6,711 | | Medicine Lodge Creek - Natural Flow | Wind | 45.5 | 22.1 | 1,260 | 5,968 | 7,727 | | North Fork Spring Creek - Natural Flow | Wind | 6.1 | 17.4 | 1,059 | 2,290 | 6,016 |
| Nowood River - Natural Flow | Wind | 36.4 | 16.6 | 755 | 1,857 | 6,539 |
| Otter Creek - Natural Flow | Wind | 46.4 | 20.0 | 1,199 | 3,720 | 7,098 |
| Red Bank Creek - Natural Flow | Wind | 23.9 | 15.8 | 1,032 | 3,048 | 6,543 |
| South Fork Little Canyon Creek - Natural Flow | Wind | 0.4 | 13.5 | 520 | 262 | 5,371 | | South Fork Otter Creek - Natural Flow | Wind | 36.5 | 19.4 | 916 | 3,487 | 6,695 | | Spring Creek - Natural Flow | Wind | 26.3 | 19.0 | 1,043 | 3,501 | 6,916 | | Taylor #2 Well - Natural Flow | Wind | 0.1 | 13.9 | 560 | 430 | 5,131 | | Ten Sleep Creek - Natural Flow | Wind | 35.6 | 27.2 | 1,045 | 3,812 | 9,800 | | Unnamed Creek Natural Flow | Wind | 0.1 | 10.9 | 698 | 285 |
4,561 | | West Fork Tensleep Creek Natural Flow | Wind | 50.5 | 29.6 | 1,261 |
4,423 | 9,950 |
| Greybull | Dick Creek Natural Flow | Absaroka | 12.1 | 20.4 | 2,074 |
3,714 | 8,532 |
| Dorsey Creek Natural Flow | Absaroka | 23.9 | 7.8 |
445 | 1,243 | 4,397 |
| Dry Creek Natural Flow | Absaroka | 381.1 |
10.0 | 383 | 2,815 | 5,121 |
| Four Bear Creek - Natural Flow | Absaroka | 8.6 | 22.9 | 978 | 4,318 | 8,564 |
| Francs Fork - Natural Flow | Absaroka | 40.5 | 24.3 | 2,134 | 6,109 | 9,606 |
| Greybull River - Natural Flow | Absaroka | 191.9 | 24.5 | 2,136 | 5,974 | 9,909 |
| Iron Creek - Natural Flow | Absaroka | 12.9 | 14.1 | 1,191 | 1,339 | 6,556 |
| Little Rawhide Creek - Natural Flow | Absaroka | 2.1 | 28.6 | 1,290 | 2,152 | 10,069 |
| Long Hollow Creek Natural Flow | Absaroka | 3.6 | 14.8 | 555 | 869 | 6,694 |
| Meeteetse Creek - Natural Flow | Absaroka | 13.6 | 28.9 | 1,715 | 3,248 | 10,057 |
| North Fork Dick Creek Natural Flow | Absaroka | 3.0 | 18.4 | 1,338 | 1,854 | 7,892 |
| Pappapau Creek - Natural Flow | Absaroka | 19.8 | 16.4 | 887 | 2,717 | 7,007 |
| Pickett Creek - Natural Flow | Absaroka | 2.8 | 20.0 | 1,034 | 3,110 | 8,077 |
| Rawhide Creek - Natural Flow | Absaroka | 4.7 | 27.5 | 1,406 | 3,245 | 9,937 |
| Roach Gulch Natural Flow | Absaroka | 1.2 | 9.7 | 697 | 417 | 5,055 |
| Rock Creek - Natural Flow | Absaroka | 28.1 | 25.6 | 1,756 | 5,138 | 9,567 |
South Fork Meeteetse Creek - Natural Flow | Absaroka | 6.4 | 20.8 | 905 | 2,297 | 7,586 |
| Spring Creek - Natural Flow | Absaroka | 9.1 | 19.2 | 823 | 4,160 | 7,497 |
| Sunshine Creek Natural Flow | Absaroka | 10.0 | 15.8 | 668 | 1,348 | 6,828 |
| Timber Creek - Natural Flow | Absaroka | 7.2 | 23.9 | 2,287 | 3,402 | 8,794 |
| Wardell Reservoir Natural Flow | Absaroka | 0.4 | 7.8 | 116 | 102 | 4,309 |
| Wilcox Draw - Natural Flow | Absaroka | 1.6 | 14.3 | 539 | 538 | 6,415 |
| Willow Creek Natural Flow | Absaroka | 29.2 | 9.7 | 779 | 1,775 | 5,009 |
| Big Horn Lake | Adelaide Creek Natural Flow | Bighorn | 2.8 | 30.9 | 878 |
1,325 | 9,679 |
| Bear Creek - Natural Flow | Bighorn | 6.9 | 24.4 | 1,688 | 4,767 | 7,439 |
| Beaver Creek - Natural Flow | Bighorn | 13.9 | 29.6 | 1,775 | 4,114 | 8,356 |
| Cedar Creek - Natural Flow | Bighorn | 2.8 | 29.6 | 2,037 | 3,278 | 8,479 |
| Crooked Creek Natural Flow | Bighorn | 0.3 | 7.1 | 810 | 440 | 4,273 |
| Crystal Creek - Natural Flow | Bighorn | 20.0 | 12.3 | 809 | 3,471 | 4,722 |
| Fire Spring Creek - Natural Flow | Bighorn | 20.5 | 21.1 | 1,416 | 6,060 | 6,513 |
| Gypsum Creek Natural Flow | Bighorn | 0.1 | 7.5 | 879 | 239 | 4,552 |
| Horse Creek - Natural Flow | Bighorn | 13.1 | 27.7 | 1,851 | 4,928 | 8,445 |
| Red Canyon Natural Flow | Bighorn | 15.0 | 24.3 | 1,657 | 5,230 | 7,537 |
| Roundup/Harmon Spring Natural Flow | Bighorn | 0.1 | 10.0 | 719 | 279 | 4,142 |
| South Fork Beaver Creek - Natural Flow | Bighorn | 5.0 | 31.6 | 1,915 | 3,366 | 8,856 |
| Sykes Spring Natural Flow | Bighorn | 0.3 | 7.6 | 857 | 479 | 4,036 |
| Trapper Creek - Natural Flow | Bighorn | 57.1 | 22.1 | 1,448 | 6,073 | 7,564 |
| White Creek - Natural Flow | Bighorn | 26.8 | 22.7 | 1,371 | 4,380 | 7,914 |
| Shoshone | Aldrich Creek - Natural Flow | Absaroka | 10.3 | 27.4 | 2,720 |
5,915 | 9,002 |
| Alkali Creek - Natural Flow | Absaroka | 10.8 | 9.3 | 104 | 617 | 4,857 |
| Ashworth Creek - Natural Flow | Absaroka | 1.3 | 18.4 | 848 | 1,273 | 6,753 |
| Belknap Creek - Natural Flow | Absaroka | 9.7 | 25.2 | 1,656 | 5,131 | 8,328 |
| Big Creek - Natural Flow | Absaroka | 16.4 | 33.1 | 2,895 | 5,449 | 9,609 |
| Bitter Creek Natural Flow | Absaroka | 76.9 | 7.7 | 191 | 1,056 | 4,524 |
| Black Draw Natural Flow | Absaroka | 0.6 | 7.1 | 267 | 164 | 3,956 |
| Bob Cat Creek - Natural Flow | Absaroka | 13.6 | 29.3 | 2,613 | 5,633 | 9,298 |
| Boulder Creek - Natural Flow | Absaroka | 41.7 | 26.5 | 2,471 | 5,823 | 9,616 |
| Breteche Creek Natural Flow | Absaroka | 5.3 | 21.5 | 1,738 | 3,054 | 7,547 |
| Bull Creek - Natural Flow | Absaroka | 6.8 | 23.2 | 1,339 | 4,616 | 8,036 |
| Canyon Creek - Natural Flow | Absaroka | 6.5 | 30.3 | 2,898 | 5,577 | 8,688 |
| Carter Creek - Natural Flow | Absaroka | 9.3 | 21.9 | 1,467 | 4,675 | 7,752 |
| Cottonwood Creek - Natural Flow | Absaroka | 5.0 | 12.6 | 923 | 981 | 6,358 |
| Crane Creek - Natural Flow | Absaroka | 2.2 | 22.6 | 2,933 | 4,632 | 8,734 |
| Deer Creek - Natural Flow | Absaroka | 18.8 | 33.0 | 3,061 | 5,062 | 9,572 |
| Derry Drain Natural Flow | Absaroka | 16.3 | 7.6 | 563 | 1,565 | 4,519 |
| Elk Fork Creek Natural Flow | Absaroka | 107.5 | 29.5 | 2,623 | 6,161 | 8,859 |
| Green Creek - Natural Flow | Absaroka | 6.5 | 26.8 | 2,288 | 5,315 | 8,099 |
| Hard Pan Creek - Natural Flow | Absaroka | 19.2 | 28.3 | 2,375 | 5,758 | 9,192 |
| Hunter Creek - Natural Flow | Absaroka | 0.6 | 15.0 | 3,220 | 3,104 | 8,471 |
| Ishawooa Creek - Natural Flow | Absaroka | 65.7 | 31.9 | 2,767 | 5,659 | 9,166 |
| Jim Creek - Natural Flow | Absaroka | 5.6 | 16.5 | 1,602 | 4,501 | 8,068 |
| Jordan Creek - Natural Flow | Absaroka | 5.1 | 20.6 | 1,686 | 3,107 | 7,577 |
| Legg Creek - Natural Flow | Absaroka | 3.1 | 27.3 | 1,884 | 3,839 | 9,632 |
| Little Sand Draw - Natural Flow | Absaroka | 4.2 | 7.5 | 362 | 1,381 | 3,957 |
| Marquette Creek Natural Flow | Absaroka | 10.0 | 19.2 | 1,195 | 5,095 | 7,330 |
| North Branch Alkali Creek Natural Flow | Absaroka | 0.7 | 9.0 | 146 | 171 | 4,821 |
| North Fork Shoshone River -Natural Flow | Absaroka | 56.0 | 41.6 | 2,328 | 5,049 | 9,096 |
| Rand Creek - Natural Flow | Absaroka | 3.3 | 21.8 | 1,601 | 3,136 | 7,580 |
| Rattlesnake Creek - Natural Flow | Absaroka | 3.1 | 27.2 | 1,766 | 2,241 | 8,431 |
| Rock Creek - Natural Flow | Absaroka | 24.8 | 26.5 | 2,067 | 5,823 | 8,733 |
| Sage Creek - Natural Flow | Absaroka | 6.5 | 21.4 | 1,189 | 4,682 | 7,474 |
| Sand Creek Natural Flow | Absaroka | 26.8 | 7.2 | 315 | 715 | 4,335 |
| SF Shoshone Tributary Natural Flow | Absaroka | 1.0 | 20.3 | 2,550 | 2,799 | 8,042 |
| South Fork Sage Creek Natural Flow | Absaroka | 0.0 | 28.4 | 2,934 | 883 | 9,883 |
| South Fork Shoshone River - Natural Flow | Absaroka | 213.9 | 30.4 | 2,854 | 3,625 |
10,492 |
| Spring Creek - Natural Flow | Absaroka | 0.9 | 21.1 | 3,458 | 3,711 | 8,280 |
| Trail Creek - Natural Flow | Absaroka | 4.8 | 15.8 | 1,577 | 2,195 | 7,399 |
| Trout Creek - Natural Flow | Absaroka | 47.1 | 22.8 | 1,907 | 6,539 | 8,258 |
| Unnamed Creek Natural Flow | Absaroka | 1.0 | 16.8 | 2,250 | 1,594 | 7,018 |
| Whit Creek - Natural Flow | Absaroka | 10.6 | 24.5 | 1,230 | 3,829 | 8,015 |
Section 6 - Hydrologic Year Classification
Once the study period is selected, the monthly data is further reduced into average data for dry, average and wet hydrologic year classifications. To determine which years within the
period-of-record fall into which hydrologic year classifications, index gages were selected within each of the hydrologic units. These gages were selected based upon their period-of-record
and their lack of influence by diversion and return flows. Then, the hydrologic classification for the index gage was applied to the remaining gages within its influence area. The hydrologic
classifications for the Wind/Bighorn River Basin plan are consistent with the hydrologic classifications for the other river basin plans and with the guidelines. A summary of the classification
methodology is shown in Table 6-1, while a summary of the hydrologic year classification for each index gage are shown in
Table 6-2.
Table 6-1. Hydrologic Classification Methodology
| Dry | Average | Wet |
| Percent of Years | Driest 20 percent | Middle 60 percent | Wettest 20 percent | | Number of Years in 29-year
Study Period | 6 | 17 | 6 |
Table 6-2. Summary of Hydrologic Classifications for Study Area
| Basin | USGS
Gage No | Gage ID | 1970 |
1980 | 1990 | 2000 |
| 3 | 4 | 5 | 6 | 7 | 8 | 9 | 0 | 1 | 2 | 3 | 4 | 5 | 6 | 7 | 8 | 9 | 0 | 1 |
2 | 3 | 4 | 5 | 6 | 7 | 8 | 9 | 0 | 1 |
Mad./Gal.,
Yell., Ck.
Fk. | 06037500 | Madison Near West Yellowstone |
|
|
|
|
|
|
|
|
|
|
|
|
|
|
|
|
|
|
|
|
|
|
|
|
|
|
|
|
|
| 06191500 | Yellowstone At Corwin Springs |
|
|
|
|
|
|
|
|
|
|
|
|
|
|
|
|
|
|
|
|
|
|
|
|
|
|
|
|
|
| 06205500 | Clarks Fk Ab Squaw Ck |
|
|
|
|
|
|
|
|
|
|
|
|
|
|
|
|
|
|
|
|
|
|
|
|
|
|
|
|
|
| Wind |
06222700 | Crow C Nr Tipperary Wyo |
|
|
|
|
|
|
|
|
|
|
|
|
|
|
|
|
|
|
|
|
|
|
|
|
|
|
|
|
|
| 06224000 | Bull Lake Creek Above Bull Lake |
|
|
|
|
|
|
|
|
|
|
|
|
|
|
|
|
|
|
|
|
|
|
|
|
|
|
|
|
|
| 06228350 | SF Little Wind Ab Washakie Res |
|
|
|
|
|
|
|
|
|
|
|
|
|
|
|
|
|
|
|
|
|
|
|
|
|
|
|
|
|
| Bighorn | 06260000 | South Fork Owl Ck Near Anchor |
|
|
|
|
|
|
|
|
|
|
|
|
|
|
|
|
|
|
|
|
|
|
|
|
|
|
|
|
|
| 06270000 | Nowood River Near Tensleep |
|
|
|
|
|
|
|
|
|
|
|
|
|
|
|
|
|
|
|
|
|
|
|
|
|
|
|
|
|
| 06275000 | Wood River At Sunshine |
|
|
|
|
|
|
|
|
|
|
|
|
|
|
|
|
|
|
|
|
|
|
|
|
|
|
|
|
|
| 06278500 | Shell Creek Near Shell |
|
|
|
|
|
|
|
|
|
|
|
|
|
|
|
|
|
|
|
|
|
|
|
|
|
|
|
|
|
| 06280300 | SF Shoshone River Near Valley |
|
|
|
|
|
|
|
|
|
|
|
|
|
|
|
|
|
|
|
|
|
|
|
|
|
|
|
|
|
| Notes: |
| (1) | Hydrologic Year Classification | | - Wet Year (Wettest 20 percent of years) |
|
| | - Average (Middle 60 percent of years) |
|
| | - Dry Year (Driest 20 percent of years) |
6.1 Madison/Gallatin River Basins
Both the Madison River near West Yellowstone gage and the Gallatin River gage contain adequate data to classify hydrologic years. However, since the primary gages that need to be classified
in the model are Madison River tributaries, the Madison River near West Yellowstone gage (06037500) has been selected for the analysis. A summary of the annual classifications is shown in Table 6-3.
Table 6-3. Annual Summary of Hydrologic Classification for Madison/Gallatin River Basin
Hyd.
Class | Rank | Exceedance
Probability | Mad_WstY
6037500 |
| Year | ac-ft |
| Dry |
1 | 97% | 1992 | 319,163 |
| 2 | 93% | 1990 | 319,857 |
| 3 | 90% | 1988 | 320,343 |
| 4 | 87% | 1989 | 323,876 |
| 5 | 83% | 1987 | 325,576 |
| 6 | 80% | 2001 | 325,718 |
| Average | 7 | 77% | 1977 | 334,959 |
| 8 | 73% | 1994 | 337,320 |
| 9 | 70% | 1991 | 349,560 |
| 10 | 67% | 1980 | 353,507 |
| 11 | 63% | 1973 | 353,846 |
| 12 | 60% | 1979 | 357,054 |
| 13 | 57% | 1983 | 359,521 |
| 14 | 53% | 1981 | 359,964 |
| 15 | 50% | 1985 | 370,089 |
| 16 | 47% | 2000 | 372,904 |
| 17 | 43% | 1993 | 372,938 |
| 18 | 40% | 1975 | 375,209 |
| 19 | 37% | 1978 | 378,618 |
| 20 | 33% | 1984 | 385,759 |
| 21 | 30% | 1982 | 394,155 |
| 22 | 27% | 1976 | 394,727 |
| 23 | 23% | 1995 | 399,487 |
| Wet | 24 | 20% | 1974 | 403,342 |
| 25 | 17% | 1986 | 445,688 |
| 26 | 13% | 1999 | 464,538 |
| 27 | 10% | 1998 | 468,532 |
| 28 | 7% | 1996 | 485,023 |
| 29 | 3% | 1997 | 571,071 |
6.2 Yellowstone River Basin
There are three gages within the Yellowstone model that would be adequate for hydrological classification: the Yellowstone River at the Yellowstone Lake Outlet
(06186500), Gardner River near Mammoth (06190500) and the Yellowstone River at Corwin Springs (06191500). The first two gages, respectively, have short periods
where data would need to be filled. In addition, the annual flow variation at the Yellowstone Lake Outlet gage is small and may not provide a good measure of
hydrologic variability throughout the entire basin. Therefore, the Corwin Springs gage was selected as the index gage for the entire basin. A summary of the annual
classification is shown in Table 6-4.
Table 6-4. Annual Summary of Hydrologic Classification for Yellowstone River Basin
Hyd.
Class | Rank |
Exceedance
Probability | YI_CSp
6191500 |
| Year | ac-ft |
| Dry | 1 | 97% | 1988 | 1,432,264 |
| 2 | 93% | 1977 | 1,465,559 |
| 3 | 90% | 2001 | 1,469,775 |
| 4 | 87% | 1987 | 1,515,455 |
| 5 | 83% | 1994 | 1,739,690 |
| 6 | 80% | 1980 | 1,896,240 |
| Average | 7 | 77% | 1985 | 1,950,495 |
| 8 | 73% | 1979 | 1,999,467 |
| 9 | 70% | 1992 | 2,002,359 |
| 10 | 67% | 1973 | 2,008,748 |
| 11 | 63% | 1981 | 2,025,027 |
| 12 | 60% | 1989 | 2,027,794 |
| 13 | 57% | 2000 | 2,033,189 |
| 14 | 53% | 1990 | 2,165,736 |
| 15 | 50% | 1983 | 2,192,144 |
| 16 | 47% | 1991 | 2,313,669 |
| 17 | 43% | 1995 | 2,402,856 |
| 18 | 40% | 1975 | 2,452,548 |
| 19 | 37% | 1978 | 2,494,101 |
| 20 | 33% | 1993 | 2,516,278 |
| 21 | 30% | 1984 | 2,551,455 |
| 22 | 27% | 1998 | 2,558,338 |
| 23 | 23% | 1986 | 2,646,85 |
| Wet | 24 | 20% | 1982 | 2,810,473 |
| 25 | 17% | 1999 | 2,810,917 |
| 26 | 13% | 1976 | 2,835,864 |
| 27 | 10% | 1974 | 3,033,936 |
| 28 | 7% | 1996 | 3,276,792 |
| 29 | 3% | 1997 | 3,733,984 |
6.3 Clarks Fork River Basin
Although the Clarks Fork near Belfry gage contains continuous data through the period-of-record, the gage is located downstream of agricultural diversions. These
diversions have an influence on the relative flow at the gage making it unsuitable for use as an index gage in the hydrologic year classification. Two other gages
within the basin are located upstream of diversions making them more suitable for use as the index gage: the Clarks Fork Yellowstone River above Squaw Creek and
Sunlight Creek near Painter. Neither of these gages has any data in the study period. However, since the correlation coefficients used to fill the data were very
strong, the filled data should be representative of actual flows at the gage, allowing either to be used as an index gage. Because the Clarks Fork above Squaw Creek
gage is on the mainstem and contains a larger portion of flow in the basin, it was selected as an index gage. A summary of the annual classification is shown in Table 6-5.
Table 6-5. Annual Summary of Hydrologic Classification for Clarks Fork River Basin
Hyd.
Class | Rank | Exceedance
Probability |
CFk_abSqC
06205500 |
| Year | ac-ft |
| Dry | 1 | 97% | 1977 | 157,292 |
| 2 | 93% | 1988 | 162,139 |
| 3 | 90% | 2001 | 168,504 |
| 4 | 87% | 1985 | 180,960 |
| 5 | 83% | 1987 | 181,061 |
| 6 | 80% | 1994 | 191,993 |
| Average | 7 | 77% | 2000 | 239,216 |
| 8 | 73% | 1973 | 241,625 |
| 9 | 70% | 1993 | 251,384 |
| 10 | 67% | 1983 | 254,106 |
| 11 | 63% | 1990 | 254,764 |
| 12 | 60% | 1979 | 267,893 |
| 13 | 57% | 1989 | 269,858 |
| 14 | 53% | 1991 | 270,145 |
| 15 | 50% | 1992 | 278,943 |
| 16 | 47% | 1998 | 280,137 |
| 17 | 43% | 1984 | 290,709 |
| 18 | 40% | 1980 | 291,356 |
| 19 | 37% | 1981 | 301,619 |
| 20 | 33% | 1995 | 304,153 |
| 21 | 30% | 1986 | 305,178 |
| 22 | 27% | 1999 | 316,801 |
| 23 | 23% | 1982 | 325,962 |
| Wet | 24 | 20% | 1978 | 331,186 |
| 25 | 17% | 1975 | 369,678 |
| 26 | 13% | 1974 | 389,981 |
| 27 | 10% | 1976 | 401,423 |
| 28 | 7% | 1996 | 426,084 |
| 29 | 3% | 1997 | 472,436 |
6.4 Wind River Basin
Several gages within the Wind River basin contain adequate data to serve as index gages for development of hydrologic year classifications. As with previous
index gage selection, gages that are not significantly influence by diversions, storage or return flows are the most desireable gages. For the Wind River basin,
to account for differences in hydrology between sub-basins and location of gages, separate gages were selected for sites along the Wind River range in the Wind River
sub-basin and Little Wind River sub-basin, and those located along the Owl Creek range. For purposes of this analysis, the following gages were selected as index gages:
Bull Lake Creek above Bull Lake (06224000), South Fork Little Wind River above Washakie Reservoir (06228350) and Crow Creek near Tipperary (06222700). A summary of
the annual hydrologic classification for each of these gage is shown in Table 6-6.
Table 6-6. Annual Summary of Hydrologic Classification for Wind River Basin
Hyd.
Class. | Rank | Exceedance
Probability |
CrowCk_Tip
06222700 | BlCk_abLk
06224000 |
SFLW_abWRes
06228350 |
| Year | ac-ft |
Year | ac-ft |
Year | ac-ft |
| Dry | 1 | 97% | 1977 | 4,058 | 1977 |
126,271 | 2001 | 43,797 |
| 2 | 93% | 1985 | 6,297 | 2001 | 128,295 | 1977 |
51,583 |
| 3 | 90% | 1988 | 8,787 | 1992 | 132,032 |
1994 | 55,627 |
| 4 | 87% | 2001 | 9,365 | 1994 | 132,676 |
1988 | 55,774 |
| 5 | 83% | 1981 | 9,429 | 1988 | 138,843 | 1992 | 63,176 |
| 6 | 80% | 1994 | 9,678 | 1985 | 146,821 | 1985 | 73,728 |
| Average | 7 | 77% | 1973 | 10,560 | 2000 | 167,042 |
1981 | 74,239 |
| 8 | 73% | 2000 | 12,132 | 1979 |
172,414 | 2000 | 74,611 |
| 9 | 70% | 1990 | 12,263 | 1990 | 172,975 | 1979 | 76,579 |
| 10 | 67% | 1984 | 12,840 | 1981 | 182,436 | 1990 | 78,551 |
| 11 | 63% | 1989 | 12,898 | 1989 | 189,216 | 1989 | 79,098 |
| 12 | 60% | 1979 | 12,917 | 1987 | 193,715 | 1987 | 87,230 |
| 13 | 57% | 1987 | 13,783 | 1993 | 197,805 | 1976 | 89,320 |
| 14 | 53% | 1992 | 14,328 | 1976 | 200,758 | 1973 | 90,941 |
| 15 | 50% | 1974 | 16,310 | 1975 | 204,060 | 1984 | 90,941 |
| 16 | 47% | 1980 | 16,585 | 1973 | 209,154 | 1993 | 94,879 |
| 17 | 43% | 1996 | 16,657 | 1984 | 217,294 | 1975 | 98,999 |
| 18 | 40% | 1993 | 16,992 | 1978 | 224,227 | 1982 | 99,475 |
| 19 | 37% | 1976 | 17,177 | 1980 | 229,388 | 1974 | 107,407 |
| 20 | 33% | 1975 | 17,441 | 1996 | 230,413 | 1996 | 108,325 |
| 21 | 30% | 1998 | 17,468 | 1974 | 232,504 | 1980 | 110,291 |
| 22 | 27% | 1978 | 17,950 | 1998 | 241,775 | 1991 | 113,234 |
| 23 | 23% | 1983 | 18,519 | 1982 | 245,651 | 1978 | 114,02 |
| Wet | 24 | 20% | 1997 | 18,991 | 1991 | 246,210 |
1998 | 115,485 | | 25 | 17% | 1982 | 19,139 | 1997 | 263,103 |
1997 | 122,894 |
| 26 | 13% | 1995 | 19,264 | 1995 | 266,931 | 1983 | 126,601 |
| 27 | 10% | 1986 | 19,414 | 1999 | 275,244 | 1999 | 133,361 |
| 28 | 7% | 1999 | 19,858 | 1983 | 286,164 | 1995 | 135,304 |
| 29 | 3% | 1991 | 20,251 | 1986 | 300,455 | 1986 | 136,312 |
6.5 Bighorn River Basin
Only a few gages within the Bighorn basin contain adequate data to serve as index gages for development of hydrologic year classifications. As with previous index gage selection, gages that are not
significantly influence by diversions, storage or return flows are the most desirable gages. In the Bighorn basin, separate gages were selected for sites along the Owl Creek Range in the Upper Bighorn
Basin and Nowood River basins, the Bighorn range in the Nowood River basin, and Bighorn Lake River basin, and the Absaroka range in the Greybull and Shoshone River basins. For purposes of this analysis,
the following gages were selected as index gages: the South Fork of Owl Creek near Anchor (0626000), Nowood River near Tensleep (0627000), Wood River at Sunshine (06275000), Shell Creek near Shell (06278500)
and the South Fork Shoshone River near Valley (06280300). A summary of the annual hydrologic classification for each of these gages is shown in Table 6-7 and Table 6-8.
Table 6-7. Annual Summary of Hydrologic Classification for Upper Bighorn and Greybull River Basins
Hyd.
Class. | Rank | Exceedance
Probability |
SFOwl_nrAnc
06260000 | Now_Ten
06270000 |
Wod_Sun
06275000 |
| Year | ac-ft |
Year | ac-ft |
Year | ac-ft |
| Dry | 1 | 97% | 2001 | 9,057 | 1995 | 48,437 |
1977 | 28,027 |
| 2 | 93% | 1994 | 9,868 | 1989 | 49,105 | 1985 | 32,102 |
| 3 | 90% | 1985 | 10,269 | 1980 | 52,662 | 1982 | 33,013 |
| 4 | 87% | 1977 | 10,813 | 2001 | 54,585 | 1988 | 35,164 |
| 5 | 83% | 1988 | 17,060 | 1981 | 54,772 | 1989 | 39,662 |
| 6 | 80% | 1979 | 18,270 | 1982 | 58,017 | 1990 | 43,147 |
| Average | 7 | 77% | 2000 | 19,366 | 1992 | 59,894 |
2001 | 44,959 |
| 8 | 73% | 1982 | 21,021 | 2000 | 62,873 | 1986 | 46,732 |
| 9 | 70% | 1981 | 21,961 | 1985 | 63,347 | 1987 | 53,210 |
| 10 | 67% | 1984 | 22,709 | 1993 | 64,093 | 1979 | 54,717 |
| 11 | 63% | 1990 | 24,177 | 1997 | 67,117 | 1980 | 60,833 |
| 12 | 60% | 1973 | 24,702 | 1987 | 67,897 | 1992 | 61,179 |
| 13 | 57% | 1989 | 24,713 | 1979 | 68,090 | 1994 | 62,936 |
| 14 | 53% | 1993 | 25,955 | 1990 | 71,158 | 2000 | 65,234 |
| 15 | 50% | 1980 | 27,103 | 1988 | 71,298 | 1976 | 66,657 |
| 16 | 47% | 1976 | 28,021 | 1974 | 72,017 | 1981 | 67,117 |
| 17 | 43% | 1987 | 28,305 | 1976 | 72,481 | 1978 | 68,321 |
| 18 | 40% | 1974 | 28,519 | 1991 | 72,820 | 1984 | 77,764 |
| 19 | 37% | 1978 | 30,736 | 1998 | 73,166 | 1993 | 83,381 |
| 20 | 33% | 1983 | 30,938 | 1994 | 77,481 | 1991 | 87,968 |
| 21 | 30% | 1975 | 31,129 | 1986 | 78,295 | 1975 | 88,650 |
| 22 | 27% | 1992 | 32,065 | 1999 | 84,286 | 1995 | 92,835 |
| 23 | 23% | 1998 | 32,710 | 1977 | 104,788 | 1996 | 93,989 |
| Wet | 24 | 20% | 1996 | 33,690 | 1996 | 106,347 |
1983 | 97,824 |
| 25 | 17% | 1997 | 35,567 | 1983 | 114,541 | 1973 | 99,332 |
| 26 | 13% | 1999 | 37,169 | 1975 | 125,252 | 1998 | 100,575 |
| 27 | 10% | 1995 | 38,295 | 1973 | 129,050 | 1974 | 108,587 |
| 28 | 7% | 1986 | 40,395 | 1984 | 136,752 | 1997 | 109,054 |
| 29 | 3% | 1991 | 40,665 | 1978 | 183,819 | 1999 | 112,350 |
Table 6-8. Annual Summary of Hydrologic Classificationfor Bighorn Lake and Shoshone River Basins
Hyd.
Class. | Rank | Exceedance
Probability |
Shl_nrShl
06278500 |
SFSh_Val
06280300 |
| Year | ac-ft |
Year | ac-ft |
| Dry | 1 | 97% | 2001 | 55,848 | 1977 | 159,664 |
| 2 | 93% | 1985 | 66,267 | 2001 | 181,470 |
| 3 | 90% | 1989 | 70,131 | 1994 | 185,366 |
| 4 | 87% | 1994 | 70,758 | 1988 | 196,253 |
| 5 | 83% | 2000 | 71,947 | 1992 | 206,754 |
| 6 | 80% | 1977 | 72,003 | 1987 | 218,431 |
| Average | 7 | 77% | 1987 | 72,859 | 1979 | 236,390 |
| 8 | 73% | 1998 | 76,645 | 2000 | 237,314 |
| 9 | 70% | 1980 | 77,928 | 1973 | 241,555 |
| 10 | 67% | 1981 | 86,610 | 1993 | 245,516 |
| 11 | 63% | 1988 | 87,047 | 1985 | 249,330 |
| 12 | 60% | 1991 | 87,251 | 1990 | 259,033 |
| 13 | 57% | 1993 | 88,214 | 1981 | 264,964 |
| 14 | 53% | 1996 | 88,266 | 1989 | 275,921 |
| 15 | 50% | 1983 | 89,527 | 1980 | 298,057 |
| 16 | 47% | 1982 | 91,926 | 1998 | 301,155 |
| 17 | 43% | 1992 | 92,432 | 1983 | 309,712 |
| 18 | 40% | 1990 | 94,362 | 1975 | 318,943 |
| 19 | 37% | 1997 | 94,746 | 1984 | 323,529 |
| 20 | 33% | 1973 | 96,041 | 1995 | 326,448 |
| 21 | 30% | 1984 | 97,881 | 1991 | 337,143 |
| 22 | 27% | 1974 | 99,042 | 1999 | 350,738 |
| 23 | 23% | 1979 | 99,095 | 1978 | 352,728 |
| Wet | 24 | 20% | 1999 | 99,685 | 1976 | 369,709 |
| 25 | 17% | 1986 | 100,445 | 1982 | 376,575 |
| 26 | 13% | 1976 | 100,563 | 1996 | 378,708 |
| 27 | 10% | 1995 | 103,062 | 1986 | 386,116 |
| 28 | 7% | 1975 | 109,673 | 1974 | 400,141 |
| 29 | 3% | 1978 | 116,732 | 1997 | 440,652 |
Section 7 - Summary Flow Data
This section presents an annual summary of the overall study period average and hydrologic period averages. As previously discussed, gage records were reduced from monthly data
throughout the study period to the hydrologic classifications shown by averaging the data for the years within each hydrologic classification, based upon the classification at the
index gage. The natural flow node flows were estimated based on regional regression equations for the Q10, Q50 and Q90 for the wet, dry and average years, respectively. Monthly average
flows are presented in Appendix A.
7.1 Madison/Gallatin River Basin
A summary of annual flows for the Madison/Gallatin River Basin are presented in Table 7-1. As shown, because of its heavy influence by groundwater inflows, flows in the
Madison river basin do not vary significantly between dry and wet years.
Table 7-1. Summary of Average Annual Flows for the Madison/Gallatin River Basins
Sub-
Basin | USGS
Gage No. | Site Name | Gaged/Estimated Annual Flow (ac-ft) |
| Dry | Average | Wet |
| Madison/Gallatin | 06037000 | Gibbon River Near West Yellowstone Mt | 76,829 | 97,101 | 120,010 |
| 06036905 | Firehole River Near West Yellowstone Mt | 216,029 | 234,984 | 266,559 |
| 06037500 | Madison River Near West Yellowstone Mt | 340,745 | 375,009 | 437,417 |
| 06043500 | Gallatin River Near Gallatin Gateway Mt | 501,921 | 634,324 | 716,471 |
7.2 Yellowstone River Basin
A summary of streamflow data for the Yellowstone River Basin is shown in Table 7-2. As with the Madison and Gallatin basins, there is not a significant variation between
dry, average and wet year flows in the basin. The Lamar River gage, the average annual flow during average years is less than for dry years. This is because the dry, average and
wet years were determined at the Yellowstone gage, which is influence more by flows from the Yellowstone River upstream of its confluence with the Lamar River. Because of its
different physical setting (originating on the west slope of the Absarokas rather than the north slope of the Absarokas) the distribution of dry, average and wet years are different.
Table 7-2. Summary of Average Annual Flows for the Yellowstone River Basin
Sub-
Basin | USGS
Gage No. | Site Name |
Gaged/Estimated Annual Flow (ac-ft) | | Dry | Average | Wet |
Yellowstone
Headwaters | 06186500 | Yellowstone River At Yellowstone Lk Outlet Ynp | 664,734 |
1,001,588 | 1,185,711 |
| 06187000 | Yellowstone River Near Canyon Hotel Ynp | 813,647 | 1,146,594 | 1,328,581 |
| 06187500 | Tower Creek At Tower Falls Ynp | 27,200 | 43,145 | 51,977 |
| 06187915 | Soda Butte Cr At Park Bndry At Silver Gate | 27,892 | 41,211 | ---(1) |
| 06187950 | Soda Butte Cr Nr Lamar Ranger Station Ynp | 74,928 | 108,886 | 115,585 |
| 06188000 | Lamar River Nr Tower Falls Ranger Station Ynp | 373,084 | 353,678 | 687,920 |
| 06190000 | Lupine Creek Near Mammoth Ynp | 2,362 | 3,694 | 4,247 |
| 06190500 | Gardner River At Mammoth Ynp | ---(1) | ---(1) | ---(1) |
| 06190540 | Hot River At Mammoth Ynp | 18,961 | 19,417 | 19,776 |
| 06191000 | Gardner River Near Mammoth Ynp | 116,866 | 160,968 | 179,296 |
| 06189000 | Blacktail Deer Creek Nr Mammoth Ynp | 4,895 | 7,795 | 9,115 |
| 06188500 | E F Blacktail Deer Cr Nr Mammoth Ynp | 1,444 | 2,732 | 3,322 |
Notes:
(1)No data available for hydrologic period. Gage record was not extended for reasons discussed in previous sections. Gage not included in model.
7.3 Clarks Fork River Basin
Average annual flows for the Clarks Fork River Basin are shown in Table 7-3. The Clarks Fork basin shows significant differences between dry and wet years. This is
because basin runoff is primarily dependent upon snowpack and because there is no upstream storage in the basin. Several natural flow nodes were required to model the basin;
these outnumber gage flows by over three to one. The Clarks Fork above Squaw Creek (06205500) gage represents natural flows for the Clarks Fork River.
Table 7-3. Summary of Average Annual Flows for the Clarks Fork River Basin
Sub-
Basin | USGS
Gage No. | Site Name | Gaged/Estimated Annual Flow (ac-ft) |
| Dry | Average | Wet |
Clarks Fork
Yellowstone | 6205500 | Clarks Fk Yellowstone R Ab Squaw C Nr Painter,Wy | 204,675 | 289,994 | 336,440 |
| 6206000 | Clarks Fk Yellowstone R Bl Crandal C Nr Painter | 355,882 | 506,663 | 589,085 |
| Natural Flow | Deadman Creek Natural Flow | 173 | 390 | 856 |
| Natural Flow | Camp Creek Natural Flow | 290 | 649 | 1,406 |
| Natural Flow | Dutch Charlie Creek Natural Flow | 133 | 302 | 669 |
| Natural Flow | Bars Creek Natural Flow | 253 | 568 | 1,234 |
| Natural Flow | Sunlight Creek Natural Flow | 9,971 | 20,470 | 40,655 |
| Natural Flow | Gravel Bar Creek Natural Flow | 1,920 | 4,122 | 8,509 |
| Natural Flow | Huff Creek Natural Flow | 603 | 1,329 | 2,823 |
| 6206500 | Sunlight Creek Near Painter, Wyo. | 66,582 | 91,038 | 104,272 |
| Natural Flow | Elk Creek Natural Flow | 1,923 | 4,128 | 8,522 |
| Natural Flow | New Meyer Creek Natural Flow | 1,027 | 2,236 | 4,688 |
| Natural Flow | Paint Creek Natural Flow | 1,306 | 2,829 | 5,896 |
| Natural Flow | Luce Reservoir Natural Flow | 160 | 363 | 798 |
| Natural Flow | Pat O'Hare Creek Natural Flow | 6,838 | 14,193 | 28,436 |
| Natural Flow | Bennett Creek Natural Flow | 2,310 | 4,937 | 10,147 |
| Natural Flow | Natural Springs Natural Flow | 33 | 76 | 176 |
| Natural Flow | Little Rocky Creek Natural Flow | 9,038 | 18,608 | 37,042 |
| Natural Flow | Line Creek Natural Flow | 294 | 659 | 1,426 |
| 6207500 | Clarks Fork Yellowstone River Nr Belfry Mt | 496,917 | 681,915 | 782,014 |
| 6207510 | Big Sand Cl At Wy-Mont State Line | 32,320 | 29,058 | 25,148 |
Notes:
(1)No data available for hydrologic period. Gage record was not extended for reasons discussed in previous sections. Gage not included in model.
7.4 Wind River Basin
Table 7-4 presents a summary of average annual flows for the Wind River Basin. The basin contains a mixture of gage sites and natural flow nodes. In addition, four creeks
within the basin contain gages that represent natural flows for the creek: Crow Creek (6222700), Bull Lake Creek (6224000), South Fork Little Wind (06228350) and North Fork Little
Wind (06228350). The Popo Agie gage has been included in the Wind River basin gages. However, the Popo Agie river basin has been modeled under a separate study (Anderson, 2002). As
shown and as previously discussed, there are several streamflow gages that were not used in the modeling analysis.
Table 7-4. Summary of Average Annual Flows for the Wind River Basin
Sub-
Basin | USGS
Gage No. | Site Name | Gaged/Estimated Annual Flow (ac-ft) |
| Dry | Average | Wet |
| Upper Wind | Natural Flow | Wind River Natural Flow | 23,780 | 49,726 | 86,258 |
| Natural Flow | East Dunoir Creek Natural Flow | 11,014 | 22,584 | 39,529 |
| Natural Flow | West Dunoir Creek Natural Flow | 10,624 | 22,802 | 39,927 |
| Natural Flow | Willow Branch Creek Natural Flow | 949 | 2,492 | 5,065 |
| Natural Flow | Sixmile Creek Natural Flow | 3,151 | 7,007 | 13,445 |
| Natural Flow | Fivemile Creek Natural Flow | 844 | 2,233 | 4,560 |
| 6218500 | Wind River Near Dubois, Wyo. | 83,224 | 128,144 | 147,394 |
| Natural Flow | Warm Springs Creek Natural Flow | 26,516 | 53,558 | 91,147 |
| Natural Flow | Geyser Creek Natural Flow | 897 | 2,319 | 4,778 |
| Natural Flow | Little Warms Springs Creek Natural Flow | 3,196 | 7,589 | 14,352 |
| Natural Flow | Horse Creek - Natural Flow | 8,720 | 17,327 | 32,811 |
| Natural Flow | Little Horse Creek - Natural Flow | 1,528 | 3,984 | 8,009 |
| 6220000 | Wind River At Dubois Wyo | --- (1) | --- (1) | ---(1) |
| Natural Flow | Jakeys Fork - Natural Flow | 23,280 | 42,544 | 72,137 |
| Natural Flow | Torrey Creek Natural Flow | 20,673 | 36,409 | 63,381 |
| Natural Flow | East Fork Wind River Natural Flow | 16,726 | 31,433 | 55,589 |
| Natural Flow | Meadow Creek Natural Flow | 2,366 | 6,011 | 11,339 |
| Natural Flow | Alkali Creek Natural Flow | 2,491 | 6,605 | 12,396 |
| Natural Flow | Bear Creek Natural Flow | 23,901 | 47,966 | 80,871 |
| Natural Flow | Wiggins Fork Natural Flow | 54,177 | 94,640 | 160,960 |
| 6220500 | East Fork Wind River Nr Dubois Wyo | 106,052 | 177,501 | 221,433 |
| 6220800 | Wind River Above Red Creek, Near Dubois, Wy | 314,982 | 489,170 | 611,810 |
| Natural Flow | Red Creeknatural Flow | 1,912 | 4,696 | 9,383 |
| 6221400 | Dinwoody Creek Above Lakes, Near Burris, Wyo. | 75,115 | 99,612 | 126,925 |
| 6221500 | Dinwoody Creek Near Burris, Wyo. | ---(1) | ---(1) | ---(1) |
| 6222000 | Wind River Near Burris, Wy | ---(1) | ---(1) | ---(1) |
| Natural Flow | Little Dry Creek Natural Flow | 5,095 | 12,666 | 22,620 |
| Natural Flow | Dry Creek Natural Flow | 23,533 | 40,941 | 70,245 |
| 6222500 | Dry Creek Near Burris, Wyo. | 18,822 | 33,114 | 48,754 |
| 6222700 | Crow C Nr Tipperary Wyo | 7,936 | 15,107 | 19,486 |
| Natural Flow | Meadow Creek Natural Flow | 1,303 | 3,709 | 7,372 |
| Natural Flow | Bob Creek Natural Flow | 4,741 | 9,531 | 18,304 |
| 6223000 | Meadow Creek Nr Lenore Wyo | ---(1) | ---(1) | ---(1) |
| 6223500 | Willow Creek Near Crowheart, Wyo. | 7,216 | 13,290 | 22,927 |
| 6224000 | Bull Lake Creek Above Bull Lake, Wy | 134,156 | 206,519 | 273,018 |
| 6225000 | Bull Lake Creek Near Lenore, Wy | 161,646 | 194,507 | 232,087 |
| 6225500 | Wind River Near Crowheart, Wy | 573,394 | 861,074 | 1,066,800 |
| Natural Flow | West Fork Dry Pasup Creek Natural Flow | 646 | 1,453 | 3,190 |
| Natural Flow | Red Creek Natural Flow | 9 | 31 | 82 |
| 6227600 | Wind River Near Kinnear, Wy | 242,380 | 527,696 | 780,446 |
| 6228000 | Wind River At Riverton, Wy | 169,632 | 406,669 | 619,260 |
| 6236100 | Wind River Ab Boysen Reservoir, Nr Shoshoni, Wy | 423,079 | 899,138 | 1,318,331 |
| Little Wind |
6228350 | Sf L Wind R Ab Washakie Re Nr Ft Washakie Wy | 57,281 | 93,420 | 128,326 |
| 6228450 | South Fork Little Wind Riv Bel Washakie Res, Wy | 57,385 | 89,827 | 123,268 |
| 6228500 | Little Wind R Nr Fort Washakie, Wyo. | ---(1) | ---(1) | ---(1) |
| Natural Flow | Crooked Creek Natural Flow | 1,181 | 3,300 | 6,722 |
| Natural Flow | Spring Creek Natural Flow | 248 | 898 | 1,935 |
| 6229900 | Trout Creek Near Fort Washakie, Wy | 4,737 | 6,901 | 10,415 |
| Natural Flow | Mill Creek Natural Flow | 751 | 2,377 | 4,905 |
| 6230190 | Mill Cr Ab Ray Lake Outlet Canal, Nr Ft Washakie | 2,370 | 3,663 | 5,471 |
| 6228800 | North Fork Little Wind River Nr Fort Washakie, Wy | 57,571 | 99,885 | 140,330 |
| 6229000 | N Fk Little Wind R At Fort Washakie, Wyo. | ---(1) | ---(1) | ---(1) |
| Natural Flow | North Fork Sage Creek Natural Flow | 1,746 | 4,175 | 8,590 |
| Natural Flow | South Fork Sage Creek Natural Flow | 999 | 2,597 | 5,464 |
| Natural Flow | Pevah Creek Natural Flow | 429 | 1,295 | 2,814 |
| 6229680 | Sage Cr Ab Norkok Meadows Cr, Nr Ft Washakie, Wy | 4,343 | 7,835 | 11,732 |
| Natural Flow | Norkok Creek Natural Flow | 772 | 2,268 | 4,624 |
| 6230500 | Little Wind River Nr Arapahoe Wyo | ---(1) | ---(1) | ---(1) |
| 6231000 | Little Wind R Above Arapahoe, Wyo. | 61,917 | 137,892 | 219,921 |
| 6234000 | Little Wind River Below Arapahoe Wyo | ---(1) | ---(1) | --- (1) |
| Natural Flow | Beaver Creek Natural Flow | 4,571 | 10,276 | 19,485 |
| 6235500 | Little Wind River Near Riverton, Wy | 201,224 | 399,911 | 641,442 |
| 6233900 | Popo Agie River Nr Arapahoe Wy | 141,836 | 227,330 | 356,443 |
| Lower Wind |
Natural Flow | Five Mile Creek Natural Flow | 232 | 636 | ,379 |
| 6244500 | Fivemile C Ab Wyo Ca Nr Pav Wyo | 3,787 | 3,608 | 5,797 |
| 6245000 | Fivemile Creek Nr Pavillion Wyo | ---(1) | ---(1) | ---(1) |
| 6250000 | Fivemile Creek Near Riverton, Wy | 168,760 | 231,478 | 256,404 |
| 6253000 | Fivemile Creek Near Shoshoni, Wy | 90,773 | 124,041 | 137,263 |
| 6239000 | Muscrat Creek Near Shoshoni, Wy | ---(1) | 15,681 | ---(1) |
| Natural Flow | Dry Cottonwood Creek Natural Flow | 167 | 539 | 1,229 |
| Natural Flow | Ingalls Creek Natural Flow (Spring) | 20 | 84 | 213 |
| Natural Flow | Mexican Draw Natural Flow | 134 | 472 | 1,081 |
| Natural Flow | Stagner Creek Natural Flow | 140 | 489 | 1,118 |
| Natural Flow | Wood Road Canyon Natural Flow | 77 | 287 | 681 |
| Natural Flow | Gill Meadows Natural Flow | 25 | 106 | 269 |
| Natural Flow | Morrison Meadows Natural Flow (Spring) | 4 | 15 | 40 |
| Natural Flow | Morrison Canyon Natural Flow | 230 | 748 | 1,662 |
| 6258500 | Dry Cottonwood Creek Near Bonneville, Wy | ---(1) | ---(1) | --- (1) |
| Natural Flow | Holland Creek Natural Flow | 200 | 652 | 1,467 |
| Natural Flow | Warm Springs Creek Natural Flow | 138 | 486 | 1,108 |
| Natural Flow | Bargee Creek Natural Flow | 740 | 2,158 | 4,519 |
| Natural Flow | Sagwup Creek Natural Flow | 2,033 | 5,403 | 10,626 |
| Natural Flow | Dry Muddy Creek Natural Flow | 1,004 | 2,320 | 4,949 |
| Natural Flow | Shotgun Creek Natural Flow | 209 | 585 | 1,352 |
| Natural Flow | Mckee Grave Creek Natural Flow | 204 | 579 | 1,337 |
| Natural Flow | West Fork Sheep Creek Natural Flow | 254 | 695 | 1,580 |
| Natural Flow | East Fork Sheep Creek Natural Flow | 142 | 403 | 943 |
| 6257500 | Muddy Creek Near Pavillion, Wyo. | ---(1) | 4,172 | ---(1) |
| 6258000 | Muddy Creek Near Shoshoni, Wyo. | 13,152 | 18,361 | 18,907 |
| 6259000 | Wind R Bl Boysen Res Wyo | 766,870 | 1,047,812 | 1,329,777 |
| Badwater | Natural Flow | Badwater Creek Natural Flow | 3,451 | 6,596 | 11,885 |
| 6256000 | Badwater Creek At Lybyer Ranch, Nr Lost Cabin, Wy | 23,422 | 24,206 | 21,224 |
| 6256500 | Badwater Creek At Lost Cabin Wyo | ---(1) | ---(1) | ---(1) |
| Natural Flow | E-K Creek Natural Flow | 52 | 159 | 368 |
| Natural Flow | Alkali Creek Natural Flow | 561 | 1,341 | 2,620 |
| 6256650 | Badwater C At Lysite, Wy | 24,442 | 24,209 | 21,529 |
| Natural Flow | East Bridger Creek Natural Flow | 51 | 157 | 378 |
| Natural Flow | Bridger Creek Natural Flow | 1,289 | 2,769 | 5,279 |
| Natural Flow | Meadow Creek Natural Flow | 239 | 622 | 1,308 |
| Natural Flow | Lysite Creek Natural Flow | 654 | 1,512 | 2,991 |
| 6256800 | Bridger Creek Near Lysite, Wyo. | 15,646 | 16,489 | 14,000 |
| Natural Flow | West Fork Dry Creek Natural Flow | 138 | 378 | 873 |
| 6256900 | Dry Creek Near Bonneville, Wyo. | 1,031 | 1,547 | 742 |
| 6257000 | Badwater Creek At Bonneville, Wyo. | 39,904 | 40,510 | 36,361 |
Notes:
(1) No data available for hydrologic period. Gage record was not extended for reasons discussed in previous sections. Gage not included in model.
7.5 Bighorn River Basin
Average annual flows for the Bighorn River Basin are shown in Table 7-5. The basin does have a mixture of gaged sites and natural flow nodes. However, especially
in the Nowood and Greybull basins, there are a significant number of ungaged sites. Streams that contain gage sites representing natural flow include: South Fork Owl Creek
(06260000), Middle Fork Owl Creek (06260200) Paint Rock Creek (06271500), Wood River (06274800) and Shell Creek (06278300). As shown and as previously discussed, there are
several streamflow gages that were not used in the modeling analysis.
Table 7-5. Summary of Average Annual Flows for the Bighorn River Basin
Sub-
Basin | USGS
Gage No. | Site Name |
Gaged/Estimated Annual Flow (ac-ft) | | Dry | Average | Wet |
| Upper Bighorn | Natural Flow | Red Canyon Creek Natural Flow | 4,242 | 9,988 | 18,602 |
| 6259500 | Bighorn River At Thermopolis, Wyo. | 843,625 | 1,069,496 | 1,392,167 |
| Natural Flow | North Fork Owl Creek Natural Flow | 3,639 | 8,419 | 16,001 |
| 6262000 | North Fork Owl Creek Near Anchor, Wy | 4,950 | 9,930 | 13,756 |
| 6262300 | North Fork Owl Cr Ab Basin Ranch Nr Anchor Wyo | 5,082 | 10,092 | 13,827 |
| 6262500 | N.F. Owl Creek At Crann Ranch Nr Thermopolis, Wy | ---(1) | ---(1) | ---(1) |
| 6263000 | North Fork Owl Creek Nr Thermopolis Wyo | ---(1) | ---(1) | ---(1) |
| 6260000 | South Fork Owl Creek Near Anchor, Wy | 12,578 | 26,747 | 37,630 |
| 6260400 | South Fork Owl Creek Below Anchor Reservoir, Wy | 9,019 | 17,498 | 22,880 |
| Natural Flow | Goat Creek Natural Flow | 302 | 1,009 | 2,203 |
| Natural Flow | Carney Creek Natural Flow | 214 | 724 | 1,603 |
| 6260500 | S F Owl Creek Ab Curtis Ranch, Nr Thermopolis, Wy | ---(1) | ---(1) | ---(1) |
| 6261000 | Sf Owl C A C Rn N Thermopolis Wyo | ---(1) | ---(1) | ---(1) |
| 6261500 | South Fork Owl Creek Nr Thermopolis Wyo | ---(1) | ---(1) | ---(1) |
| Natural Flow | Arapaho Ranch Pumps Natural Flow | 59 | 202 | 460 |
| Natural Flow | Dry Cottonwood Creek Natural Flow | 942 | 2,621 | 5,312 |
| Natural Flow | Red Creek Natural Flow | 1,567 | 4,409 | 8,779 |
| Natural Flow | Unnamed Creek Natural Flow | 418 | 1,234 | 2,607 |
| Natural Flow | Thompson Reservoir #1 Natural Flow Node | 482 | 1,346 | 2,792 |
| Natural Flow | Middle Fork Mud Creek Natural Flow | 766 | 2,360 | 4,890 |
| Natural Flow | Mud Creek Natural Flow | 1,956 | 5,513 | 10,867 |
| Natural Flow | South Fork Mud Creek Natural Flow | 846 | 2,562 | 5,293 |
| Natural Flow | Whitney Spring Natural Flow | 226 | 734 | 1,612 |
| Natural Flow | Spring Draw Natural Flow | 905 | 2,529 | 5,107 |
| 6263500 | Mud Creek Nr Thermopolis Wyo | ---(1) | ---(1) | ---(1) |
| Natural Flow | Mccumber Spring Natural Flow | 71 | 253 | 581 |
| 6264000 | Owl Creek Near Thermopolis, Wy | ---(1) | ---(1) | ---(1) |
| 6264500 | Owl Creek Near Lucerne, Wyo. | ---(1) | ---(1) | ---(1) |
| Natural Flow | Kirby Creek Natural Flow | 11,807 | 26,786 | 46,764 |
| 6265000 | Kirby Creek Nr Lucerne Wyo | ---(1) | ---(1) | ---(1) |
| Natural Flow | Cottonwood Creek Natural Flow | 4,626 | 11,462 | 21,605 |
| Natural Flow | Lake Creek Natural Flow | 748 | 2,186 | 4,473 |
| 6265337 | Cottonwood C At High Island Rnch Nr Hamilton Dome | 4,803 | 9,188 | 12,155 |
| Natural Flow | Hamilton Dome Well Natural Flow | 205 | 642 | 1,409 |
| Natural Flow | Little Grass Creek Natural Flow | 3,871 | 10,166 | 19,180 |
| Natural Flow | Grass Creek Natural Flow | 1,166 | 3,399 | 6,829 |
| Natural Flow | Mayfield Wells Natural Flow | 1,363 | 3,612 | 7,140 |
| 6265500 | Cottonwood Creek At Winchester Wyo | ---(1) | ---(1) | ---(1) |
| Natural Flow | Gooseberry Creek Natural Flow | 6,660 | 16,753 | 30,848 |
| 6265800 | Gooseberry Creek At Dickie, Wyo. | 7,199 | 12,662 | 14,795 |
| Natural Flow | Enos Creek Natural Flow | 1,944 | 5,435 | 10,666 |
| 6266000 | Gooseberry Creek Near Grass Creek, Wyo. | ---(1) | ---(1) | ---(1) |
| 6266500 | Gooseberry Creek Nr Dickie Wyo | ---(1) | ---(1) | ---(1) |
| 6267000 | Gooseberry Creek At Neiber, Wyo. | --- (1) | ---(1) | ---(1) |
| 6267400 | East Fork Nowater Creek Near Colter, Wyo. | 1,710 | 3,153 | 2,155 |
| 6268500 | Fifteen Mile Creek Near Worland, Wyo. | 3,508 | 5,834 | 4,708 |
| Natural Flow | Unnamed Creek Natural Flow | 144 | 385 | 814 |
| 6268600 | Bighorn R At Worland Wyo | 614,170 | 840,692 | 1,164,292 |
| Natural Flow | Sixmile Creek Natural Flow | 375 | 907 | 1,778 |
| 6269000 | Bighorn River Near Manderson, Wy | ---(1) | ---(1) | ---(1) |
| 6269500 | Bighorn R At Manderson Wyo | ---(1) | ---(1) | ---(1) |
| Natural Flow | Adobe Creek Natural Flow | 290 | 679 | 1,358 |
| 6274300 | Bighorn R At Basin Wy | 963,340 | 1,327,128 | 1,757,979 |
| Nowood |
Natural Flow | Nowood River Natural Flow | 4,971 | 13,482 | 24,793 |
| Natural Flow | Lone Tree Creek Natural Flow | 1,170 | 3,621 | 7,196 |
| Natural Flow | Bear Creek Natural Flow | 1,866 | 5,810 | 11,088 |
| Natural Flow | Deep Creek Natural Flow | 13,613 | 34,619 | 59,756 |
| Natural Flow | Box Elder Creek Natural Flow | 2,292 | 6,902 | 13,245 |
| Natural Flow | Red Bank Creek Natural Flow | 2,342 | 6,900 | 13,255 |
| Natural Flow | Little Canyon Creek Natural Flow | 2,615 | 8,062 | 15,042 |
| Natural Flow | South Fork Little Canyon Creek Natural Flow | 96 | 333 | 747 |
| Natural Flow | Crooked Creek Natural Flow | 1,012 | 3,380 | 6,673 |
| Natural Flow | Otter Creek Natural Flow | 8,211 | 22,580 | 39,807 |
| Natural Flow | South Fork Otter Creek Natural Flow | 5,801 | 16,906 | 30,299 |
| Natural Flow | Spring Creek Natural Flow | 4,143 | 12,214 | 22,322 |
| Natural Flow | Taylor #2 Well Natural Flow | 20 | 80 | 197 |
| Natural Flow | North Fork Spring Creek Natural Flow | 847 | 3,016 | 5,959 |
| 6270000 | Nowood River Near Tensleep, Wy | 52,476 | 72,981 | 132,627 |
| Natural Flow | Ten Sleep Creek Natural Flow | 29,211 | 55,336 | 89,030 |
| Natural Flow | West Fork Tensleep Creek Natural Flow | 53,243 | 94,509 | 145,753 |
| 6270450 | Canyon Creek Below Cooks Canyon, Near Tensleep, | 9,754 | 9,901 | 10,876 |
| 6270500 | Canyon Creek Nr Ten Sleep Wyo | 18,271 | 20,418 | 26,662 |
| 6271000 | Tensleep Creek Near Tensleep, Wyo. | 85,668 | 87,522 | 99,890 |
| Natural Flow | Beth Wells Natural Flow | 22 | 81 | 198 |
| Natural Flow | Unnamed Creek Natural Flow | 12 | 45 | 115 |
| Natural Flow | Brokenback Creek Natural Flow | 3,163 | 10,087 | 18,330 |
| Natural Flow | Green Beret Wells Natural Flow | 4,334 | 13,112 | 23,576 |
| Natural Flow | Buffalo Flat Creek Natural Flow | 1,839 | 5,503 | 10,626 |
| Natural Flow | Gomer Well #1 Natural Flow | 28 | 98 | 238 |
| Natural Flow | Gomer Well #2 Natural Flow | 58 | 198 | 465 |
| Natural Flow | Medicine Lodge Creek Natural Flow | 10,578 | 27,740 | 47,733 |
| 6273000 | Medicine Lodge Creek Near Hyattville, Wyo. | 21,698 | 22,221 | 25,826 |
| 6271500 | Paintrock Creek Below Lake Solitude, Wy | ---(1) | ---(1) | ---(1) |
| 6272500 | Paintrock Creek Near Hyattville, Wyo. | 85,641 | 94,079 | 110,948 |
| Natural Flow | Hamilton And Walters Wells Natural Flow | 2,213 | 6,720 | 12,844 |
| 6273500 | Paintrock Creek Near Mouth Below Hyattville Wy | ---(1) | ---(1) | ---(1) |
| 6274000 | Nowood River At Bonanza Wyo | ---(1) | ---(1) | ---(1) |
| Big Horn Lake |
6278300 | Shell Creek Above Shell Creek Reservoir, Wyo. | 18,102 | 23,915 | 28,518 |
| Natural Flow | Adelaide Creek Natural Flow | 1,266 | 2,730 | 7,809 |
| 6278500 | Shell Creek Near Shell, Wy | 68,277 | 89,404 | 105,027 |
| Natural Flow | White Creek Natural Flow | 6,141 | 12,427 | 32,556 |
| Natural Flow | Trapper Creek Natural Flow | 11,837 | 23,755 | 65,450 |
| Natural Flow | Horse Creek Natural Flow | 4,291 | 9,061 | 27,136 |
| 6279000 | Shell Creek At Shell Wyo | ---(1) | ---(1) | ---(1) |
| Natural Flow | Beaver Creek Natural Flow | 5,060 | 10,829 | 35,295 |
| Natural Flow | South Fork Beaver Creek Natural Flow | 2,247 | 4,875 | 15,324 |
| Natural Flow | Cedar Creek Natural Flow | 1,183 | 2,527 | 6,880 |
| Natural Flow | Red Canyon Natural Flow | 3,971 | 8,157 | 21,497 |
| Natural Flow | Bear Creek Natural Flow | 1,966 | 4,045 | 9,894 |
| Natural Flow | Crystal Creek Natural Flow | 2,708 | 5,045 | 9,776 |
| 6279500 | Bighorn River At Kane, Wy | 982,568 | 1,650,463 | 1,982,999 |
| Natural Flow | Fire Spring Creek Natural Flow | 4,383 | 8,753 | 20,999 |
| Natural Flow | Crooked Creek Natural Flow | 59 | 116 | 163 |
| Natural Flow | Gypsum Creek Natural Flow | 19 | 39 | 49 |
| 6286258 | Big Coulee Near Lovell, Wyo. | 38 | 82 | 89 |
| 6286260 | Crooked C Nr Lovell Wyo | 6,813 | 7,417 | 7,981 |
| Natural Flow | Sykes Spring Natural Flow | 50 | 98 | 135 |
| Natural Flow | Roundup/Harmon Spring Natural Flow | 32 | 63 | 83 |
| Shoshone |
Natural Flow | South Fork Shoshone River Natural Flow | 63,887 | 123,306 | 234,780 |
| Natural Flow | Deer Creek Natural Flow | 3,272 | 6,930 | 14,126 |
| Natural Flow | Hunter Creek Natural Flow | 50 | 115 | 261 |
| Natural Flow | Sf Shoshone Tributary Natural Flow | 92 | 211 | 471 |
| Natural Flow | Legg Creek Natural Flow | 367 | 818 | 1,761 |
| Natural Flow | Boulder Creek Natural Flow | 8,586 | 17,704 | 35,283 |
| 6280300 | South Fork Shoshone River Near Valley, Wy | 190,964 | 290,432 | 391,984 |
| Natural Flow | Spring Creek Natural Flow | 85 | 195 | 437 |
| Natural Flow | Crane Creek Natural Flow | 244 | 548 | 1,191 |
| Natural Flow | Aldrich Creek Natural Flow | 1,575 | 3,397 | 7,047 |
| Natural Flow | Ishawooa Creek Natural Flow | 14,962 | 30,340 | 59,701 |
| Natural Flow | Bob Cat Creek Natural Flow | 2,196 | 4,698 | 9,668 |
| Natural Flow | Hard Pan Creek Natural Flow | 3,342 | 7,074 | 14,411 |
| Natural Flow | Rock Creek Natural Flow | 4,574 | 9,601 | 19,416 |
| Natural Flow | Jordan Creek Natural Flow | 673 | 1,481 | 3,137 |
| Natural Flow | Belknap Creek Natural Flow | 1,464 | 3,163 | 6,574 |
| 6280500 | South Fork Shoshone River Nr Ishawooa Wyo | ---(1) | ---(1) | ---(1) |
| Natural Flow | Bull Creek Natural Flow | 963 | 2,102 | 4,413 |
| 6281000 | South Fork Shoshone R Ab Buffalo Bill Res, Wy | 135,796 | 254,070 | 387,997 |
| Natural Flow | Marquette Creek Natural Flow | 1,520 | 3,282 | 6,815 |
| Natural Flow | Carter Creek Natural Flow | 1,401 | 3,031 | 6,305 |
| 6281400 | Diamond Creek Nr Mouth Nr Cody Wy | 4,065 | 4,446 | 4,932 |
| Natural Flow | North Fork Shoshone River Natural Flow | 12,298 | 25,088 | 49,588 |
| 6279790 | Jones Creek At Mouth, Near Pahaska, Wy | 31,830 | 40,550 | 50,475 |
| 6279795 | Crow Creek At Mouth, At Pahaska, Wy | 13,932 | 20,425 | 27,331 |
| 6279800 | North Fork Shoshone River At Pahaska, Wy | 143,475 | 197,216 | 267,152 |
| 6279850 | Middle Cr At E Entrance Ynp Wy | 26,256 | 43,666 | 64,907 |
| Natural Flow | Elk Fork Creek Natural Flow | 27,348 | 54,385 | 105,556 |
| Natural Flow | Canyon Creek Natural Flow | 905 | 1,977 | 4,158 |
| Natural Flow | Big Creek Natural Flow | 2,766 | 5,883 | 12,039 |
| Natural Flow | Green Creek Natural Flow | 912 | 1,993 | 4,190 |
| Natural Flow | Rand Creek Natural Flow | 399 | 886 | 1,904 |
| Natural Flow | Whit Creek Natural Flow | 1,641 | 3,537 | 7,330 |
| 6279940 | North Fork Shoshone River At Wapiti, Wy | 414,717 | 606,805 | 849,719 |
| Natural Flow | Jim Creek Natural Flow | 751 | 1,648 | 3,482 |
| Natural Flow | Breteche Creek Natural Flow | 709 | 1,557 | 3,294 |
| Natural Flow | Unnamed Creek Natural Flow | 94 | 214 | 478 |
| Natural Flow | Trout Creek Natural Flow | 9,950 | 20,429 | 40,577 |
| 6280000 | North Fork Shoshone River Nr Wapiti Wyo | 389,849 | 610,251 | 826,179 |
| Natural Flow | Rattlesnake Creek Natural Flow | 376 | 836 | 1,798 |
| Natural Flow | Trail Creek Natural Flow | 626 | 1,378 | 2,926 |
| 6282000 | Shoshone River Below Buffalo Bill Reservoir, Wy | 486,134 | 681,752 | 1,020,454 |
| Natural Flow | Cottonwood Creek Natural Flow | 659 | 1,450 | 3,074 |
| Natural Flow | Ashworth Creek Natural Flow | 128 | 291 | 645 |
| Natural Flow | Sage Creek Natural Flow | 899 | 1,964 | 4,131 |
| Natural Flow | South Fork Sage Creek Natural Flow | 3 | 6 | 16 |
| 6283000 | Shoshone River At Corbett Dam Wyo | ---(1) | ---(1) | ---(1) |
| 6283800 | Shoshone R Ab Willwood Dam Nr Willwood Wy | 311,587 | 461,383 | 727,848 |
| 6284000 | Shoshone River At Willwood Dam Wyo | ---(1) | ---(1) | ---(1) |
| Natural Flow | Alkali Creek Natural Flow | 1,678 | 3,613 | 7,483 |
| Natural Flow | North Branch Alkali Creek Natural Flow | 64 | 148 | 334 |
| 6284200 | Shoshone River At Willwood, Wy | 357,226 | 555,936 | 910,934 |
| Natural Flow | Derry Drain Natural Flow | 2,744 | 5,838 | 11,950 |
| 6284400 | Shoshone River Near Garland, Wy | 248,171 | 422,417 | 751,324 |
| Natural Flow | Bitter Creek Natural Flow | 18,132 | 36,545 | 71,596 |
| 6284500 | Bitter Creek Near Garland, Wy | 94,667 | 100,136 | 109,307 |
| 6284800 | Whistle Creek Near Garland, Wy | 13,831 | 18,469 | 18,659 |
| 6285000 | Shoshone River At Byron, Wyo. | ---(1) | ---(1) | ---(1) |
| Natural Flow | Sand Creek Natural Flow | 5,020 | 10,511 | 21,210 |
| 6285100 | Shoshone River Near Lovell, Wy | 374,488 | 608,010 | 981,613 |
| 6286000 | Shoshone River At Lovell Wyo | ---(1) | ---(1) | ---(1) |
| 6285400 | Sage Creek At Sidon Canal, Near Deaver, Wy | 40,520 | 47,255 | 47,112 |
| 6285500 | Sage Creek Near Lovell, Wy | ---(1) | ---(1) | ---(1) |
| Natural Flow | Black Draw Natural Flow | 56 | 128 | 291 |
| 6286200 | Shoshone River At Kane, Wy | 501,521 | 751,110 | 1,139,733 |
| Natural Flow | Little Sand Draw - Natural Flow | 534 | 1,181 | 2,517 |
| Greybull |
Natural Flow | Greybull River Natural Flow | 55,880 | 108,384 | 206,993 |
| Natural Flow | Four Bear Creek Natural Flow | 327 | 729 | 1,574 |
| Natural Flow | Francs Fork Natural Flow | 8,287 | 17,106 | 34,119 |
| 6274500 | Greybull River Near Pitchfork, Wyo. | 87,088 | 121,314 | 161,480 |
| Natural Flow | Four Bear Creek Natural Flow | 1,276 | 2,765 | 5,766 |
| Natural Flow | Timber Creek Natural Flow | 1,024 | 2,231 | 4,677 |
| Natural Flow | Pappapau Creek Natural Flow | 3,470 | 7,338 | 14,937 |
| Natural Flow | Wilcox Draw Natural Flow | 173 | 392 | 860 |
| Natural Flow | Sunshine Creek Natural Flow | 1,529 | 3,300 | 6,850 |
| 6274800 | Wood River Near Kirwin, Wyo. | 7,429 | 9,612 | 11,776 |
| 6274810 | Wood R At Kirwin Wyo | 5,659 | 10,088 | 16,058 |
| Natural Flow | Dick Creek Natural Flow | 1,917 | 4,116 | 8,497 |
| Natural Flow | North Fork Dick Creek Natural Flow | 356 | 792 | 1,706 |
| 6275000 | Wood River At Sunshine, Wyo. | 35,186 | 69,353 | 104,620 |
| 6275500 | Wood River Near Meeteetse, Wyo. | 68,865 | 87,564 | 109,508 |
| Natural Flow | Rawhide Creek Natural Flow | 619 | 1,363 | 2,895 |
| Natural Flow | Little Rawhide Creek Natural Flow | 235 | 527 | 1,148 |
| 6276000 | Greybull River Nr Meeteetse Wyo | ---(1) | ---(1) | ---(1) |
| Natural Flow | Iron Creek Natural Flow | 2,070 | 4,434 | 9,138 |
| 6276500 | Greybull River At Meeteetse, Wyo. | 166,072 | 222,106 | 287,865 |
| Natural Flow | Spring Creek Natural Flow | 1,362 | 2,947 | 6,136 |
| Natural Flo | Meeteetse Creek Natural Flow | 2,208 | 4,723 | 9,717 |
| Natural Flow | South Fork Meeteetse Creek Natural Flow | 891 | 1,948 | 4,099 |
| Natural Flow | Long Hollow Creek Natural Flow | 449 | 996 | 2,132 |
| Natural Flo | Roach Gulch Natural Flow | 123 | 279 | 617 |
| Natural Flow | Willow Creek Natural Flow | 5,572 | 11,633 | 23,418 |
| Natural Flow | Wardell Reservoir Natural Flow | 31 | 72 | 166 |
| 6277500 | Greybull River Near Basin, Wyo. | 103,866 | 131,342 | 165,141 |
| Natural Flow | Dorsey Creek Natural Flow | 4,372 | 9,188 | 18,600 |
| Natural Flow | Dry Creek Natural Flow | 130,830 | 245,629 | 460,155 |
| 6277950 | Dry Creek Near Greybull Wy | ---(1) | 21,437 | ---(1) |
| 6278000 | Dry Creek At Greybull, Wy | 14,638 | 17,649 | 18,735 |
Notes:
(1)No data available for hydrologic period. Gage record was not extended for reasons discussed in previous sections. Gage not included in model.
Section 8 - References
Daly, Chris and George Taylor. 1997. “Wyoming Average Annual Precipitation, 1961-1990.” PRISM Services/Oregon State University. GIS Coverage.
Lowham, H.W. 1988. Streamflows in Wyoming. USGS Water-Resources Investigations Report 88-4045.
Miselis, Daiva V. 1999. Development of Improved Hyrologic Models for Estimating Streamflow Characteristics of the Mountainous Basins in Wyoming. Thesis submitted to the
Department of Renewable Resources and The Graduate School of the University of Wyoming. Laramie, Wyoming. May.
Petras, Ivan. 2000. “Arcview 2.1 Basin Extension.” Downloaded from www.esri.com. April 11.
Rankl, James G., Ellen Montague and Bernard N. Lenz. Estimates of Monthly Streamflow Characteristics at Selected Sites, Wind River and Part of Bighorn River Drainage Basins,
Wyoming. USGS Water-Resources Investigations Report 94-4014. Cheyenne.
States West Water Resources Corporation. 2001. Guidelines for Development of Basin Plans. Prepared for the Wyoming Water Development Commission, State of Wyoming Water Basin
Planning Process. February.
United States Geological Survey (USGS). 2002.
Appendix A
Streamflow Gage Data Record Extension
Appendix B
Study Period Monthly Streamflow
Appendix C
Hydrologic Classification Monthly Streamflow
|