| |||||||||||||

| Home Page News & Information River Basin Plans Basin Advisory Groups Planning Products |
TECHNICAL MEMORANDUM
This Technical Memorandum presents the simulation model results for the Wind/Bighorn River Basin Plan, including simulated diversion shortages, simulated streamflow and surface water availability. The document fulfills the reporting requirements of Task 3D from the original contract. This technical memorandum contains the following sections. Within each section are tables and figures containing the data for each of the main study area basins.
Section 1 - Introduction As part of the Wind/Bighorn Basin Planning process undertaken by the Wyoming Water Development Commission, spreadsheet models were developed that simulate river basin flows and operations. As shown in Table 1-1, the basin planning area was divided into 12 sub-basin models. The construction, calibration and operation of the spreadsheet models is more fully described in the Task 3B/3C Technical Memorandum Spreadsheet Model Development and Calibration (MWH, 2003). The models are intended as a tool for identifying regional demand shortages and the opportunity for additional water development given major hydrologic and institutional constraints. The models simulate river conditions for dry, average and wet year hydrologic conditions. Development of the hydrologic data is presented in the Task 3A Technical Memorandum Surface Water Hydrology (MWH, 2002).
Table 1-1. Wind/Bighorn Sub-basin Models
The Wind/Bighorn sub-basin models can run in three different modes as described below:
As noted, the Calibration mode is primarily used for calibration of the model. It utilizes historical diversion data and return flows with historical gage flows to calculate ungaged basin gains and losses. It does not recognize whether historical diversions were reduced due to water supply constraints nor does it model full use of irrigated lands with water rights. Per the definition of the Calibration mode, the model does not show any shortages at diversions. Therefore, no results from this run are presented as part of this Technical Memorandum. The results in this Technical Memorandum are for the Fully Supply for Existing Irrigated Lands and the Full Supply for Existing Irrigated Lands and Futures Projects modes. In reviewing the model results, the limitations of the model should be noted. A brief summary of these limitations follows. More information regarding the model and its limitations is presented in Task 3B/3C Technical Memorandum Spreadsheet Model Development and Calibration (MWH, 2003).
Section 2 - Diversion Shortages An important result of the Wind/Bighorn River Basin planning models is the calculation of diversion shortages. The model construction allows calculation of shortages at each node in the model. However, it must be realized that the model does not explicitly account for water rights, storage ownership rights or other delivery constraints within the delivery system. Any of the diversions within the Wind/Bighorn River Basin can experience shortages from time-to-time. For instance, in 2001 and 2002, which were drier years than the dry-year used in the modeling hydrology, nearly all diversions within the basins experienced shortages of one degree or another. Therefore, it is best to review this information for the basin as a whole and within the context of the model limitations. Table 2-1 presents a summary of the shortages within each sub-basin model for the Full Supply condition, while Appendix A contains a reach-by-reach summary of shortages. Overall, shortages are more severe in the Wind River basin than in the other basins, with the exception of the Owl Creek basin, especially in dry years. Shortages occur on the mainstem of the Wind River and Little Wind River, and in most tributaries. The Owl Creek basin experiences shortages during all hydrologic conditions at nearly every diversion point. In the remaining portion of the Bighorn basin, shortages are primarily on smaller tributaries. There are very few shortages on the mainstems of the Bighorn, Shoshone, Nowood and Shell Creek. There are significant shortages on the mainstem Greybull River, especially without the influence of the recently completed Greybull Valley Reservoir, which was included in the model construction, but not included in the model runs. It is expected that the reservoir will alleviate most shortages in normal and wet years, with some remaining shortages in dry years. It should also be noted that there was a significant difference in Full Supply diversion requirements compared to historical diversion requirements in the Greybull model, primarily due to differences in the quantity of irrigated lands.
Table 2-1. Summary of Modeled Diversion Shortages – Full Supply
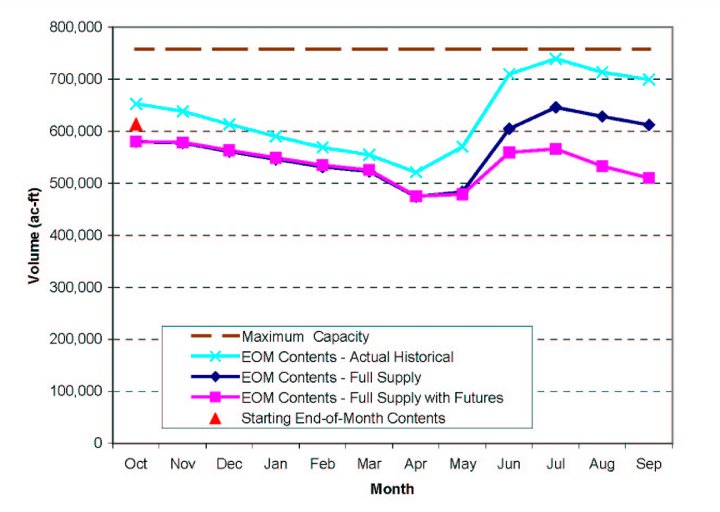
Table 2-2 presents a summary of modeled diversion shortages for the Full Supply Condition with Futures Projects, while a reach-by-reach summary of shortages is presented in Appendix A. The Futures Projects were modeled with a Full Supply diversion requirement of approximately 198,000 acre-feet for those projects within the Wind and Little Wind basins. The Futures Projects would increase shortages within the Wind River basin, not including the Popo Agie, by approximately 205,000 acre-feet in dry years, 70,000 in average years and 39,000 in wet years. The dry year value actually exceeds the diversion requirement because return flows for the North Crowheart Project accrue to the river at locations where they cannot be rediverted by downstream entities such as is the current practice. Downstream of Boysen Reservoir, the model does not show any impacts. This is because Boysen Reservoir acts as a “buffer” between the Wind and Bighorn basins. More storage within the reservoir can be used to meet downstream demands. The model shows, however, as time progresses, there may be more difficulty in filling Boysen Reservoir if all Futures Projects are on-line. A graph depicting storage for the two scenarios during the average year is shown in Figure 2-1. The model starts the reservoir contents the same as historical October beginning-of-month contents. For both the historical and Full Supply simulation, the September end-of-month contents are greater than or approximately equal to the October end-of-months contents, which indicates that the assumption of starting reservoir contents is likely valid. However, the Full Supply with Futures Projects simulated end-of-month contents are less than the October end-of-month contents. Therefore, the assumption of end-of-month contents may not be valid. If this value is continually adjusted downwards to match September end-of-month contents, it is likely that they would not converge. A more detailed carry-over storage analysis is required to analyze the full affects of Futures Projects on storage in Boysen Reservoir. Again, the model limitations should be recognized. The model does not contain a water rights accounting system. In addition, the model does not “operate” storage to meet downstream demands. It simply releases the historical volumes. For instance, in the Futures scenario, additional releases could be made from Bull Lake to meet some Wind River shortages, or additional water could be stored in Boysen Reservoir during peak runoff, which would impact flows downstream of the reservoir during those months.
Table 2-2. Summary of Modeled Diversion Shortages – Full Supply with Futures Projects
Figure 2-1. Simulated End-of-Month Contents for Boysen Reservoir – Average Year Section 3 - Streamflow Streamflow is a fundamental output of any river basin simulation model. The Wind/Bighorn River sub-basin models use streamflow as a calibration measure. This implies that simulated streamflow matches or is very close to measured historical streamflow. The comparison of simulated to measured historical streamflow for historical conditions is presented in the Task 3B/3C Technical Memorandum Spreadsheet Model Development and Calibration (MWH, 2003). The Wind/Bighorn River sub-basin models are configured to allow the simulation of streamflows given variations in model input parameters, such as diversion requirements. Therefore, for the Full Supply and the Full Supply with Futures Projects scenarios, the impacts to streamflows can be shown. Appendix B contains streamflow graphs for dry, average and wet year conditions at various streamflow gages within the basin. Streamflow impacts at any node within the model can be obtained simply by running the model in the desired modes and comparing the “node inflow” on the reach worksheets at the desired nodes. See Task 3B/3C Technical Memorandum Spreadsheet Model Development and Calibration (MWH, 2003) for more information on the reach worksheets in the model. For sake of brevity within this report, only nodes that represent current streamflow gages that are significantly impacted by irrigation diversions are shown in this summary report. Section 4 - Available Flow The available surface water for each basin is defined as the amount of water available for water development after meeting downstream demands. These demands include:
Available flows under the Full Supply scenario for the Wind River Basin, Bighorn River Basin and Clarks Fork, Yellowstone and Madison/Gallatin river basins are shown in Table 4-1, Table 4-2 and Table 4-3. Available flows under the Full Supply with Futures Projects scenario for the Wind River Basin are shown in Table 4-4. As previously mentioned, the model does not show any affects on streamflow due to the Futures Projects (see model constraints). Monthly shortages for all reaches and hydrologic conditions are presented in the appendices. The development of available flows is discussed in the following sub-sections.
Table 4-1. Wind River Basin Available Flow - Full Supply Scenario
Table 4-2. Bighorn River Basin Available Flow - Full Supply Scenario
Table 4-3. Clarks Fork, Yellowstone and Madison/Gallatin Basin Available Flow - Full Supply Scenario
Table 4-4. Wind River Basin Available Flow - Full Supply with Futures Projects Scenario
4.1 Available Flow in Excess of Existing Demands As explained in Technical Memorandum 3B/3C – Spreadsheet Model Development and Calibration (MWH, 2003), the Wind/Bighorn sub-basin models are divided into reaches that represent an individual reach of stream. The available flow is calculated as the minimum of the available flow within the individual reach and the available flow of all downstream reaches. In previous river basin planning models, the available flow within each reach was calculated as the minimum of the outflow from the reach (HKM, 2002). However, it was found that in the Wind/Bighorn sub-basin models, some of the reach outflows were greater than the minimum flow within the reach. Thus, the defining flow availability is the minimum flow within the reach, taking into account compact requirements for the basin and instream flow requirements within the reach. Therefore, for the Wind/Bighorn available flows, the available flow within each reach was taken as the minimum flow at all nodes within the reach. The minimum flow for the individual reach was then calculated as the minimum flow within the reach plus the minimum flow of all downstream reaches. It should be noted that performing these calculations on an annual basis could result in different results than performing the calculations on a monthly basis. The monthly basis is considered more accurate because of the shorter calculation time period. The annual value of available flow is the sum of the 12 months’ available flow. 4.2 Compact Constraints The Yellowstone River Compact, which was ratified in 1950 by the states of Wyoming, Montana and North Dakota, governs the allocation of the tributaries to the Yellowstone River between the states. The following is a brief summary of the rules for dividing water according to the Compact (WWDC, 2002):
The information used in this study to determine the volume of availability under the Yellowstone River Compact is based upon conversations and information from the U.S. Geological Survey and with the Wyoming SEO office (YRCC, 2002). The details of the calculations are described below. 4.2.1 Clarks Fork The Yellowstone River Compact allocates the unallocated flows of the Clarks Fork Yellowstone River as calculated using the guidelines above between Wyoming and Montana. Results are shown in Table 4-5 (WWDC, 2002).
Table 4-5. Yellowstone Compact Allocation Percentages for Clarks Fork
The Yellowstone River Compact Commission calculates the unallocated flows of the Clarks Fork River as follows (YRCC, 2002):
1. The base gage is the Clarks Fork River at Edgar gage (USGS Gage No. 06208500). Based upon the gage flows available from the USGS, the unallocated flow calculation methodology and the Compact percentages, Wyoming’s portion of the unallocated flow of the Clarks Fork was estimated for the dry, average and wet year hydrologic conditions. These results are presented in Table 4-6. These values have been included in the available flow calculations for the Clarks Fork River. To simplify model accounting, the calculations were performed on an annual basis, then pro-rated over the year according the flow pattern at the Clarks Fork near Belfry gage (06207500).
Table 4-6. Calculation of Wyoming Portion of Unallocated flow for the Clarks Fork River
Notes: 4.2.2 Bighorn River The Yellowstone River Compact allocates the unallocated flows of the Bighorn River as calculated using the guidelines above between Wyoming and Montana. Results are shown in Table 4-7 (WWDC, 2002).
Table 4-7. Yellowstone Compact Allocation Percentages for Bighorn River
The Yellowstone River Compact Commission calculates the unallocated flows of the Bighorn River as follows (YRCC, 2002):
1. The base gage is the Bighorn River near Bighorn gage (06294500); Based upon the gage flows available from the USGS, the unallocated flow calculation methodology and the Compact percentages, Wyoming’s portion of the unallocated flow of the Bighorn River was estimated for the dry, average and wet year hydrologic conditions. These results are presented in Table 4-8. These values have been included in the available flow calculations for the Bighorn River. To simplify model accounting, the calculations were performed on an annual basis, then pro-rated over the year according to a weighted monthly flow pattern at the Bighorn River at Kane gage (06279500) and the Shoshone River at Kane gage (06286200). In reality, Yellowtail Reservoir serves to balance out Compact requirements over the year, so there could be some deviation allowed from the monthly requirements.
Table 4-8. Calculation of Wyoming Portion of Unallocated flow for the Bighorn River
4.3 Instream Flow Constraints The Wyoming Water Development Commission permits instream flows for piscatorial uses within the stream reach (Rumsey, 1997). Within the Wind/Bighorn Basin Plan study area, there are four streams with permitted instream flows (one stream with two separate reaches) and two streams with pending instream flow applications. The permitted and pending instream flow reaches and flow rates are shown in Table 4-9 (Brinkman, 2002), while monthly and annual volumetric amounts are shown in Table 4-10. The instream flows are more fully discussed in the Technical Memorandum Recreational and Environmental Uses and Demand (BRS, 2002).
Table 4-9. Permitted and Pending Instream Flow Rates
Table 4-10. Permitted and Pending Instream Flows Volumes
Instream flows exert a demand on the river the same as any other consumptive use water right. Flow must be passed through the instream flow segment according to the water right priority date. Once that flow is through the segment, the water can be diverted for consumptive use. Therefore, available flows for reaches upstream of the permitted instream flow rights are affected assuming that water rights for use of the available flows would be junior to the instream flow rights. All available flow calculations assume that both the permitted and pending instream flow water rights are in place. Therefore, any upstream flows that are not in excess of the instream flow right are shown to be unavailable for future uses. Each of the instream flow segments is within a modeled reach as shown in the table. For purposes of the calculations, it was assumed that the entire reach is subject to the instream flow requirement even if the instream flow segment occupies only a small portion of the reach. The reaches most affected by the instream flow water rights are the Upper Wind River, Shell Creek and Tensleep Creek, especially in the winter months. Section 5 - References Brinkman, Bruce. 2002. Personal communication via e-mail. Contained in Microsoft Excel Spreadsheet entitled WindR-Flows.xls. February 21. BRS, Inc. 2002. “Wind/Bighorn River Basin Overview: Recreational and Environmental Uses and Demand.” Technical Memorandum, Riverton, Wyoming. HKM Engineering Inc. 2002. “Powder-Tongue River Basin Plan Available Surface Water Determination, Task 3D.” Technical Memorandum. February. MWH. 2002. “Wind/Bighorn River Basin Plan Task 3A/3B - Surface Water Hydrology.” Technical Memorandum. Denver, Colorado. MWH. 2003. “Wind/Bighorn River Basin Plan Task 3B/3C - Spreadsheet Model Development and Calibration.” Technical Memorandum. Denver, Colorado. Rumsey, C.J.. 1997. Instream Flow Water Rights: The Process of Appropriation. In Proceeding of Wyoming Water 1997 – What's New in the Toolbox? April 21-23. 1997, Casper, Wyoming, sponsored by the Wyoming Water Resources Center, University of Wyoming. pp. 207-209. Wyoming Water Development Commission (WWDC). 2002. “Yellowstone River Compact, 1950.” Wyoming State Water Plan website. http://waterplan.state.wy.us/BAG/bighorn/briefbook/yellowstone.html Yellowstone River Compact Commission (YRCC). 2002. Information and Communication during Annual Meeting, Cody, Wyoming. December 3. |
||||||||||||