Wyoming State Water Plan
Wyoming State Water Plan
Wyoming Water Development Office
6920 Yellowtail Rd
Cheyenne, WY 82002
Phone: 307-777-7626

Wyoming Water Development Office
6920 Yellowtail Rd
Cheyenne, WY 82002
Phone: 307-777-7626


TECHNICAL MEMORANDUM
| SUBJECT: | Wind/Bighorn River Basin Plan Socioeconomic Factors and Water Demand |
| PREPARED BY: | BRS ENGINEERING |
| DATE: | June 12, 2003 |
Section 1 - Methodological Considerations
Water demand is a function of environmental, economic, demographic, cultural and institutional variables. Among these the first three are primary, but all must be considered if realistic projections are to be made. Credible projections also demand good data, both quantitative and qualitative.
Wyoming is somewhat atypical sociologically, demographically and economically, compared to most other states. The State.s anomalous character is particularly clear in the nature of its economy, which is an outlier in terms of correlation with the national economy: what happens in Wyoming does not necessarily reflect what is happening nationally.1 If the state is anomalous, it seems even more the case in regard to analyses of sub-state entities, such as the counties of the WBHB, which differ in several ways from other regions of the state.
Still, the situations faced by the Basin counties are not unique. A useful approach to economic and social analyses of the Basin is the typology used by the U. S. Department of Agriculture.s Economic Research Service (ERS) to analyze counties. Twenty-one of Wyoming.s 23 counties are classified as .non-metro. by the ERS . Natrona and Laramie are the only two .metro. counties in the state.
According to the ERS there are
The ERS classifies all five WBHB counties as .Federal lands counties.. Federal lands counties (there are 270 thus classified in the United States) are those in which at least 30% of the land is owned by the Federal Government. According to ERS,
In these counties the economic development debate
Regardless of whether or not this is in fact the crucial debate, Federal ownership of more than half the land in the Basin certainly plays a crucial role in economic structure and development, in demographic characteristics, and indisputably in water demand. Beyond land ownership patterns, three other characteristics constrain the Basin.s potential for rapid, diverse economic growth: remoteness from large markets, a small labor force, and relatively underdeveloped transportation and communications infrastructures.
Under these circumstances, shared by most Federal lands counties, jobs in the service industries and in government tend to dominate local labor markets. The ERS notes that,
Many, but not all, Wyoming counties enjoy the presence of healthy minerals-related industries, which typically offer above average pay. When economic development is closely tied, as the Basin.s tends to be, to publicly owned natural resources which are not uniformly distributed across the region, intra-regional differences are often significant. Mineral resources, which have been the WBHB.s major revenue source, whether coal, petroleum or gas, are declining. However, the US Department of Energy.s Energy Information Administration has estimated demand increases over the next two decades of 33% for oil, 62% for natural gas, and for electrical power by 45%.6 Certainly such an increase in demand might spur continuing energy production in the Basin. It could maintain existing jobs and produce new ones in the energy production and distribution, as well as invigorate service industries.
A related issue, difficult to measure or evaluate, is the question of what significant population growth might do to a lifestyle, cherished by many Wyomingites, based on relatively unspoiled and un-crowded natural attractions. Although hard data are few, it seems clear that many Basin residents are not enamored of the thought of the large-scale population increase that might come with high levels of economic growth. What role this reluctance plays in economic development efforts needs to be explored.
In sum, current prospects for significant and diverse growth in the Basin do not appear particularly bright. The Basin is far from out-of-state population centers such as Denver or Salt Lake City, proximity to which boosts the economies of some Wyoming communities and counties. It must be understood that the Basin.s tourism and recreation-based businesses (which produce jobs mainly in the service sector) are enhanced by the very characteristic . remote and relatively .unspoiled. country . that could be most threatened by large-scale economic development. Despite the many similarities among Basin counties, it is instructive to consider demographic and economic differences among them.
It should be noted that a small area in northwest Natrona County lies within the Wind/Big Horn watershed, while a portion of the southeast corner of Fremont County lies outside the Wind/Big Horn drainage, in the Green River drainage. Both these areas are very thinly populated. The people in the Fremont County area are included in the demography of the WBHB Plan, though its water situation is not. In the case of the Natrona County section, its population is not incorporated in the WBHB demographic analysis. Two or three small, generally intermittent streams that head in Natrona County flow into Washakie and Fremont counties. There are also portions of Teton County within the watershed, but they are virtually uninhabited mountain areas. It must be noted that a good-sized but sparsely populated section of southern Fremont County is outside the Wind/Big Horn drainage. The area south of Atlantic City and South Pass City, extending east to Jeffrey City, is drained by the Sweetwater River, which flows eastward to its juncture with the North Platte, in Natrona County. For the purposes of this analysis, it has been assumed that much of the economic activity of this section of Fremont County is closely related to the rest of the County, particularly the Lander area. The population does not exceed a few hundred.
Portions of Yellowstone National Park also lie within the WBHB, but consumptive surface water use within the portion of the Park in the WBHB drainage is limited to one acre foot. This right is for domestic use at the National Park facilities at the East Entrance.7 The majority of water use in Yellowstone Park for domestic and miscellaneous purposes comes from ground water wells. Permitted ground water rights within Yellowstone Park and tributary to the Basin include eight domestic wells with a total water right of 391 g. p. m. or 630.8 acre feet per year if the entire water right was utilized continuously. The only other reported water rights in Yellowstone Park are for monitor wells with no permitted volume of use.
SECTION 2 - DEMOGRAPHIC OVERVIEW
The determinants of demographic change are mortality and fertility rates, and migration patterns. Common methods of projecting populations include time-series, cohort survival, and employment-driven analyses. Projections of Wyoming.s and the Basin.s future populations, however, may best be assessed by time-series and employment-driven analyses.
According to the 2000 US Census, the combined population of the WBHB counties was 86,222 . about 17% of Wyoming.s people. For the Basin, this is an increase over 1990, when the count was 80,562, but below the historic high of 1980, when the census recorded 87,773 Basin inhabitants. Table 1 displays county populations from 1930 to 2000. Park County is the only county never to experience a population decline from one census to the next. Table 2 and Figure 1 present population changes in terms of percentages.
Table 1. U.S. Census, WBHB, 1920-2000
| County | 1920 | 1930 | 1940 | 1950 | 1960 | 1970 | 1980 | 1990 | 2000 |
| Big Horn | 12105 | 11222 | 12911 | 13176 | 11898 | 10202 | 11896 | 10525 | 11461 |
| Fremont | 11820 | 10490 | 16905 | 19580 | 26168 | 28352 | 38992 | 33662 | 35804 |
| Hot Springs | 5164 | 5476 | 4607 | 5250 | 6365 | 4952 | 5710 | 4809 | 4882 |
| Park | 7298 | 8207 | 10976 | 15182 | 16874 | 17752 | 21639 | 23178 | 24786 |
| Washakie | 3106 | 4109 | 5858 | 7252 | 8883 | 7569 | 9496 | 8388 | 8289 |
| WBHB | 39493 | 39504 | 50447 | 60440 | 70188 | 68827 | 87733 | 80562 | 86222 |
Populations 1920-2000
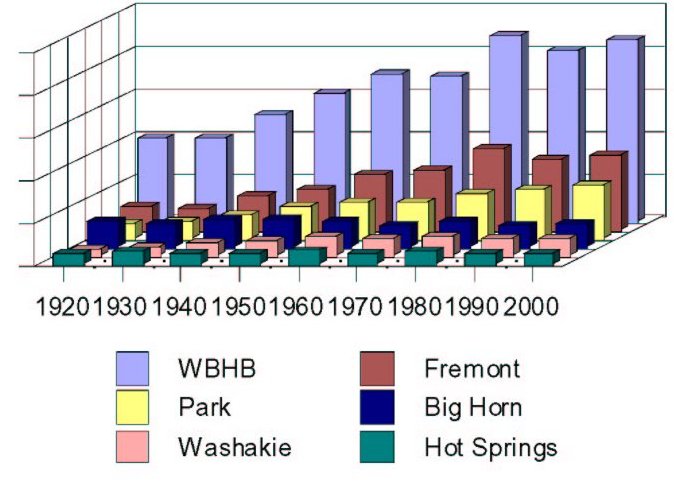
Figure 1
Table 2: Population Change (%) by Decade: WBHB Counties 1920-2000
| County | 1920-30 | 1930-40 | 1940-50 | 1950-60 | 1960-70 | 1970-80 | 1980-90 | 1990-2000 | Mean |
| Big Horn | -7.87 | 13.08 | 2.01 | -10.74 | -16.62 | 14.24 | -13.03 | 8.17 | -1.35 |
| Fremont | -12.68 | 34.82 | -17.80 | 25.18 | 7.70 | 27.29 | -15.83 | 5.98 | 11.28 |
| Hot Springs | 5.70 | -18.86 | 12.25 | 17.52 | -28.53 | 13.27 | -18.74 | 1.50 | -1.99 |
| Park | 11.08 | 25.23 | 27.70 | 10.03 | 4.95 | 17.96 | 6.64 | 10.11 | 14.21 |
| Washakie | 24.41 | 29.86 | 19.22 | 18.36 | -17.36 | 20.29 | -13.21 | -1.19 | 10.05 |
| WBHB | 0.03 | 21.69 | 16.53 | 13.89 | -1.98 | 21.55 | -8.90 | 6.56 | 8.67 |
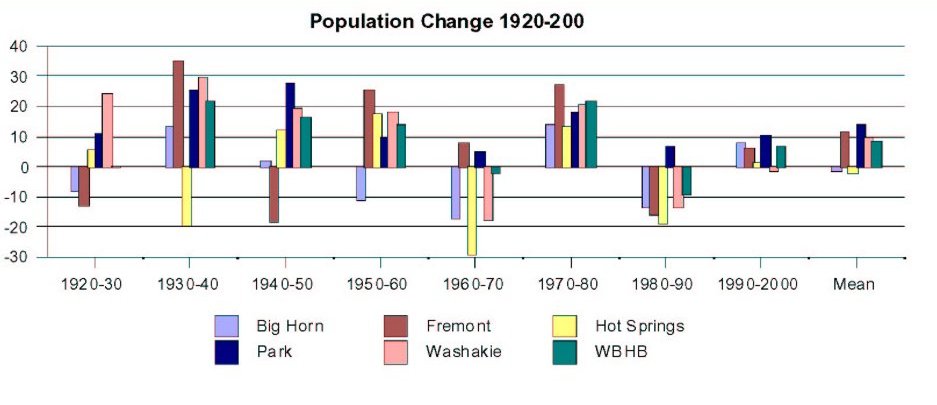
Figure 2
2.1 Historical Demography
Historical data suggest that demographic trends in Wyoming, and in the Basin in particular, are more closely linked to economic variables that stimulate in- or out-migration than to mortality or fertility rates. The national population has increased with each decennial US Census, and Wyoming has followed suit with but one exception . its 1980 census count was higher than that of 1990. Even though Wyoming reached a new population high in 2000, its growth rated lagged those of Colorado, Utah, Idaho and Montana. Its growth was comparable to Nebraska.s and South Dakota.s.
The WBHB.s demography is somewhat different from the State.s. Although, the Basin.s population peaked along with the State.s in 1980, among the Basin counties population highs are scattered across the decades. Big Horn County.s high was in 1950 (13,176), Hot Springs. in 1960 (6,365). Fremont and Washakie experienced population highs in 1980 (38,992 in Fremont; 9,496 in Washakie). Among the Basin counties only Park County.s population peaked (at 25,786) in 2000, along with those of Wyoming and the Nation. The Basin.s 1980 population high preceded by two decades the State.s high (493,782 in 2000), and in the 1960s and 1980s the Basin lost population.
Statistically, despite these anomalies, population trends in Fremont, Park and Washakie counties correlate reasonably well with national and state population trends. In Big Horn and Hot Springs, however, trends do not correlate significantly with each other, the other Basin counties, the state, or the nation. Clearly population dynamics in the Basin differ among counties. If economics is a force in population change, and the Basin counties diverge in that respect, we should expect to find economic differences among the counties.
Since the ways in which the five basin counties differ may not be intuitively obvious, a Basin-wide summary might ignore important variations, which differentially affect the size and structure of county economies and populations, and therefore water demand and usage. Such a summary, therefore, must consider each county separately, as well as the Basin as a whole.
Fremont, Park and Big Horn counties are considerably larger in area than Washakie and Hot Springs. The two smaller counties also differ from the other three in that they each have one dominant population center . Worland and Thermopolis, respectively . while the larger counties all have multiple population centers.
It is not difficult to account for most of the larger population fluctuations. Over the eighty years of change charted in Table 1, it is clear that the post-World War II years were times of rapid growth, as were the latter 1970s, while the Basin-wide population declined or experienced slower growth in the 1960s and later 1980s. Declining or slow growth rates primarily reflect downturns in mining . particularly uranium, oil and gas in Fremont County and coal, oil and gas in Hot Springs and Washakie.
From 1947 to 1960 Wyoming oil production increased 199%, but since 1985 Wyoming oil production has experienced a steady decline in Wyoming. In the latter half of the .80s foreign production cut into the oil market, and an oversupply of petroleum developed, lasting through the 1990s. Despite large increases in natural gas production in Wyoming after 1985, price fluctuations and the fact that there is as yet no development of coalbed methane fields in the WBHB meant that the region profited less than areas of the state with developing methane fields.
Although coal has been mined in the Basin for many years, most production was from underground mines. After the mid-1950s, diminished underground reserves, stronger environmental laws (e.g., Clean Air Act, Water Quality Act, National Environmental Policy Act), competition from surface mines in other areas of the state, and competition from other energy sources rendered the Basin.s coal industry effectively defunct.
2.2 POPULATION FORECASTS
As mentioned above, classical methods of population projection may not be the best way to analyze population changes in the WBHB. Wyoming.s and the Basin.s birthrates are low and the population is aging. Natural population increase will not raise the population by much, if any. Migration is the key factor in the Basin's population growth, and economic changes drive migration.
The number of babies born in Wyoming is the lowest among the states (6,252 in 1998), the state.s birth rate is 40th and its fertility rate 46th among the 50 states.8 Wyoming.s birth rate is consistently below the national rate and Basin counties have been below the state birth rate more than 60% of the time over the past five years. Only Big Horn and Fremont counties have exceeded the state rate. In 1999 Wyoming.s birth rate fell to a record low of 12.8 births per 1,000 population. 9
The Basin.s population is aging: the median age is about 39 years, ranging from about 36 in Fremont County to about 44 in Hot Springs County. The national median age is 35.3. The US Census Bureau ranks Wyoming 6th among the states in growth of the elderly (65+) population. Wyoming.s birth rates are low and death rates are high.
Although the percentages of women giving birth in their 30s and 40s has increased in recent years, data suggest that only heavy immigration of young people can provide a significant boost to Wyoming.s population. A net out-migration of young people constrains the job-skills level of the state and of the Basin, a disincentive for many types of companies to locate in the region, particularly in fields needing .high-tech. skills. This emigration also has an impact on population levels.
Significant immigration of young people to the Basin seems unlikely unless there are changes in the Basin.s fundamental economic pattern, making more and better-paying jobs available. The historic pattern of reliance upon mining, agriculture, and tourism does not offer many such jobs. Since this pattern is long-standing, and because there are no obvious reasons to think it will suddenly change, historic trends may well be the best indicator of the future. Wyoming.s Department of Employment has projected that job growth in Wyoming will be in
Given the inherent volatility in populate changes in the past century (Table 2); forecasting population change over the next 30 years is at best difficult.
2.3 High, Medium, and Low Growth Scenarios
Because the river basin planning process requires the development of water demand projections three decades in the future, it is necessary to project populations for those decades. However, with respect to water demand population changes directly impact only municipal and domestic use. Water demand projection for uses, such as industrial and agricultural, were based on specific foreseeable developments and/or projects, as discussed in subsequent technical memoranda. Over the 80 years examined herein, the Basin.s mean population change per decade is 8.67%. (Wyoming.s population grew by 8.9% during the decade of the 1990s, while the national average was 13.2%.) In the Basin, the two high-growth decades (the 1930s and 1970s) saw a mean increase of 21.62%. The low-growth decades (the 1960s and 1980s) experienced a mean decline of 5.44%. Disregarding the negligible population change of the 1920s (0.03%) and averaging the three remaining in-between levels (the .40s, .50s, and .90s), a moderate growth projection of about 12.33% is derived.
Projections using these coefficients are unrealistic, however, since each county.s history is different and because such differentiation seems likely to continue in the future. It is also the case that a small population experiencing growth will provide percentage figures that are inappropriate for use with larger populations. When populations are small, a slight increase or decrease in numbers constitutes a high percentage, which certainly distorts projections. Nonetheless, it seems unlikely that sustained growth above the .high. multiplier will be reached, Basin wide: in fact, even the .low. history-based multiplier might very well be too high. However, a projection based on each county.s average population change, rather than the Basin average, would seem to lead to somewhat more credible results. Using this method, the Basin.s population projects to 94,508 in 2010, 103,858 in 2020, and 114,407 in 2030 under a moderate growth scenario.
The populations of Big Horn and Hot Springs Counties are not much different in 2000 from what they were in 1930. On the other hand, in that period Fremont and Park Counties have experienced a tripling of population, while Washakie.s doubled despite its decline in recent decades. Fremont County.s growth has slowed greatly over the past two decades, and only Park County has experienced steady, if not spectacular growth, during that time.
The US Census. county projections for the year 2000, using the cohort-component method on data from the 1990 census, turned out to be very close to the mark, overestimating the Basin.s population by only 1,188 persons. Hot Springs County was under-estimated and the other four Basin counties slightly over-estimated. The largest error was in Fremont County, where the actual census was 516 persons fewer than the estimate. 1a
In 1997 the U.S. Census Bureau projected that Wyoming's population would grow by 45 percent (to 694,000) during the thirty year period 1995 to 2025. This is the 11th fastest projected rate of growth in the nation. The projection is strongly driven by immigration. In their high projection the Census Bureau assumed that net immigration to the United States would be 1,370,000. For Wyoming, this projection suggests a 2050 population ranging from 950,000 to 970,000. This would certainly be an historical anomaly for the State, and the Basin.
All things considered, it may be that accurately predicting migration is essential to accurate projections of Basin populations. The quantity and type of migration is shaped by demographic, economic, social and cultural factors. Wyoming.s 1996-1997 immigration pattern (the latest available), derived from research into income tax return changes, shows a net outflow of nearly 3,000 people. Considering regions where the net gain or loss was at least 100 people, Wyoming immigrated more people from California, South Dakota, and foreign countries, than it emigrated to them. Net out-migration from Wyoming of 100 or more people was recorded for eight states: Colorado, Idaho, Texas, Arizona, Utah, Oregon, Oklahoma, and Florida.11 A study of driver.s licenses exchanged and surrendered, shows that the number of licenses issued to people aged 25 and younger declined while those to people over 25 increased. This suggests that .Wyoming seems to be exporting its youth and importing older citizens. . . .. 12
The type of immigration will have cultural impacts. For instance, it may turn out that affluent immigrants, attracted by the quality of life, will actually live in their Wyoming homes only part time, be mostly middle-aged, and be likely to value environmental and recreational amenities above industrial expansion. An energy or minerals boom might bring younger people attracted by available employment, perhaps in a rapidly growing minerals industry. Such immigrants might hold attitudes differing somewhat from those of people whose primary motive for moving to Wyoming is to enjoy its relatively .pristine. environment.
The economic chain of events that may drive immigration at any of the three growth scenarios would surely impact water demand and use. It would, as well, influence the cultural and institutional milieu in which and by which those demands and uses would be shaped. Figure 1 illustrates population changes in Basin counties from 1930 through 2000. There seems to be little historical or economic reason to expect rapid growth in the Basin over the next thirty years. The historic, percentage-based, low, moderate, and high growth demographic scenarios should serve adequately as a planning base.
Table 3, which shows a variety of population projections which could be made utilizing various methods and assumptions. For the purpose of projecting population related changes in water demand (domestic and municipal primarily). The following low, moderate, and high forecasting scenarios are recommended for the purposes of this basin plan.
Low Growth Scenario: The low growth scenario could be projected as a negative growth (projections 1 and 2) or as very slight growth (projection 3). For the purpose of the basin plan it is recommended that for the low growth scenario the population be predicted to remain the same at 86,222 for the next 30 years.
Moderate Growth Scenario: Previous basin plans utilized the state forecast as the moderate growth scenario, for consistency the WY projection (projection 4) will be used as the average growth for the WBHB (88,720 in 2010, 91,620 in 2020, and 94,600 in 2030).
High Growth Scenario: The long term percent change by county averages (projection 8) was used to project the high scenario as this is most representative of the WBHB during both growth and decline periods (94,508 in 2010, 103,858 in 2020, and 114,407 in 2030).
The cohort by census projection could also be used for the high growth scenario. These projections vary by less than one percent over 30 years. It is noted that the projection using the Powder/Tongue growth scenario (projection 6), was presented for comparative purposes. This projection reflects the recent energy boom in that area and is similar to the recommended high growth projection.
Table 3: Results from various projection methods ranging from lowest to highest:
| 1 | 2 | 3 | 4 | 5 | 6 | |
| Current | 86,222 | 86,222 | 86,222 | 86,222 | 86,222 | 86,222 |
| 2010 | 76,293 | 83,423 | 86,571 | 88,720 | 90,684 | 93,713 |
| 2020 | 68,570 | 78,885 | 87,991 | 91,620 | 95,786 | 102,802 |
| 2030 | 62,632 | 74,593 | 90,403 | 94,600 | 101,241 | 112,773 |
| Current | 7 | 8 | 9 | 10 | 11 | 12 |
| 2010 | 86,222 | 86,222 | 86,222 | 86,222 | 86,222 | |
| 2020 | 94,390 | 94,508 | 96,519 | 99,100 | 103,707 | 110,944 |
| 2030 | 103,583 | 103,858 | 105,878 | 111,319 | 126,128 | 143,202 |
| 113,927 | 114,407 | 116,437 | 125,044 | 153,574 | 185,378 | |
Key:
SECTION 3 -THE BASIN.S ECONOMY
The Basin.s economy, like Wyoming.s as a whole, has long depended on a triad of industries: mining (especially coal, oil and gas), tourism, and agriculture. Mining.s annual payroll in Wyoming nearly doubles that of retail trade, the nearest competing sector. In terms of numbers of jobs it trails only retail trade and accommodation, and food services.13 Other economic sectors are, of course, significantly impacted by events in the minerals industries.
The Basin.s economy is dominated by the larger and somewhat more diverse economies of Fremont and Park counties, which together account for about 60% of the Basin.s land area and 72% of its population. In recent years these counties have accounted for 60% to 80% of retail tax collection in the Basin.14 This disparity among counties is not unusual: .a third of all rural counties captured three-fourths of all rural economic gains in the 1990s..15 Statistical analysis indicates that Fremont County.s population trends are the strongest factor in, and the best indicator of, the Basin.s overall demographic trends.
Despite the economic dominance of Park and Fremont counties, Washakie County had (according to the 1997 model-based US Census estimate) the highest median household money income ($36,386) among the WBHB counties, while Big Horn County, despite its third-place rank in household money income, had the highest home-ownership rate among the WBHB counties. Fremont County has the lowest median household money income, slightly lower than that of Hot Springs County, however, Fremont County.s statistics include the Wind River Indian Reservation, where very high unemployment has been the norm. Data such as this tell us that the Basin.s socioeconomic structure is not simple, and warns against being too simplistic in the analyses of the Basin as a whole.
As is typical in Federal lands counties, government (in its national, state and local forms) accounts for more Basin jobs than any other category with the exception of the service industry. Government jobs, at least at federal and state levels, are among the better paid in the Basin. In 1998 there were 13,893 jobs in the service industry, Basin-wide, and 9,927 government jobs. Retail jobs (part of the service industry) numbered 9,086, while mining provided 2,446.16 Yet it must be remembered that in general mining jobs are more highly paid than most other jobs in the region, and the multiplier effect of mining supports many other industries. Mineral royalties help fund state and local agencies and projects, notably including schools.
3.1 Mining
In Wyoming the peak years for oil production were 1959 to 1976, while gas production began a steep upward climb about 1976, and is still rising. Coal has experienced three major production booms . from the late 1880s until the early 1920s, during World War II, and an ongoing boom that began about 1969.17
Uranium mining began in Wyoming in the 1950s, Significant uranium mining districts of Wyoming include the Gas Hills located in the Wind River Basin, the Powder River Basin,
Shirley Basin, Crooks Gap, Poison Basin, and the Great Divide Basin. The industry peaked, producing uranium for the Atomic Energy Commission (AEC), around 1960. As AEC stockpiling slowed to a halt about 1964, the industry .crashed.. From 1964 to 1972 a transition occurred as private sector demand, mostly for power plants, developed. Increasing oil prices, spurred by the embargo of 1974, helped uranium markets rise to another peak around 1978-80. Oversupply, compounded by the aftermath of the Three-Mile Island event, brought on another crash in uranium markets from 1982 to 1984. The future for uranium mining appears to be in-situ development, in which wells, rather than open-pit mines, produce the ores. Non-potable ground water is re-injected into ore seams as part of a reverse osmosis process, resulting in a net consumptive loss of only 5% or so. Although some of this activity will take place in Fremont County, most of it is and probably will continue to be in the Powder River Basin, rather than in the Wind River Basin.18
Over the years the WBHB, as well as the state generally, benefited from mining booms: there has been oil, gas and coal production in the Basin for more than a century. However, Wyoming.s currently healthy mining activities (coal, coalbed methane, uranium or trona) have little positive impact on the Basin.s economy. In fact, the availability of jobs in the methane-booming Powder River Basin, as well as in southwest Wyoming, is draining working-age people from the Wind/Big Horn region.
Despite the vicissitudes of minerals production, mining (oil and gas) in the WBHB generally offers better-paid jobs than most other industries and remains the Basin.s economic foundation. With out the development of a major new industry in the Basin, population size will continue to be strongly related to the economics of mineral production. Table 4 provides an overview of the Basin.s mining industry.
Table 4: Mining in WBHB Counties
| County | # of Employees in industry (1998) | % of all employees (1998) | Mean Per Capita Income ($) (1998) | Per Capita Mining Income ($) (1998) | Mining Jobs gain or loss 1990-1998 |
| Big Horn | 807 | 13.0 | 17759 | 29612 | +637 |
| Fremont | 559 | 2.8 | 19113 | 25943 | -44 |
| Hot Springs | 139 | 4.5 | 21488 | 47410 | -92 |
| Park | 600 | 3.5 | 23231 | 30627 | -361 |
| Washakie | 341 | 6.3 | 21347 | 12014 | +151 |
| WBHB | 1639 | 3.1 | N/A | N/A | +291 |
For more information refer to tab 21 .Industrial and Mining Water Demand and Projections.
3.2 Tourism and Recreation
Tourism ranks as the second industry in the Basin. Park County dominates the Basin.s tourism industry . 77% of the Basin.s lodging tax is collected in Park County. Fremont County collects another 14%, leaving only 9% to be collected in the other three counties. Recreation spending is not all from tourists, but in this accounting, recreation money spent by Wyoming residents is included with that spent by tourists. Park County is far and away the largest recipient of tourism and recreational spending in the Basin.
Much of the employment created by recreation and tourism is relatively low-paid, and often seasonal. Although tourism and recreation industries do not portend much population growth for the Basin, there is little doubt that these opportunities do spur immigration, and keep people in the Basin who might otherwise leave.
Fishing is the most significant water-based recreational activity in the State, as it is in the WBHB. In 1998 resident anglers put $308 million into Wyoming.s Economy, while non-residents contributed $184 million.19 The Wyoming Game and Fish Department reports, that sport fisheries in the state accounted for nearly 4.6 million recreation days, with an economic return of about $139 per day.20 The number of recreation days accounted for by residents far exceeds those of visitors. Fishing outfitters and guides operate out of many Basin locations, including Dubois, Lander, Riverton, Cody, Powell and Thermopolis. Numerous stores throughout the Basin sell fishing tackle, bait, and other supplies for anglers.
In the year 2000 more than 30,000 non-resident fishing licenses were sold in the Basin.s five counties, along with nearly 21,000 resident permits. This represents about a nine percent increase in total license sales, compared to 1995. All of the increase came from non-resident sales, since resident sales actually declined slightly. Park and Fremont counties attracted the largest shares of non-resident and resident anglers. Many anglers in Basin waters purchased their licenses in other counties.
Table 5 helps illuminate the character of the Basin.s tourism and recreation industries. Since fishing is by far the most important water-based recreational activity, the ratio of non-resident to resident fishing licenses sold in each county is shown, illustrating the significant role played by visitors.
Table 5: Tourism and Recreation in WBHB Counties
(percentage totals may not sum to 100 due to rounding)
| County | % of Basin.s total lodging tax collected (2001) | % of Basin.s retail tax collected (2001) | Fishing Licenses Sold (2000) | % Non Resident Licenses (2000) |
| Big Horn | 1.6 | 6.7 | 4058 | 47.7 |
| Fremont | 14.1 | 32.6 | 18185 | 54.1 |
| Hot Springs | 5.0 | 4.3 | 2916 | 52.5 |
| Park | 76.9 | 29.9 | 21874 | 68.1 |
| Washakie | 2.4 | 26.4 | 4280 | 50.3 |
Hunting is also dependent on water, whether big game or waterfowl. Irrigation water helps provide habitat for many upland game birds, as well as helping to maintain many riparian areas. Irrigated fields and pastures are an important source of food and cover for many animals and birds.
For more information refer to tab 22 .Recreational and Environmental Demand and Projections.
3.3 Agriculture
Among the five WBHB counties, the value of agricultural sales is highest in Park County, and second highest in Fremont County. In terms of agricultural sales, Park County is fourth and Fremont County fifth in the State. For the State of Wyoming, covered employment in agriculture constitutes only 1.5% of the state total. The proportion is larger in the Basin. In terms of the proportion of jobs agriculture provides, Big Horn, Washakie and Hot Springs counties are more dependent on agriculture than either Park or Fremont counties. In Big Horn County, for instance, 9.4% of all jobs are agriculturally related, while in Park the figure is 3.7%. The trend in agricultural employment is down in all but two of Wyoming.s Counties, Albany and Fremont Counties, the increase in those counties is due to more proprietors rather than more hired workers.21 Table 3 displays basic information about the Basin.s agriculture industry. It should be noted that the numbers given are subject to some debate both in terms of accuracy and meaning.
In 2000 the total value of the output of the Agricultural Sector in Wyoming was $954,360, 75% of which was from sales of cattle and calves. Sugar beets were the number one crop in terms of sales, followed closely by hay, as these two crops accounted for $97.6 million. Cash Receipts from crops, in 2000, were $136.2 million statewide, while livestock, including products (milk, eggs, wool, honey, etc.) brought in $774.1 million. Net farm income was $114.2 million. In 2000, Wyoming.s farm exports were valued at $37.5 million, about four percent of the $954 million total cash agriculture receipts. Clearly agriculture remains one of Wyoming.s premier industries, but the number of jobs and the net profit for operators are not high.
Table 6. Agriculture in the WBHB Counties
| County | Acres of Irrigated Farmland (year 2000 - Wyo Ag Statistics 2001) | Number of Farms (Wyo Ag Statistics 2001) | Value of Livestock ($ million)(Wyo Ag Statistics 2001) | Value of Crop Production ($ million)(Wyo Ag Statistics 2001) | Assessed Value of Ag lands ($ million, 1998) | Leading Crops(excludes pasture & hay other than Alfalfa) | Number of Ag Jobs (total, including proprietors; 1997) |
| Big Horn | 88,300 | 495 | 43.4 | 33.2 | 8.9 | Alfalfa, Barley, Sugar Beets | 685 |
| Fremont | 109,800 | 983 | 96.9 | 30.3 | 7.5 | Alfalfa, Oats, Sugar Beets | 1092 |
| Hot Springs | 18,500 | 147 | 22.2 | 2.4 | 2.1 | Alfalfa, Oats, Barley | 182 |
| Park | 98,900 | 588 | 54.7 | 35.9 | 9.0 | Alfalfa, Barley, Sugar Beets | 776 |
| Washakie | 45,500 | 205 | 24.8 | 16.6 | 4.4 | Barley, Alfalfa, Sugar Beets | 311 |
| WBH | 361,000 | 2,418 | 242 | 118.4 | 31.9 | Alfalfa, Barley, Sugar Beets | 3,046 |
For more information refer to tab 19 .Agriculture Water Demand Projects.
SECTION 4 -ECONOMIC GROWTH REQUIREMENTS
If high population growth is to take place a number of economic pieces must fall into place. The ERS analysis suggests four important areas in which improvements might help a rural area grow economically.
Even with effective responses to challenges that face the WBHB, significant growth will be difficult to attain. Moderate or low growth rates are no doubt more likely than high level growth, barring a currently unforeseen event such as a sizable boom in minerals production.
In terms of moderate growth, there are two possible scenarios. One would be for parts of the Basin to move even more toward the Retirement-Destination typology. Some areas in the South and West .have experienced 15 percent or more immigration of people age 60 and older in the 1980s..22 Several areas in the Basin have been able to attract some relatively affluent people seeking a more rural lifestyle. To some extent retirees have always been attracted to communities in the Basin. All of the Basin.s counties have areas that could attract this type of immigrants. The second scenario for moderate growth is moderate expansion of existing Basin industries. There are examples of such expansion already in the Basin, but the scale has been relatively modest. Barring trends like these, it would seem likely that population and economic growth will continue at modest rates in the Basin for the foreseeable future.
SECTION 5 - THE WIND RIVER INDIAN RESERVATION
No assessment of the WBHB.s future is complete without consideration of the 2.2 million acre Wind River Indian Reservation. Home of the Eastern Shoshone and Northern Arapaho Tribes, the Reservation is located mostly in Fremont County as well as a relatively small area in Hot Springs County. Much of the Reservation is mountainous. Its eight watersheds incorporate around 365 lakes and reservoirs, collectively containing more than 100,000 acre feet of water, and about 1,100 miles of streams and waterways. Many of these waters provide good fishing.
The population within the Reservation numbers more than 20,000 persons, of whom fewer than half (around 7,500) are Native Americans. It is estimated, that the annual population growth rate of Native Americans in the Reservation area is around three percent.23
Most tribal income comes from mineral extraction, mainly oil and gas. Tribal leaders are concerned about social problems affecting their young people as well as a lack of economic opportunity, and are anxious to promote economic development on the Reservation. This could mean higher levels of water consumption, especially if more land were brought under irrigation.24 The Arapahos, particularly, perceive a shortage of housing and in some areas are experiencing increasing problems with domestic water supplies, such as poor quality water and contamination of individual wells.25
Several reservoirs have been constructed on the Reservation. Enlargements and new dams are being planned as the Tribes explore potential new beneficial uses of their water resource. For the most part, Reservation land (around 1.7 million acres) is under the joint control of the Shoshone and Arapaho Tribal Councils. Water and other natural resources are jointly owned by the two tribes. The Tribes have adjudicated rights to 500,000 acre-feet of water, however, this right is tied primarily to agricultural use and could not be converted to other uses without state concurrence26. Much of the water allocated for current use is not actually used but lost on the Reservation, due to leakage resulting from the poor condition of water distribution and conveyance infrastructure in many areas.
In respect to ground water, the 1983 Decision of the District Court of Wyoming.s Fifth Judicial District concluded that:
Further it should be noted that there are currently .at least 19 ongoing adjudications in 10 states, involving at least 52 tribes..28 Issues of sovereignty between Indian Nations and local and state entities are not uncommon and are difficult to resolve.
SECTION 6 - WATER DEMAND
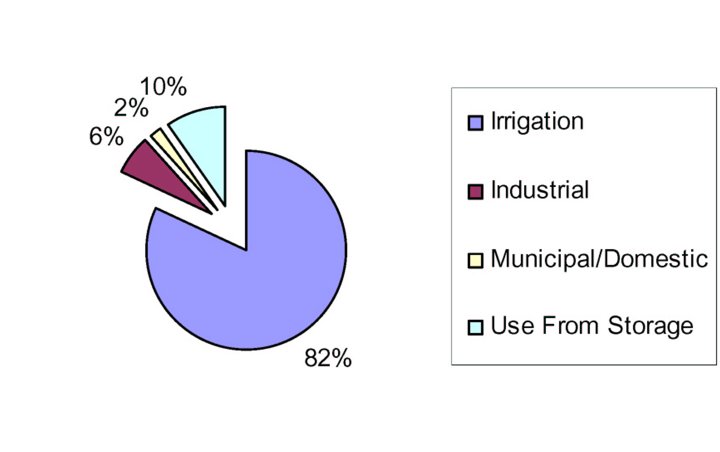
In Wyoming and in the WBHB, agriculture is the largest water user. As shown in Figure 3, Agriculture accounts for some 82% of the water use in the basin followed by water use from storage (evaporation) at 10%, industrial water use at 6%, and municipal and domestic use at 2%. In contrast, agriculture accounts for only 1.5% of employment. With respect to water demand, population growth or decline has direct effects only on municipal and domestic use (2% of total water use) and, thus, has little effect on overall water demand. Changes in water demand with respect to agricultural and industrial use are related to other factors such as the location and availability of natural resources and the market/economics of the products and/or industries. As a result, water demand forecasts presented in subsequent technical memoranda were based on foreseeable industrial and/or agricultural developments for theses sectors. Finally, although recreational and environmental demand is related to population, this use is non-consumptive and does not affect overall water demand.
Water demand by sector of use is further discussed in the following technical memoranda:
.Agricultural Water Demand Projects. Chapter 4, Tab 19.
.Municipal and Domestic Water Demand Projections., Chapter 4, Tab 20.
.Industrial and Mining Water Demand and Projections., Chapter 4, Tab 21.
"Recreational an Environmental Demand and Projections., Chapter 4, Tab 22.
Figure 3: Overview of water users in the WBHB.
When quantifying how much water is available to the largest part of the Basin, most of which comes from the Wind/Big Horn River and its tributaries, Federally reserved rights must be considered, especially those of the Wind River Indian Reservation, .as well as federal land agencies..29 However, even with the subtraction of the half-million acre-feet of Indian rights, there would still be enough water in climatically normal years to accommodate population growth at the high level. Droughts could create problems that might engender more focus on ground water. Ground water already supplies some municipalities and various WWDC sponsored projects are in progress to continue the development of ground water resources for municipal and domestic use.
There remains the question of the capacity of current municipal and domestic water systems to handle high levels of growth. This capacity varies from location to location. Some localities have current shortages while others would require additional facilities to support population growth. The modest size of likely population increases do not appear to pose extreme problems in this regard. Another factor that might be of importance is that most water systems, currently, do not take measures to encourage conservation of water . providing such encouragement would probably help minimize waste.
SECTION 7 - INSTITUTIONAL CONSIDERATIONS
Public ownership of a major proportion of Basin lands, environmental legislation and regulation, Wyoming water law, and interstate compacts are important institutional factors affecting water demand and development. (Refer to Chapter 1, Tab 3 Technical Memoranda)
The Wind River Indian Reservation, with its early and large water right and need for economic development, may play a significant role in future water availability, demand and distribution throughout the Basin. Tourism and recreation, minerals exploration and production, municipal, industrial, and agricultural interests, all present management issues. Agriculture has long been influential in the Wyoming Legislature, this is reflected in numerous statutes, regulations and policies. Agriculture also has longstanding issues with public land management agencies, especially but not exclusively, with federal agencies.
Although conflicts between ranchers, governmental agencies, environmental groups and outdoor recreational interests are longstanding, in recent decades pressure to limit grazing on public lands has increased. Protection and sometimes re-establishment of endangered or threatened species has added to the complexity of administering these lands. Minimum stream flows aimed at protecting and enhancing fisheries and riparian zones, more rigorous limits on Total Maximum Dissolved Solids and Fecal Coliform Bacteria concentrations, and other standards and requirements have been introduced, strengthened and enhanced. All these measures affect agricultural, and sometimes other interests, such as municipal water supplies.
Chapter 1, Tab 3, Technical Memoranda, .Institutional Consideration and Constraints. discusses in greater detail the potential impacts to water development projects with respect to:
Endnotes
1aThe Census. cohort-component method, .is based on the traditional demographic accounting system:
P1 = P0 + B - D + DIM - DOM + IIM - IOM, where P1 = population at the end of the period; P0 = population at the beginning of the period; B = births during the period; D = deaths during the period; DIM = domestic in-migration during the period; DOM = domestic out-migration during the period; (Both DIM and DOM are aggregations of the State-to-State migration flows); IIM = international in-migration during the period; IOM = international out-migration during the period..
1.The Relationship between the Tenth District Economy and the National Economy,. Tim R. Smith, Economic Review, 4th Quarter, 1996, Federal Reserve Bank of Kansas City.
2http://www.ers.usda.gov/publications/aib710/aib710f.htm.
3http://www.ers.usda.gov/Briefing/Rurality/Typology/index.htm.
4http://www.ers.usda.gov/publications/aib710/aib710k.htm.
5Ibid.
6http://www.eia.doe.gov/oiaf/aeo.
7John Barnes, Wyoming State Engineer's Office,"Partial Interlocutory Decree for the General Adjudication of Surface Water Rights."
8 National Vital Statistics Report, Vol. 48, No. 3, March 28, 2000.
9 Wyoming State Department of Health, Table: .Births and Rates by County of Residence, Wyoming, 1996-2000."
10 Wyoming Department of Employment, Research and Planning Outlook 2000: Detailed Occupational Projections and Labor Supply, October 2000.
11 Wyoming Division of Economic Analysis.
12 Wyoming Housing Database Partnership, Final Report, September 2001.
13 U.S. Census Bureau, 1997 Economic Census.
14 Wyo. Department of Revenue.
15.Beyond Agriculture: New Policies for Rural America,. Mark Drabenstott, Federal Reserve Bank of Kansas City . www.kc.frb.org.
16 Wyoming Economic Analysis Division.
17 University of Wyoming, .Economic Trends in Wyoming.s Mineral Sector..
18 Doug Beahm, BRS Engineering, personal communication, Feb. 28, 2002.
19 Wyoming Game & Fish Press Release, 6 Aug 2000.
20Ibid.
21.Trends in Wyoming Agriculture: Agricultural Employment (1969-1997)., Foulke, Coupal, and Taylor, UW College
of Agriculture, Cooperative Extension Service, October, 2000.
22 ERS,-.Retirement Destination Counties,. op. cit.
23.Wind River Indian Reservation: Municipal, Rural, and Industrial Water Supply Needs Assessment (Draft Report)., US Bureau of Reclamation, Great Plains Region, January 1996.
24Personal Interview, Gary Collins, Wind River Reservation Water Engineer, 24 Jan., 2002.
25 .Wind River Indian Reservation,. US Bureau of Reclamation, 14.
26Wind River Water Resources Control Board, 1994, .Wind River Irrigation Project Assessment and Plan,. p. 25.
27Decision Concerning Reserved Water Right Claims By and On Behalf of The Tribes of the Wind River Indian Reservation, Wyoming, May 10, 1983, pg. 8.
28Ad Hoc Group on Indian Water Rights - Congressional Briefing: Background & Status of Indian Land & Water
Claims; Mike Connor - Director, DOI Indian Water Rights Office, April 24, 2001.
29Bighorn River Basin (Overview) HUC# 100800.