Wyoming State Water Plan
Wyoming State Water Plan
Wyoming Water Development Office
6920 Yellowtail Rd
Cheyenne, WY 82002
Phone: 307-777-7626

Wyoming Water Development Office
6920 Yellowtail Rd
Cheyenne, WY 82002
Phone: 307-777-7626


Agricultural water use represents the vast majority of water use within the Wind/Bighorn River Basin planning area. Because of this, accurate estimation of agricultural water use within the basin is essential in producing an accurate model and calculating water availability. Water use by agriculture is a function of many physical and managerial functions including the quantity of land irrigated, crop types, conveyance mechanisms, irrigation types and management styles.
The model requires the historical diversion requirement for each point of diversion. Then, the model calculates the historical amount of consumptive use using irrigation efficiencies and returns non-consumptive demands back to the river according to surface water accretion functions, or lags. Then, because the amount of land historically irrigated is less than the amount of land with water rights, full supply diversions are modeled, where all irrigated lands with water rights are supplied from the existing water supplies. The development of historical diversions (both measured and estimated) as well as fully supply diversions are discussed in the following sections.
Section 2 - Historical Diversions
Historical diversions are used as input for the model calculation and calibration process. Therefore, based upon criteria used in previous river basin plans, historical diversion records were obtained for all diversions greater than 10 cfs. Diversions greater than 10 cfs are explicitly included in the model as separate diversions, while those less than 10 cfs are .lumped. with other small diversions less than 10 cfs that divert in the same reach of stream. Diversion records and the reduction of the diversion records for use in the model is discussed in this section. Estimated historical diversions for those diversions without diversion records are discussed in Section 3 . Estimated Historical Diversions.
Diversion records were collected from the State Engineer.s Office Division 3 Hydrographer.s Reports and USGS gaged flow, as detailed in the Technical Memorandum Wind/Bighorn River Basin Plan Irrigation Diversion Operation and Description (BRS, 2003b). Two types of records are available:
The reduction of daily data simply used the daily average diversion flow rate and converted it to a volumetric amount. Any missing daily data was estimated from the available data before and after the missing data using linear interpolation. Then, the daily volumetric amounts were summed for a monthly diversion. For most data in the Hydrographer.s reports, this is already done and these values were used.
The reduction of spot data involved a similar process. Data for days not measured was linearly interpolated from the available data. Starting and ending dates for irrigation seasons were taken from Consumptive Use and Consumptive Irrigation Requirements in Wyoming (Pochop, 1992). The daily flow values were then converted to monthly volumes and summed for each month.
Monthly diversions estimated from the daily and spot data were used to develop dry, average and wet year diversions. The development of dry, average and wet years, as well as the index gages for each basin are described in Technical Memorandum 2A/2B Surface Water Hydrology(MWH, 2002). In general, the 1973-2001 period-of-record was used for hydrologic calculations. Based upon selected index streamflow gages, which generally represent undepleted flows, dry years were defined as the driest 20 percent of years, average years were the middle 60 percent, and wet years were wettest 20 percent of years, as defined by the total annual flow at the gage.
To reduce diversion data, the monthly average of all available diversion data was taken for all years within the hydrologic condition. Unlike the gaged flow records, years without data were not filled. Therefore, occasionally, there are diversions with records in one hydrologic condition and not another. In this case, the estimated actual diversion methodology was used for the missing data. This primarily occurred only for smaller diversions.
Occasionally, calibration of the model required that the measured historical diversions be reduced to maintain mass balance in the model. This was accomplished using the same techniques as described in Section 4 . Full Supply Diversion Requirements.
A summary of the measured data as used in the model for each basin is presented in Table 2-1, Table 2-2 and Table 2-3, while the monthly measured diversion data is shown in Appendix A. There are very few diversions with long periods-of-record within the Wind River Basin, especially on the Wind River Reservation. It should be noted when reviewing the historical diversion data that some of the measurement points presented are at locations within a delivery system and do not necessarily represent additional diversions from the river. For instance, a large portion of the Dry Creek Canal diversion comes from the Dinwoody (feeder) Canal. Therefore, the values presented in the tables cannot simply be summed to find the diversion for the entire basin. Those canals that act as feeder canals for other diversions must be noted and the appropriate volume of water taken out of the receiving canal. This can be difficult for those feeder canals that also deliver water to irrigated lands along their routes and thus, this has not been done for presentation purposes. However, these are taken into account in the modeling through the actual structure of the model by setting return flow values and locations so that the appropriate amount of water is delivered to the receiving canal.
Table 2-1. Summary of Historical Diversions for Yellowstone and Clarks Fork Basins
| Annual Historical Diversions (ac-ft) | |||||
| Sub-Basin | Diversion Name | Period-of-Record Average | Dry-Year Average | Normal-Year
Average | Wet-Year Average |
| Yellowstone | N/A | --- | --- | --- | --- |
| Clarks Fork | BennettCreek | 3,009 | 1,906 | 3,015 | 3,588 |
| Little Rocky | 3,350 | 2,463 | 3,540 | 2,931 | |
Table 2-2. Summary of Historical Diversions for Wind River Basin
| Annual Historical Diversions (ac-ft) | |||||
| Sub-Basin | Diversion Name | Period-of-Record Average | Dry-Year Average | Normal-Year
Average | Wet-Year Average |
| Upper Wind | Dinwoody Canal | 21,367 | (1) | 31,341 | 6,052 |
| Dry Creek Canal | 50,825 | 55,667 | 50,580 | 47,375 | |
| Johnstown Canal | 6,490 | 7,682 | 5,927 | 6,022 | |
| LeClair Canal | 76,703 | 72,159 | 76,351 | 75,901 | |
| Lefthand Canal | 7,405 | 10,257 | 6,310 | 6,087 | |
| Riverton Valley Canal | 33,472 | 36,160 | 32,498 | 32,471 | |
| Upper Wind River A Canal | 17,296 | 19,557 | 18,380 | 15,526 | |
| Wyoming Canal | 355,542 | 294,587 | 370,754 | 353,173 | |
| Little Wind | Coolidge Canal | 26,940 | 26,940 | (1) | (1) |
| Ray Canal | 53,119 | 44,740 | 52,808 | 52,823 | |
| Sub-Agency Canal | 28,970 | 28,970 | (1) | (1) | |
Notes:
- No data available for the hydrologic year. Diversion estimated using techniques described in Section 4 -
Full Supply Diversion Requirements.
Table 2-3. Summary of Historical Diversions for Bighorn River Basin
| Annual Historical Diversions (ac-ft) | |||||
| Sub-Basin | Diversion Name | Period-of-Record Average | Dry-Year Average | Normal-Year
Average | Wet-Year Average |
| Upper Bighorn/ Owl Creek | Ackerman | 1,516 | 147 | 2,082 | 1,223 |
| Baylor-Purvis-Thompson-Farmer | 1,521 | 181 | 1,561 | 1,890 | |
| Big Horn Canal | 148,437 | 134,455 | 146,448 | 158,822 | |
| Bluff Canal | 33,375 | 31,549 | 33,774 | 32,098 | |
| Brassington | 2,166 | 6,061 | 833 | 1,511 | |
| Caledonia | 1,944 | 957 | 2,929 | 1,605 | |
| Chessington-Wilson | 1,514 | 368 | 1,529 | 1,706 | |
| Hale | 1,185 | 64 | 1,212 | 1,586 | |
| Highland Ditch | 9,484 | (1) | 9,256 | 9,644 | |
| Highland Hanover | 30,409 | 34,660 | 32,103 | 28,500 | |
| Kirby Canal | 18,416 | 16,777 | 17,932 | 20,967 | |
| Lower Hanover Canal | 48,810 | 49,622 | 47,706 | 50,198 | |
| Lower Lucerne Canal | 11,183 | 12,571 | 11,003 | 10,699 | |
| Padlock | 1,781 | 780 | 1,862 | 2,118 | |
| Sliney and Mikkleson/Sliney No. 1 | 3,268 | 922 | 3,122 | 3,781 | |
| Tenderfoot | 2,023 | 415 | 2,595 | 1,723 | |
| Upper Hanover Canal | 151,046 | 139,552 | 149,403 | 155,958 | |
| Upper Lucerne Canal | 10,177 | 11,241 | 10,252 | 9,556 | |
| Woodward-Johnson | 1,454 | 319 | 1,423 | 1,844 | |
| Nowood | Anita | 6,089 | 6,705 | 6,264 | 5,043 |
| Anita Supplemental | 2,048 | 2,900 | 1,970 | 1,453 | |
| Bernstein | 2,342 | 2,769 | 2,346 | 1,896 | |
| Big Bear Enl. | 2,469 | 2,815 | 2,350 | 2,839 | |
| Elk | 2,168 | 2,722 | 2,083 | 2,106 | |
| George & Bayne | 2,590 | 3,429 | 2,471 | 2,199 | |
| Go Ahead | 2,285 | 2,685 | 2,262 | 1,985 | |
| Harmony | 2,759 | 3,719 | 2,696 | 2,056 | |
| Highland | 3,491 | 4,096 | 3,446 | 3,210 | |
| Shafer | 3,108 | 3,175 | 3,349 | 2,270 | |
| Van Alstine (Avent) | 7,178 | 8,328 | 7,078 | 6,738 | |
| Western | 2,049 | 2,196 | 2,246 | 1,485 | |
| Greybull/Dry | Agrarian | 8,663 | 5,198 | 9,133 | 9,856 |
| Arnold | 2,776 | 1,758 | 2,970 | 3,046 | |
| Ashworth #2 | 2,776 | 1,758 | 2,970 | 3,046 | |
| Avent | 4,673 | 4,338 | 4,995 | 4,446 | |
| Beck and Allen | 5,473 | 5,659 | 5,225 | 5,568 | |
| Bench Canal | 55,408 | 39,435 | 56,971 | 63,395 | |
| Borner & Harvey (Borner) | 1,847 | 1,841 | 1,914 | 1,769 | |
| Brown (Croxall and Brown) | 4,877 | 4,260 | 4,975 | 5,074 | |
| Butte | 1,051 | 752 | 1,341 | 834 | |
| Cheeseman | 2,878 | 1,931 | 3,191 | 2,942 | |
| Cockins | 2,778 | 2,409 | 3,122 | 2,522 | |
| Dodge | 2,844 | 2,020 | 3,144 | 2,877 | |
| Dyer | 3,384 | 2,180 | 3,326 | 4,043 | |
| Fairview | 11,794 | 4,339 | 10,120 | 13,865 | |
| Farmer's Canal | 53,149 | 43,690 | 53,717 | 58,422 | |
| German | 3,783 | 2,387 | 3,837 | 4,423 | |
| Greybull | 2,667 | 937 | 2,949 | 3,182 | |
| Hurlbut | 3,127 | 4,514 | 2,675 | 2,988 | |
| J.F.W. | 5,827 | 4,497 | 5,133 | 6,743 | |
| Jimmerfield | 2,216 | 1,429 | 2,657 | 2,049 | |
| Jimmerfield-Roach | 4,573 | 3,412 | 4,558 | 4,777 | |
| Keystone | 4,711 | 3,418 | 4,813 | 5,208 | |
| Meyers | 2,595 | 1,749 | 2,600 | 3,009 | |
| Moss & Long Hollow | 1,005 | 918 | 1,211 | 798 | |
| Only Chance | 1,746 | 399 | 1,657 | 2,532 | |
| Pappapau | 3,775 | 4,196 | 4,514 | 2,616 | |
| Perkins | 9,607 | 6,802 | 8,931 | 10,425 | |
| Rocky | 2,766 | 1,620 | 3,138 | 2,873 | |
| Ruby | 1,623 | 843 | 2,032 | 1,507 | |
| Sandstone | 6,768 | 3,995 | 7,517 | 7,332 | |
| Snyder (Nichols) | 2,694 | 1,735 | 2,796 | 3,044 | |
| T.L. | 2,924 | 1,981 | 3,101 | 3,185 | |
| Tatman-St. Joe | 7,751 | 4,387 | 6,910 | 8,530 | |
| Watson | 1,604 | 1,319 | 1,878 | 1,399 | |
| Whitney Gleaver | 699 | 580 | 779 | 671 | |
| Winkle & Benbrooke | 2,111 | 1,196 | 2,395 | 2,204 | |
| Woods and Burnett | 8,233 | 6,542 | 8,897 | 8,462 | |
| Shoshone | Cody Canal | 66,117 | 52,674 | 66,892 | 72,828 |
| Deaver-Frannie Canal | 89,491 | 77,363 | 82,381 | 93,265 | |
| Elk Lovell Canal | 99,694 | 88,709 | 102,861 | 103,419 | |
| Frannie Canal | 263,069 | --- | 256,405 | 277,262 | |
| Garland Canal | 276,409 | 247,305 | 280,015 | 245,658 | |
| Garland-Frannie | 263,069 | --- | 256,405 | 277,262 | |
| Globe Canal | 15,997 | 14,110 | 16,086 | 17,111 | |
| Heart Mountain Canal | 205,770 | 190,665 | 219,858 | 177,985 | |
| Hunt Canal | 33,932 | 31,826 | 34,388 | 33,401 | |
| Lakeview Canal | 55,300 | 44,886 | 55,663 | 61,713 | |
| North Fork Ditch | 9,411 | 9,232 | 9,770 | 8,845 | |
| Sidon Canal | 86,935 | 85,830 | 89,490 | 78,104 | |
| Willwood Canal | 100,930 | 92,335 | 103,703 | 96,929 | |
| Wilson & Mckissack | 5,626 | 3,208 | 5,597 | 6,472 | |
| Lower Bighorn | Anita Ditch | 71,731 | 56,223 | 76,536 | (1) |
| Bernie | 1,125 | 1,152 | 1,158 | 901 | |
| Dunshee | 1,968 | 2,336 | 2,168 | 1,386 | |
| Frieze | 4,001 | 3,233 | 4,141 | 4,244 | |
| Hatten | 1,359 | 903 | 1,452 | 1,486 | |
| High Line | 2,431 | 1,841 | 2,433 | 2,947 | |
| Kershner | 2,360 | 2,107 | 2,230 | 2,860 | |
| McDonald (Shell Canal) | 24,014 | 20,654 | 24,252 | 25,544 | |
| Porter | 6,890 | 6,435 | 6,763 | 7,366 | |
| Shell Canal | 17,084 | 13,720 | 17,858 | 18,005 | |
| Whaley | 6,481 | 5,978 | 6,379 | 7,113 | |
| Whaley Cem. (Howard Enl. Whaley) | 4,423 | 4,007 | 4,249 | 5,369 | |
Notes:
- No data available for the hydrologic year. Diversion estimated using techniques described in Section 4 -
Full Supply Diversion Requirements.
Section 3 - Estimated Historical Diversions
Because diversion records were not available for many of the smaller diversions within the study area, and because some diversion records were not obtained (those that did not meet the 10 cfs criteria), estimated historical diversions were developed. The quantification of estimated historical diversions for those irrigated lands without historical diversion records took place in two parts:
The development of estimated historical diversion requirements for input into the model was performed in the same manner as described in Section 4 - Full Supply Diversion Requirements.
The calibration procedure, as more fully described in Task 3B/3C Technical Memorandum, Spreadsheet Model Development and Calibration (MWH, 2003), was used to adjust the estimated historical diversions. This calibration procedure utilizes the estimate of water availability at the point of diversion and compares it with the estimated historical diversion. If the estimated historical diversion is less than the amount of water available at the point of diversion, then the estimated historical diversion is not adjusted. If the estimated historical diversion is more than the available flow at the point of diversion, then the estimated historical diversion is adjusted so that it can take no more than the available streamflow. These adjustments are shown on the .Historical Diversions. worksheet within each model. See the Task 3B/3C Technical Memorandum, Spreadsheet Model Development and Calibration (MWH, 2003) for further information on the model and calibration process.
Section 4 - Full Supply Diversion Requirements
Full supply diversion requirements are based on the theoretical consumptive use and system efficiencies for each of the points of diversion. In general, the full supply diversion requirement is equated to the theoretical maximum diversion requirement as given in the following equation.
Each of these factors is described in the following sections.
4.1 Irrigated Lands
Mapping of irrigated lands within the basin was performed by the project team. Irrigated lands mapping is discussed more thoroughly in the Task 2A Technical Memorandum Wind/Bighorn Lands Mapping and Water Rights Data (TriHydro, 2003). This mapping was used for determining the area of land irrigated in each sub-basin model.
The irrigated lands mapping was attributed in the GIS as Irrigated Land (IRR), lands with Water Rights (Water Rights), man-made riparian (MM RIP) and sub-irrigated (SUB IRR) (Tri-Hydro, 2003). Islands of non-irrigated lands within larger irrigated areas, or polygons within polygons in the GIS database, were also mapped.
A summary of the irrigated lands is shown in Table 4-1. As shown in Table 4-4 (Section 4.3 of this report), the USDA estimates approximately 344,000 acres of irrigated lands while the Wyoming Agricultural services estimates approximately 354,000 acres of irrigated lands within the study area. Table 4-1 shows approximately 561,000 acres of irrigated lands with an additional 125,000 acres of lands with water awards. There are many reasons for the differences in estimates, including the non-reporting of irrigated lands by many farmers, and the fact that some of the lands could have been fallow during the reporting year.
Table 4-1. Summary by Attribute of Irrigated Lands Mapping
| County | Irrigated Lands (acres) | Man-Made Riparian (acres) | Sub- Irrigated (acres) | Lands with Water Awards (acres) | Total (acres) |
| Big Horn | 167,669 | 0 | 9,915 | 0 | 177,583 |
| Fremont | 154,829 | 2,385 | 3,155 | 122,330 | 282,700 |
| Hot Springs | 24,389 | 0 | 32 | 3,131 | 27,552 |
| Natrona | 551 | 0 | 183 | 0 | 734 |
| Park | 162,772 | 0 | 6,440 | 0 | 169,212 |
| Washakie | 50,934 | 0 | 0 | 0 | 50,934 |
| Total | 561,144 | 2,385 | 19,726 | 125,461 | 708,716 |
Source:
|
Table 4-2 presents a summary of the mapped irrigated acreage by county within the Wind/Bighorn River Basin Plan study area as used in the model. The following should be noted regarding the development of the modeled acreage:
The remaining portion of this Technical Memorandum discusses historical and full supply diversion requirements for existing irrigated lands. Full Supply diversion requirements for Tribal Futures projects and any other potential irrigation development are discussed in Technical Memorandum 5A - Agricultural Water Demands and Projections (BRS, 2003a).
Table 4-2. Modeled Irrigated Acreage
| County | Irrigated Lands for Full Supply Scenario (2) (acres) | Futures Projects (acres) | Total (acres) |
| Big Horn | 164,404 | 0 | 164,404 |
| Fremont (1) | 196,501 | 52,667 | 249,168 |
| Hot Springs | 27,465 | 0 | 27,465 |
| Natrona | 551 | 0 | 551 |
| Park | 161,099 | 0 | 161,099 |
| Washakie | 50,405 | 0 | 50,405 |
| Total | 600,426 | 52,667 | 653,093 |
Notes:
|
4.2 Theoretical Crop Irrigation Requirement
Crop consumptive use requirement is the maximum water use of a well-watered crop under optimum growing conditions (Pochop; et al, 1992). A portion of the crop consumptive use is met by effective rainfall (or rainfall that reaches the root zone and meets a portion of the consumptive water requirement before occurring as surface runoff). The portion of the crop consumptive use that is not met by rainfall is referred to as the Crop Irrigation Requirement (CIR). Actual conditions often vary from the theoretical CIR for a variety of reasons, such as the micro-climates at the site that may be different from the climate station, variations in genetics of different strains of the same crop, and more likely, varying soil types. However, CIR gives an estimate of the amount of water that is required to produce a crop under ideal conditions on a system-wide basis.
As has become a standard for use in the WWDC river basin plans, the crop irrigation requirements presented in Consumptive Use and Consumptive Irrigation Requirements . Wyoming (Pochop, et al, 1992) were used in this analysis. The study utilizes 1951 . 1990 climatic data to calculate CIR for several crops and climate stations throughout the study area. Because climatic dry, average and wet periods in summer months during irrigation are often different than the dry, average and wet periods in the winter that produce runoff, the average CIR was used for all three hydrologic conditions.
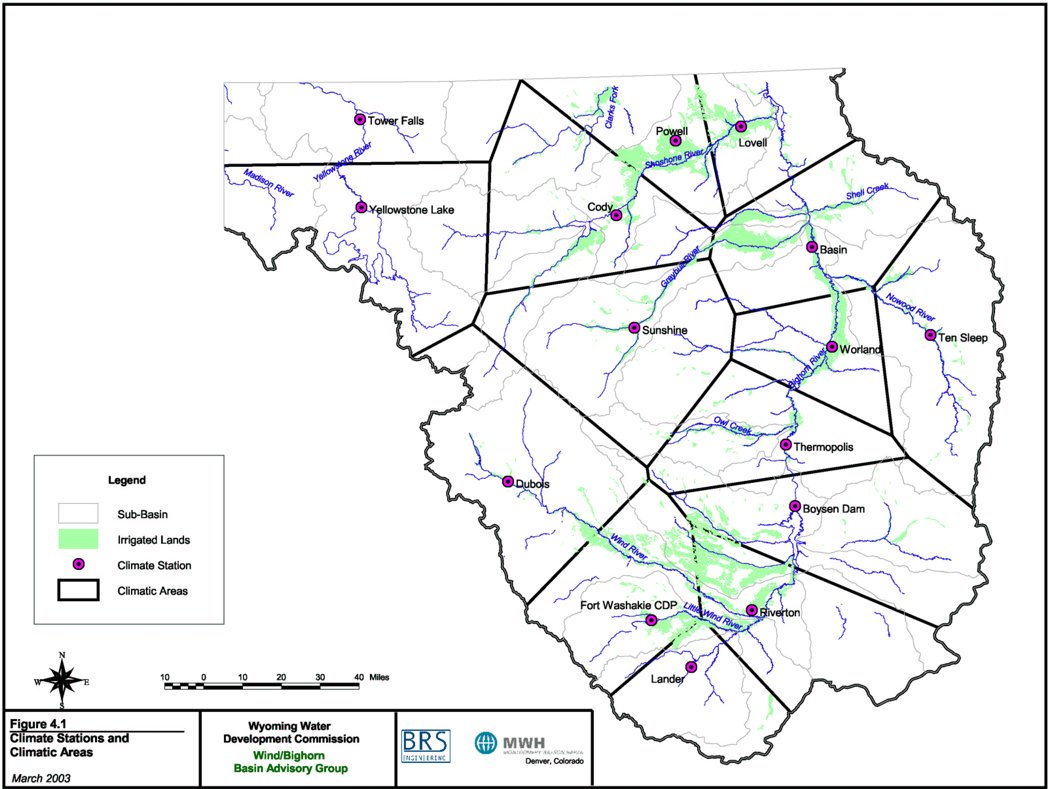
There are 13 climatic stations within the Wind/Bighorn River Basin at which CIR is reported. CIR continually varies between these stations based on localized climate, topography, elevation, etc. However, normally, these variations are small and for regional planning efforts, the CIR values can be extended to areas outside of the exact climatic station location. For purposes of this analysis, the Theissen polygon method was utilized to determine the .influence area. for each climatic station. This method draws lines between each station, then bisects them midway with a perpendicular line. The intersections of these bisection lines makes up polygons for which all irrigated lands within the polygon uses the CIR at the climatic station. The climatic stations and their associated acreages within each basin are presented in Table 4-3, while a map showing the climate stations and the climatic areas developed using the Theissen polygon method is presented in Figure 4-1.
Table 4-3. Area within Climate Station Theissen Polygon
| CIR Station | Acres within Station Polygon by Basin | Total (acres) | ||
| Big Horn | ClarksFork | Wind | ||
| Basin | 106,434 | 0 | 0 | 106,434 |
| Boysen Dam | 0 | 0 | 23,242 | 23,242 |
| Cody | 49,927 | 4,563 | 0 | 54,491 |
| Dubois | 0 | 0 | 20,185 | 20,185 |
| Fort Washakie | 0 | 0 | 49,483 | 49,483 |
| Lander | 0 | 0 | 11,603 | 11,603 |
| Lovell | 40,507 | 0 | 0 | 40,507 |
| Powell | 73,435 | 13,735 | 0 | 87,170 |
| Riverton | 0 | 0 | 91,528 | 91,528 |
| Sunshine | 28,962 | 0 | 0 | 28,962 |
| Ten Sleep | 18,395 | 0 | 0 | 18,395 |
| Thermopolis | 24,365 | 0 | 1,278 | 25,643 |
| Worland | 42,784 | 0 | 0 | 42,784 |
| Grand Total | 384,810 | 18,299 | 197,318 | 600,426 |
Notes:
- Does not include Tribal Futures projects or Popo Agie Basin.
Figure 4-1. Climate Stations and Climatic Areas
4.3 Cropping Patterns
Cropping patterns are available from two sources: the United States Department of Agricultural (USDA) 1992/1997 Census of Agriculture (USDA, 1997) and the Wyoming Agricultural Statistics for 2000 (WASS, 2002). A summary of the published cropping patterns and distributions are presented in Table 4-4, while the USDA cropping distribution by County is shown in Figure 4-2.
In general, for purposes of the modeling effort, the USDA values were used as the cropping pattern for the irrigated lands. The USDA values were used because they represent averages of more than one year within the study period (1973-2001), as compared with the Wyoming Agricultural Statistics, which represent only one year at the end of the study period. In addition, for certain climatic stations such as Sunshine and Dubois, it is recognized that many of the crops that are shown in the County-wide cropping patterns are not grown. Therefore, within these two polygons, it was assumed that only hay and alfalfa are grown (at the same distribution as without the remaining crops). Then, the cropping patterns for the remaining stations were modified so that the county-wide cropping pattern remains consistent.
Figure 4-2. County-Wide Cropping Pattern for Study Area (USDA, 1997)
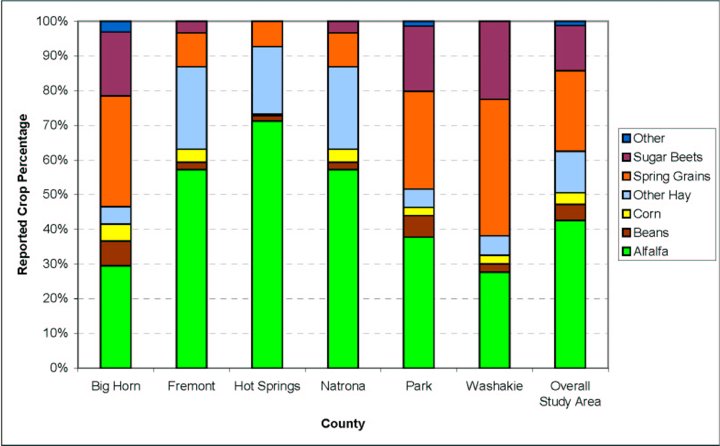
Table 4-4. Reported Acreage and Cropping Patterns within Wind/Bighorn Basin
| Station | Crop | Wy. Ag. 2000 (1) | USDA 1992/1997 (2) | ||
| (acres) | (percent) | (acres) | (percent) | ||
| Big Horn | Alfalfa | 26,000 | 31% | 25,286 | 29% |
| Beans | 7,500 | 9% | 6,145 | 7% | |
| Corn | 7,200 | 8% | 4,116 | 5% | |
| Other Hay | 6,000 | 7% | 4,321 | 5% | |
| Spring Grains | 24,100 | 28% | 27,476 | 32% | |
| Sugar Beets | 14,400 | 17% | 15,740 | 18% | |
| Other | 0% | 2,661 | 3% | ||
| Sub-Total | 85,200 | 100% | 85,745 | 100% | |
| Fremont | Alfalfa | 66,000 | 63% | 65,349 | 57% |
| Beans | 2,000 | 2% | 2,441 | 2% | |
| Corn | 6,000 | 6% | 4,282 | 4% | |
| Other Hay | 20,000 | 19% | 27,143 | 24% | |
| Spring Grains | 5,700 | 5% | 11,136 | 10% | |
| Sugar Beets | 5,100 | 5% | 3,836 | 3% | |
| Other | 0% | 0% | |||
| Sub-Total | 104,800 | 100% | 114,187 | 100% | |
| Hot Springs | Alfalfa | 10,000 | 60% | 12,235 | 71% |
| Beans | 300 | 2% | 274 | 2% | |
| Corn | 0% | 80 | 0% | ||
| Other Hay | 5,000 | 30% | 3,335 | 19% | |
| Spring Grains | 1,300 | 8% | 1,255 | 7% | |
| Sugar Beets | 0 | 0% | 0% | ||
| Other | 0% | 0% | |||
| Sub-Total | 16,600 | 100% | 17,179 | 100% | |
| Park | Alfalfa | 35,000 | 36% | 36,378 | 38% |
| Beans | 8,000 | 8% | 5,945 | 6% | |
| Corn | 5,700 | 6% | 2,283 | 2% | |
| Other Hay | 8,000 | 8% | 5,132 | 5% | |
| Spring Grains | 23,700 | 25% | 27,137 | 28% | |
| Sugar Beets | 16,200 | 17% | 18,100 | 19% | |
| Other | 0% | 1,332 | 1% | ||
| Sub-Total | 96,600 | 100% | 96,307 | 100% | |
| Washakie | Alfalfa | 13,000 | 32% | 12,211 | 28% |
| Beans | 1,700 | 4% | 1,065 | 2% | |
| Corn | 0% | 1,095 | 2% | ||
| Other Hay | 1,000 | 2% | 2,471 | 6% | |
| Spring Grains | 16,700 | 41% | 17,369 | 39% | |
| Sugar Beets | 8,800 | 21% | 9,932 | 22% | |
| Other | 0% | 0% | |||
| Sub-Total | 41,200 | 100% | 44,143 | 100% | |
| Total | Alfalfa | 150,000 | 44% | 151,459 | 43% |
| Beans | 19,500 | 6% | 15,870 | 4% | |
| Corn | 18,900 | 5% | 11,856 | 3% | |
| Other Hay | 40,000 | 12% | 42,402 | 12% | |
| Spring Grains | 71,500 | 21% | 84,373 | 24% | |
| Sugar Beets | 44,500 | 13% | 47,608 | 13% | |
| Other | 0 | 0% | 3,993 | 1% | |
| Total | 344,400 | 100% | 353,568 | 100% | |
Notes:
- From Wyoming Agricultural Services (WASS, 2002)
Spring Grains: Irrigated Spring Wheat = Barley, Oats, Spring Wheat (a majority is Barley). Other Hay: All Hay (-) Alfalfa Hay- From USDA 1997 Census of Agriculture (USDA, 1997) Other Hay: Grass Hay, Small Grain Hay, Other Tame Hay, Wild Hay, Grass Silage Other: Field Seed, Fruits
4.4 Full Supply Crop Irrigation Requirement
Based on the cropping patterns and crop irrigation requirements for the climatic station polygons, the CIR for each of the irrigated lands polygons was calculated. A summary of the CIR for the lands within the Wind/Bighorn River Basin Plan is shown in Table 4-5. These CIR values represent the theoretical maximum crop irrigation requirement calculated using the methodology above, and is considered the Full Supply irrigation requirement for purposes of the model.
Table 4-5. CIR for Irrigated Lands with Wind/Bighorn River Basin Plan by Model Sub-Basin
| Model Sub-Basin | Irrigated Acres | Monthly CIR (acre-feet) | Unit CIR (ac-ft/ac) | |||||||
| Apr | May | Jun | Jul | Aug | Sep | Oct | Annual | |||
| Upper Wind | 138,863 | 10,561 | 33,354 | 60,572 | 80,813 | 63,577 | 26,875 | 1,149 | 276,901 | 1.99 |
| Little Wind | 45,536 | 1,842 | 8,887 | 18,442 | 26,128 | 20,646 | 8,755 | 617 | 85,318 | 1.87 |
| Lower Wind | 12,919 | 1,913 | 3,870 | 6,317 | 8,198 | 6,385 | 2,950 | 219 | 29,851 | 2.31 |
| Owl Creek | 17,839 | 2,334 | 4,326 | 6,849 | 9,107 | 7,043 | 3,182 | 307 | 33,148 | 1.86 |
| Nowood | 21,725 | 1,360 | 4,204 | 9,104 | 12,053 | 7,335 | 2,925 | 156 | 37,136 | 1.71 |
| Upper Bighorn | 63,150 | 5,979 | 16,883 | 30,534 | 36,846 | 22,846 | 10,552 | 967 | 124,607 | 1.97 |
| Greybull | 98,046 | 8,042 | 24,528 | 43,862 | 56,399 | 38,320 | 18,034 | 2,023 | 191,206 | 1.95 |
| Shoshone | 158,187 | 13,547 | 36,759 | 65,870 | 91,206 | 59,951 | 26,728 | 3,355 | 297,416 | 1.88 |
| Lower Bighorn | 25,862 | 2,789 | 7,338 | 12,854 | 16,247 | 10,490 | 4,995 | 581 | 55,292 | 2.14 |
| Clarks Fork | 18,299 | 1,637 | 4,251 | 7,642 | 10,539 | 6,957 | 3,113 | 440 | 34,579 | 1.89 |
| Yellowstone | 0 | 0 | 0 | 0 | 0 | 0 | 0 | 0 | 0 | 0.00 |
| Madison/Gallatin | 0 | 0 | 0 | 0 | 0 | 0 | 0 | 0 | 0 | 0.00 |
| Total | 600,426 | 50,003 | 144,399 | 262,045 | 347,536 | 243,550 | 108,108 | 9,813 | 1,165,454 | 1.94 |
Notes:4.5 Calculation of Full Supply Diversion Requirements
- Does not includes Tribal Futures projects or Popo Agie basin.
- Average values are reported; analysis does not does not distinguish between dry, normal or wet year hydrologic conditions for consumptive use calculations.
The Crop Irrigation Requirement represents the theoretical amount of water that is needed by the crop. Water is transported from the river to the crop through a series of conveyance facilities and on-farm facilities. These facilities lose a portion of the water that is transmitted through them before the water reaches the crops due to headgage leakage, evaporative losses, seepage, etc. These inefficiencies must be accounted for in determining the monthly diversion requirement for any crop.
4.5.1 Overall Efficiencies
Overall Efficiency is typically represented as the product of the conveyance efficiency and the on-farm efficiency. Conveyance efficiencies represent the efficiencies of the canals and/or pipelines that transmit the water from the diversion headgate to the farm turnout. Conveyance efficiencies typically vary from 65 to 90 percent, with open channel distribution systems generally having lower efficiencies and pipe systems generally having the highest efficiencies (SCS, 1993 and WWDC, 1999). Distribution system length, soil types, lining types, canal cross section and condition of structures can all have an affect on conveyance efficiencies. The on-farm efficiency represents the efficiency of applying water to the field from the farm turnout to consumptive use by the crop. On-farm efficiencies typically vary from less than 30 to nearly 65 percent, based upon the type of irrigation practices (SCS, 1993). Flood irrigation typically experiences lower efficiencies while sprinkler systems represent higher efficiencies.
Overall efficiencies are typically difficult to estimate. This study has relied upon Overall Efficiencies estimated from previous reports and from standard sources. For the Reservation area, efficiencies are taken from a study conducted by the SCS (1992), which estimated efficiencies for several areas within and in the vicinity of the Wind River Reservation. The SCS developed both annual and monthly overall efficiencies. For the remaining study area, efficiencies were based upon conveyance efficiencies reported by water users within the basin (WWDC, 1999), and typical field and application efficiencies estimated by the SCS (1993). Efficiencies typically vary by month due to antecedent moisture in banks (there is more moisture in the banks later in the season, thus there is less seepage from the canal), operational conditions, etc. Therefore, the efficiencies were varied by month using the same distribution as the monthly efficiencies calculated by the SCS for the Reservation. Table 4-6 presents the monthly and annual overall efficiencies used in the diversion requirement calculations.
Table 4-6. Monthly and Annual Overall Efficiencies
| Area | Overall Efficiency by Month | Annual Average | |||||||
| March | April | May | June | July | August | Sept | Oct | ||
| Dubois(1) | (4) | (4) | 18% | 26% | 34% | 34% | 34% | 34% | 30% |
| Lander(1) | (4) | 17% | 17% | 24% | 37% | 35% | 22% | 22% | 28% |
| Other, Large(2) | (4) | 27% | 27% | 38% | 58% | 55% | 35% | 35% | 44% |
| Other, Small(3) | (4) | 19% | 19% | 27% | 42% | 40% | 25% | 25% | 32% |
| Owl Creek(1) | 19% | 19% | 21% | 28% | 36% | 41% | 21% | 17% | 29% |
| Reservation(1) | (4) | 18% | 18% | 25% | 33% | 34% | 21% | 21% | 27% |
| Riverton(1) | (4) | 20% | 24% | 39% | 52% | 52% | 27% | 27% | 41% |
Notes:4.5.2 Full Supply Diversion Requirement
- From (SCS, 1992).
- Based on average conveyance efficiencies from 1999 Irrigation System Survey Report (WWDC, 1999), large blocks with some lined canals and pipelines, and adequate management (SCS, 1992). Monthly distribution from (SCS, 1992)
- Based on average conveyance efficiencies from 1999 Irrigation System Survey Report (WWDC, 1999), small systems with unlined canals and sufficient management (SCS, 1993). Monthly distribution from (SCS, 1992)
- No consumptive use within month.
Based upon the crop irrigation requirements and overall irrigation efficiencies, Full Supply diversion requirements were calculated for the irrigated lands. The diversion requirement is calculated as the crop irrigation requirement divided by the efficiency of the system. The estimated Full Supply diversion requirements by sub-basin are shown in Table 4-7. As expected with the wide variations in efficiencies, the unit Full Supply diversion requirements expressed as acre-feet per acre also vary.
Table 4-7. Full Supply Diversion Requirements for Irrigated Lands within Wind/Bighorn River Basin Plan by Model Sub-Basin
| Model Sub-Basin | Irrigated Acres | Monthly Diversion Requirement (ac-ft) | Unit DR (ac-ft/ac) | |||||||
| Apr | May | Jun | Jul | Aug | Sep | Oct | Annual | |||
| Upper Wind | 138,863 | 52,990 | 148,602 | 171,535 | 172,482 | 134,611 | 102,584 | 4,465 | 787,269 | 5.67 |
| Little Wind | 45,536 | 10,235 | 49,374 | 73,769 | 79,175 | 60,722 | 41,692 | 2,939 | 317,907 | 6.98 |
| Lower Wind | 12,919 | 9,564 | 16,124 | 16,198 | 15,766 | 12,278 | 10,924 | 811 | 81,666 | 6.32 |
| Owl Creek | 17,839 | 12,282 | 20,600 | 24,462 | 25,298 | 17,178 | 15,153 | 1,804 | 116,776 | 6.55 |
| Nowood | 21,725 | 6,808 | 21,019 | 32,189 | 27,630 | 17,780 | 11,296 | 607 | 117,327 | 5.40 |
| Upper Bighorn | 63,150 | 24,750 | 68,152 | 87,259 | 69,516 | 45,400 | 33,940 | 3,206 | 332,223 | 5.26 |
| Greybull | 98,046 | 31,053 | 99,224 | 126,122 | 106,124 | 77,173 | 57,435 | 6,379 | 503,512 | 5.14 |
| Shoshone | 158,187 | 52,322 | 142,958 | 181,860 | 163,473 | 113,701 | 80,601 | 9,984 | 744,901 | 4.71 |
| Lower Bighorn | 25,862 | 13,143 | 34,599 | 42,899 | 35,225 | 24,039 | 18,191 | 2,113 | 170,209 | 6.58 |
| Clarks Fork | 18,299 | 7,765 | 20,260 | 25,860 | 23,152 | 16,156 | 11,494 | 1,605 | 106,293 | 5.81 |
| Yellowstone | 0 | 0 | 0 | 0 | 0 | 0 | 0 | 0 | 0 | 0.00 |
| Madison/Gallatin | 0 | 0 | 0 | 0 | 0 | 0 | 0 | 0 | 0 | 0.00 |
| Total | 600,426 | 220,913 | 620,912 | 782,154 | 717,841 | 519,040 | 383,310 | 33,912 | 3,278,082 | 5.46 |
Notes:
- Does not include Tribal Futures projects or Popo Agie basin.
Section 5 - Summary and Conclusions
The purpose of the analysis summarized in this Technical Memorandum was to document the status of historical and current agricultural water use within the Wind/Bighorn River Basin and to document the methodologies used to develop data necessary for the River Basin simulation models. A summary of the irrigated lands identified in this study as well as those documented in the 1972 Water Plan (SEO) is presented in Table 51. The current estimate of irrigated lands is approximately 54,000 acres, or approximately 10 percent, greater than the estimate of 1972 irrigated lands in the 1972 Water Plan. In addition, the estimate of idle lands is approximately 44,000 acres, or approximately 150 percent, greater than the estimate of idle lands in 1972. The differences could be due to increased lands under irrigation, but are more likely a difference in estimation techniques. For instance, the definition of idle lands in the 1972 Water Plan (lands purposely left idle for any given year or lands on which a crop was planted but not harvested) is much more strict than used in this study (basically any land with a water right not currently irrigated but that has shown any signs of past irrigation). Another factor is that the current basin plan considered all lands in the Wind River Irrigation Project that were given water rights as either irrigated or idle, whereas the 1972 Water Plan may have not.
Table 5-1. Summary of Irrigated Lands
| Category | 1972 Water Plan (SEO) | 2002 Wind/Bighorn Basin Plan(3) | |
| Current (1972) | Projected (2000) | ||
| Irrigated Lands (acres)(1)(2) | 509,640 | 516,330 | 563,529 |
| Idle Lands(1)/Lands with Water Rights (acres)(2) | 29,190 | 22,500 | 72,794 |
| New Land Development(1) /Tribal Future Projects (acres)(2) | --- | 102,670 | 52,667 |
| Total | 538,830 | 641,500 | 688,990 |
Direct comparisons of consumptive use are not as easy because the current basin plan did not calculate consumptive use for the Popo Agie basin. However, a comparison of unit consumptive use (ac-ft/ac) can be made. The 1972 Water Plan calculated a total consumptive use for the 538,830 acres as 1,028,500 acre-feet, or approximately 1.91 acre-feet per acre. As shown in Table 4-5, the current basin plan calculated a consumptive use of 1,165,000 acre-feet for the 600,400 acres used in the model, or approximately 1.94 acre-feet per acre, which agrees very closely to the consumptive use calculated in the Water Plan.
As a major purpose of the irrigated lands and consumptive use calculations in this study was to provide data for overall basin planning, a conservative approach was taken. The conservative approach ensures that all lands with currently or recently active water rights are considered in the water needs analysis and are considered when available surface water is determined. More detailed analyses could be performed once specific projects are identified.
Section 6 - References
BRS, Inc. 2002. .Wind/Bighorn River Basin Plan Water Supply and Demand in the Wind/Big Horn Basin.. Technical Memorandum, Riverton, Wyoming.
BRS, Inc. 2003a. .Wind/Bighorn River Basin Plan Agricultural Water Demands and Projections.. Technical Memorandum, Riverton, Wyoming.
BRS, Inc. 2003b. .Wind/Bighorn River Basin Plan Irrigation Diversion Operation and Description.. Technical Memorandum, Riverton, Wyoming.
MWH. 2002. .Wind/Bighorn River Basin Plan Task 3A/3B - Surface Water Hydrology.. Technical Memorandum. Denver, Colorado.
MWH. 2003. .Wind/Bighorn River Basin Plan Task 3B/3C - Spreadsheet Model Development and Calibration.. Technical Memorandum. Denver, Colorado.
Pochop, Larry, Travis Teegarden, Greg Kerr, Ronald Delaney and Victor Hasfurther. 1992. Consumptive Use and Consumptive Irrigation Requirements in Wyoming. WWRC Publication #92-06. University of Wyoming, Laramie. October.
Soil Conservation Service (SCS). 1992. Interim Irrigation On-Farm Report for Wind River Basin Water Supply Study (DRAFT). Casper, Wyoming. May.
Soil Conservation Service (SCS). 1993. Irrigation Water Requirements. Part 623, National Engineering Handbook, Chapter 2. September.
TriHydro Corporation. 2003. .Technical Memorandum Wind/Bighorn Lands Mapping and Water Rights Data Task 2A.. Laramie, Wyoming.
United States Department of Agriculture (USDA). 1997. 1997 Census of Agriculture. Wyoming . County Data.
Wyoming Agricultural Statistics Service (WASS). 2002. .Wyoming County Data, 2000.. From website: http://www.nass.usda.gov/wy/.
Wyoming State Engineer.s Office (SEO). 1972. Water and Related Land Resources of the Bighorn River Basin, Wyoming. Wyoming Water Planning Program Report No. 11. Cheyenne, Wyoming. October.
Wyoming Water Development Commission (WWDC). 1999. Irrigation System Survey Report. Cheyenne.
Appendix A
Diversion Data
Summary of Average Monthly and Annual Diversions (1973-2001)
Overall
| Sub-Basin | Diversion Name | Data Type | Years of Data | Average Monthly Flow (ac-ft) | ||||||||||||
| Oct | Nov | Dec | Jan | Feb | Mar | Apr | May | Jun | Jul | Aug | Sep | Total | ||||
| Clarks Fork Yellowstone | Bennett Creek Little Rocky | Spot Spot | 12 12 | 177 204 | 0 0 | 0 0 | 0 0 | 0 0 | 0 267 | 175 120 | 372 315 | 580 589 | 639 715 | 597 634 | 469 505 | 3,009 3,350 |
| Upper Wind | Dinwoody Canal Dry Creek Canal Johnstown Canal LeClair Canal Lefthand Canal Riverton Valley Canal Upper Wind River A Canal Wyoming Canal | Daily Daily Daily Daily Daily Daily Daily Daily | 6 12 10 29 10 28 4 26 | 280 1,081 0 3,097 0 430 0 4,105 | 0 0 0 0 0 0 0 2,363 | 0 0 0 0 0 0 0 0 | 0 0 0 0 0 0 0 0 | 0 0 0 0 0 0 0 0 | 0 0 0 0 0 0 0 6,714 | 4,154 288 6 1,469 0 1,120 197 16,622 | 2,997 6,409 801 9,018 1,089 5,650 3,294 50,903 | 3,289 11,136 1,344 15,644 1,521 6,928 3,802 75,116 |
4,038 12,403 1,582 19,747 1,764 8,383 3,391 84,873 |
3,611 11,727 1,559 16,293 1,589 6,378 3,544 66,380 |
2,997 7,781 1,199 11,435 1,443 4,582 3,069 48,466 |
21,367 50,825 6,490 76,703 7,405 33,472 17,296 355,542 |
| Little Wind | Coolidge Canal Ray Canal Sub-Agency Canal | Daily Daily Daily | 1 11 1 | 0 2,774 0 | 0 0 0 | 0 0 0 | 0 0 0 | 0 0 0 | 0 0 0 | 0 751 470 | 5,770 6,415 6,100 | 7,890 11,764 4,840 | 6,610 14,358 7,150 | 3,920 10,693 6,140 | 2,750 6,362 4,270 | 26,940 53,119 28,970 |
| Upper Bighorn | Ackerman Baylor-Purvis-Thompson Big Horn Canal Bluff Canal Brassington Caledonia Chessington-Wilson Hale Highland Ditch Highland Hanover Kirby Canal Lower Hanover Canal Lower Lucerne Canal Padlock Sliney and Mikkleson/S,N Tenderfoot Upper Hanover Canal Upper Lucerne Canal Woodward-Johnson |
Spot Spot Daily Daily Spot Spot Spot Spot Daily Daily Daily Daily Daily Spot Spot Spot Daily Daily Spot | 12 6 27 27 12 12 12 12 6 7 29 27 16 12 12 12 28 16 12 | 100 5 3,588 893 143 47 38 33 238 0 230 412 0 22 28 166 5,044 0 35 | 206 0 0 0 5 0 0 0 0 0 0 8 0 0 0 366 0 0 0 | 0 0 0 0 0 0 0 0 0 0 0 6 0 0 0 0 0 0 0 | 0 0 0 0 0 0 0 0 0 0 0 8 0 0 0 0 0 0 0 | 0 0 0 0 0 0 0 0 0 0 0 8 0 0 0 0 0 0 0 | 220 37 0 0 0 307 185 110 0 0 0 8 0 0 236 5 0 0 244 | 112 55 12,071 2,482 14 314 72 89 0 1,283 294 3,985 224 96 239 181 11,405 173 100 | 281 253 25,521 5,721 188 486 239 244 1,782 4,951 3,122 8,291 1,912 326 714 369 25,537 1,679 286 | 254 428 26,881 6,222 273 416 276 304 1,762 5,719 3,850 9,459 2,420 605 1,177 371 27,904 2,025 292 | 144 321 30,190 6,797 576 175 356 174 2,071 7,521 4,177 10,974 2,849 467 540 180 30,493 2,328 279 | 96 224 27,433 6,316 557 123 219 138 1,880 6,981 3,760 9,636 2,374 181 236 168 28,008 2,231 144 | 103 128 22,752 4,945 409 77 129 93 1,751 3,953 2,983 6,016 1,403 84 97 218 22,654 1,740 74 | 1,516 1,521 148,437 33,375 2,166 1,944 1,514 1,185 9,484 30,409 18,416 48,810 11,183 1,781 3,268 2,023 151,046 10,177 1,454 |
| Nowood | Anita Anita Supplemental Bernstein Big Bear Enl. Elk George & Bayne Go Ahead Harmony Highland Shafer Van Alstine (Avent Western | Spot Spot Spot Spot Spot Spot Spot Spot Spot Spot Spot Spot | 11 11 11 10 11 11 11 11 11 11 11 10 | 465 127 111 114 124 179 121 114 248 138 529 107 | 0 0 0 0 0 0 0 0 0 0 0 0 |
0 0 0 0 0 0 0 0 0 0 0 0 |
0 0 0 0 0 0 0 0 0 0 0 0 | 0 0 0 0 0 0 0 0 0 0 0 0 | 0 0 0 0 0 0 0 0 0 0 0 0 | 268 83 40 27 31 132 82 212 71 132 475 23 | 1,048 354 281 245 243 397 339 496 453 434 1,128 222 | 1,299 463 576 611 514 495 501 554 744 733 1,384 543 | 1,135 426 550 595 493 513 506 565 782 676 1,354 477 | 960 326 453 520 452 468 403 457 695 559 1,234 390 | 915 270 331 356 312 406 332 361 499 435 1,074 287 | 6,089 2,048 2,342 2,469 2,168 2,590 2,285 2,759 3,491 3,108 7,178 2,049 |
| Greybull/Dry | Agrarian Arnold Ashworth #2 Avent Beck and Allen Bench Canal Borner & Harvey (Borner) Brown (Croxall and Brown) Butte Cheeseman Cockins Dodge Dyer Fairview Farmer's Canal German Greybull Hurlbut J.F.W. Jimmerfield Jimmerfield-Roach Keystone Meyers Moss & Long Hollow Only Chance Pappapau Perkins Rocky Ruby Sandstone Snyder (Nichols) T.L. Tatman-St. Joe Watson Whitney Gleaver Winkle & Benbrooke Woods and Burnett | Spot Spot Spot Spot Spot Daily Spot Spot Spot Spot Spot Spot Spot Spot Daily Spot Spot Spot Spot Spot Spot Spot Spot Spot Spot Spot Spot Spot Spot Spot Spot Spot Spot Spot Spot Spot Spot | 12 12 12 12 6 28 12 12 12 12 12 12 12 12 27 12 12 12 6 12 12 12 12 12 12 12 6 12 12 12 12 12 12 12 12 12 12 | 475 85 85 148 79 1,040 103 105 10 69 108 96 65 357 794 147 63 42 279 76 129 94 59 48 27 115 357 58 56 315 76 143 225 65 48 33 268 |
0 0 0 0 0 0 0 0 0 0 0 0 0 0 0 0 0 0 0 0 0 0 0 0 0 0 0 0 0 0 0 0 0 0 0 0 0 |
0 0 0 0 0 0 0 0 0 0 0 0 0 0 0 0 0 0 0 0 0 0 0 0 0 0 0 0 0 0 0 0 0 0 0 0 0 |
0 0 0 0 0 0 0 0 0 0 0 0 0 0 0 0 0 0 0 0 0 0 0 0 0 0 0 0 0 0 0 0 0 0 0 0 0 |
0 0 0 0 0 0 0 0 0 0 0 0 0 0 0 0 0 0 0 0 0 0 0 0 0 0 0 0 0 0 0 0 0 0 0 0 0 |
0 0 0 0 0 0 0 0 0 0 0 0 0 2,260 0 0 0 0 0 0 271 0 0 0 0 0 581 0 0 0 0 0 1,118 0 0 0 0 |
448 139 139 146 634 1,233 117 259 57 132 154 69 152 577 1,717 123 86 135 457 104 228 191 110 52 101 145 759 80 43 303 83 113 246 45 32 73 580 |
1,319 478 478 756 1,503 8,485 313 766 197 500 449 304 580 1,358 9,409 552 374 477 1,056 384 567 701 489 156 311 513 1,473 323 176 1,040 468 429 855 184 96 347 1,344 |
1,561 608 608 926 824 11,598 331 942 395 1,008 568 629 716 1,864 11,349 791 658 910 1,068 468 775 1,007 538 214 454 915 1,671 790 409 1,331 488 685 1,313 343 171 606 1,358 |
1,882 614 614 1,221 1,288 14,585 369 1,214 247 537 575 625 760 2,410 12,773 992 699 986 1,235 481 1,177 1,358 594 160 436 900 2,092 669 368 1,460 616 637 1,836 419 121 388 1,891 |
1,726 565 565 958 672 11,292 350 974 103 393 561 709 692 1,801 10,425 748 513 443 993 404 907 823 501 204 277 689 1,603 621 354 1,403 602 567 1,338 336 105 481 1,698 |
1,253 286 286 519 474 7,175 263 617 41 239 362 412 418 1,167 6,682 431 273 135 740 300 518 537 304 171 140 497 1,072 225 217 915 361 349 821 212 126 182 1,094 |
8,663 2,776 2,776 4,673 5,473 55,408 1,847 4,877 1,051 2,878 2,778 2,844 3,384 11,794 53,149 3,783 2,667 3,127 5,827 2,216 4,573 4,711 2,595 1,005 1,746 3,775 9,607 2,766 1,623 6,768 2,694 2,924 7,751 1,604 699 2,111 8,233 |
| Shoshone | Cody Canal Deaver-Frannie Canal Elk Lovell Canal Frannie Canal Garland Canal Garland-Frannie Globe Canal Heart Mountain Canal Hunt Canal Lakeview Canal North Fork Ditch Sidon Canal Willwood Canal Wilson & Mckissack |
Daily Daily Daily Daily Daily Daily Daily Daily Daily Daily Daily Daily Daily Spot |
28 16 28 4 22 4 28 26 28 28 8 29 27 9 |
2,667 8,110 3,111 22,639 24,627 22,639 841 11,399 1,681 1,594 0 3,192 6,541 300 |
0 0 0 0 0 0 0 0 0 0 0 0 46 0 |
0 0 0 0 0 0 0 0 0 0 0 0 0 0 |
0 0 0 0 0 0 0 0 0 0 0 0 0 0 |
0 0 0 0 0 0 0 0 0 0 0 0 0 0 |
0 0 0 0 0 0 0 0 0 0 0 0 0 0 |
1,858 4,017 4,945 7,556 16,965 7,556 670 7,607 1,611 1,185 57 5,711 6,144 118 |
10,574 14,928 16,316 44,335 45,602 44,335 2,580 28,184 5,491 8,012 1,553 13,985 15,757 595 |
14,303 15,180 18,616 46,769 48,097 46,769 2,716 43,057 6,016 12,722 2,068 15,498 15,695 1,158 |
15,483 16,191 20,773 53,366 53,585 53,366 3,342 48,054 7,007 13,434 2,085 17,621 21,557 1,550 |
12,481 16,261 19,506 50,736 48,777 50,736 3,166 40,135 6,640 11,014 1,882 16,936 19,932 1,171 |
8,751 14,803 16,427 37,668 38,757 37,668 2,682 27,335 5,486 7,338 1,767 13,991 15,258 733 |
66,117 89,491 99,694 263,069 276,409 263,069 15,997 205,770 33,932 55,300 9,411 86,935 100,930 5,626 |
| Big Horn Lake | Anita Ditch Bernie Dunshee Frieze Hatten High Line Kershner McDonald (Shell Canal) Porter Shell Canal Whaley Whaley Cememtary(Howar |
Daily Spot Spot Spot Spot Spot Spot Spot Spot Spot Spot Spot |
4 8 12 12 6 6 11 12 12 12 12 7 |
8,110 93 59 124 112 225 103 1,301 524 1,135 443 524 |
0 0 0 0 0 0 0 0 0 0 0 0 |
0 0 0 0 0 0 0 0 0 0 0 0 |
0 0 0 0 0 0 0 0 0 0 0 0 |
0 0 0 0 0 0 0 0 0 0 0 0 |
0 0 0 0 0 0 0 0 0 0 0 0 |
1,708 81 70 119 15 122 95 883 145 635 182 117 |
9,106 232 310 731 289 454 457 4,408 963 3,228 1,407 929 |
13,092 287 416 922 252 418 553 4,787 1,452 3,582 1,234 946 |
14,601 188 437 840 314 461 482 5,227 1,322 3,322 1,145 703 |
13,3990 129 413 787 208 416 403 4,408 1,417 3,137 1,189 615 |
11,724 113 264 478 169 335 266 3,000 1,066 2,045 881 590 |
71,731 1,125 1,968 4,001 1,359 2,431 2,360 24,014 6,890 17,084 6,481 4,423 |
Summary of Average Monthly and Annual Diversions (1973-2001)
Dry Years
| Sub-Basin | Diversion Name | Data Type | Years of Data | Average Monthly Flow (ac-ft) | ||||||||||||
| Oct | Nov | Dec | Jan | Feb | Mar | Apr | May | Jun | Jul | Aug | Sep | Total | ||||
| Clarks Fork Yellowstone | Bennett Creek Little Rocky |
Spot Spot |
3 3 |
135 302 |
0 0 |
0 0 |
0 0 |
0 0 |
0 0 |
106 125 |
317 315 |
384 488 |
279 507 |
369 407 |
316 320 |
1,906 2,463 | Upper Wind | Dinwoody Canal Dry Creek Canal Johnstown Canal LeClair Canal Lefthand Canal Riverton Valley Canal Upper Wind River A Canal Wyoming Canal |
Daily Daily Daily Daily Daily Daily Daily Daily |
0 3 3 6 3 6 1 6 |
-- 37 0 0 0 0 0 0 |
-- 0 0 0 0 0 0 0 |
-- 0 0 0 0 0 0 0 |
-- 0 0 0 0 0 0 0 |
-- 0 0 0 0 0 0 0 |
-- 0 0 0 0 0 0 0 |
-- 279 25 2,458 0 1,799 592 20,864 |
-- 9,170 1,467 11,567 1,638 7,994 4,508 57,081 |
-- 13,486 1,712 16,435 2,018 7,441 4,564 64,654 |
-- 13,085 1,507 15,985 2,371 7,664 2,795 64,284 |
-- 12,566 1,591 14,647 2,153 6,678 3,697 51,350 |
-- 7,044 1,379 11,067 2,076 4,584 3,400 36,354 |
-- 55,667 7,682 72,159 10,257 36,160 19,557 294,587 |
| Little Wind | Coolidge Canal Ray Canal Sub-Agency Canal |
Daily Daily Daily |
1 2 1 |
0 0 0 |
0 0 0 |
0 0 0 |
0 0 0 |
0 0 0 |
0 0 0 |
0 0 470 |
5,770 10,535 6,100 |
7,890 15,680 4,840 |
6,610 8,835 7,150 |
3,920 7,245 6,140 |
2,750 2,445 4,270 |
26,940 44,740 28,970 |
| Upper Bighorn | Ackerman Baylor-Purvis-Thompson Big Horn Canal Bluff Canal Brassington Caledonia Chessington-Wilson Hale Highland Ditch Highland Hanover Kirby Canal Lower Hanover Canal Lower Lucerne Canal Padlock Sliney and Mikkleson/S/North Tenderfoot Upper Hanover Canal Upper Lucerne Canal Woodward-Johnson |
Spot Spot Daily Daily Spot Spot Spot Spot Daily Daily Daily Daily Daily Spot Spot Spot Daily Daily Spot |
2 1 5 5 2 2 2 2 0 1 6 5 3 2 2 2 5 3 2 |
39 0 0 0 209 81 12 64 -- 0 0 0 0 0 0 43 0 0 0 |
0 0 0 0 0 0 0 0 -- 0 0 0 0 0 0 0 0 0 0 |
0 0 0 0 0 0 0 0 -- 0 0 0 0 0 0 0 0 0 0 |
0 0 0 0 0 0 0 0 -- 0 0 0 0 0 0 0 0 0 0 |
0 0 0 0 0 0 0 0 -- 0 0 0 0 0 0 0 0 0 0 |
0 0 0 0 0 0 0 0 -- 0 0 0 0 0 0 0 0 0 0 |
56 0 10,358 2,214 69 176 28 0 -- 1,090 225 3,266 112 53 64 54 10,075 224 18 |
0 181 26,207 6,374 102 335 116 0 -- 6,280 3,114 9,462 2,416 171 205 133 27,251 1,889 37 |
33 0 26,448 6,523 303 198 43 0 -- 7,510 3,549 10,295 3,108 268 288 58 27,935 2,308 62 |
12 0 26,697 6,445 2,328 46 98 0 -- 7,660 3,900 10,580 3,030 168 220 22 28,172 2,469 189 |
0 0 24,629 5,833 2,043 53 30 0 -- 7,750 3,383 9,749 2,549 118 98 38 26,043 2,355 13 |
7 0 20,116 4,160 1,008 69 40 0 -- 4,370 2,606 6,270 1,356 0 47 66 20,076 1,996 0 |
147 181 134,455 31,549 6,061 957 368 64 -- 34,660 16,777 49,622 12,571 780 922 415 139,552 11,241 319 |
| Nowood | Anita Anita Supplemental Bernstein Big Bear Enl. Elk George & Bayne Go Ahead Harmony Highland Shafer Van Alstine (Avent Western |
Spot Spot Spot Spot Spot Spot Spot Spot Spot Spot Spot Spot |
2 2 2 2 2 2 2 2 2 2 2 2 |
669 288 193 15 16 236 17 335 574 14 973 19 |
0 0 0 0 0 0 0 0 0 0 0 0 |
0 0 0 0 0 0 0 0 0 0 0 0 |
0 0 0 0 0 0 0 0 0 0 0 0 |
0 0 0 0 0 0 0 0 0 0 0 0 |
0 0 0 0 0 0 0 0 0 0 0 0 |
140 45 45 0 16 160 111 211 24 65 417 0 |
1,128 669 311 317 363 678 474 613 593 450 1,130 218 |
1,717 967 719 826 953 767 769 746 1,021 925 1,879 516 |
1,463 571 630 864 928 762 682 800 1,025 730 1,694 690 |
770 197 519 505 329 455 353 545 532 503 979 506 |
818 163 352 289 116 371 277 469 326 489 1,257 247 |
6,705 2,900 2,769 2,815 2,722 3,429 2,685 3,719 4,096 3,175 8,328 2,196 |
| Greybull/Dry | Agrarian Arnold Ashworth #2 Avent Beck and Allen Bench Canal Borner & Harvey (Borner) Brown (Croxall and Brown) Butte Cheeseman Cockins Dodge Dyer Fairview Farmer's Canal German Greybull Hurlbut J.F.W. Jimmerfield Jimmerfield-Roach Keystone Meyers Moss & Long Hollow Only Chance Pappapau Perkins Rocky Ruby Sandstone Snyder (Nichols) T.L. Tatman-St. Joe Watson Whitney Gleaver Winkle & Benbrooke Woods and Burnett |
Spot Spot Spot Spot Spot Daily Spot Spot Spot Spot Spot Spot Spot Spot Daily Spot Spot Spot Spot Spot Spot Spot Spot Spot Spot Spot Spot Spot Spot Spot Spot Spot Spot Spot Spot Spot Spot |
2 2 2 2 1 6 2 2 2 2 2 2 2 2 6 2 2 2 1 2 2 2 2 2 2 2 1 2 2 2 2 2 2 2 2 2 2 |
223 96 96 95 71 0 48 131 23 53 116 181 107 338 0 118 55 11 71 58 152 66 66 46 36 161 183 56 80 219 89 157 205 97 5 22 211 |
0 0 0 0 0 0 0 0 0 0 0 0 0 0 0 0 0 0 0 0 0 0 0 0 0 0 0 0 0 0 0 0 0 0 0 0 0 |
0 0 0 0 0 0 0 0 0 0 0 0 0 0 0 0 0 0 0 0 0 0 0 0 0 0 0 0 0 0 0 0 0 0 0 0 0 |
0 0 0 0 0 0 0 0 0 0 0 0 0 0 0 0 0 0 0 0 0 0 0 0 0 0 0 0 0 0 0 0 0 0 0 0 0 |
0 0 0 0 0 0 0 0 0 0 0 0 0 0 0 0 0 0 0 0 0 0 0 0 0 0 0 0 0 0 0 0 0 0 0 0 0 |
0 0 0 0 0 0 0 0 0 0 0 0 0 0 0 0 0 0 0 0 0 0 0 0 0 0 0 0 0 0 0 0 0 0 0 0 0 |
402 59 59 192 668 469 154 253 37 82 90 37 46 224 1,021 173 26 183 365 125 187 214 116 34 56 121 863 62 32 269 119 52 108 44 17 31 507 |
1,134 266 266 983 1,898 7,490 347 804 168 331 404 186 229 735 8,964 445 123 748 1,342 352 689 615 350 123 92 683 962 279 121 857 392 222 706 163 84 179 1,210 |
1,128 467 467 1,110 672 9,879 348 859 318 627 556 412 466 885 11,204 543 171 1,342 940 302 817 778 324 190 54 745 1,387 578 226 786 376 350 1,031 263 95 379 1,239 |
929 312 312 1,004 1,094 10,184 407 897 118 333 496 463 470 1,023 10,142 607 336 926 773 189 765 848 329 94 86 1,010 2,005 340 175 722 343 393 1,101 345 99 173 1,524 |
691 367 367 642 673 7,244 295 774 60 266 432 468 460 628 7,786 374 194 910 386 199 523 444 358 267 59 735 611 187 113 666 262 499 732 229 111 290 989 |
692 191 191 313 584 4,169 242 542 28 238 314 273 402 509 4,573 127 33 395 619 205 279 453 206 164 16 740 791 119 97 476 154 308 504 178 170 122 862 |
5,198 1,758 1,758 4,338 5,659 39,435 1,841 4,260 752 1,931 2,409 2,020 2,180 4,339 43,690 2,387 937 4,514 4,497 1,429 3,412 3,418 1,749 918 399 4,196 6,802 1,620 843 3,995 1,735 1,981 4,387 1,319 580 1,196 6,542 |
| Shoshone | Cody Canal Deaver-Frannie Canal Elk Lovell Canal Frannie Canal Garland Canal Garland-Frannie Globe Canal Heart Mountain Canal Hunt Canal Lakeview Canal North Fork Ditch Sidon Canal Willwood Canal Wilson & Mckissack |
Daily Daily Daily Daily Daily Daily Daily Daily Daily Daily Daily Daily Daily Spot |
6 4 6 0 5 0 6 6 6 6 2 6 6 2 |
0 0 0 -- 0 -- 0 0 0 0 0 0 0 307 |
0 0 0 -- 0 -- 0 0 0 0 0 0 0 0 |
0 0 0 -- 0 -- 0 0 0 0 0 0 0 0 |
0 0 0 -- 0 -- 0 0 0 0 0 0 0 0 |
0 0 0 -- 0 -- 0 0 0 0 0 0 0 0 |
0 0 0 -- 0 -- 0 0 0 0 0 0 0 0 |
2,549 4,368 6,000 -- 20,442 -- 890 9,026 2,061 1,788 0 6,506 6,665 153 |
11,412 14,362 16,021 -- 45,830 -- 2,763 33,725 5,351 10,230 1,608 14,850 16,559 492 |
10,523 13,766 16,677 -- 45,203 -- 2,358 40,381 5,642 11,637 1,953 15,816 15,180 749 |
11,815 16,013 18,046 -- 52,617 -- 2,917 45,080 7,024 10,259 2,020 17,889 20,601 756 |
9,007 15,311 16,684 -- 46,701 -- 2,833 36,250 6,709 6,702 1,822 16,902 19,044 388 |
7,369 13,542 15,281 -- 36,513 -- 2,348 26,204 5,040 4,269 1,827 13,867 14,287 362 |
52,674 77,363 88,709 -- 247,305 -- 14,110 190,665 31,826 44,886 9,232 85,830 92,335 3,208 |
| Big Horn Lake | Anita Ditch Bernie Dunshee Frieze Hatten High Line Kershner McDonald (Shell Canal) Porter Shell Canal Whaley Whaley Cemetary (How En |
Daily Spot Spot Spot Spot Spot Spot Spot Spot Spot Spot Spot |
1 2 3 3 1 1 3 3 3 3 3 1 |
0 41 73 124 0 235 167 1,674 692 1,194 403 603 |
0 0 0 0 0 0 0 0 0 0 0 0 |
0 0 0 0 0 0 0 0 0 0 0 0 |
0 0 0 0 0 0 0 0 0 0 0 0 |
0 0 0 0 0 0 0 0 0 0 0 0 |
0 0 0 0 0 0 0 0 0 0 0 0 |
1,954 66 42 48 0 0 25 778 57 381 0 0 |
8,586 230 419 806 341 500 527 5,012 1,355 3,553 1,542 1,064 |
10,931 268 473 778 159 398 548 4,966 1,312 3,484 1,264 924 |
13,983 244 428 656 177 259 343 3,958 893 2,396 952 569 |
10,739 166 536 583 117 217 314 2,779 1,217 2,022 969 372 |
10,030 139 366 238 109 232 183 1,487 909 689 848 477 |
56,223 1,152 2,336 3,233 903 1,841 2,107 20,654 6,435 13,720 5,978 4,007 |
Summary of Average Monthly and Annual Diversions (1973-2001)
Normal Years
| Sub-Basin | Diversion Name | Data Type | Years of Data | Average Monthly Flow (ac-ft) | ||||||||||||
| Oct | Nov | Dec | Jan | Feb | Mar | Apr | May | Jun | Jul | Aug | Sep | Total | ||||
| Clarks Fork Yellowstone | Bennett Creek Little Rocky | Spot Spot | 7 7 | 182 145 | 0 0 |
0 0 | 0 0 | 0 0 |
0 267 | 192 138 | 376 304 |
602 680 | 650 768 | 583 697 |
430 540 | 3,015 3,540 |
| Upper Wind | Dinwoody Canal Dry Creek Canal Johnstown Canal LeClair Canal Lefthand Canal Riverton Valley Canal Upper Wind River A Canal Wyoming Canal |
Daily Daily Daily Daily Daily Daily Daily Daily |
3 5 3 17 3 16 1 16 |
0 1,311 0 3,097 0 430 0 4,105 |
0 0 0 0 0 0 0 2,363 |
0 0 0 0 0 0 0 0 |
0 0 0 0 0 0 0 0 |
0 0 0 0 0 0 0 0 |
0 0 0 0 0 0 0 6,714 |
4,154 354 0 1,165 0 924 0 15,763 |
4,811 6,219 600 8,823 870 5,200 3,670 51,228 |
5,200 11,311 1,183 15,384 1,490 6,980 3,800 80,114 |
6,652 12,135 1,483 20,347 1,450 8,516 3,710 89,592 |
5,624 11,228 1,563 16,492 1,213 6,045 3,500 69,897 |
4,899 8,022 1,097 11,043 1,287 4,403 3,700 50,977 |
31,341 50,580 5,927 76,351 6,310 32,498 18,380 370,754 |
| Little Wind | Coolidge Canal Ray Canal Sub-Agency Canal |
Daily Daily Daily |
0 5 0 |
-- 0 -- |
-- 0 -- |
-- 0 -- |
-- 0 -- |
-- 0 -- -- |
0 -- -- | 1,099 -- -- |
6,185 -- -- |
12,337 -- -- |
15,274 -- -- |
10,814 -- -- |
7,098 -- -- |
52,808 -- |
| Upper Bighorn | Ackerman Baylor-Purvis-Thompson Big Horn Canal Bluff Canal Brassington Caledonia Chessington-Wilson Hale Highland Ditch Highland Hanover Kirby Canal Lower Hanover Canal Lower Lucerne Canal Padlock Sliney and Mikkleson/S/North Tenderfoot Upper Hanover Canal Upper Lucerne Canal Woodward-Johnson |
Spot Spot Daily Daily Spot Spot Spot Spot Daily Daily Daily Daily Daily Spot Spot Spot Daily Daily Spot |
5 2 16 17 5 5 5 5 3 2 17 16 7 5 5 5 17 7 5 |
207 113 3,588 893 17 40 31 37 188 0 230 412 0 29 43 250 5,044 0 38 |
206 0 0 0 5 0 0 0 0 0 0 8 0 0 0 366 0 0 0 |
0 0 0 0 0 0 0 0 0 0 0 6 0 0 0 0 0 0 0 |
0 0 0 0 0 0 0 0 0 0 0 8 0 0 0 0 0 0 0 |
0 0 0 0 0 0 0 0 0 0 0 8 0 0 0 0 0 0 0 |
180 37 0 0 0 692 185 0 0 0 0 8 0 0 129 0 0 0 231 |
199 12 12,116 2,670 0 428 87 99 0 1,630 371 3,827 409 89 302 272 10,974 265 122 |
373 400 24,545 5,593 150 527 295 273 1,919 4,790 2,996 8,045 1,983 391 859 461 24,725 1,889 321 |
410 483 26,309 6,176 245 594 359 329 2,191 6,093 3,710 9,082 2,147 653 776 567 27,304 1,991 319 |
211 220 29,836 6,862 80 339 318 169 2,131 7,465 4,074 10,843 2,640 491 728 256 30,272 2,245 194 |
165 195 27,221 6,432 149 211 148 179 1,205 7,510 3,750 9,418 2,269 163 242 178 27,809 2,116 117 |
131 102 22,833 5,149 187 98 107 125 1,621 4,615 2,799 6,042 1,556 46 42 246 23,274 1,747 82 |
2,082 1,561 146,448 33,774 833 2,929 1,529 1,212 9,256 32,103 17,932 47,706 11,003 1,862 3,122 2,595 149,403 10,252 1,423 |
| Nowood | Anita Anita Supplemental Bernstein Big Bear Enl. Elk George & Bayne Go Ahead Harmony Highland Shafer Van Alstine(Avent Western |
Spot Spot Spot Spot Spot Spot Spot Spot Spot Spot Spot Spot |
7 7 7 7 7 7 7 7 7 7 7 6 |
440 122 113 129 147 157 112 96 201 151 426 114 |
0 0 0 0 0 0 0 0 0 0 0 0 |
0 0 0 0 0 0 0 0 0 0 0 0 |
0 0 0 0 0 0 0 0 0 0 0 0 |
0 0 0 0 0 0 0 0 0 0 0 0 |
0 0 0 0 0 0 0 0 0 0 0 0 |
340 99 47 37 36 145 94 246 71 196 562 45 |
1,098 283 276 202 186 335 321 495 400 457 1,145 248 |
1,250 331 556 516 432 430 446 525 673 708 1,261 622 |
1,112 425 576 560 460 476 498 529 742 745 1,307 473 |
1,030 393 458 530 457 494 429 452 764 643 1,341 429 |
994 317 319 376 364 434 362 354 596 450 1,037 313 |
6,264 1,970 2,346 2,350 2,083 2,471 2,262 2,696 3,446 3,349 7,078 2,246 |
| Greybull/Dry | Agrarian Arnold Ashworth #2 Avent Beck and Allen Bench Canal Borner & Harvey (Borner) Brown (Croxall and Brown) Butte Cheeseman Cockins Dodge Dyer Fairview Farmer's Canal German Greybull Hurlbut J.F.W. Jimmerfield Jimmerfield-Roach Keystone Meyers Moss & Long Hollow Only Chance Pappapau Perkins Rocky Ruby Sandstone Snyder (Nichols) T.L. Tatman-St. Joe Watson Whitney Gleaver Winkle & Benbrooke Woods and Burnett |
Spot Spot Spot Spot Spot Daily Spot Spot Spot Spot Spot Spot Spot Spot Daily Spot Spot Spot Spot Spot Spot Spot Spot Spot Spot Spot Spot Spot Spot Spot Spot Spot Spot Spot Spot Spot Spot |
6 6 6 6 2 16 6 6 6 6 6 6 6 6 15 6 6 6 2 6 6 6 6 6 6 6 2 6 6 6 6 6 6 6 6 6 5 |
462 73 73 147 54 0 117 132 12 117 130 73 88 263 0 139 57 80 305 108 111 161 61 32 23 154 395 59 34 401 71 113 230 65 39 58 310 |
0 0 0 0 0 0 0 0 0 0 0 0 0 0 0 0 0 0 0 0 0 0 0 0 0 0 0 0 0 0 0 0 0 0 0 0 0 |
0 0 0 0 0 0 0 0 0 0 0 0 0 0 0 0 0 0 0 0 0 0 0 0 0 0 0 0 0 0 0 0 0 0 0 0 0 |
0 0 0 0 0 0 0 0 0 0 0 0 0 0 0 0 0 0 0 0 0 0 0 0 0 0 0 0 0 0 0 0 0 0 0 0 0 |
0 0 0 0 0 0 0 0 0 0 0 0 0 0 0 0 0 0 0 0 0 0 0 0 0 0 0 0 0 0 0 0 0 0 0 0 0 |
0 0 0 0 0 0 0 0 0 0 0 0 0 0 0 0 0 0 0 0 0 0 0 0 0 0 0 0 0 0 0 0 0 0 0 0 0 |
391 136 136 191 782 1,269 98 204 53 119 157 101 114 515 1,555 118 113 54 510 158 171 253 115 82 94 175 737 90 69 220 84 111 146 59 42 56 603 |
1,273 470 470 709 1,486 8,194 308 679 178 409 482 385 483 1,339 8,826 531 448 184 720 391 514 596 447 262 289 588 1,416 327 259 1,097 392 432 804 216 136 298 1,383 |
1,703 716 716 1,157 845 12,249 364 1,077 504 1,175 654 757 806 2,321 11,630 983 778 868 1,161 597 883 1,220 651 312 442 1,235 1,940 926 494 1,706 582 739 1,618 431 229 786 1,528 |
2,064 746 746 1,303 1,170 15,165 393 1,233 357 681 627 657 773 2,653 13,211 931 661 996 1,008 583 1,279 1,365 514 166 386 1,004 1,944 753 445 1,496 659 761 1,834 503 117 528 2,183 |
1,993 587 587 999 577 12,190 382 981 169 443 649 732 706 1,867 11,336 713 617 366 933 491 1,033 777 494 181 295 782 1,522 750 457 1,570 658 604 1,480 372 117 551 1,798 |
1,246 242 242 489 312 7,905 252 669 69 246 423 437 356 1,163 7,160 422 276 126 495 329 566 440 319 176 129 576 978 233 274 1,028 351 342 800 232 99 118 1,092 |
9,133 2,970 2,970 4,995 5,225 56,971 1,914 4,975 1,341 3,191 3,122 3,144 3,326 10,120 53,717 3,837 2,949 2,675 5,133 2,657 4,558 4,813 2,600 1,211 1,657 4,514 8,931 3,138 2,032 7,517 2,796 3,101 6,910 1,878 779 2,395 8,897 |
| Shoshone | Cody Canal Deaver-Frannie Canal Elk Lovell Canal Frannie Canal Garland Canal Garland-Frannie Globe Canal Heart Mountain Canal Hunt Canal Lakeview Canal North Fork Ditch Sidon Canal Willwood Canal Wilson & Mckissack |
Daily Daily Daily Daily Daily Daily Daily Daily Daily Daily Daily Daily Daily Spot |
16 9 16 2 13 2 16 14 16 16 4 17 15 4 |
1,624 0 5,845 23,504 24,627 23,504 1,031 11,358 2,024 720 0 3,546 7,102 258 |
0 0 0 0 0 0 0 0 0 0 0 0 91 0 |
0 0 0 0 0 0 0 0 0 0 0 0 0 0 |
0 0 0 0 0 0 0 0 0 0 0 0 0 0 |
0 0 0 0 0 0 0 0 0 0 0 0 0 0 |
0 0 0 0 0 0 0 0 0 0 0 0 0 0 |
1,715 3,912 4,428 3,199 16,204 3,199 643 7,422 1,480 1,039 99 5,621 6,231 84 |
9,689 15,041 15,462 40,481 45,876 40,481 2,311 27,516 5,302 7,054 1,614 13,876 15,054 493 |
15,739 15,679 19,144 47,299 49,545 47,299 2,803 47,656 6,271 13,225 2,099 16,163 16,623 1,138 |
16,387 16,104 21,233 52,630 54,091 52,630 3,373 51,994 7,123 14,142 2,110 18,304 21,865 1,568 |
12,782 16,468 20,018 51,686 49,973 51,686 3,240 44,158 6,695 11,662 2,030 17,417 20,609 1,262 |
8,956 15,178 16,731 37,606 39,699 37,606 2,684 29,753 5,494 7,822 1,818 14,562 16,127 794 |
66,892 82,381 102,861 256,405 280,015 256,405 16,086 219,858 34,388 55,663 9,770 89,490 103,703 5,597 |
| Big Horn Lake | Anita Ditch Bernie Dunshee Frieze Hatten High Line Kershner McDonald (Shell Canal) Porter Shell Canal Whaley Whaley Cemetary (Howard En |
Daily Spot Spot Spot Spot Spot Spot Spot Spot Spot Spot Spot |
3 4 6 6 4 4 6 6 6 6 6 4 |
8,110 98 35 105 63 157 70 1,150 404 1,082 326 311 |
0 0 0 0 0 0 0 0 0 0 0 0 |
0 0 0 0 0 0 0 0 0 0 0 0 |
0 0 0 0 0 0 0 0 0 0 0 0 |
0 0 0 0 0 0 0 0 0 0 0 0 |
0 0 0 0 0 0 0 0 0 0 0 0 |
1,585 112 72 164 21 204 75 894 246 716 244 118 |
9,626 240 354 748 310 503 404 4,583 920 3,428 1,381 982 |
14,172 338 532 898 303 421 553 4,669 1,335 3,551 1,217 947 |
14,910 186 500 885 365 434 513 5,293 1,345 3,365 1,119 669 |
14,715 93 417 831 223 383 387 4,572 1,421 3,488 1,262 609 |
13,418 90 258 510 168 331 228 3,091 1,091 2,227 831 612 |
76,536 1,158 2,168 4,141 1,452 2,433 2,230 24,252 6,763 17,858 6,379 4,249 |
Summary of Average Monthly and Annual Diversions (1973-2001)
Wet Years
| Sub-Basin | Diversion Name | Data Type | Years of Data | Average Monthly Flow (ac-ft) | ||||||||||||
| Oct | Nov | Dec | Jan | Feb | Mar | Apr | May | Jun | Jul | Aug | Sep | Total | ||||
| Clarks Fork Yellowstone | Bennett Creek Little Rocky |
Spot Spot |
2 2 |
229 203 |
0 0 |
0 0 |
0 0 |
0 0 |
0 0 |
150 51 | 388 356 |
601 373 |
780 735 |
758 641 |
683 570 |
3,588 2,931 | Upper Wind | Dinwoody Canal Dry Creek Canal Johnstown Canal LeClair Canal Lefthand Canal Riverton Valley Canal Upper Wind River A Canal Wyoming Canal |
Daily Daily Daily Daily Daily Daily Daily Daily |
3 4 4 6 4 6 2 4 |
280 1,435 0 0 0 0 0 0 |
0 0 0 0 0 0 0 0 |
0 0 0 0 0 0 0 0 |
0 0 0 0 0 0 0 0 |
0 0 0 0 0 0 0 0 |
0 0 0 0 0 0 0 0 |
0 231 0 1,203 0 913 0 13,695 |
276 4,575 451 6,990 841 4,505 2,498 40,333 |
1,379 9,154 1,188 15,545 1,172 6,278 3,422 70,818 |
1,425 12,226 1,713 21,908 1,543 8,748 3,529 96,880 |
1,597 11,721 1,530 17,409 1,447 6,967 3,489 74,855 |
1,096 8,032 1,139 12,847 1,085 5,060 2,587 56,593 |
6,052 47,375 6,022 75,901 6,087 32,471 15,526 353,173 |
| Little Wind | Coolidge Canal Ray Canal Sub-Agency Canal |
Daily Daily Daily |
0 4 0 |
-- 2,774 -- |
-- 0 -- |
-- 0 -- |
-- 0 -- |
-- 0 -- |
-- 0 -- |
-- 673 -- |
-- 4,643 -- |
-- 9,091 -- |
-- 15,975 -- |
-- 12,266 -- |
-- 7,400 -- |
-- 52,823 -- |
| Upper Bighorn | Ackerman Baylor-Purvis-Thompson Big Horn Canal Bluff Canal Brassington Caledonia Chessington-Wilson Hale Highland Ditch Highland Hanover Kirby Canal Lower Hanover Canal Lower Lucerne Canal Padlock Sliney and Mikkleson/S-North Tenderfoot Upper Hanover Canal Upper Lucerne Canal Woodward-Johnson |
Spot Spot Daily Daily Spot Spot Spot Spot Daily Daily Daily Daily Daily Spot Spot Spot Daily Daily Spot |
5 3 6 5 5 5 5 5 3 4 6 6 6 5 5 5 6 6 5 |
50 74 0 0 204 36 57 13 288 0 0 0 0 26 27 164 0 0 54 |
0 0 0 0 0 0 0 0 0 0 0 0 0 0 0 0 0 0 0 |
0 0 0 0 0 0 0 0 0 0 0 0 0 0 0 0 0 0 0 |
0 0 0 0 0 0 0 0 0 0 0 0 0 0 0 0 0 0 0 |
0 0 0 0 0 0 0 0 0 0 0 0 0 0 0 0 0 0 0 |
240 0 0 0 0 179 0 219 0 0 0 0 0 0 289 7 0 0 257 |
54 102 13,387 2,148 0 278 78 117 0 1,158 184 4,953 65 118 224 153 13,663 41 114 |
330 179 27,553 5,504 270 512 242 317 1,577 4,700 3,443 7,970 1,578 336 701 396 26,410 1,328 358 |
208 534 28,770 6,080 287 360 304 406 1,333 5,085 4,550 9,768 2,395 701 1,675 331 29,578 1,923 363 |
143 495 34,045 6,928 195 96 489 248 2,012 7,515 4,747 11,652 3,003 568 454 183 33,050 2,355 383 |
76 317 30,333 6,404 224 82 352 161 2,554 6,525 4,162 10,122 2,410 221 259 223 30,212 2,303 217 |
122 188 24,733 5,034 332 63 183 105 1,880 3,518 3,882 5,733 1,248 148 152 265 23,045 1,605 98 |
1,223 1,890 158,822 32,098 1,511 1,605 1,706 1,586 9,644 28,500 20,967 50,198 10,699 2,118 3,781 1,723 155,958 9,556 1,844 |
| Nowood | Anita Anita Supplemental Bernstein Big Bear Enl. Elk George & Bayne Go Ahead Harmony Highland Shafer Van Alstine (Avent Western |
Spot Spot Spot Spot Spot Spot Spot Spot Spot Spot Spot Spot |
2 2 2 1 2 2 2 2 2 2 2 2 |
433 0 11 120 65 281 284 13 254 175 806 160 |
0 0 0 0 0 0 0 0 0 0 0 0 |
0 0 0 0 0 0 0 0 0 0 0 0 |
0 0 0 0 0 0 0 0 0 0 0 0 |
0 0 0 0 0 0 0 0 0 0 0 0 |
0 0 0 0 0 0 0 0 0 0 0 0 |
180 73 11 0 21 62 16 112 118 10 270 0 |
816 250 268 431 354 304 258 383 470 348 1,074 175 |
1,025 356 495 972 540 421 400 449 678 618 1,261 411 |
877 285 392 534 376 373 357 438 659 416 1,157 271 |
939 255 370 479 496 400 376 384 648 363 1,166 194 |
774 234 349 303 255 358 295 276 382 339 1,003 274 |
5,043 1,453 1,896 2,839 2,106 2,199 1,985 2,056 3,210 2,270 6,738 1,485 |
| Greybull/Dry | Agrarian Arnold Ashworth #2 Avent Beck and Allen Bench Canal Borner & Harvey (Borner) Brown (Croxall and Brown) Butte Cheeseman Cockins Dodge Dyer Fairview Farmer's Canal German Greybull Hurlbut J.F.W. Jimmerfield Jimmerfield-Roach Keystone Meyers Moss & Long Hollow Only Chance Pappapau Perkins Rocky Ruby Sandstone Snyder (Nichols) T.L. Tatman-St. Joe Watson Whitney Gleaver Winkle & Benbrooke Woods and Burnett |
Spot Spot Spot Spot Spot Daily Spot Spot Spot Spot Spot Spot Spot Spot Daily Spot Spot Spot Spot Spot Spot Spot Spot Spot Spot Spot Spot Spot Spot Spot Spot Spot Spot Spot Spot Spot Spot |
4 4 4 4 3 6 4 4 4 4 4 4 4 4 6 4 4 4 3 4 4 4 4 4 4 4 3 4 4 4 4 4 4 4 4 4 5 |
664 96 96 183 90 1,040 116 52 0 0 67 76 0 522 794 180 80 0 340 34 151 0 51 75 30 20 402 58 77 203 76 185 232 44 93 0 219 |
0 0 0 0 0 0 0 0 0 0 0 0 0 0 0 0 0 0 0 0 0 0 0 0 0 0 0 0 0 0 0 0 0 0 0 0 0 |
0 0 0 0 0 0 0 0 0 0 0 0 0 0 0 0 0 0 0 0 0 0 0 0 0 0 0 0 0 0 0 0 0 0 0 0 0 |
0 0 0 0 0 0 0 0 0 0 0 0 0 0 0 0 0 0 0 0 0 0 0 0 0 0 0 0 0 0 0 0 0 0 0 0 0 |
0 0 0 0 0 0 0 0 0 0 0 0 0 0 0 0 0 0 0 0 0 0 0 0 0 0 0 0 0 0 0 0 0 0 0 0 0 |
0 0 0 0 0 0 0 0 0 0 0 0 0 2,260 0 0 0 0 0 0 271 0 0 0 0 0 581 0 0 0 0 0 1,118 0 0 0 0 |
542 184 184 66 524 1,894 122 316 73 172 183 45 252 816 2,833 103 83 211 451 26 306 100 102 23 133 120 740 77 15 403 64 145 441 29 27 115 595 |
1,470 596 596 703 1,382 10,258 304 832 235 698 430 262 878 1,688 11,310 632 407 707 1,186 392 560 874 609 40 448 334 1,682 339 100 1,075 600 529 993 153 53 494 1,374 |
1,599 544 544 545 861 11,581 281 850 298 989 468 577 729 1,896 10,792 674 754 746 1,048 391 644 856 506 104 668 600 1,585 725 394 1,229 426 786 1,072 274 137 494 1,304 |
2,132 599 599 1,226 1,431 17,442 320 1,354 175 459 550 666 888 2,861 14,309 1,261 927 1,004 1,540 498 1,281 1,604 827 187 675 715 2,219 728 370 1,794 699 605 2,206 351 136 320 1,861 |
1,909 638 638 1,065 734 12,947 339 1,067 41 393 515 802 792 2,322 10,788 979 542 305 1,235 397 973 1,072 581 201 362 551 1,988 676 345 1,605 702 556 1,463 344 87 490 1,921 |
1,541 388 388 658 545 8,234 287 602 12 231 310 449 504 1,501 7,596 594 390 15 943 311 590 702 333 168 215 277 1,227 269 207 1,022 477 379 1,005 204 138 292 1,189 |
9,856 3,046 3,046 4,446 5,568 63,395 1,769 5,074 834 2,942 2,522 2,877 4,043 13,865 58,422 4,423 3,182 2,988 6,743 2,049 4,777 5,208 3,009 798 2,532 2,616 10,425 2,873 1,507 7,332 3,044 3,185 8,530 1,399 671 2,204 8,462 |
| Shoshone | Cody Canal Deaver-Frannie Canal Elk Lovell Canal Frannie Canal Garland Canal Garland-Frannie Globe Canal Heart Mountain Canal Hunt Canal Lakeview Canal North Fork Ditch Sidon Canal Willwood Canal Wilson & Mckissack |
Daily Daily Daily Daily Daily Daily Daily Daily Daily Daily Daily Daily Daily Spot |
6 3 6 2 4 2 6 6 6 6 2 6 6 3 |
3,709 8,110 378 21,775 0 21,775 651 11,439 994 2,467 0 2,485 5,980 356 |
0 0 0 0 0 0 0 0 0 0 0 0 0 0 |
0 0 0 0 0 0 0 0 0 0 0 0 0 0 |
0 0 0 0 0 0 0 0 0 0 0 0 0 0 | 0 0 0 0 0 0 0 0 0 0 0 0 0 0 |
0 0 0 0 0 0 0 0 0 0 0 0 0 0 |
1,285 3,790 5,012 16,268 15,091 16,268 509 6,618 1,504 989 0 4,990 5,418 152 |
12,098 15,610 18,887 52,044 44,426 52,044 3,116 24,201 6,102 8,352 1,375 13,412 16,713 765ff |
14,255 15,765 19,146 45,709 47,007 45,709 2,843 35,768 5,754 12,464 2,120 13,407 13,890 1,323 |
16,742 16,940 22,274 54,837 53,150 54,837 3,682 41,836 6,698 14,724 2,100 15,531 21,743 1,790 |
15,153 17,225 20,962 48,835 47,487 48,835 3,301 35,301 6,435 13,601 1,645 15,687 19,128 1,311 |
9,586 15,825 16,761 37,793 38,497 37,793 3,010 22,823 5,916 9,117 1,605 12,591 14,058 775 |
72,828 93,265 103,419 277,262 245,658 277,262 17,111 177,985 33,401 61,713 8,845 78,104 96,929 6,472 |
| Big Horn Lake | Anita Ditch Bernie Dunshee Frieze Hatten High Line Kershner McDonald (Shell Canal) Porter Shell Canal Whaley Whaley Cemetary (Howard En |
Daily Spot Spot Spot Spot Spot Spot Spot Spot Spot Spot Spot |
0 2 3 3 1 1 2 3 3 3 3 2 |
-- 115 87 172 322 350 48 1,121 569 1,152 795 1,299 |
-- 0 0 0 0 0 0 0 0 0 0 0 |
-- 0 0 0 0 0 0 0 0 0 0 0 |
-- 0 0 0 0 0 0 0 0 0 0 0 |
-- 0 0 0 0 0 0 0 0 0 0 0 |
-- 0 0 0 0 0 0 0 0 0 0 0 |
-- 21 85 76 12 0 215 931 2 670 180 172 |
-- 214 164 646 174 260 522 3,655 788 2,676 1,369 756 |
-- 171 184 1,064 191 430 555 4,902 1,781 3,700 1,248 954 |
-- 84 337 874 300 745 546 5,942 1,563 3,867 1,328 837 |
-- 162 323 836 256 715 529 5,166 1,543 3,294 1,189 749 |
-- 133 206 575 231 447 446 3,827 1,122 2,647 1,004 601 |
-- 901 1,386 4,244 1,486 2,947 2,860 25,544 7,366 18,005 7,113 5,369 |