Wyoming State Water Plan
Wyoming State Water Plan
Wyoming Water Development Office
6920 Yellowtail Rd
Cheyenne, WY 82002
Phone: 307-777-7626

Wyoming Water Development Office
6920 Yellowtail Rd
Cheyenne, WY 82002
Phone: 307-777-7626


CHAPTER 4 FUTURE WATER USE PROJECTIONS
4.1 . Socioeconomic Factors and Water Demand
4.1.1 . Methodological Considerations
Water demand is a function of environmental, economic, demographic, cultural and institutional variables. Among these, the first three are primary variables, but all must be considered if realistic projections are to be made. Credible projections also demand good data, both quantitative and qualitative.
Wyoming is somewhat atypical sociologically, demographically and economically, compared to most other states. The state.s anomalous character is particularly clear in the nature of its economy, which is an outlier in terms of correlation with the national economy: what happens in Wyoming does not necessarily reflect what is happening nationally (Smith, 1996). If the state is anomalous, it seems even more the case in regard to analyses of sub-state entities, such as the counties of the WBHB, which differ in several ways from other regions of the state.
Still, the situations faced by the WBHB counties are not unique. A useful approach to economic and social analyses of the WBHB is the typology used by the U. S. Department of Agriculture.s Economic Research Service (ERS) to analyze counties. Twenty-one of Wyoming.s 23 counties are classified as .non-metro. by the ERS, Natrona and Laramie are the only two .metro. counties in the state.
The ERS classifies all five WBHB counties as .Federal lands counties.. Federal lands counties (there are 270 thus classified in the United States) are those in which at least 30% of the land is owned by the Federal Government. According to ERS, .Federal lands counties (270) have land areas dominated by Federal ownership. 76% of these counties are in Western States. Counties in this type have larger land areas and are more sparsely populated than all non-metro counties. On average, population in these counties grew faster during the 1980's than in all non-metro counties. Nearly 70% of jobs in the average federal lands county are in the services or government sectors, reflecting the recreational use and land management functions of the group..(USDA, Briefing)
Federal ownership of 61% of the land in the WBHB certainly plays a crucial role in economic structure and development, in demographic characteristics, and indisputably in water demand. Beyond land ownership patterns, three other characteristics constrain the WBHB.s potential for rapid, diverse economic growth: remoteness from large markets, a small labor force, and relatively underdeveloped transportation and communications infrastructures.
Many, but not all, Wyoming counties enjoy the presence of healthy minerals-related industries, which typically offer above average pay. When economic development is closely tied, as the WBHB.s tends to be, to publicly owned natural resources that are not uniformly distributed across the region, intra-regional differences are often significant. Mineral resources, which have been the WBHB.s major revenue source, whether coal, petroleum or gas, are declining. However, the U.S. Department of Energy.s Energy Information Administration has estimated demand increases over the next two decades of 33% for oil, 62% for natural gas, and for electrical power 45%.(Barnes) Certainly such an increase in demand might spur continuing energy production in the WBHB. It could maintain existing jobs and produce new ones in energy production and distribution, as well as invigorate service industries.
In sum, current prospects for significant and diverse growth in the WBHB do not appear likely. The WBHB is far from out-of-state population centers such as Denver and Salt Lake City, the proximity to which boosts the economies of some Wyoming communities and counties. It must be understood that the WBHB.s tourism and recreation-based businesses, which produce jobs mainly in the service sector, are enhanced by the very characteristic, remote and relatively .unspoiled. country that could be most threatened by large-scale economic development. Despite the many similarities among WBHB counties, it is instructive to consider demographic and economic differences among them.
It should be noted that a small area in northwest Natrona County lies within the Wind/Bighorn watershed, while a portion of the southeast corner of Fremont County lies outside the Wind/Bighorn drainage, in the Green River drainage. Both these areas are very thinly populated. The people in this area of Fremont County area are included in the demography of the WBHB Plan, though its water situation is not. In the case of the Natrona County section, its population is not incorporated in the WBHB demographic analysis. Two or three small, generally intermittent streams that head in Natrona County flow into Washakie and Fremont Counties. There are also portions of Teton County within the watershed, but they are virtually uninhabited mountain areas. It must be noted that a good-sized, but sparsely populated section of southern Fremont County is outside the Wind/Bighorn drainage. The area south of Atlantic City and South Pass City, extending east to Jeffrey City, is drained by the Sweetwater River, which flows eastward to its juncture with the North Platte, in Natrona County. For the purposes of this analysis, it has been assumed that much of the economic activity of this section of Fremont County is closely related to the rest of the County, particularly the Lander area. The population does not exceed a few hundred. Portions of Yellowstone National Park also lie within the WBHB, but consumptive surface water use within the portion of the Park in the WBHB drainage is limited.
4.1.2 . Demographic Overview
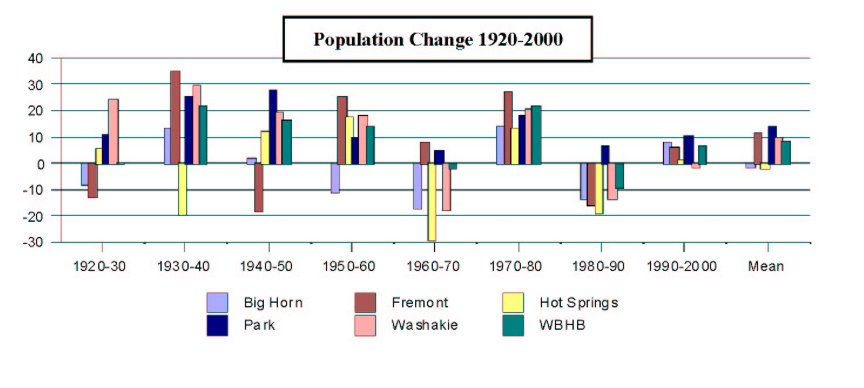
The determinants of demographic change are mortality and fertility rates, and migration patterns. Common methods of projecting populations include time-series, cohort survival, and employment-driven analyses. Projections of Wyoming.s and the WBHB.s future populations, however, may best be assessed by time-series and employment-driven analyses. According to the 2000 U.S. Census, the combined population of the WBHB counties was 86,222, about 17% of Wyoming.s people. For the WBHB, this is an increase over 1990, when the count was 80,562, but below the historic high of 1980, when the census recorded 87,773 WBHB inhabitants. Table 4.1-1 displays county populations from 1920 to 2000. Park County is the only county never to experience a population decline from one census to the next. Figure 4.1-1 presents population changes in terms of percentages.
Table 4.1-1 U.S. Census, by County, 1920-2000
| County | 1920 | 1930 | 1940 | 1950 | 1960 | 1970 | 1980 | 1990 | 2000 |
| Big Horn | 12105 | 11222 | 12911 | 13176 | 11898 | 10202 | 11896 | 10525 | 11461 |
| Fremont | 11820 | 10490 | 16905 | 19580 | 26168 | 28352 | 38992 | 33662 | 35804 |
| Hot Springs | 5164 | 5476 | 4607 | 5250 | 6365 | 4952 | 5710 | 4809 | 4882 |
| Park | 7298 | 8207 | 10976 | 15182 | 16874 | 17752 | 21639 | 23178 | 25786 |
| Washakie | 3106 | 4109 | 5858 | 7252 | 8883 | 7569 | 9496 | 8388 | 8289 |
| Total | 39493 | 39504 | 50447 | 60440 | 70188 | 68827 | 87733 | 80562 | 86222 |
Figure 4.1-1
4.1.2.1 . Historical Demography
Historical data suggests that demographic trends in Wyoming are more closely linked to economic variables that stimulate in- or out-migration than to mortality or fertility rates. The national population has increased with each decennial US Census, and Wyoming has followed suit with one exception, its 1980 census count was higher than that of 1990. Even though Wyoming reached a new population high in 2000, its growth rate lagged those of Colorado, Utah, Idaho and Montana. Wyoming.s growth was comparable to Nebraska.s and South Dakota.s.
Although the WBHB.s population peaked along with the state.s in 1980, among the WBHB counties, population highs are scattered across the decades. Big Horn County.s high was in 1950 (13,176), Hot Springs. in 1960 (6,365). Fremont and Washakie experienced population highs in 1980 (38,992 in Fremont; 9,496 in Washakie). Among the WBHB counties, only Park County.s population peaked (at 25,786) in 2000, along with those of Wyoming and the Nation. The WBHB.s 1980 population high proceeded by two decades the State.s high (493,782 in 2000), and in the 1960.s and 1980.s the WBHB lost population.
Statistically, despite these anomalies, population trends in Fremont, Park and Washakie counties correlate reasonably well with national and state population trends. In Big Horn and Hot Springs, however, trends do not correlate significantly with each other, the other WBHB counties, the state, or the nation. Clearly population dynamics in the WBHB differ among counties. If economics is a force in population change, and the WBHB counties diverge in that respect, we should expect to find economic differences among the counties.
Since the ways in which the five WBHB counties differ may not be intuitively obvious, a WBHB wide summary might ignore important variations, which differentially affect the size and structure of county economies and populations, and therefore water demand and usage. Such a summary, therefore, must consider each county separately, as well as the WBHB as a whole.
Fremont, Park and Big Horn Counties are considerably larger in area than Washakie and Hot Springs. The two smaller counties also differ from the other three in that they each have one dominant population center, Worland and Thermopolis respectively, while the larger counties all have multiple population centers.
It is not difficult to account for most of the larger population fluctuations. Over the eighty years of change charted in Table 4.1-1, it is clear that the post-World War II years were times of rapid growth, as were the latter 1970.s, while the basin wide population declined or experienced slower growth in the 1960.s and later 1980.s. Declining or slow growth rates primarily reflect downturns in mining, particularly uranium, oil and gas in Fremont County and coal, oil and gas in Hot Springs and Washakie.
From 1947 to 1960 Wyoming oil production increased 199%, but since 1985 Wyoming oil production has experienced a steady decline. In the latter half of the 1980.s, foreign production cut into the oil market, and an oversupply of petroleum developed, lasting through the 1990.s. Despite large increases in natural gas production in Wyoming after 1985, price fluctuations and the fact that there is as yet no significant development of coalbed methane fields in the WBHB, meant that the region profited less than areas of the state with developing methane fields.
Although coal has been mined in the WBHB for many years, most production was from underground mines. After the mid-1950.s, diminished underground reserves, stronger environmental laws (e.g., Clean Air Act, Water Quality Act, National Environmental Policy Act), competition from surface mines in other areas of the state, and competition from other energy sources rendered the WBHB.s coal industry effectively defunct.
4.1.2.2 . Population Forecasts
Classical methods of population projection may not be the best way to analyze population changes in the WBHB. Wyoming.s and the WBHB.s birthrates are low and the population is aging. Natural population increase will not raise the population by much, if any. Migration is the key factor in the WBHB's population growth, and economic changes drive migration.
The number of babies born in Wyoming is the lowest among the states (6,252 in 1998), the state.s birth rate is 40th and its fertility rate 46th among the 50 states (National Vital Statistics Report, 2000). Wyoming.s birth rate is consistently below the national rate and WBHB counties have been below the state birth rate more than 60% of the time over the past five years. Only Big Horn and Fremont counties have exceeded the state rate. In 1999 Wyoming.s birth rate fell to a record low of 12.8 births per 1,000 population. (Wyoming State Department of Health, 1996-2000)
The WBHB.s population is aging: the median age is about 39 years, ranging from about 36 in Fremont County to about 44 in Hot Springs County. The national median age is 35.3. The U.S. Census Bureau ranks Wyoming 6th among the states in growth of the elderly (65+) population. Wyoming.s birth rates are low and death rates are high.
Although the percentages of women giving birth in their 30.s and 40.s has increased in recent years, data suggests that only heavy immigration of young people can provide a significant boost to Wyoming.s population. A net out-migration of young people constrains the job skills level of the state and of the WBHB, a disincentive for many types of companies to locate in the region, particularly in fields needing .high-tech. skills. This emigration also has an impact on population levels.
Significant immigration of young people to the WBHB seems unlikely unless there are changes in the WBHB.s fundamental economic pattern, making more and better paying jobs available. The historic pattern of reliance upon mining, agriculture, and tourism does not offer many such jobs. Since this pattern is long-standing, and because there are no obvious reasons to think it will suddenly change, historic trends may well be the best indicator of the future. Wyoming.s Department of Employment has projected that job growth in Wyoming will be in .the production, construction, operating, maintenance, and material handling occupations. In contrast, the greatest growth nationally will occur in the professional, paraprofessional, and technical occupations. This difference will create a labor force in Wyoming that requires less education and technical skill than that of the nation.. (Wyoming Department of Employment, 2000)
4.1.2.3 . High, Medium, and Low Growth Scenarios
Because the river basin planning process requires the development of water demand projections three decades in the future, it is necessary to project populations for those decades. However, with respect to water demand, population changes directly impact only municipal and domestic use. Water demand projection for uses, such as industrial and agricultural, are based on specific foreseeable developments and/or projects as discussed, subsequently. Over the 80 years examined herein, the WBHB.s mean population change per decade is 8.67%. (Wyoming.s population grew by 8.9% during the decade of the 1990.s, while the national average was 13.2%).
Table 4.1-2, which follows, shows a variety of population projections, which could be made utilizing various methods and assumptions. For the purpose of projecting population related changes in water demand, domestic and municipal primarily, the following low, moderate, and high forecasting scenarios are recommended for the purposes of this basin plan.
Low Growth Scenario: The low growth scenario could be projected as a negative growth (projections 1 and 2) or as very slight growth (Method 3). For the purpose of the basin plan it is recommended that for the low growth scenario the population be predicted to remain the same at 86,222 for the next 30 years.
Moderate Growth Scenario: Previous basin plans utilized the state forecast as the moderate growth scenario, for consistency the WY projection (Method 4) will be used as the average growth for the WBHB (88,720 in 2010, 91,620 in 2020, and 94,600 in 2030).
High Growth Scenario: The long term percent change by county averages (Method 8) was used to project the high scenario, as this is most representative of the WBHB during both growth and decline periods (94,508 in 2010, 103,858 in 2020, and 114,407 in 2030).
The cohort by census projection could also be used for the high growth scenario. These projections vary by less than one percent over 30 years. It is noted that the projection using the Powder/Tongue growth scenario (projection 6), was presented for comparative purposes. This projection reflects the recent energy boom in that area and is similar to the recommended high growth projection.
Table 4.1-2: Results from various projection methods ranging from lowest to highest:
| Method 1 | Method 2 | Method 3 | Method 4 | Method 5 | Method 6 | |
| Current | 86,222 | 86,222 | 86,222 | 86,222 | 86,222 | 86,222 |
| 2010 | 76,293 | 83,423 | 86,571 | 88,720 | 90,684 | 93,713 |
| 2020 | 68,570 | 78,885 | 87,991 | 91,620 | 95,786 | 102,802 |
| 2030 | 62,632 | 74,593 | 90,403 | 94,600 | 101,241 | 112,773 |
| Current | Method 7 | Method 8 | Method 9 | Method 10 | Method 11 | Method 12 |
| 2010 | 86,222 | 86,222 | 86,222 | 86,222 | 86,222 | |
| 2020 | 94,390 | 94,508 | 96,519 | 99,100 | 103,707 | 110,944 |
| 2030 | 103,583 | 103,858 | 105,878 | 111,319 | 126,128 | 143,202 |
| 113,927 | 114,407 | 116,437 | 125,044 | 153,574 | 185,378 | |
4.1.3 . The Basin.s Economy
The WBHB.s economy, like Wyoming.s as a whole, has long depended on a triad of industries: mining (especially coal, oil and gas), tourism, and agriculture. Mining.s annual payroll in Wyoming nearly doubles that of retail trade, the nearest competing sector. In terms of numbers of jobs it trails only retail trade and accommodation, and food services (U.S. Census Bureau, 1997). Other economic sectors are, of course, significantly impacted by events in the minerals industries.
The WBHB.s economy is dominated by the larger and somewhat more diverse economies of Fremont and Park Counties, which together account for about 60% of the Basin.s land area and 72% of its population. In recent years these counties have accounted for 60% to 80% of retail tax collection in the Basin (Wyoming Department of Revenue). This disparity among counties is not unusual: .a third of all rural counties captured three-fourths of all rural economic gains in the 1990s. (Drabenstott). Statistical analysis indicates that Fremont County.s population trends are the strongest factor in, and the best indicator of, the WBHB.s overall demographic trends.
Despite the economic dominance of Park and Fremont Counties, Washakie County had (according to the 1997 model-based U.S. Census estimate) the highest median household money income ($36,386) among the WBHB counties, while Big Horn County, despite its third-place rank in household money income, had the highest home-ownership rate among the WBHB counties. Fremont County has the lowest median household money income, slightly lower than that of Hot Springs County, however, Fremont County.s statistics include the Wind River Indian Reservation, where very high unemployment has been the norm. Data such as this tell us that the WBHB.s socioeconomic structure is not simple, and warns against being too simplistic in the analyses of the WBHB as a whole.
As is typical in Federal lands counties, government (in its national, state and local forms) accounts for more WBHB jobs than any other category with the exception of the service industry. Government jobs, at least at federal and state levels, are among the better paid in the WBHB. In 1998 there were 13,893 jobs in the service industry, basin wide, and 9,927 government jobs. Retail jobs (part of the service industry) numbered 9,086, while mining provided 2,446 (Wyoming Economic Analysis). Yet it must be remembered that in general mining jobs are more highly paid than most other jobs in the region, and the multiplier effect of mining supports many other industries. Mineral royalties help fund state and local agencies and projects most notably, schools.
4.1.3.1 . Mining
In Wyoming, the peak years for oil production were 1959 to 1976, while gas production began a steep upward climb about 1976, and is still rising. Coal has experienced three major production booms, from the late 1880.s until the early 1920.s, during World War II, and an ongoing boom that began about 1969 (University of Wyoming, .Economic Trends in the Mining Sector.).
Uranium mining began in Wyoming in the 1950.s. Significant uranium mining districts of Wyoming include the Gas Hills located in the Wind River Basin, the Powder River Basin, Shirley Basin, Crooks Gap, Poison Basin, and the Great Divide Basin. The industry peaked producing uranium for the Atomic Energy Commission (AEC) around 1960. As AEC stockpiling slowed about 1964, the industry .crashed.. From 1964 to 1972 a transition occurred as private sector demand, mostly for power plants, developed. Increasing oil prices, spurred by the embargo of 1974, helped uranium markets rise to another peak around 1978-80. Oversupply, compounded by the aftermath of the Three-Mile Island event, brought on another crash in uranium markets from 1982 to 1984. The future for uranium mining appears to be in-situ development, in which wells, rather than open-pit mines, produce the ores. Non-potable ground water is re-injected into ore seams as part of a reverse osmosis process, resulting in a net consumptive loss of only 5% or so. Although some of this activity will take place in Fremont County, most of it is and probably will continue to be in the Powder River Basin, rather than in the Wind River Basin.
Over the years the WBHB, as well as the state generally, benefited from mining booms. There has been oil, gas and coal production in the WBHB for more than a century. However, Wyoming.s currently healthy mining activities (coal, coalbed methane, uranium or trona) have little positive impact on the WBHB.s economy. In fact, the availability of jobs in the methane-booming Powder River Basin, as well as in southwest Wyoming, is draining working-age people from the Wind/Bighorn region.
Despite the vicissitudes of minerals production, mining (oil and gas) in the WBHB generally offers better-paid jobs than most other industries and remains the WBHB.s economic foundation. Without the development of a major new industry in the WBHB, population size will continue to be strongly related to the economics of mineral production. Table 4.1-3 provides an overview of the WBHB.s mining industry.
Table 4.1-3: Mining in WBHB Counties
| County | # of Employees in Industry (1998) | % of Mining Employees per Capita (1998) | Mean Per Capita Income ($) (1998) | Per Capita Mining Income ($) (1998) | Mining Jobs gain or loss 1990-1998 |
| Big Horn | 807 | 13.0 | 17759 | 29612 | +637 |
| Fremont | 559 | 2.8 | 19113 | 25943 | -44 |
| Hot Springs | 139 | 4.5 | 21488 | 47410 | -92 |
| Park | 600 | 3.5 | 23231 | 30627 | -361 |
| Washakie | 341 | 6.3 | 21347 | 12014 | +151 |
| WBHB | 2446 | 3.1 | N/A | N/A | +291 |
| (University of Wyoming, .Economic Trends in the Mining Sector.) |
Tourism ranks as the second industry in the WBHB. Park County dominates the WBHB.s tourism industry . 77% of the WBHB.s lodging tax is collected in Park County. Fremont County collects another 14%, leaving only 9% to be collected in the other three counties. Recreation spending is not all from tourists, but in this accounting, recreation money spent by Wyoming residents are included with that spent by tourists. Park County is far and away the largest recipient of tourism and recreational spending in the WBHB.
Much of the employment created by recreation and tourism is relatively low-paid, and often seasonal. Although tourism and recreation industries do not portend much population growth for the WBHB, there is little doubt that these opportunities do spur immigration, and keep people in the WBHB who might otherwise leave.
Fishing is the most significant water-based recreational activity in the state, as it is in the WBHB. In 1998 resident anglers put $308 million into Wyoming.s economy, while non-residents contributed $184 million (Wyoming Game and Fish, 2001). The Wyoming Game and Fish Commission reports that, sport fisheries in the state accounted for nearly 4.6 million recreation days, with an economic return of about $139 per day. The number of recreation days accounted for by residents far exceeds those of visitors. Fishing outfitters and guides operate out of many WBHB locations including: Dubois, Lander, Riverton, Cody, Powell and Thermopolis. Numerous stores throughout the WBHB sell fishing tackle, bait, and other supplies for anglers.
In the year 2000 more than 30,000 non-resident fishing licenses were sold in the WBHB.s five counties, along with nearly 21,000 resident permits. This represents about a 9% increase in total license sales, compared to 1995. All of the increase came from non-resident sales, since resident sales actually declined slightly. Park and Fremont counties attracted the largest shares of non-resident and resident anglers. Many anglers in WBHB waters purchased their licenses in other counties.
Table 4.1-4 helps illuminate the character of the Basin.s tourism and recreation industries. Since fishing is by far the most important water-based recreational activity, the ratio of non-resident to resident fishing licenses sold in each county is shown, illustrating the significant role played by visitors.
Hunting is also dependent on water, whether big game or waterfowl. Irrigation water helps provide habitat for many upland game birds, as well as helping to maintain many riparian areas. Irrigated fields and pastures are an important source of food and cover for many animals and birds.
Table 4.1-4: Tourism and Recreation in WBHB Counties
| Lodging |
| County | % of Basin.s Total Lodging Tax Collected (2001) | % of Basin.s Retail Tax Collected (2001) |
| Big Horn | 1.6 | 6.7 |
| Fremont | 14.1 | 32.6 |
| Hot Springs | 5.0 | 4.3 |
| Park | 76.9 | 29.9 |
| Washakie | 2.4 | 26.4 |
| (percentage totals may not sum to 100% due to rounding) |
| Fishing Licenses |
| County | Fishing Licenses Sold (2000) | % Non Resident Licenses (2000) |
| Big Horn | 4058 | 47.7 |
| Fremont | 18185 | 54.1 |
| Hot Springs | 2916 | 52.5 |
| Park | 21874 | 68.1 |
| Washakie | 4280 | 50.3 |
| Total | 51,313 | 59.0 |
4.1.3.3 . Agriculture
Among the five WBHB counties, the value of agricultural sales is highest in Park County, and second highest in Fremont County. In terms of agricultural sales, Park County is fourth and Fremont County fifth in the state. For the State of Wyoming, covered employment in agriculture constitutes only 1.5% of the state total. The proportion is larger in the WBHB. In terms of the proportion of jobs agriculture provides, Big Horn, Washakie and Hot Springs Counties are more dependent on agriculture than either Park or Fremont Counties. In Big Horn County, for instance, 9.4% of all jobs are agriculturally related, while in Park the figure is 3.7%. The trend in agricultural employment is down in all but two of Wyoming.s Counties, Albany and Fremont Counties, the increase in those counties is due to more proprietors rather than more hired workers (Foulke, 2000). Table 4.1-5 displays basic information about the WBHB.s agriculture industry.
In 2000, the total value of the output of the agricultural sector in Wyoming was $954.4 million, 75% of which was from sales of cattle and calves. Sugar beets were the number one crop in terms of sales, followed closely by hay, as these two crops accounted for $97.6 million. Cash receipts from crops in 2000 were $136.2 million statewide, while livestock, including products (milk, eggs, wool, honey, etc.) brought in $774.1 million. Net farm income was $114.2 million. In 2000, Wyoming.s farm exports were valued at $37.5 million, about 4% of the $954 million total cash agriculture receipts. Clearly agriculture remains one of Wyoming.s premier industries, but the number of jobs and the net profit for operators are not high.
Table 4.1-5 Agriculture in the WBHB Counties
| County | Acres of Irrigated Farmland (year 2000 - Wyo Ag Statistics 2001) | Number of Farms (Wyo Ag Statistics 2001) | Value of Livestock (Million$)(Wyo Ag Statistics 2001) | Value of Crop Production (Million$)(Wyo Ag Statistics 2001) | Assessed Value of Ag lands (Million$, 1998) | Leading Crops(excludes pasture & hay other than Alfalfa) | Number of Ag Jobs (total, including proprietors; 1997) |
| Big Horn | 88,300 | 495 | 43.4 | 33.2 | 8.9 | Alfalfa, Barley, Sugar Beets | 685 |
| Fremont | 109,800 | 983 | 96.9 | 30.3 | 7.5 | Alfalfa, Oats, Sugar Beets | 1092 |
| Hot Springs | 18,500 | 147 | 22.2 | 2.4 | 2.1 | Alfalfa, Oats, Barley | 182 |
| Park | 98,900 | 588 | 54.7 | 35.9 | 9.0 | Alfalfa, Barley, Sugar Beets | 776 |
| Washakie | 45,500 | 205 | 24.8 | 16.6 | 4.4 | Barley, Alfalfa, Sugar Beets | 311 |
| WBHB | 361,000 | 2,418 | 242 | 118.4 | 31.9 | Alfalfa, Barley, Sugar Beets | 3,046 |
4.1.4 . Economic Growth Requirements
If high population growth is to occur a number of economic pieces must fall into place. The ERS analysis suggests four important areas in which improvements might help a rural area grow economically:
Even with effective responses to challenges that face the WBHB, significant growth will be difficult to attain. Moderate or low growth rates are no doubt more likely than high level growth, barring a currently unforeseen event such as a sizable boom in minerals production.
4.1.5 . The Wind River Indian Reservation
No assessment of the WBHB.s future is complete without consideration of the 2.2 million acre Wind River Indian Reservation (WRIR). Home of the Eastern Shoshone and Northern Arapaho Tribes, the Reservation is located mostly in Fremont County as well as a relatively small area in Hot Springs County. Much of the WRIR is mountainous, its eight watersheds incorporate around 365 lakes and reservoirs, collectively containing more than 100,000 acre feet of water, and about 1,100 miles of streams and waterways. Many of these waters provide good fishing.
The populations within the WRIR numbers more than 20,000 persons, of whom fewer than half (around 7,500) are Native Americans. It is estimated, that the annual population growth rate of Native Americans in the WRIR is around 3% (U.S. Bureau of Reclamation, 1986).
Most tribal income comes from mineral extraction, mainly oil and gas. Tribal leaders are concerned about social problems affecting their young people as well as a lack of economic opportunity, and are anxious to promote economic development on the WRIR. This could mean higher levels of water consumption, especially if more land were brought under irrigation (Collins, 2002). The Arapahos, particularly, perceive a shortage of housing and in some areas are experiencing increasing problems with domestic water supplies, such as poor quality water and contamination of individual wells (U.S. Bureau of Reclamation, 1986).
Several reservoirs have been constructed on the WRIR. Enlargements and new dams are being planned as the Tribes explore potential new beneficial uses of their water resource. For the most part, WRIR land (around 1.7 million acres) is under the joint control of the Shoshone and Arapaho Tribal Councils. Water and other natural resources are jointly owned by the two tribes. The Tribes have adjudicated rights to 500,000 acre feet of water, however, this right is tied primarily to agricultural use and could not be converted to other uses without state concurrence (Wind River Resources Control Board, 1994). Much of the water allocated for current use is not actually used but lost on the WRIR, due to leakage resulting from the poor condition of water distribution and the conveyance infrastructure in many areas.
4.1.6 . Water Demand
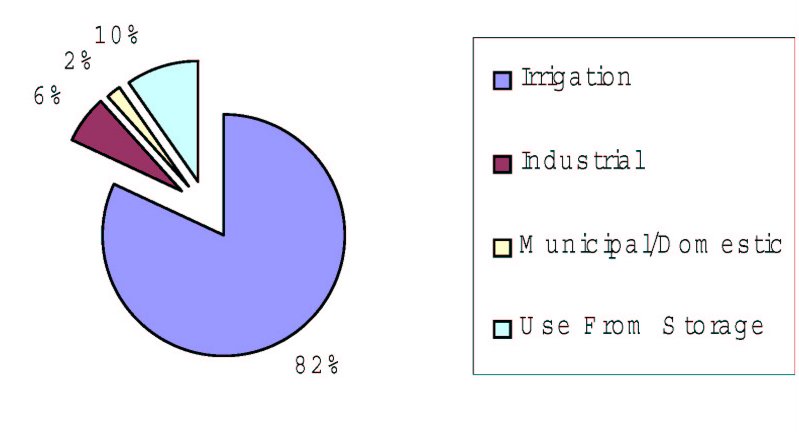
In Wyoming and in the WBHB, agriculture is the largest water user. As shown in Figure 4.1-2, agriculture accounts for some 82% of the water use in the WBHB followed by water use from storage (evaporation) at 10%, industrial water use at 6%, and municipal and domestic use at 2%. In contrast, agriculture accounts for only 1.5% of employment. With respect to water demand, population growth or decline has direct effects only on municipal and domestic use (2% of total water use) and, thus, has little effect on overall water demand. Changes in water demand with respect to agricultural and industrial use are related to other factors such as the location and availability of natural resources and the market/economics of the products and/or industries. As a result, water demand forecasts presented in subsequent sections of this report are based on foreseeable industrial and/or agricultural developments for theses sectors. Finally, although recreational and environmental demand is related to population, this use is non-consumptive and does not affect overall water demand.
Figure 4.1-2: Overview of water users in the WBHB.
4.2 . Agricultural Water Demand and Projections
4.2.1 . Introduction
Irrigated agriculture is the largest consumer of water within the Wind/Bighorn Basin. However, as discussed in the Task 3D Technical Memorandum, Available Surface Water Determination, there remains on average over 1,500,000 acre feet of water available in the Bighorn Basin and nearly 450,000 acre feet of water available in the Clarks Fork Basin. As described in other technical memorandums within Task 5, there are many potential uses for this excess water, and expansion of irrigated agriculture within the WBHB ranks among the highest priority uses. In fact, several studies, including the Potentially Irrigable Acres (PIA) study, which was developed for the adjudication of Tribal Reserved Water Rights, have studied the economics of additional agriculture within the WBHB and found it to be cost effective.
4.2.2 . Potential Agricultural Development
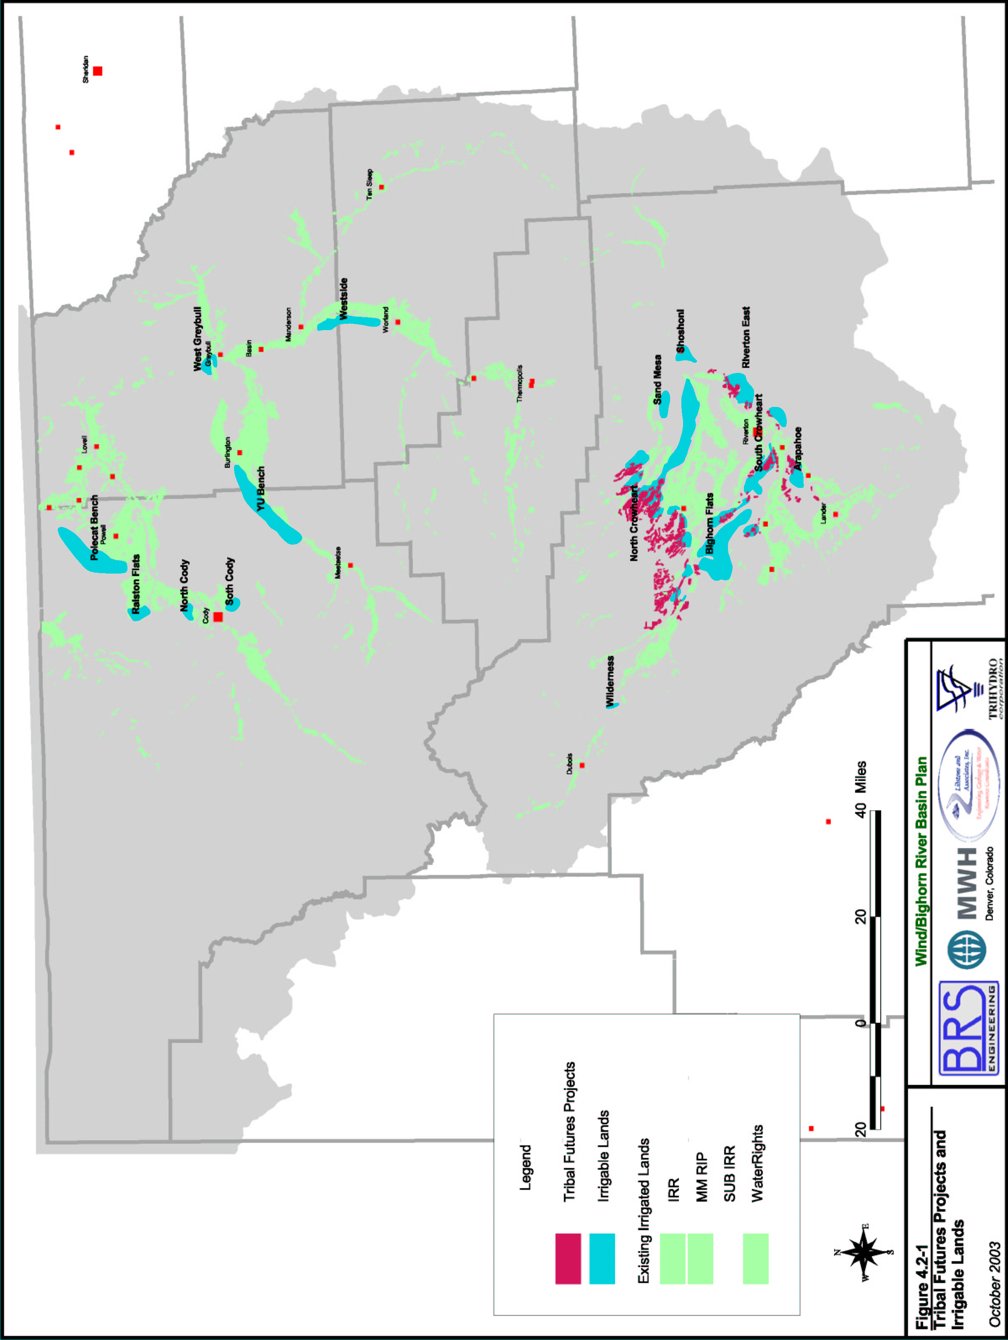
Two primary sources of information were reviewed to identify potential agricultural development within the Wind/Bighorn Basin Plan, the Tribal Futures Projects and a WWDC irrigable lands database. A map showing both the Tribal Futures Projects and the irrigable lands is shown in Figure 4.2-1.
Future agricultural use must be viewed in the context of current water availability and water right priority. As discussed in the .Agricultural Water Use and Diversion Requirements. Technical Memorandum, Chapter 2, Tab 5, irrigated lands mapping and historical use data indicate that some 430,000 to 450,000 acres of land are actually irrigated in the WBHB in any given year. However, water rights data from the SEO shows that water rights are held for the irrigation of over 600,000 acres. The modeling of surface water availability considers various use options including historical diversions (approx. 450,000 acres), full supply based on water rights (approx. 600,000), and full supply plus tribal futures (approx. 650,000 acres).
4.2.2.1 . Tribal Futures Projects
As part of the Bighorn Decree (Roncolio, 1982), the Shoshone and Northern Arapaho Tribes were awarded Federal Reserved Water Rights for not only lands with existing irrigation, but also lands that could be economically irrigated as determined through a Potentially Irrigable Acres (PIA) study. PIA studies have become the benchmark for quantification of Federal Reserved Water Rights throughout the Western United States. The PIA study is a compilation of agronomy, engineering and economic analysis that identifies currently undeveloped land that could feasibly be irrigated. The results of the PIA study were the conceptual development of 5 projects encompassing approximately 54,000 acres on the Wind River Reservation. The projects, conceptual land area and the awarded diversion requirement are shown in Table 4.2-1.
| Table 4.2-1 Tribal Futures Projects Awarded and Modeled Land Area and Diversion Requirements |
| Futures Project | Awarded (Roncolio, 1982) | Modeled | ||||
| Land Area (acres) | Diversion Requirement | Land Area (acres) | Diversion Requirement | |||
| (ac-ft) | (ac-ft/ac) | (ac-ft) | (ac-ft/ac) | |||
| North Crowheart | 38,773 | 147,767 | 3.8 | 40,839 | 155,064 | 3.8 |
| South Crowheart | 4,695 | 20,137 | 4.3 | 5,019 | 19,674 | 3.9 |
| Arapahoe | 3,808 | 16,720 | 4.4 | 3,808 | 16,720 | 4.4 |
| Riverton East | 3,814 | 17,536 | 4.6 | 4,057 | 15,098 | 3.7 |
| Big Horn Flats | 2,670 | 7,212 | 2.7 | 2,752 | 7,780 | 2.8 |
| Total | 53,760 | 209,372 | 3.9 | 53,760 | 209,372 | 3.9 |
Tribal Futures Projects were included in modeling runs to determine their general affect on streamflows and other diversions within the WBHB. The data included in the model for the Futures Projects was developed the same as the other diversion data for the model. An overall efficiency of 55% was utilized for those projects, where conveyance was proposed through open ditches, while an overall efficiency of 62%, was used for conveyance through pipelines. Both of these efficiencies assume improved on-farm applications, such as gated pipe and/or sprinklers as developed in previous studies for Riverton East and the SCS (Nelson, 2001; SCS, 1992).
As shown in Table 4.2-1, there are slight differences between the awarded and modeled acreages and diversion requirements for the Futures Projects. The information for the Wind/Bighorn River Basin plan was developed using the most current reasonable data for climate, crop water requirements and anticipated efficiencies for the Projects, thus accounting for the differences in developed values. In addition, the Wind/Bighorn River Basin model does not explicitly include the Popo Agie River Basin. However, the impacts to the Popo Agie River Basin from diversions by the Arapaho Project are implicitly included in the model results through an input node for the Popo Agie River Basin with data supplied by the Popo Agie Watershed Plan (Anderson, 2003). The information presented in the Wind/Bighorn River Basin plan regarding Futures Projects is in no way intended to infer proposed changes to the decree, nor do they suggest administrative changes to the decree. They only reflect general estimates on how Futures Projects could impact the WBHB.
In order to simulate the effects of the Tribal Futures Projects, CIR and diversion requirements were required. A summary of the diversion CIR and diversion requirements as they related to the physical nodes in the model representing the Futures Projects are presented in Table 4.2-2 and Table 4.2-3.
The effects of Tribal Futures Projects on flows within the WBHB and on other diversions within the WBHB are more fully described in the Task 3D Technical Memorandum, Available Surface Water Determination. However, as stated in the Task 3D Technical Memorandum, the model limitations need to be realized. The model does not explicitly account for water rights. Because the Futures Projects would have Federal Reserved Water Rights, the impacts from the Futures Projects would be much more severe on junior water rights within the WBHB, than the senior water rights. It should also be realized that the impacts are based on full development of the Futures Projects. The impacts of developing a portion of the Futures Projects would be less severe on the WBHB.
A brief description of each potential Futures project within the Wind/Bighorn Basin plan study area follows. The Arapahoe Irrigation Project is discussed in the Popo Agie Watershed Study (Anderson, 2003).
Table 4.2-2 CIR for Tribal Futures Project Used for Modeling
| Model Sub-Basin | Irrigated Acres | Monthly CIR (acre-feet) | Unit CIR (ac-ft/ac) | |||||||
| Apr | May | Jun | Jul | Aug | Sep | Oct | Annual | |||
| North Crowheart Canal | 40,839 | 2,856 | 9,096 | 17,150 | 24,243 | 19,044 | 8,256 | 616 | 81,260 | 1.99 |
| Big Horn Flats Pump #1 | 1,029 | 17 | 174 | 372 | 570 | 449 | 182 | 16 | 1,779 | 1.73 |
| Big Horn Flats Pump #2 | 717 | 12 | 121 | 259 | 397 | 313 | 127 | 11 | 1,240 | 1.73 |
| South Crowheart Canal | 5,019 | 388 | 1,155 | 2,221 | 3,011 | 2,383 | 1,058 | 43 | 10,260 | 2.04 |
| Big Horn Flats Pump #3, Big Horn Flats Pump #4 | 1,005 | 17 | 170 | 363 | 556 | 438 | 177 | 16 | 1,738 | 1.73 |
| Riverton East Pump #1 | 157 | 15 | 39 | 73 | 96 | 76 | 35 | 1 | 336 | 2.14 |
| Riverton East Canal, Riverton East Pump #2, | 3,900 | 376 | 972 | 1,826 | 2,397 | 1,899 | 864 | 25 | 8,361 | 2.14 |
| Arapahoe | 3,808 | 322 | 1,043 | 1,588 | 2,091 | 1,677 | 688 | 92 | 7,481 | 1.96 |
| Total | 56,475 | 4,003 | 12,771 | 23,851 | 33,362 | 26,279 | 11,386 | 820 | 112,453 | 1.99 |
Table 4.2-3 Diversion Requirements for Tribal Futures Projects used for Modeling
| Model Sub-Basin | Irrigated Acres | Monthly CIR (acre-feet) | Unit CIR (ac-ft/ac) | |||||||
| Apr | May | Jun | Jul | Aug | Sep | Oct | Annual | |||
| North Crowheart Canal | 40,839 | 10,518 | 27,115 | 36,214 | 33,206 | 27,575 | 19,018 | 1,419 | 155,064 | 3.80 |
| Big Horn Flats Pump #1 | 1,029 | 56 | 465 | 703 | 698 | 581 | 374 | 33 | 2,910 | 2.83 |
| Big Horn Flats Pump #2 | 717 | 39 | 324 | 490 | 486 | 405 | 261 | 23 | 2,028 | 2.83 |
| South Crowheart Canal | 5,019 | 1,430 | 3,443 | 4,689 | 4,125 | 3,450 | 2,437 | 100 | 19,674 | 3.92 |
| Big Horn Flats Pump #3, Big Horn Flats Pump #4 | 1,005 | 55 | 454 | 686 | 682 | 568 | 365 | 32 | 2,842 | 2.83 |
| Riverton East Pump #1 | 157 | 50 | 104 | 139 | 118 | 99 | 72 | 2 | 583 | 3.72 |
| Riverton East Canal, Riverton East Pump #2, | 3,900 | 1,240 | 2,593 | 3,449 | 2,938 | 2,461 | 1,782 | 52 | 14,515 | 3.72 |
| Arapahoe | 3,808 | 605 | 2,156 | 3,558 | 4,771 | 3,849 | 1,562 | 218 | 16,720 | 4.4 |
| Total | 56,475 | 13,993 | 36,654 | 49,927 | 47,024 | 38,988 | 25,870 | 1,879 | 214,336 | 3.80 |
Riverton East Irrigation Project
The Riverton East project has been under consideration for several years and is one of the most likely to proceed into more immediate development. This project would bring at least 3,900 new acres under irrigation and would require at least 8,361 acre feet of water annually. Additional storage in the Upper Wind River Basin for this project could be provided through projects such as the proposed Steamboat Reservoir or the proposed enlargement of Bull Lake.
North Crowheart Irrigation Project
The North Crowheart irrigation project is by far the largest of the Tribal Futures Projects and would entail up to 40,839 new acres consuming some 81,260 acre feet of water annually. This project would require the construction of upstream storage and diversions. Sighting of potential storage and diversion structures has been studied extensively. The most recent study of the Upper Wind River Storage was funded by the WWDC (Short Elliot Hendrickson, Inc., 2001)
South Crowheart Irrigation Project
The South Crowheart irrigation project includes some 5,019 new acres of irrigation and has an annual water demand of sine 10,260 acre feet. Storage for this project could be provided by the same projects as needed for the Riverton East project, the proposed Steamboat Reservoir or the proposed enlargement of Bull Lake.
Bighorn Flats Irrigation Project
Big Horn Flats has three components, which would all require pumping. The aggregate acreage of these areas is 2,751 acres and would consume approximately 5,000 acre feet of water annually.
4.2.2.2 . Irrigable Lands
In addition to Tribal Futures Projects, there are other potential agricultural development projects within the WBHB that have been discussed over the years. In 1991, the Wyoming Water Development Commission funded a study that developed an estimate of irrigable lands throughout the state (WWDC, 1991) that are not currently in production. Several locations were identified within the WBHB. Potentially Irrigable Lands are shown in Figure 4.2-1.
A summary of the irrigable lands is shown in Table 4.2-4. The annual Crop Irrigation Requirement (CIR) and Diversion Requirements shown in the table were developed similar to existing irrigated lands as discussed in the Task 2A Technical Memorandum, .Agricultural Water Use and Diversion Requirements.. An overall efficiency of 55% was utilized, which represents large canal delivery systems with improved on-farm applications, such as gated pipe and/or sprinklers, previous studies for Riverton East, and the SCS (Nelson, 2001; SCS, 1992).
As shown in Table 4.2-4, those lands that are generally associated with the Tribal Futures Projects comprise approximately 60% of the irrigable lands within the WBHB. It is interesting to note that the Tribal Futures Projects awarded acreage is approximately 38% of the total lands identified as irrigable in the study. The largest non-Futures Projects irrigable land groups are the Westside Irrigation Project in the Upper Bighorn Sub-Basin, lands on the YU Bench in the Greybull River Sub-Basin, and lands on the Polecat Bench in the Shoshone and Clarks Forks Sub-Basins.
Table 4.2-4 Summary of Potentially Irrigable Lands within the Wind/Bighorn Basin
| Basin | Name | Sub-Basin | Irrigable Area (acres) | Annual CIR | Annual Div. Req. | ||
| Total (acre-feet | Unit (ac-ft/ac | Total (acre-feet |
Unit (ac-ft/ac) | ||||
| Bighorn, Clarks Fork | Polecat Bench | Clarks Fork, Shoshone | 27,877 | 54,460 | 2.0 | 107,137 | 3.8 |
| Bighorn | North Cody (1) | Shoshone | 2,645 | 4,489 | 1.7 | 8,544 | 3.2 |
| Ralston Flats (1) | Shoshone | 5,035 | 9,171 | 1.8 | 17,761 | 3.5 | |
| South Cody (1) | Shoshone | 3,318 | 5,632 | 1.7 | 10,721 | 3.2 | |
| West Greybull (1) | Big Horn Lake, Greybull | 4,352 | 9,430 | 2.2 | 18,717 | 4.3 | |
| Westside | Upper Bighorn | 11,690 | 23,333 | 2.0 | 46,168 | 3.9 | |
| YU Bench | Greybull | 28,795 | 48,394 | 1.7 | 93,592 | 3.3 | |
| Wind | Arapahoe | Little Wind, Popo Agie | 6,743 | 13,906 | 2.1 | 26,634 | 3.9 |
| Bighorn Flats | Little Wind, Upper Wind | 37,215 | 64,318 | 1.7 | 117,583 | 3.2 | |
| North Crowheart | Lower Wind, Upper Wind | 62,155 | 133,951 | 2.2 | 260,775 | 4.2 | |
| Riverton East | Little Wind, Upper Wind | 16,636 | 35,663 | 2.1 | 69,200 | 4.2 | |
| Sand Mesa (1) | Lower Wind | 5,068 | 12,430 | 2.5 | 24,989 | 4.9 | |
| Shoshoni (1) | Lower Wind | 4,815 | 11,807 | 2.5 | 23,738 | 4.9 | |
| South Crowheart | Little Wind, Upper Wind | 18,267 | 36,963 | 2.0 | 70,698 | 3.9 | |
| Wilderness (1) | Upper Wind | 1,121 | 1,559 | 1.4 | 2,940 | 2.6 | |
| Total | 235,732 | 465,506 | 2.0 | 899,197 | 3.8 | ||
| Total (Tribal Futures Projects) | 141,016 | 284,800 | 2.0 | 544,890 | 3.9 | ||
| Total (non-Tribal Futures Projects) | 94,716 | 180,706 | 1.9 | 354,307 | 3.7 | ||
| Note: |
| Project names based on general location within WBHB because they are not associated with other previously identified projects. |
| (1)Projects not associated with Tribal Futures Projects include all Bighorn and Clarks Fork Projects, and the Sand Mesa, Shoshoni and Wilderness Projects in the Wind River Basin. |
West Side Irrigation Project
The Westside Irrigation Project has been under consideration for several years and is one of the most likely to proceed into development. This project has advanced and will require congressional approval for the transfer of federal lands associated with this project. This project would bring some 11,690 new acres under irrigation and would require approximately 23,000 acre feet of water annually. Although modeling indicates that surface water would be available for this project from the main-stem of the Bighorn River currently. Full utilization of the Tribal water rights and/or other priority water rights could limit future water availability. This potential could be offset by additional storage in the Upper Wind River Basin.
YU Bench Irrigation Project
Mapping of the YU Bench indicates nearly 30,000 acres of land that are potentially irrigable. If this project were developed, the actual acres irrigated would be expected to be less. The YU Bench is located in the Greybull drainage, above the recently constructed Roach Gulch dam. The majority of the lands within the YU Bench are federal and would require a transfer of lands similar to the action necessary for the Westside Irrigation Project. The Greybull drainage does not typically have surface water available for a project of this magnitude. In order for this project to be feasible, storage would need to be constructed on the Clarks Fork drainage and water conveyed to the Greybull drainage. The annual water demand under full irrigation for the YU Bench is estimated at nearly 50,000 acre feet. However, Wyoming has typically available some 450,000 acre feet of water in the Clarks Fork drainage, which leaves the state unused each year.
Polecat Bench Irrigation Project
The Polecat Bench is located in the Clarks Fork and Shoshone drainages northwest of Powell, Wyoming. Land ownership is mixed between federal and private. This area comprises of approximately 28,000 acres and would require upstream storage in the Clarks Fork drainage. As with the YU Bench, sufficient surface water is available in the Clarks Fork to support this project. At an elevation in excess of 5,000 feet, types of agricultural crops may be limited in this area. Crops such as alfalfa and grains, which do not require a long growing season, would be suitable for this area. Water demand would be similar to that of the YU Bench, approximately 50,000 acre feet.
4.2.3 . Available Flow for Agricultural Development
Available flow for all reaches within the model was calculated and is summarized in the Task 3D Technical Memorandum, .Available Surface Water Determination.. Using this data, diversion requirements can be compared to available surface water both annually, and by month to determine whether adequate supply exists from the primary source to fulfill the diversion requirements for the project, and whether storage is needed to store water from wetter months to drier months, or from wetter years to drier years. A summary of this analysis is presented in Table 4.2-5.
Table 4.2-5 Comparison of Diversion Requirements to Available Flow for Selected Projects
| Project | Primary Source |
Annual Demand | Available Surface Water from Primary Source (ac-ft) | Storage Required (ac-ft) | ||||
| Dry | Average | Wet | Dry | Average | Wet | |||
| Riverton East | Upper Wind River | 15,098 | 332,167 | 749,338 | 987,444 | 0 | 0 | 0 |
| North Crowheart | Lower Wind River | 155,064 | 74,652 | 250,832 | 470,680 | 153,645 | 60,743 | 34,085 |
| Westside Irrigation | Bighorn River | 45,783 | 857,888 | 1,286,359 | 1,681,003 | 0 | 0 | 0 |
| YU Bench | Greybull River | 92,510 | 39,798 | 95,349 | 86,919 | 88,203 | 36,877 | 52,104 |
| Polecat Bench | Shoshone River | 105,323 | 307,703 | 526,428 | 754,699 | 6,625 | 0 | 0 |
As shown, several of the projects could likely be developed with no or minimal storage, including the Riverton East project, the Westside Irrigation project and the Polecat Bench project. It should be noted that although the model shows that no storage is needed for these projects, to maintain required peak diversions during the peak months, small amounts of re-regulation storage may be required within the projects themselves.
The model indicates that there is available flow in the Upper Wind River for the North Crowheart Project in dry and average years. In dry years, the Crowheart Project, or other diversions in the WBHB with junior water rights, would be short. Therefore, multi-year carryover storage would be required. In addition, during all hydrologic years, some portion of storage would be required to store water in the spring and release later in the summer.
The YU Bench is located within the Greybull River Basin. As shown in the table, it is likely that there would not be enough water in the Greybull River during most years. Therefore, if the YU Bench were developed, imports from other basins, either the South Fork of the Shoshone River or the Clarks Fork River, would be required. In addition to the trans-basin diversion, a storage reservoir would be required to store high flows during the spring, and inflows year round (spring, summer and fall), so they can be released during high demand times in the late summer.
4.2.4 . Agricultural Development Scenarios
For purposes of the Wind/Bighorn Basin plan, three scenarios have been developed to simulate potential future irrigation development within the basin planning area. These are described as follows:
A summary of each scenario, their associated irrigated lands and the annual crop irrigation requirement and diversion requirement is shown in Table 4.2-6.
Table 4.2-6 Potential Agricultural Development Scenarios
| Scenario | Projects | Additional Irrigated Land (acres) | Annual CIR (ac-ft) | Annual Div. Req. (ac-ft) |
| Status Quo | None | 0 | 0 | 0 |
| Most Likely | Riverton East, Westside, North Crowheart | 69,165 | 140,255 | 270,433 |
| Maximum | Arapahoe, Bighorn Flats, North Crowheart, Riverton East, South Crowheart, Polecat Bench, Westside, YU Bench | 209,377 | 410,986 | 791,788 |
4.3 . Municipal and Domestic Water Demand and Projections
4.3.1 . Introduction
The current population of the WBHB, according to the 2000 census, is 86,222. Statistically, zero or negative growth could be projected for the WBHB. Although this has been the case in some counties in recent years, the WBHB as a whole has remained stable or has experienced some growth in population. The following figure shows the projected population growth for the WBHB as a whole assuming moderate growth. This projection was used to project future water demand for domestic and municipal use.
Figure 4.3-1 Population Projections
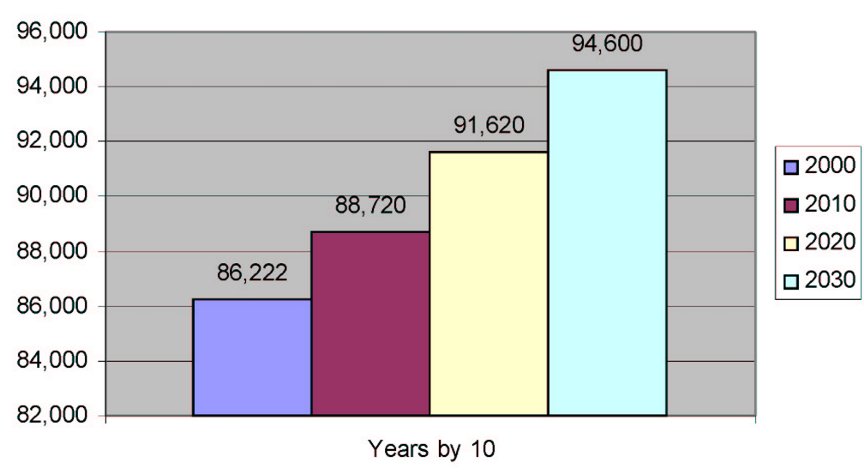
Based on Total WBHB Projection for Moderate Growth
4.3.2 . Municipal Use
According to the U.S. Environmental Protection Agency (EPA), there are currently 58 active municipal and non-municipal community public water systems in the WBHB (Lamb, 2002). Through its water system surveys, the Wyoming Water Development Commission (WWDC) has acquired detailed information on approximately 40 of these public water systems (WWDC, 2002). Information provided in the 2002 Water System Survey indicates these systems are capable of storing more than 36.7 million gallons of water obtained from rivers, streams, wells, reservoirs, and lakes to serve more than 63,000 people, or roughly 68% of the WBHB's population. The average daily municipal water use for the WBHB is approximately 12.2 million gallons per day (MGD), or roughly 207 gallons per day per person. 68% of the total water usage by municipalities is surface water, with the remaining 32% ground water. For a more detailed listing Refer to Technical Memorandum .Municipal Water Use Profile., Chapter II, Tab 6.
Current shortages and some water quality issues exist for certain municipalities in the WBHB. WWDC has sponsored and continues to sponsor numerous water supply projects in support of the municipalities and rural areas in the WBHB.
4.3.3 . Domestic Use
Based on rural domestic and non-municipal public water system usage, total domestic water usage in the WBHB has been estimated to range from 6.5 to 10.4 MGD. Ground and surface water supplies are utilized to meet daily domestic demands in the WBHB. Of the total domestic water usage, roughly 26% is supplied by surface water sources while 74% is supplied by ground water. Although data on water quality for private domestic water sources is generally not available, in many areas the shallow aquifers accessible to these users do not meet drinking water standards.
4.3.4 . Projected Municipal and Domestic Use
The following figure projects future domestic and municipal water demand based on a projection of moderate growth over the planning period. This is considered the most likely scenario.
Figure 4.3-2 Municipal and Domestic
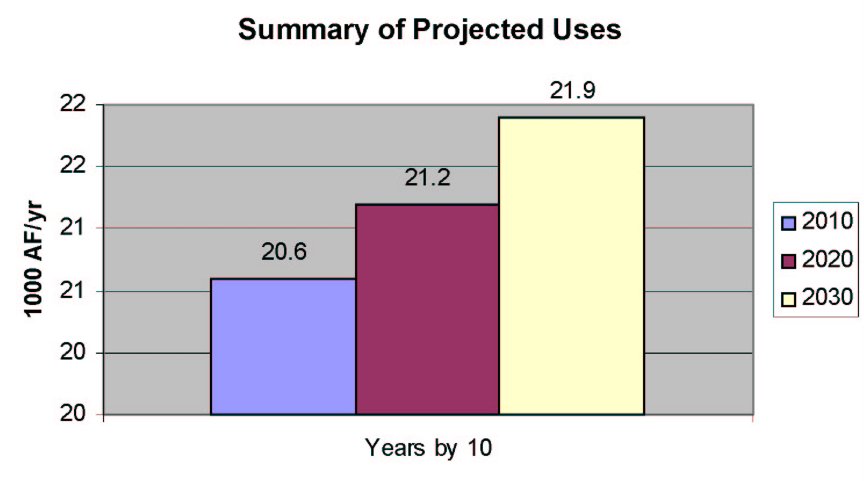
Although population projections could statistically predict zero or negative growth, water demand for the low growth scenario is projected as flat. This scenario is not considered likely since some communities are currently experiencing shortages. The high growth scenario, previously discussed, projects a maximum population of 114,407 over the thirty year period or a 33% increase. This population growth would result in a corresponding municipal/domestic water demand of approximately 26.5 acre feet per year.
4.4 . Industrial and Mining Water Demand and Projections
4.4.1 . Introduction
Most industrial water users in the Wind/Bighorn Basin (WBHB) are comparatively small companies, with relatively low water needs. In most cases, these companies draw their water from municipal systems, or from their own wells. In many cases the water used from wells for industrial purposes is not suited for other uses due to poor water quality. For those industries utilizing water from municipal sources, that consumptive use is included in the WBHB as municipal use.
4.4.2 . Industry in the Wind/Bighorn River Basin
Manufacturing
Large manufacturing companies are rare in the WBHB, as they are in the state as a whole. In the WBHB, there are about two dozen manufacturing companies that consistently maintain a workforce of twenty-five or more. Most of the larger companies. products are related to Wyoming.s overall character, products derived from minerals, products for agriculture, and products for camping, hunting and fishing. However, machinery electronic goods, and fabricated metal products are also manufactured in the WBHB.
Power Production
Hydroelectric power is produced by water driven turbines at thirteen Bureau of Reclamation sites in Wyoming, six of which are in the WBHB. Collectively the six WBHB plants have a production capacity of 47,100 kW. Currently there are no commercial fossil fuel power generation facilities in the WBHB. Small gas-fire, gas-cooled, turbine generating stations are utilized in the oil and gas industry for internal use such as powering gas pumping stations. However, as subsequently discussed there is potential for development of small coal-fired and/or gas power production based on available natural resources in the WBHB.
Mining: Oil and Gas, Coal, Uranium, Bentonite, Gypsum
Oil and gas remain important to the WBHB economy, with gas plants in all counties except Hot Springs. However, it seems unlikely that the future will offer many more jobs in the industry. The future for uranium mining appears to be in-situ development. One potential future in-situ uranium mine is permitted but not in production in the Gas Hills Uranium District, Fremont County. The projected plant capacity is 8,000 gpm. or 12,906 acre feet per year. Of this total, 645 acre feet per year of water would be consumed (lost to evaporation) during the mineral processing. The remaining water used would be returned to the aquifer via ground water injection wells.
Bentonite processing plants are located in Big Horn (Greybull and Lovell) and Washakie (Worland) Counties. The Black Hills Bentonite plant in Worland uses about 500,000 gallons per month(18.5 acre feet per year), purchasing it from the City of Worland. Similar bentonite plants in the WBHB include WyoBen.s plant near Greybull and American Colloid.s plant near Lovell. Plant operators did not indicate any specific plans to expand or contract in the foreseeable future.
There are gypsum plants in Park and Big Horn Counties, producing wallboard. Well water is used in the process, and recycling is practiced in all plants. These plants consume 200 gpm. or 323 acre feet per year, based on water rights.
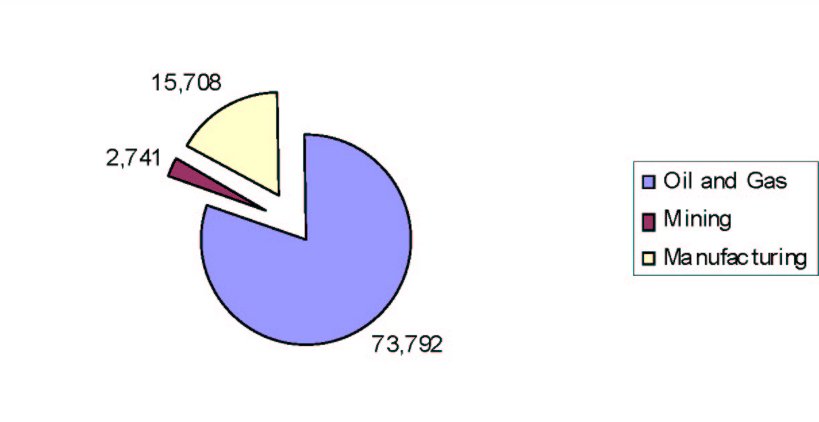
4.4.3 . Summary of Current Consumptive Use
Total water use based on water rights follows and is graphically displayed on the subsequent figure. Although this is the total water right, much of the usage is non-consumptive.
| Oil & Gas, including pipelines | 73,792 acre feet per year | ||||||
| Mining, dust control and mine pit waters | 2,741 acre feet per year | ||||||
| Manufacturing and Miscellaneous Industrial | 15,708 acre feet per year | ||||||
| Total Permitted Water Use - Industrial and Mining | 92,241 acre feet per year |
Figure 4.4-1 Industrial Use
4.4.4 . Projected Industrial Use
Industrial growth in most sectors has remained flat or declined. Potential for future growth in manufacturing is tied to improvements in the basic infrastructure. Mining and Oil & Gas has generally declined in recent decades. Some potential for coalbed methane development and in-situ uranium does exist, however, such developments will be market driven. Coalbed methane reserves in the Powder River Basin greatly exceed those of the Wind River and Bighorn River Basins in both quantity and quality. Future uranium production is tied to global demand. As with coalbed methane, current uranium production comes from lower cost mines located outside the WBHB.
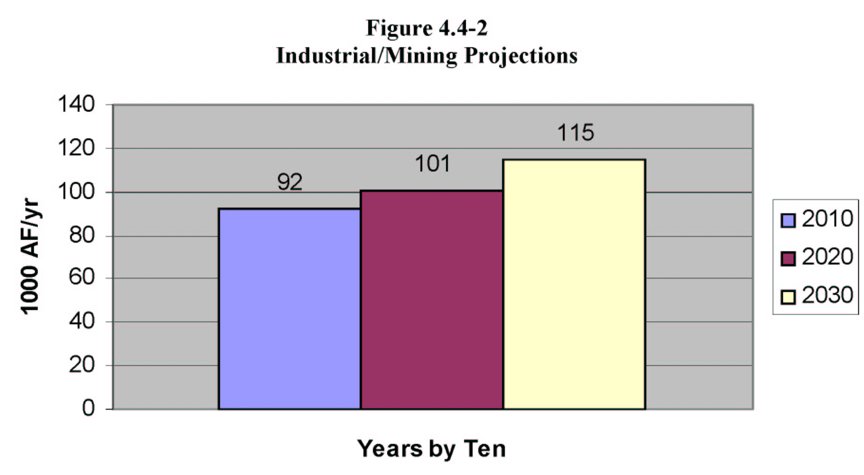
One area of potential industrial development and growth is the realm of power generation. There are several sites that could produce limited amounts of hydropower, a non-consumptive water use. Although there are currently no fossil fuels power plants in the WBHB, there is a potential reserve base for either coal or natural gas fired electric power production. It is estimated that a nominal 200 MW coal-fired steam turbine facility would require approximately 4,000 acre feet per year of water and a 500 MW gas-fired combination turbine facility would require approximately 5,000 acre feet per year of water.
As a result of the foregoing, the low growth scenario presumes no net change in industrial water demand. The moderate growth scenario assumes one coal and one gas-fired power plant. The high growth scenario assumes 2 coal and 3 gas-fired power plants. Projected industrial water demand is shown on the following figure, ranging from the current use of 92,000 acre feet to a maximum use of 115,000 acre feet annually.
4.5 . Recreational and Environmental Demand and Projections
4.5.1 . Introduction
Recreation, including tourism, is one of Wyoming.s three major industries. Major recreational activities dependent on water are fishing, boating, rafting, waterfowl hunting, and swimming. Other recreational activities, such as big game and upland game bird hunting, snowmobiling, skiing, sight seeing, photography, camping, and golfing are also sensitive to water quantity and quality. Another minor environmental use of water includes consumption of water by wildlife.
In general water demand for recreational uses is non-consumptive (Jacobs and Brosz, 2000). However, some .uses. or .designations. may restrict use within and above such designations. For example, Wyoming.s only congressionally designated .Wild and Scenic River. is a twenty mile stretch of the Clarks Fork of the Yellowstone River in Park County.
4.5.2 . Future Recreational Water Considerations
The WBHB.s State Parks are estimated to attract more than a million visitor-days per year (calculated from Wyoming State Parks and Historic Fees Program). Boysen and Buffalo Bill State Parks are located on large reservoirs, Hot Springs and Sinks Canyon State Parks are located near unique water resources, and Medicine Lodge Creek adds significantly to the attractiveness of Medicine Lodge State Park. It is useful to consider future recreational demands in a basin plan study for two reasons, to asses whether potential water development projects to meet water needs will impact recreational activities, and whether future recreational demands may exceed the current capacity of existing recreational areas. The assessment of future demands is concluded from the quantification of current recreational use through out the WBHB, projecting future recreational use, and comparing future recreational use with the existing recreational areas (Harvey and Jeavons, 2000).
Table 4.5-1
Projected Annual Growth Rates in the Wind/Bighorn Basins
Population and Tourism . 2000-2003
| |||||||||||||||||||||||
| Note: Tourism growth rate based off of Department of State Parks and Cultural Resources estimates of the average annual increase in tourism. |
Boating
There is no available data on the number of boats, rafts and other watercraft using the waters of the WBHB. As such, quantitative measurements of the number of boating-days and estimates of future water use demands for boating could not be determined. However, based on projective growth in the WBHB, of both residents and tourists, it can be assumed that the demand for watercraft use in the WBHB will expand.
Fishing
Fishing is one of the WBHB.s major water-based outdoor recreational activities. The major source of data collected on fishing is from the Wyoming Game and Fish Commission.s (WGFC) license sales and creel censuses. The available quantitative data on fishing is not readily adaptable to individual waters because angler surveys are usually conducted on major waters in response to specific needs (Annear, 2002).
In 2000, 20,942 resident and 30,372 non-resident licenses were sold in the five counties of the WBHB (Wiley, 2001). This equates to approximately 322,000 angler-days for residents and 123,000 angler-days for non residents. In comparison to 1995 resident sales have decreased by approximately 8% in the WBHB, while non-resident sales increased by about 20%. The majority of fishing licenses sold in the WBHB were in Fremont and Park Counties (Wiley). This suggests that the drainages of the Upper Wind River and the Shoshone River have the heaviest amount of stream fishing. Boysen and Buffalo Bill Reservoirs are also very popular fishing venues. In anticipation of continuing growth in demand for stream fishing venues, the WGFC notes that ensuring an adequate supply of good fishing spots .is dependant on maintaining adequate stream flows in existing good segments and restoring stream flows in streams that have the potential to support good recreational fisheries.. (Annear, 2002)
Annual fishing day demand in 2030 is projected as follows:
Waterfowl Hunting
Wyoming straddles two migratory waterfowl flyways, the Pacific (west of the Continental Divide) and the Central. The WBHB is solely located east of the Continental Divide, in the Central flyway. The WBHB is divided by the WGFC into two waterfowl management areas. The majority of waterfowl hunting in the WBHB is for ducks and geese, although coot, snipe, rail, and sandhill crane are also hunted.
While data on specific locations is unavailable, the WGFC estimated that in 2000 WBHB duck hunter-days totaled 13,395, with a harvest of 19,333 ducks. Goose hunter-days were estimated to be 7,730, with a harvest of 5,331 geese. Ducks Unlimited, which has over 4,000 members in Wyoming, reported that during the 1999-2000 hunting season 11,062 federal duck stamps were sold in the state. The WGFC reported that in 2000 a total of 36,208 bird licenses were sold in the state. According to the WGFC Annual Report of Upland Game and Furbearer Harvest for 2000, licenses sales for both resident and non-resident bird licenses have increased sharply over the past five years. Maintenance and improvement of existing wetlands and riparian areas, and establishment of new areas will help maintain and improve habitat for waterfowl.
Annual waterfowl hunting-days are projected as follows:
4.5.3 . Future Environmental Considerations
Environmental water uses including reservoir allocated conservation pools, instream flows, wetlands, and riparian areas are mostly non-consumptive uses of water, and are not dependant on population change and tourism, as recreational uses are.
Wildlife
There is no easy way to quantitatively estimate the amount of water required by wildlife in the WBHB. Tyrell, in a review of the topic in the Green River Basin Plan, noted that estimates of wildlife use of surface water in that WBHB ranged from 100 to 400 acre feet per year. Tyrell concluded that .while some uncertainty exists in the exact consumption value, its probable magnitude is not so high as to materially affect the water plan. (2000). Since water use by wildlife is essentially constant, there is no foreseeable impact on future water demand.
Conservation Pools
The U.S. Bureau of Reclamation (USBR) has designated .Conservation Storage. for five reservoirs in the WBHB: Bighorn Lake, Boysen, Buffalo Bill Reservoir, Bull Lake, and Pilot Butte Reservoir. Each reservoir has an allocation for an .Active Conservation Pool., which holds a reservoir of inflow to be allocated for several purposes including fisheries, wildlife, water quality and recreation. As this a non-consumptive use .Conservation Storage. does not affect the basin plan. More detailed information on conservation pools can be found in the .Water Uses from Storage. Technical Memorandum found in Chapter 2.
Instream Flow
The instream flow statute defines that the use of instream flows shall be for fisheries protection only (Lowry, 2002). The WGFC has since 1986 taken action to identify streams for which the filling of applications is appropriate. As of 2002, there were five permitted instream flow appropriations in various rivers totaling 280,520 acre feet per year and three applications pending approval for 277,716 more acre feet per year. However, instream flow rights are not a consumptive use and though instream flow designations can potentially cause conflict with new out-of-stream uses, they may have local constraints on water availability within the WBHB.
Wetland and Riparian Habitat
Riparian areas and wetlands are ecologically important. They help to maintain stream flows, reduce erosion, and provide habitat for wildlife. The U.S. Department of Agriculture (USDA) has a number of programs that are relevant to these areas. However, riparian areas and wetland areas are non-consumptive uses and do not affect the consumptive use of water in the WBHB.
4.5.4 . Summary
The largest potential affect of non-consumptive recreational and environmental uses on future consumptive uses of water in the WBHB is likely to be restrictions of water use to maintain instream flows, wetland, conservation pools, and related environmental and habitat features. Although these non-consumptive uses will generally not affect the total amount of water available in the WBHB, such uses may affect consumptive use by limiting the location of water use and/or diversion, limiting the time of year water can be consumed or diverted, and limiting the type of water usage allowed. 12
(Click on image to enlarge)