Wyoming State Water Plan
Wyoming State Water Plan
Wyoming Water Development Office
6920 Yellowtail Rd
Cheyenne, WY 82002
Phone: 307-777-7626

Wyoming Water Development Office
6920 Yellowtail Rd
Cheyenne, WY 82002
Phone: 307-777-7626


CHAPTER 2 WATER USE
2.1 . Wind/Bighorn Lands Mapping and Water Rights Data
2.1.1 . Introduction
The majority of the appropriated water in the WBHB has been appropriated for the irrigation of land. Therefore, an estimate of water used for irrigation is central in the development of a comprehensive water use inventory for the WBHB. Mapping the irrigated lands within the WBHB is a principal task in developing the water use inventory. The methodology can be divided into four general steps:
Figure 2.1-1 shows the overall irrigated lands mapping for the WBHB.
2.1.2 . Identification and Delineation of Irrigated Lands
Two data sources were used in the identification and delineation of irrigated lands, the United States Geological Survey (USGS) black and white digital orthophotograph quarter quadrangles (DOQQs) published in 2000 and 2001, and the 1999 Landsat color-infrared satellite imagery.
Once the data sources were obtained, hard copy maps corresponding to the extents of 7.5 minute USGS quadrangle maps were created of the DOQQ and Landstat color-infrared imagery. Both a DOQQ map and a Landsat color-infrared map were produced for those areas within the WBHB that were determined to possibly contain irrigation practices. Maps were not produced for those quadrangles fully contained in areas previously mapped by the State of Wyoming. Each created map was then closely examined and potential irrigated lands were identified and delineated. After the completion of the identification and delineation process, the delineated areas were transcribed onto a corresponding 7.5 minute USGS hardcopy topographic map.
Transcribing the delineated irrigated lands onto the 7.5 minute USGS topographic maps accomplished two necessary objectives. First, the transcription provided a means to crosscheck and assemble the delineated lands from the two source maps. Second, the transcription provided a Public Land Survey System (PLSS) land description base. The water rights records maintained by the Wyoming State Engineer and the State Board of Control reference land based on the PLSS, therefore the same base was required for the assignment of water rights to the delineated lands.
As mentioned above, portions of the irrigated lands within the WBHB were previously mapped by the State of Wyoming. The previously mapped areas include irrigated
lands within the boundaries
of the Wind River Indian Reservation and lands that irrigate with water from the Bighorn River or tributaries of the Bighorn River. Within the Wind River Reservation,
water awards for the .future. development of irrigated lands were also mapped. The water awards were determined for three different circumstances and are therefore
referred to with three different names . Reserved Right Awards, Walton Awards, and Remand Awards. The lands covered under each of the water awards may or may not be
currently irrigated, however the water awards have an 1868 priority and therefore play an important role in determining the water use or potential water use of the WBHB.
2.1.3 . Attribution of Water Rights to Delineated Irrigated Lands
Water rights attribution is the process of assigning water right information to the delineated irrigated land areas or polygons. A complete description of irrigated lands includes a definition of the water rights granted to allow for the irrigation of the lands. The water right information most relevant to this project include: permit number, source of water supply, facility name, priority date, amount of appropriation, permitted number of acres and type of supply. Specifically these water rights attributes provide an overview and insight into the supply sources, the permitted area of land and the types of irrigation systems.
.The identification and attribution of water rights was addressed upon the completion of the irrigated lands mapping. The water rights assigned to the irrigated land polygons were identified from the original records on file in the offices of the Wyoming State Engineer and State Board of Control. As a water right was determined to be associated to an irrigated land polygon, an identification number was assigned to the topographic map clearly referencing the appropriate polygon. The identification number created a link between the irrigated polygon or polygons and the water rights database. If a delineated land polygon was found not to contain a water right, the polygon was reclassified to sub-irrigated land. Sub-irrigated land is land that receives water from a semi-saturated subsurface zone and not directly from an irrigation source. An assumption of .officially permitted water right use. was made throughout the mapping process. Therefore, any lands that appeared to be receiving water yet did not have an appropriated water right were assigned to the sub-irrigated category.
Throughout the water rights attribution process of the WBHB it was discovered that historic water rights still exist within some town boundaries (i.e. Otto and Greybull). To maintain consistency with previously completed basin plans, these water rights were excluded from the final irrigated lands map.
2.1.4 . Creation of a Digital Irrigated Lands Map
Upon the completion of the water rights attribution, the delineated lands and water rights attributes were converted into a digital format, such that the data could then be presented in a GIS format. AutoCAD Map software was used to both register the maps and digitize the delineated lands. After the maps were digitized, the AutoCAD map files were converted into ArcView shapefiles. Utilizing custom-built ArcView tools created for this project, the irrigated land polygons were attributed with the appropriate water rights. The creation of an ArcView point file representing the points of diversion was also created and attributed in the same manner as the irrigated land polygons. The GIS product developed digital irrigated lands and points of diversion. Figure 2.1-2 shows a typical 1:24,000 scale irrigated lands map.
2.1.5 . Verification of Delineated Irrigated Lands
2.1.6 . Explanation of the Irrigated Lands Geographic Information System (GIS) The final products from the irrigated lands mapping tasks include the following GIS data themes or digital datasets and database tables: The GIS data themes are located in the Latitude and Longitude coordinate system based on the North American Datum of 1927. File formats of the data themes include
both the ArcView shapefile format (*.shp) and the ArcInfo export file format (*.e00). Descriptions of the GIS data theme attributes and the database table fields are
detailed in Chapter 2, Section 5 of the Technical Memorandum Wind/Bighorn Lands Mapping and Water Rights Data. 2.1.7 . Water Right Type of Supply Related Terminology Original Supply: Original supply is a ground or surface water right attached to land or uses where there is no other water right of record. It is the first
priority water right attached to and to be used on the identified land. Supplemental Supply: Direct flow water from a different source and different point of diversion to augment or supplement the available water for an existing
appropriation (water right) for which the original source does not provide a full supply constitutes a supplemental supply. The amount of supplemental water which may
be diverted, is the amount available, in priority, to bring the total water diverted from all sources up to the appropriated amount of 1.0 cubic foot per second (cfs)
for every 70 acres to be irrigated. (W.S. 41-4-317 through 41-4-324) Additional Supply: Additional supply is additional ground water for irrigation use which is appurtenant to lands that already have a direct flow supply of
surface water or have an original supply from another ground water source. 2.2. . Agricultural Water Use and Diversion Requirements 2.2.1 . Introduction A key component of the WBHB Plan is the development of a river basin model for the study area. The primary purposes of the river basin model effort are to identify
and quantify water uses that experience shortages during dry, average and wet years; to determine the impact of Tribal futures projects; and to identify and quantify the
amount of water that is available for future water development. The model runs on a monthly time step and utilizes dry, average, and wet-year hydrology developed from a
1973-2001 period-of-record. This section discusses the development of agricultural water use and diversion requirements that were used in the model. Agricultural water use represents the vast
majority of water use within the WBHB planning area. Because of this, accurate estimation of agricultural water use within the WBHB is essential in producing an accurate
model and calculating water availability. Water use by agriculture is a function of many physical and managerial functions including the quantity of land irrigated, crop
types, soil types, precipitation, conveyance mechanisms, irrigation types and management styles. The model requires the historical diversion requirement for each point of diversion. Then, the model calculates the historical amount of consumptive use using
irrigation efficiencies and returns non-consumptive demands back to the river according to surface water accumulation functions, or lags. Then, because the amount of
land historically irrigated is less than the amount of land with water rights, full supply diversions are modeled, where all irrigated lands with water rights are supplied
from the existing water supplies. The development of historical diversions, both measured and estimated, as well as fully supply diversions, are discussed in the following
sections. 2.2.2 . Historical Diversions Historical diversions are used as input for the model calculation and calibration process. Therefore, based upon criteria used in previous river basin plans,
historical diversion records were obtained for all diversions greater than 10 cfs. Diversions greater than 10 cfs are explicitly included in the model as separate
diversions, while those less than 10 cfs are .lumped. with other small diversions less than 10 cfs that divert in the same reach of stream. Diversion records and
the reduction of the diversion records for use in the model are discussed in this section. Estimated historical diversions for those diversions without diversion
records are discussed in Section 2.2.3, Estimated Historical Diversions. Diversion records were collected from the State Engineer.s Office Division III Hydrographer.s Reports and USGS published data, as included in the addendum to the
Technical Memoranda Wind/Bighorn River Basin Plan Irrigation Diversion, Operation, and Description. Two types
of records are available, daily flow data available from USGS or SEO gaging stations and instantaneous flow data from SEO spot checks of diversions. The reduction of
daily data simply used the daily average diversion flow rate and converted it to a volumetric amount. Any missing daily data was estimated from the available data
before and after the missing data using linear interpolation. Then, the daily volumetric amounts were summed for a monthly diversion. For most data in the
Hydrographer.s reports, this was already done and these values were used. The reduction of spot data involved a similar process. Data for days not measured was linearly interpolated from the available data. Starting and ending dates
for irrigation seasons were taken from Consumptive Use and Consumptive Irrigation Requirements in Wyoming (Pochop et.al., 1992). The daily flow values were
then converted to monthly volumes and summed for each month. Monthly diversions estimated from the daily and spot data were used to develop dry, average, and wet year diversions. The development of dry, average, and wet
years, as well as the index gages for each basin are described in Chapter 3, Section 1, Surface Water Hydrology. In general, the 1973-2001 period-of-record was
used for hydrologic calculations. Based upon selected index streamflow gages, which generally represent undepleted flows, dry years were defined as the driest 20
percent of years, average years were the middle 60 percent, and wet years were the wettest 20 percent of years, as defined by the total annual flow at the gage. To reduce diversion data, the monthly average of all available diversion data was taken for all years within the hydrologic condition. Unlike the gaged flow
records, years without data were not filled. Therefore, occasionally, there are diversions with records in one hydrologic condition and not another. In this case,
the estimated actual diversion methodology was used for the missing data. This primarily occurred only for smaller diversions. Occasionally, calibration of the model required that the measured historical diversions be reduced to maintain mass balance in the model. This was accomplished
using the same techniques as described in Section 2.2.4 . Full Supply Diversion Requirements. 2.2.3 . Estimated Historical Diversions Because diversion records were not available for many of the smaller diversions within the study area, and because some diversion records were not obtained (those
that did not meet the 10 cfs criteria), estimated historical diversions were developed. The quantification of estimated historical diversions for those irrigated
lands without historical diversion records took place in two parts: The development of estimated historical diversion requirements for input into the model was performed in the same manner as described in Section 2.2.4 - Full
Supply Diversion Requirements. The calibration procedure, as more fully described in Chapter 2, Section 1 .Wind/Bighorn Lands Mapping and Water Rights Data., Spreadsheet Model Development
and Calibration, was used to adjust the estimated historical diversions. This calibration procedure utilizes the estimate of water availability at the point of
diversion and compares it with the estimated historical diversion. If the estimated historical diversion is less than the amount of water available at the point
of diversion, then the estimated historical diversion is not adjusted. If the estimated historical diversion is more than the available flow at the point of
diversion, then the estimated historical diversion is adjusted so that it can take no more than the available streamflow. These adjustments are shown on the
.Historical Diversions. worksheet within each model. 2.2.4 . Full Supply Diversion Requirements Full supply diversion requirements are based on the theoretical consumptive use and system efficiencies for each of the points of diversion. In general, the
full supply diversion requirement is equated to the theoretical maximum diversion requirement as given in the following equation: Full Supply Diversion Requirement = (Area x CIR)/Overall Efficiency Where:GIS Data Themes Database Tables
Irrigated Lands (polygons) Water Rights Table Points of Diversion (points) Linking Table
Each of these factors is described in the following sections.
2.2.5 . .Irrigated Lands
Mapping of irrigated lands within the WBHB was performed by the project team. Irrigated lands mapping is discussed more thoroughly above in Section 2.1, Wind/Bighorn Lands Mapping and Water Rights Data. This mapping was used for determining the area of land irrigated in each sub-basin model.
The irrigated lands mapping was attributed in the GIS as Irrigated Land (IRR), lands with Water Rights (Water Rights), man-made riparian (MM RIP) and sub-irrigated (SUB IRR). Islands of non-irrigated lands within larger irrigated areas, or polygons within polygons in the GIS database, were also mapped.
A summary of the irrigated lands is shown in Table 2.2-1. As shown in Table 2.2-4 (Section 2.2.7, chapter 2, page 12 of this report), the USDA estimates approximately 354,000 acres of irrigated lands while the Wyoming Agricultural Services estimates approximately 344,000 acres of irrigated lands within the study area. Table 2.2-1 shows approximately 561,000 acres of irrigated lands with an additional 125,000 acres of lands with tribal water awards. There are many reasons for the differences in estimates, including the non-reporting of irrigated lands by many farmers, and the fact that some of the lands could have been fallow during the reporting year.
Table 2.2-1 Summary by Attribute of Irrigated Lands Mapping
| County | Irrigated Lands (acres) | Man-Made Riparian (acres) |
Sub- Irrigated (acres) | Lands with Tribal Awards (acres) | Total (acres) |
| Big Horn | 167,669 | 0 | 9,915 | 0 | 177,583 |
| Fremont | 154,829 | 2,385 | 3,155 | 122,330 | 282,700 |
| Hot Springs | 24,389 | 0 | 32 | 3,131 | 27,552 |
| Natrona | 551 | 0 | 183 | 0 | 734 |
| Park | 162,772 | 0 | 6,440 | 0 | 169,212 |
| Washakie | 50,934 | 0 | 0 | 0 | 50,934 |
| Total | 561,144 | 2,385 | 19,725 | 125,461 | 708,715 |
Notes:
|
Table 2.2-2 presents a summary of the mapped irrigated acreage by county within the Wind/Bighorn River Basin Plan study area as used in the model. The following should be noted regarding the development of the modeled acreage:
The remaining portion of this section discusses historical and full supply diversion requirements for existing irrigated lands. Full Supply diversion requirements for Tribal Futures projects and any other potential irrigation development are discussed in Chapter 4, Section 4.2.3, Available Flow for Agricultural Development.
Table 2.2-2 Modeled Irrigated Acreage
| County | Irrigated Lands for Full Supply Scenario (2) (acres) |
Futures Projects (acres) | Total (acres) |
| Big Horn | 164,404 | 0 | 164,404 |
| Fremont (1) | 196,502 | 52,667 | 249,169 |
| Hot Springs | 27,465 | 0 | 27,465 |
| Natrona | 551 | 0 | 551 |
| Park | 161,099 | 0 | 161,099 |
| Washakie | 50,405 | 0 | 50,405 |
| Total | 600,426 | 52,667 | 653,093 |
Notes:
2.2.6 . Theoretical Crop Irrigation Requirement | ||||||||||||||||||
Crop consumptive use requirement is the maximum water use of a well-watered crop under optimum growing conditions (Pochop; et al, 1992). A portion of the crop consumptive use is met by effective rainfall (or rainfall that reaches the root zone and meets a portion of the consumptive water requirement before occurring as surface runoff). The portion of the crop consumptive use that is not met by rainfall is referred to as the Crop Irrigation Requirement (CIR). Actual conditions often vary from the theoretical CIR for a variety of reasons, such as the micro-climates at the site that may be different from the climate station, variations in genetics of different strains of the same crop, and more likely, varying soil types. However, CIR gives an estimate of the amount of water that is required to produce a crop under ideal conditions on a system-wide basis.
As has become a standard for use in the WWDC river basin plans, the crop irrigation requirements presented in Consumptive Use and Consumptive Irrigation Requirements . Wyoming (Pochop, et al, 1992) were used in this analysis. The study utilizes 1951 . 1990 climatic data to calculate CIR for several crops and climate stations throughout the study area. Because climatic dry, average, and wet periods in summer months during irrigation are often different than the dry, average, and wet periods in the winter that produce runoff, the average CIR was used for all three hydrologic conditions.
There are 13 climatic stations within the Wind/Bighorn River Basin at which CIR is reported. CIR continually varies between these stations based on localized climate, topography, elevation, etc. However, normally, these variations are small and for regional planning efforts, the CIR values can be extended to areas outside of the exact climatic station location. For purposes of this analysis, the Theissen polygon method was utilized to determine the .influence area. for each climatic station. This method draws lines between each station, then bisects them midway with a perpendicular line. The intersections of these bisection lines makes up polygons for which all irrigated lands within the polygon uses the CIR at the climatic station. The climatic stations and their associated acreages within each basin are presented in Table 2.2-3, while a map showing the climate stations and the climatic areas developed using the Theissen polygon method is presented in Figure 2.2-1.
Table 2.2-3 Area within Climate Station Theissen Polygon
| CIR Station | Irrigated Acres within Station Polygon by Basin | Total Irrigated (acres) | ||
| Bighorn | Clarks Fork | Wind | ||
| Basin | 106,434 | 0 | 0 | 106,434 |
| Boysen Dam | 0 | 0 | 23,242 | 23,242 |
| Cody | 49,927 | 4,563 | 0 | 54,490 |
| Dubois | 0 | 0 | 20,185 | 20,185 |
| Fort Washakie | 0 | 0 | 49,483 | 49,483 |
| Lander | 0 | 0 | 11,603 | 11,603 |
| Lovell | 40,507 | 0 | 0 | 40,507 |
| Powell | 73,435 | 13,735 | 0 | 87,170 |
| Riverton | 0 | 0 | 91,528 | 91,528 |
| Sunshine | 28,962 | 0 | 0 | 28,962 |
| Ten Sleep | 18,395 | 0 | 0 | 18,395 |
| Thermopolis | 24,365 | 0 | 1,278 | 25,643 |
| Worland | 42,784 | 0 | 0 | 42,784 |
| Grand Total | 384,809 | 18,298 | 197,319 | 600,426 |
Notes:
|
2.2.7 . Cropping Patterns
Cropping patterns are available from two sources: the United States Department of Agriculture (USDA) 1992/1997 Census of Agriculture (USDA, 1997) and the Wyoming Agricultural Statistics for 2000 (WASS, 2002). A summary of the published cropping patterns and distributions are presented in Table 2.2-4, while the USDA cropping distribution by county is shown in Figure 2.2-2.
In general, for purposes of the modeling effort, the USDA values were used to determine the cropping pattern for the irrigated lands. The USDA values were used because they represent averages of more than one year within the study period (1973-2001), as compared with the Wyoming Agricultural Statistics, which represent only one year at the end of the study period. In addition, for certain climatic stations such as Sunshine and Dubois, it is recognized that many of the crops that are shown in the county-wide cropping patterns are not grown. Therefore, within these two polygons, it was assumed that only hay and alfalfa are grown (at the same distribution as without the remaining crops). Then, the cropping patterns for the remaining stations were modified so that the county-wide cropping pattern remains consistent.
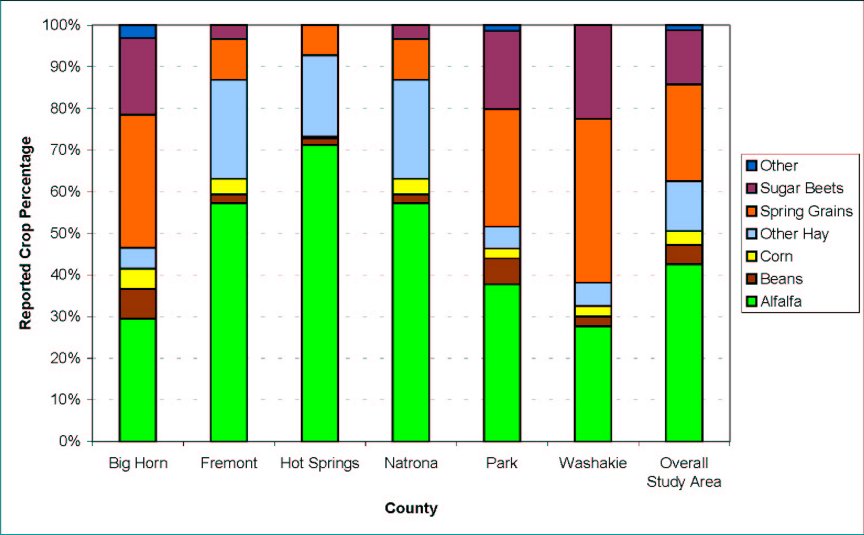
Figure 2.2-2. County-Wide Cropping Pattern for Study Area (USDA, 1997)
Table 2.2-4. Reported Acreage and Cropping Patterns within Wind/Bighorn Basin
| County | Crop | Wy. Ag. 2002 (1) | USDA 1992/1997 (2) | ||
| (acres) | (percent) | (acres) | (percent) | ||
| Big Horn | Alfalfa | 26,000 | 31% | 25,286 | 29% |
| Beans | 7,500 | 9% | 6,145 | 7% | |
| Corn | 7,200 | 8% | 4,116 | 5% | |
| Other Hay | 6,000 | 7% | 4,321 | 5% | |
| Spring Grains | 24,100 | 28% | 27,476 | 32% | |
| Sugar Beets | 14,400 | 17% | 15,740 | 18% | |
| Other | 0% | 2,661 | 3% | ||
| Sub-Total | 85,200 | 100% | 85,745 | 100% | |
| Fremont | Alfalfa | 66,000 | 63% | 65,349 | 57% |
| Beans | 2,000 | 2% | 2,441 | 2% | |
| Corn | 6,000 | 6% | 4,282 | 4% | |
| Other Hay | 20,000 | 19% | 27,143 | 24% | |
| Spring Grains | 5,700 | 5% | 11,136 | 10% | |
| Sugar Beets | 5,100 | 5% | 3,836 | 3% | |
| Other | 0% | 0% | |||
| Sub-Total | 104,800 | 100% | 114,187 | 100% | |
| Hot Springs | Alfalfa | 10,000 | 60% | 12,235 | 71% |
| Beans | 300 | 2% | 274 | 2% | |
| Corn | 0% | 80 | 0% | ||
| Other Hay | 5,000 | 30% | 3,335 | 19% | |
| Spring Grains | 1,300 | 8% | 1,255 | 7% | |
| Sugar Beets | 0 | 0% | 0% | ||
| Other | 0% | 0% | |||
| Sub-Total | 16,600 | 100% | 17,179 | 100% | |
| Park | Alfalfa | 35,000 | 36% | 36,378 | 38% |
| Beans | 8,000 | 8% | 5,945 | 6% | |
| Corn | 5,700 | 6% | 2,283 | 2% | |
| Other Hay | 8,000 | 8% | 5,132 | 5% | |
| Spring Grains | 23,700 | 25% | 27,137 | 28% | |
| Sugar Beets | 16,200 | 17% | 18,100 | 19% | |
| Other | 0% | 1,332 | 1% | ||
| Sub-Total | 96,600 | 100% | 96,307 | 100% | |
| Washakie | Alfalfa | 13,000 | 32% | 12,211 | 28% |
| Beans | 1,700 | 4% | 1,065 | 2% | |
| Corn | 0% | 1,095 | 2% | ||
| Other Hay | 1,000 | 2% | 2,471 | 6% | |
| Spring Grains | 16,700 | 41% | 17,369 | 39% | |
| Sugar Beets | 8,800 | 21% | 9,932 | 22% | |
| Other | 0% | 0% | |||
| Sub-Total | 41,200 | 100% | 44,143 | 100% | |
| Total | Alfalfa | 150,000 | 44% | 151,459 | 43% |
| Beans | 19,500 | 6% | 15,870 | 4% | |
| Corn | 18,900 | 5% | 11,856 | 3% | |
| Other Hay | 40,000 | 12% | 42,402 | 12% | |
| Spring Grains | 71,500 | 21% | 84,373 | 24% | |
| Sugar Beets | 44,500 | 13% | 47,608 | 13% | |
| Other | 0 | 0% | 3,993 | 1% | |
| Total | 344,400 | 100% | 353,568 | 100% | |
Notes:
|
2.2.8 . Full Supply Crop Irrigation Requirement (CIR)
Based on the cropping patterns and crop irrigation requirements for the climatic station polygons, the CIR for each of the irrigated lands polygons was calculated. A summary of the CIR for the lands within the Wind/Bighorn River Basin Plan is shown in Table 2.2-5. These CIR values represent the theoretical maximum crop irrigation requirement, calculated using the methodology above, and is considered the full supply irrigation requirement for purposes of the model.
Table 2.2-5 CIR for Irrigated Lands with Wind/Bighorn River Basin Plan by Model Sub-Basin
| Model Sub-Basin | Irrigated Acres | Monthly CIR (acre-feet) | Unit CIR (ac-ft/ac) | |||||||
| Apr | May | Jun | Jul | Aug | Sep | Oct | Annual | |||
| Upper Wind | 138,863 | 10,561 | 33,354 | 60,572 | 80,813 | 63,577 | 26,875 | 1,149 | 276,901 | 1.99 |
| Little Wind | 45,536 | 1,842 | 8,887 | 18,442 | 26,128 | 20,646 | 8,755 | 617 | 85,317 | 1.87 |
| Lower Wind | 12,919 | 1,913 | 3,870 | 6,317 | 8,198 | 6,385 | 2,950 | 219 | 29,852 | 2.31 |
| Owl Creek | 17,839 | 2,334 | 4,326 | 6,849 | 9,107 | 7,043 | 3,182 | 307 | 33,148 | 1.86 |
| Nowood | 21,725 | 1,360 | 4,204 | 9,104 | 12,053 | 7,335 | 2,925 | 156 | 37,137 | 1.71 |
| Upper Bighorn | 63,150 | 5,979 | 16,883 | 30,534 | 36,846 | 22,846 | 10,552 | 967 | 124,607 | 1.97 |
| Greybull | 98,046 | 8,042 | 24,528 | 43,862 | 56,399 | 38,320 | 18,034 | 2,023 | 191,208 | 1.95 |
| Shoshone | 158,187 | 13,547 | 36,759 | 65,870 | 91,206 | 59,951 | 26,728 | 3,355 | 297,416 | 1.88 |
| Lower Bighorn | 25,862 | 2,789 | 7,338 | 12,854 | 16,247 | 10,490 | 4,995 | 581 | 55,293 | 2.14 |
| Clarks Fork | 18,299 | 1,637 | 4,251 | 7,642 | 10,539 | 6,957 | 3,113 | 440 | 34,579 | 1.89 |
| Yellowstone | 0 | 0 | 0 | 0 | 0 | 0 | 0 | 0 | 0 | 0.00 |
| Madison/Gallatin | 0 | 0 | 0 | 0 | 0 | 0 | 0 | 0 | 0 | 0.00 |
| Total | 600,426 | 50,003 | 144,400 | 262,046 | 347,536 | 243,550 | 108,109 | 9,814 | 1,165,458 | 1.94 |
Notes:
|
2.2.9 . Full Supply Diversion Requirements
The CIR represents the theoretical amount of water that is needed by the crop. Water is transported from the river to the crop through a series of conveyance facilities and on-farm facilities. These facilities lose a portion of the water that is transmitted through them before the water reaches the crops due to headgate leakage, evaporative losses, seepage, etc. These inefficiencies must be accounted for in determining the monthly diversion requirement for any crop.
2.2.10 . Overall Efficiencies
Overall efficiency is typically represented as the product of the conveyance efficiency and the on-farm efficiency. Conveyance efficiencies represent the efficiencies of the canals and/or pipelines that transmit the water from the diversion headgate to the farm turnout. Conveyance efficiencies typically vary from 65 to 90 percent, with unlined open channel distribution systems generally having lower efficiencies and pipe systems generally having the highest efficiencies (SCS, 1992 and WWDC, 1999). The distribution systems. length, soil types, lining types, and the canal cross-section and condition of structures, can all have an effect on conveyance efficiencies. The on-farm efficiency represents the efficiency of applying water to the field from the farm turnout to consumptive use by the crop. On-farm efficiencies typically vary from less than 30 to nearly 65 percent, based upon the type of irrigation practices (SCS, 1992). Flood irrigation typically experiences lower efficiencies while sprinkler systems represent higher efficiencies.
Overall efficiencies are typically difficult to estimate. This study has relied upon overall efficiencies estimated from previous reports and from standard sources. For the Wind River Indian Reservation (WRIR) area, efficiencies are taken from a study conducted by the Soil Conservation Service (SCS) (1992), which estimated efficiencies for several areas within and in the vicinity of the Wind River Reservation. The SCS developed both annual and monthly overall efficiencies. For the remaining study area, efficiencies were based upon conveyance efficiencies reported by water users within the Basin (WWDC, 1999), and typical field and application efficiencies estimated by the SCS (1992). Efficiencies typically vary by month due to antecedent moisture in banks (there is more moisture in the banks later in the season, thus there is less seepage from the canal), operational conditions, etc. Therefore, the efficiencies were varied by month using the same distribution as the monthly efficiencies calculated by the SCS for the Reservation. Table 2.2-6 presents the monthly and annual overall efficiencies used in the diversion requirement calculations.
Table 2.2-6 Monthly and Annual Overall Efficiencies
| Area | Overall Efficiency by Month | Annual Average | |||||||
| March | April | May | June | July | August | Sept | Oct | ||
| Dubois(1) | (4) | (4) | 18% | 26% | 34% | 34% | 34% | 34% | 30% |
| Lander(1) | (4) | 17% | 17% | 24% | 37% | 35% | 22% | 22% | 28% |
| Other, Large (2) | (4) | 27% | 27% | 38% | 58% | 55% | 35% | 35% | 39% |
| Other, Small (3) | (4) | 19% | 19% | 27% | 42% | 40% | 25% | 25% | 28% |
| Owl Creek(1) | 19% | 19% | 21% | 28% | 36% | 41% | 21% | 17% | 25% |
| Reservation(1) | (4) | 18% | 18% | 25% | 33% | 34% | 21% | 21% | 24% |
| Riverton(1) | (4) | 20% | 24% | 39% | 52% | 52% | 27% | 27% | 34% |
| Notes: | |
| (1) | From (SCS, 1992). |
| (2) | Based on average conveyance efficiencies from 1999 Irrigation System Survey Report (WWDC, 1999), large blocks with some lined canals and pipelines, and adequate management (SCS, 1992). Monthly distribution from (SCS, 1992) |
| (3) | Based on average conveyance efficiencies from 1999 Irrigation System Survey Report (WWDC, 1999), small systems with unlined canals and sufficient management (SCS, 1992). Monthly distribution from (SCS, 1992) |
| (4) | No consumptive use within month. |
2.2.11 . Full Supply Diversion Requirement
Based upon the crop irrigation requirements and overall irrigation efficiencies, full supply diversion requirements were calculated for the irrigated lands. The diversion requirement is calculated as the crop irrigation requirement divided by the efficiency of the system. The estimated full supply diversion requirements by sub-basin are shown in Table 2.2-7. As expected with the wide variations in efficiencies, the unit full supply diversion requirements expressed as acre-feet per acre also vary.
Table 2.2-7 Full Supply Diversion Requirements for Irrigated Lands within Wind/Bighorn
River Basin Plan by Model Sub-Basin
| Model Sub-Basin | Irrigated Acres | Monthly Diversion Requirement (ac-ft) | Unit DR (ac-ft/ac) | |||||||
Apr | May | Jun | Jul | Aug | Sep | Oct | Annual | |||
| Upper Wind | 138,863 | 52,990 | 148,602 | 171,535 | 172,482 | 134,611 | 102,584 | 4,465 | 787,269 | 5.67 |
| Little Wind | 45,536 | 10,235 | 49,374 | 73,769 | 79,175 | 60,722 | 41,692 | 2,939 | 317,907 | 6.98 |
| Lower Wind | 12,919 | 9,564 | 16,124 | 16,198 | 15,766 | 12,278 | 10,924 | 811 | 81,666 | 6.32 |
| Owl Creek | 17,839 | 12,282 | 20,600 | 24,462 | 25,298 | 17,178 | 15,153 | 1,804 | 116,776 | 6.55 |
| Nowood | 21,725 | 6,808 | 21,019 | 32,189 | 27,630 | 17,780 | 11,296 | 607 | 117,327 | 5.40 |
| Upper Bighorn | 63,150 | 24,750 | 68,152 | 87,259 | 69,516 | 45,400 | 33,940 | 3,206 | 332,223 | 5.26 |
| Greybull | 98,046 | 31,053 | 99,224 | 126,122 | 106,124 | 77,173 | 57,435 | 6,379 | 503,512 | 5.14 |
| Shoshone | 158,187 | 52,322 | 142,958 | 181,860 | 163,473 | 113,701 | 80,601 | 9,984 | 744,901 | 4.71 |
| Lower Bighorn | 25,862 | 13,143 | 34,599 | 42,899 | 35,225 | 24,039 | 18,191 | 2,113 | 170,209 | 6.58 |
| Clarks Fork | 18,299 | 7,765 | 20,260 | 25,860 | 23,152 | 16,156 | 11,494 | 1,605 | 106,293 | 5.81 |
| Yellowstone | 0 | 0 | 0 | 0 | 0 | 0 | 0 | 0 | 0 | 0.00 |
| Madison/Gallatin | 0 | 0 | 0 | 0 | 0 | 0 | 0 | 0 | 0 | 0.00 |
| Total | 600,426 | 220,913 | 620,912 | 782,154 | 717,841 | 519,040 | 383,310 | 33,912 | 3,278,082 | 5.46 |
| Notes: | |
| (1) | Does not include Tribal Futures projects or Popo Agie Basin. |
2.2.12 . Summary and Conclusions
The purpose of the analysis summarized in this section was to document the status of historical and current agricultural water use within the WBHB and to document the methodologies used to develop data necessary for the river basin simulation models. A summary of the irrigated lands identified in this study as well as those documented in the 1972 Water Plan (SEO) is presented in Table 2.2-8. The current estimate of irrigated lands is approximately 54,000 acres (10%) greater than the estimate of irrigated lands in the 1972 Water Plan. In addition, the estimate of idle lands is approximately 44,000 acres (150%) greater than the estimate of idle lands in 1972. The differences could be due to increased lands under irrigation, but are more likely a difference in estimation techniques. For instance, the definition of idle lands in the 1972 Water Plan (lands purposely left idle for any given year or lands on which a crop was planted but not harvested) is much more strict than used in this study (basically any land with a water right not currently irrigated but that has shown any signs of past irrigation). Another factor is that the current basin plan considered all lands in the Wind River Irrigation Project that were given water rights as either irrigated or idle, whereas the 1972 Water Plan may have not.
Direct comparisons of consumptive use are not as easy because the current basin plan did not calculate consumptive use for the Popo Agie Basin, as it was already included in another water study. However, a comparison of unit consumptive use (ac-ft/ac) can be made. The 1972 Water Plan calculated a total consumptive use for the 538,830 acres as 1,028,500 acre feet, or approximately 1.91 acre feet per acre. As shown in Table 2.2-5, the current basin plan calculated a consumptive use of 1,165,000 acre feet for the 600,400 acres used in the model, or approximately 1.94 acre feet per acre, which agrees very closely to the consumptive use calculated in the 1972 Water Plan.
A major purpose of the irrigated lands and consumptive use calculations in this study was to provide data for overall basin planning, therefore a conservative approach was taken. The conservative approach ensures that all lands with currently or recently active water rights are considered in the water needs analysis and are considered when available surface water is determined. More detailed analyses could be performed once specific projects are identified.
Table 2.2-8 Summary of Irrigated Lands
| Category | 1972 Water Plan (SEO) | 2002 Wind/Bighorn Basin Plan(3) | |
| Current (1972) | Projected (2000) | ||
| Irrigated Lands (acres) (1) (2) | 509,640 | 516,330 | 563,529 |
| Idle Lands (1)/Lands with Water Rights (acres) (2) | 29,190 | 22,500 | 72,794 |
| New Land Development (1) /Tribal Future Projects (acres) (2) | --- | 102,670 | 52,667 |
| Total | 538,830 | 641,500 | 688,990 |
| Notes: | |
| (1) | Term used in 1972 Water Plan |
| (2) | Term used in Wind/Bighorn Basin Plan |
| (3) | From Irrigated Lands Mapping (Includes Popo Agie Basin) |
| Irrigated Lands = Mapped Irrigated Lands + Man-Made Riparian | |
| Idle Lands = Lands with Water Rights . Tribal Futures Projects | |
| New Land Development = Tribal Futures Projects |
2.3 . Municipal Water Use Profile
2.3.1. . Introduction
According to the U.S. Environmental Protection Agency (EPA), there are currently 58 active municipal and non-municipal community public water systems in the WBHB (Lamb, 2002). Through its water system surveys, the Wyoming Water Development Commission (WWDC) has acquired detailed information on approximately 40 of these public water systems. Information provided in the 2002 Water System Survey (WWDC:WSS, 2002) indicates these systems are capable of storing more than 36.7 million gallons of water obtained from rivers, streams, wells, reservoirs, and lakes to serve more than 59,000 people, or roughly 87% of the WBHB population. The average daily municipal water use for the WBHB is approximately 12.2 million gallons per day (MGD), or roughly 207 gallons per day per person (WWDC, 2002). Figure 2.3-1 shows the location of public water supplies in the WBHB.
This section provides water use and capacity information for these 58 municipal and non-municipal community public water systems that are located in the WBHB. Of the following 25 municipalities in the WBHB, only 11 serve more than 1,000 people. Surface water is the primary source for most of these larger population centers and is utilized to supply 68% of the average water use in the WBHB. Ground water is the source of supply for the larger populated areas of Greybull, Dubois, Basin, and Worland, and is utilized to supply 32% of the average water use in the WBHB. The following municipalities primarily use ground water sources of supply:
| * Burlington | * Pavillion |
| * Manderson | * Shoshoni |
| * Greybull | * Ten Sleep |
| * Hyattville | * Worland |
| * Dubois | * Basin |
| * Hudson |
The following municipalities utilize surface water sources as their principal supply:
| * Lander | * Frannie |
| * Riverton | * Lovell |
| * Thermopolis | * East Thermopolis |
| * Meeteetse | * Kirby |
| * Byron | * Lucerne |
| * Deaver | * Cody |
| * Powell | * Cowley |
Within the vicinity of these municipalities are various subdivisions, mobile home parks, water and sewer districts, and water users associations that utilize surface and ground water sources for community public water systems. Riverton supplements its surface water supply with ground water from the Wind River Aquifer, and it represents their sole supply during the non-irrigation season. In addition, Yellowstone National Park utilizes surface water for its visitors to the park.
Information used in the preparation of this section was acquired from several different sources and is tabulated in the Technical Memorandum, Chapter 6, Appendix A and Appendix B. For the community public water systems in the WBHB that provided information to the WWDC, the 2002 Water System Survey Report provided the basis for establishing their water system capacity and existing use. The EPA public water system database provided the basis for information on the remaining community water systems. To acquire additional information, these systems were contacted by telephone and were asked to complete a brief questionnaire about their system. In a few cases, information obtained on the water system or the data in the WWDC 2002 Water System Survey Report, as reported to the WWDC, could not be confirmed.
2.3.2 . Ground Water Use
Based on the listing of public water systems registered with the EPA in the WBHB, more than 16,000 people rely on ground water sources of supply for their community water systems. Some of these systems obtain water from shallow alluvial wells and/or springs, which may be regulated as ground water under the direct influence of surface water. Roughly 75% of these people are served by ground water delivered from the Towns of Greybull, Dubois, and Worland, and the South Big Horn County Joint Powers Board. More detailed usage information is included in Chapter 2, Section 6 of the Technical Memorandum Municipal Water Use Profile, Appendix A. Locations of wells that are used for municipal supply and produce more than 50 gpm can be found in Technical Memorandum Municipal Water Use Profile, Chapter 2, Section 6.
Of the 58 municipal and non-municipal community public water systems that are located in the WBHB, 36 of these systems are serviced by ground water derived from high quality sources in the WBHB. These community systems use at least 3.9 MGD on average based on information provided to the WWDC. Peak ground water usage is more than double that amount at 8.8 MGD. Several small communities report low average per capita use ranging from 40 to 70 gallons per capita per day (GPCD), while the Towns of Greybull and Ten Sleep reportedly use the most on average ranging from 450 to 500 GPCD. Peak usage per capita ranges from 48 GPCD in the North Riverton Water & Sewer District to 1,500 GPCD in the Town of Ten Sleep. Several of these systems are unmetered and per capita usage could not be verified.
2.3.3 . Surface Water Use
Based on the listing of public water systems registered with the EPA in the WBHB, at least 43,000 people in the WBHB rely on surface water sources of supply for their community water systems. While 22 public water systems service residents of the WBHB with surface water, only seven sources that are controlled by various entities are utilized for supply. These sources include the Middle Popo Agie River, Wind / Bighorn River, Wood River, Buffalo Bill Reservoir (Shoshone River), Gardner Creek, Panther Creek, and the Firehole River. Lander and Thermopolis divert water for their own use and supply other entities. The largest surface water diversion is the Shoshone Municipal Pipeline that obtains water from Buffalo Bill Reservoir and distributes water to roughly 21,000 people downstream along the Shoshone River. Riverton, Meeteetse, and Yellowstone National Park all divert surface waters for their own water supply use. Of the municipalities in the WBHB, Riverton is unique in that the town supplements with ground water during the summer months and exclusively uses ground water for municipal supply during the non-irrigation season. The location, population served, and source for these community public water systems are listed in Chapter 2 of the Technical Memorandum, Municipal Water Use Profile. More detailed usage information is included in the Technical Memorandum, Chapter 2, Section 6, Appendix A.
The 22 municipal and non-municipal community public water systems that are located in the WBHB utilize a substantial amount of water to supply both average and peak demands. These community systems use an average of 8.3 MGD based on information provided to the WWDC by the community public water systems. As with ground water sources, peak surface water usage is almost more than double average use and is approximately 16.2 MGD. On a per capita basis, the Mammoth Hot Spring system within Yellowstone National Park reportedly uses the least amount of water at an average rate of 10 GPCD, while the City of Thermopolis uses the most on average at 530 GPCD. Peak usage per capita ranges from 100 GPCD at Mammoth Hot Spring to 1,136 GPCD in Meeteetse. Again, several of these systems are unmetered and per capita use could not be verified.
While 7 entities obtain their municipal water supply from surface water sources, most of the 22 community water systems that are actually served return water from their wastewater treatment facilities to the stream from which they obtained their supply. The impact of this practice upon surface waters can best be determined by assuming that depletions in streamflow are equal to the unit amount of the diversion minus the unit return flow to the stream. In several instances, municipal return flows, however, actually augment streamflow because those municipalities obtain their water supply from non-tributary ground water sources. Estimated surface water depletions were calculated on a monthly basis to accommodate the modeling efforts for this planning study. These estimates of monthly diversion and wastewater discharge were developed from information provided by each community system. Only actual wastewater point source discharges have been considered in this analysis.
2.3.4 . Conclusions
Surface and ground water resources within the WBHB are utilized to serve more than 59,000 people, or roughly 87% of the basin.s population. The average daily municipal water use for the WBHB from all sources is nearly 12.2 MGD, or roughly 207 GPCD. Surface water is utilized to supply 68% of the average water use for 22 municipal and non-municipal community public water systems in the WBHB. Ground water is used to supply 32% of the average water use for 36 public water systems, including the Towns of Greybull, Dubois, Basin, and Worland.
Based on EPA and WWDC data, it appears that the majority of the municipal and non-municipal community public water systems in the WBHB have sufficient water to meet their current needs. However, it appears that Lander and Hudson may have insufficient water treatment and potentially water storage based on peak usage volumes. While it appears the municipal entities have sufficient water, Lander and other entities have expressed concern about the susceptibility of their water resources to drought periods. Certain ground water dependent towns are concerned about declining water levels, storage capacity, well interference, and most importantly, well redundancy. For this reason, several municipalities have sought alternative water sources to supplement their existing sources.
2.4 . Domestic Water Use Profile
2.4.1 . Introduction
The purpose of this section is to estimate overall domestic water use in the Wind/Bighorn River Basin planning area, which includes all or portions of the following counties: Big Horn, Washakie, Hot Springs, Natrona, Johnson, Fremont, Park and Teton. Within this area the principal users of domestic water supplies are rural homes and non-municipal public water systems that are regulated by the U.S. Environmental Protection Agency (EPA). These public water systems are utilized by a wide variety of users, including the following: commercial establishments, national forests and recreational areas, state and national parks, campgrounds, rural schools, businesses, ranches, rest areas and other small water users.
Within the planning area, both surface and ground water sources are used to provide domestic water supplies. Ground water from wells is used almost exclusively to provide domestic supplies to rural homes and supplies virtually one half of the water used by all non-municipal public water systems. Surface water sources provide the other half of the water used by these public water systems, and are used exclusively to provide domestic supplies at Canyon and Grant Villages in Yellowstone National Park. Surface water is also used on a limited basis by many rural homes to irrigate lawns and gardens.
2.4.2 . Non-Municipal Public Water System Usage
In order to estimate domestic water use by non-municipal public water systems, the EPA was contacted to obtain a listing of systems in the planning area. By definition, a public water system may be publicly or privately owned, and must serve at least 25 people or 15 service connections for at least 60 days per year. For the purposes of this report, only transient non-community and non-transient non-community public water systems were considered. Community systems that include municipalities and subdivisions were considered in Section 2.3, Municipal Water Use. EPA records indicate there are 115 non-municipal public water systems within the project area. The users of non-transient non-community systems generally obtain water from a municipal system or domestic well, and transient non-community systems generally only supply a relatively small amount of water to their users. These systems are distributed throughout the area as follows: 13 in Big Horn County, 30 in Fremont County, 3 in Hot Springs and Natrona Counties combined, 52 in Park County, 13 in Teton County, and 4 in Washakie County.
EPA reported the population served by these non-municipal public water systems was 34,287 people, of which 74.1% were located in Yellowstone National Park in Teton County. It is anticipated that they only use a limited amount of water, and that this usage is seasonal given the high population percentage attributable to Yellowstone National Park. To estimate domestic water usage from these 115 public water systems, an estimated usage rate of 75 gallons per capita per day (gpcpd) was assumed. This assumption yields an estimated domestic water usage of 2.57 million gallons per day (MGD).
Both ground and surface water supplies are utilized to meet daily domestic demands in the planning area. Of the estimated 2.57 MGD that are used, roughly 45% is supplied by surface water sources while 55% is supplied by ground water. Yellowstone National Park is the primary surface water user and obtains most of its water supplies from the Yellowstone River and Yellowstone Lake. Due to the population served, Yellowstone National Park is also the largest user of non-municipal ground water in the planning area and accounts for 53% of the overall ground water used by non-municipal public water systems in the planning area.
2.4.3 . Rural Domestic Water Usage
Because ground water is the predominant source developed for domestic supplies in rural areas, the State Engineer Office.s (SEO) Database of Wells was obtained to access information on domestic wells. This database includes the permitted water right for each well. However, this amount is generally not representative of actual water use. Because wells are typically only used periodically, the total annual volume of water used is considerably less than the well could produce if it were pumped continually. It is also likely that some of the permitted domestic water rights are inactive.
The spatial distribution of water rights for domestic wells in the planning area were aggregated, tabulated, and utilized to create a well information layer in the basin GIS, as shown in figure 2.4-1. Each domestic well was geospatially located with the GIS. The representative dot for each well in the GIS layer is linked to tabular data obtained from the SEO.
Population data, rather than water rights for ground water wells were utilized to estimate domestic water usage in the planning area. Rural domestic water use was estimated on the basis of the rural population served by wells in combination with assumed per capita usage rates. Year 2000 census information, sorted by county, was obtained from the U.S. Census Bureau. Estimates of population served by municipal systems discussed in Section 2.3, Municipal Use, were then subtracted from the total county population to estimate the number of domestic users. Table 2.4-1 summarizes the population served by community public water supplies and the estimated rural population for Big Horn, Fremont, Hot Springs, Park, and Washakie Counties using the method described above. For the approximately 19 domestic wells that are located within the planning area in Natrona County, domestic water use was estimated based on average household size, the number of wells, and an assumed per capita usage rate.
Total rural domestic water usage for the planning area has been estimated to range up to 7.8 MGD. Based on Table 2.4-1 and the assumption that there are 2.5 persons for each of the 19 wells or households in Natrona County, the total rural domestic population for the planning area is estimated to be 26,002. This population represents approximately 30% of the total population within the basin. It is presumed that this population is served by domestic ground water wells, and therefore, is independent of the population served by municipal water systems. Assuming this population uses between 150 and 300 gallons per capita per day (gpcpd), the total domestic ground water use ranges from 3.9 to 7.8 MGD.
Almost 83% of rural domestic water supplies are predominantly derived from wells located in Fremont and Park Counties. Fremont County contains approximately 59% of the estimated rural population, while Park County is inhabited by roughly 23.7%. The high density of wells in these counties is illustrated on Figure 2.4-1. Based on their locations, it appears that the Alluvial, Wind River, Willwood and several Paleozoic Aquifers provide the majority of ground water used for domestic purposes in rural areas, not only in Fremont and Park Counties, but throughout the planning area.
2.4.4 . Conclusions
Based on rural domestic and non-municipal public water system usage, total domestic water usage for the planning area has been estimated to range from 6.5 to 10.4 MGD. Assuming the rural domestic population of 26,002 uses between 150 and 300 gpcpd, estimated rural domestic ground water use ranges from 3.9 to 7.8 MGD. Almost 83% of rural domestic water supplies are predominantly derived from wells located in Fremont and Park Counties. For the 34,287 people who use the 115 non-municipal public water systems, domestic water usage is estimated at 2.57 MGD, assuming a usage rate of 75 gpcpd. Approximately 74% of the people who use these systems are located in Yellowstone National Park in Teton County.
Both ground and surface water supplies are utilized to meet daily domestic demands in the planning area. Of the estimated 6.5 to 10.4 MGD that are used, roughly 26% is supplied by surface water sources while 74% is supplied by ground water. Yellowstone National Park is the primary surface water user and obtains most of its water supplies from the Yellowstone River and Yellowstone Lake. Rural domestic water users consume approximately 58% of all ground water used for domestic purposes, while non-municipal public water systems in Yellowstone National Park and the rest of the planning area use roughly 23% and 19%, respectively.
TABLE 2.4-1
Rural Population Estimates by County
In the Wind/Bighorn Basin1
| County Population | Population Served2 |
| Total Big Horn County Population | 11,461 |
| Total Big Horn County Municipal Population | 9,2533 |
| 2,208 |
| Total Fremont County Population | 35,804 |
| Total Fremont County Municipal Population | 20,4614 |
| 15,343 |
| Total Hot Springs County Population | 4,882 |
| Total Hot Springs County Municipal Population | 4,276 |
| 606 |
| Total Park County Population | 25,786 |
| Total Park County Municipal Population | 19,6235 |
| 6,163 |
| Total Washakie County Population | 8,289 |
| Total Washakie County Municipal Population | 6,6546 |
| 1,635 |
| 25,955 |
| Notes: | 1 A more detailed description can be found in the Technical Memorandum Domestic Water Use Profile. |
| 2 Inconsistencies in the total municipal population reflect differences in the populations served by municipalities as reported to the EPA and WWDC. | |
| 3 Big Horn County municipal population estimate excludes the populations of those towns that are served by other water systems in the county. | |
| 4 Fremont County municipal population estimate excludes the population of one subdivision that purchases surface water from the City of Lander. | |
| 5 Park County municipal population estimate excludes the populations of those towns in Big Horn and Park Counties that are served by the Shoshone Municipal Pipeline. | |
| 6 Washakie County municipal population estimate excludes the population of South Worland, which is served by the City of Worland. |
2.5 . Industrial and Mining Water Use
2.5.1 . Introduction
Most industrial water users in the Wind/Bighorn Basin (WBHB) are comparatively small companies, with relatively low water needs. In most cases, these companies draw their water from municipal systems, or from their own wells. In many cases the water used from wells for industrial purposes is not suited for other uses due to poor water quality. For those industries utilizing water from municipal sources, that consumptive use is included in the WBHB as municipal use. Projections of industrial water needs at low, medium and high growth rates over the planning period are discussed in Chapter 4.
2.5.2 . Industry in the WBHB
The WBHB.s economy, like Wyoming.s as a whole, has long depended on a triad of industries: mining (especially coal, bentonite, oil and gas), tourism and agriculture. Mining.s annual payroll in Wyoming nearly doubles that of retail trade, the nearest competing sector. In terms of numbers of jobs, it trails only retail trade and accommodation, and food services (U.S. Census Bureau, 1997 Economic Census). Other economic sectors, such as manufacturing, are significantly impacted by events in the minerals industries. Another energy-producing industry, hydroelectric power production, needs to be considered. Virtually all hydroelectric power is currently produced by the U.S. Bureau of Reclamation at its reservoirs, although there may be more potential in the power generation industry. Wyoming.s electricity costs are well below the national average, and this might prove useful in attracting new manufacturing plants.
2.5.3 . Manufacturing
Large manufacturing companies are rare in the WBHB, as they are in the state as a whole. In the WBHB there are about two-dozen manufacturing companies that consistently maintain a workforce of twenty-five or more. Most of the larger companies. products are related to Wyoming.s overall character . products derived from minerals, products for agriculture, and products for camping, hunting and fishing. Machinery, electronic goods, and fabricated metal products are also manufactured in the WBHB.
Table 2.5-1 Types of Manufacturing in the Wind/Bighorn Basin
| Industry | Location |
| Sugar beet refineries | Worland, Powell |
| Bottling, water and beverages | Worland |
| Aluminum can manufacturing | Worland |
| Light manufacturing (Brunton Company) | Riverton |
| Bentonite Plants | Greybull, Lovell, Worland, Lucerne |
| Sulphur plant | Rural Fremont County |
2.5.4 . Power Production
Hydroelectric power is produced by water-driven turbines at thirteen Bureau of Reclamation sites in Wyoming, six of which are in the WBHB. Collectively the six WBHB plants have a production capacity of 47,100 kW. Clearly the Wind/Bighorn system is capable of producing considerably more power. A 1993 study for the U.S. Department of Energy listed sites with potential for hydropower production on the Bighorn River at Kane and Thermopolis, as well as on the Clarks Fork, Popo Agie, and Shoshone Rivers. Other listed sites were on Shell, Sunlight, Sunshine, and Tensleep Creeks (Francfort, 1993).
The concern is whether or not there is a ready market for increased amounts of electric power, and whether or not the power can be transmitted to market. The possibility of the deregulation of the electric power industry exists, creating many uncertainties in the industry. Historically, the industry has been vertically integrated, with power generation, transmission, and distribution linked within corporations. Legislation mandating separation of these functions has been enacted in Oregon, Arizona, and Texas, and suspended in California after having been enacted. In Wyoming, restructure has been studied, but there are currently no active efforts to legislate deregulatory action. (Energy Information Administration, 2002. http://www.eia.doe.gov/) Although the potential to produce more power in the WBHB exists, at this time the transmission capacity necessary to export that power is lacking. The future of the state.s electric power industry is uncertain, since .transmission issues cloud investment in generation. (Wyoming Energy Commission, http://www.wyomingbusiness.org/minerals/index.cfm) [new link 10/2009 HERE]. Development of additional generation capacity, for export outside the state, appears to hinge on further development of markets and transmission capacity. Power production for local consumption and/or peak demand is more promising.
Currently there are no commercial fossil fuel power generation facilities in the WBHB. Small gas-fired, gas-cooled, turbine generating stations are utilized in the oil and gas industry for internal use such as powering gas pumping stations. Historically there has been both coal mining and coal fired power production in the WBHB, however, reported coal production ceased in the WBHB in 1966 and 1994, respectively (Lyman, 2002). However, as discussed in the report .Power Generation Potential in the Wind River, Clarks Fork, and Bighorn Basins of Wyoming., there are sufficient coal and natural gas reserves in the WBHB to support at least modest power production.
Promising new developments in combined-cycle gas turbines, using gas-fired, gas-cooled turbines in combination with waste heat/gas-fired conventional steam turbines may make natural gas electric power production more competitive. William Liggett of the Energy Information Agency points out that .Technological improvements in gas turbines have changed the economics of power production. No longer is it necessary to build a 1,000- megawatt generating plant to exploit economies of scale. Combined-cycle gas turbines reach maximum efficiency at 400 megawatts, while aero-derivative gas turbines can be efficient at scales as small as 10 megawatts. ( http://www.eia.doe.gov).
2.5.5 . Mining: Oil & Gas, Coal, Uranium, Bentonite, and Gypsum
Over the years the WBHB, as well as the state generally, benefited from repeated mining booms; there has been oil and gas, bentonite and industrial minerals, and coal production in the WBHB for many decades. Oil and gas remain important to the WBHB economy, with gas plants in all counties except Hot Springs, but it seems unlikely that the future will offer many more jobs in the industry. There appears to be more potential in the Wind River Basin Province than in the Bighorn Basin Province (Fox and Dolton, 1995).
The future for uranium mining appears to be in-situ development, in which wells, rather than open-pit mines, are used to extract the ores. Non-potable ground water is re-injected into ore seams as part of a reverse osmosis process, resulting in a net consumptive loss of only 5% or so. Uranium production via in-situ methods is active in the Powder River Basin, making Wyoming one of the largest uranium producing localities in the United States. One potential future in-situ uranium mine, Power Resources, Inc., is permitted but not in production in the Gas Hills Uranium District, Fremont County. Additional uranium reserves in the District, held by other interests, could support a second in-situ operation or enhance the longevity of the currently planned development.
Wyoming leads the nation in bentonite production, and it is mined at several locations in the WBHB. The outlook for bentonite production seems to be a continuance of the status quo. No large increases or decreases in productions seem likely. (Madsen and Magstaff, 2002). Bentonite processing plants are located in Big Horn County at Greybull and Lovell and Washakie County in Worland. The Black Hills Bentonite plant in Worland uses about 500,000 gallons of water per month, purchasing it from the City of Worland. Near Greybull, WyoBen.s water is pumped from the Bighorn River, and used mainly for dust control on haul roads. Lovell.s American Colloid plant uses bentonite to produce drilling mud, and uses very little water. The future of that operation is closely tied to that of oil and gas drilling (Bischoff, 2002.) There are gypsum plants in Park and Big Horn Counties, producing wallboard. Well water is used in the process, and recycling is practiced in all plants.
Despite the vicissitudes of minerals production, mining in the WBHB has generally offered better-paid jobs than most other industries. It remains fundamental to the WBHB.s economic foundation. Absent the development in the WBHB of major new industries, such as light manufacturing or agriculturally related industry, the size and makeup of both the economy and population will continue to be strongly related to the economics of mineral production.
2.5.6 . Summary of Consumptive Industrial Use
Current Water Rights/Usage
The Technical Memorandum, Chapter 2, Section 8, Appendix A contains a listing of all industrial and mining water rights, surface and ground water, in the Wind River/Bighorn River Basins, from Division III, State Engineer.s Office, tabulation, 1999. In summary, the permitted water rights for mining and industrial uses in the Basin are:
| Oil & Gas, including pipelines | 73,792 acre feet per year |
| Mining, dust control and mine pit waters | 2,741 acre feet per year |
| Manufacturing and miscellaneous industrial | 15,708 acre feet per year |
| Total Permitted Water Use - Industrial and Mining | 92,241 acre feet per year |
Steam Power Plant Water Usage
Although there are currently no fossil fuels power plants in the WBHB, there is a potential reserve base for either coal or natural gas fired electric power production. It is estimated that a nominal 200 MW coal-fired steam turbine facility would require approximately 4,000 acre feet per year of water and a 500 MW gas-fired combination turbine facility would require approximately 5,000 acre feet per year of water.
2.6 . Environmental and Recreational Water Uses
2.6.1 . Introduction
Environmental and recreational uses are, for the most part, non-consumptive uses. Environmental and recreational uses are very important in the WBHB, with respect to socioeconomic impacts and general contribution to Wyoming.s quality of life. Environmental and recreational water needs are closely related, and are often, in the current social and regulatory climate, controversial. Institutional factors play a large role in the management of water for these needs, particularly in the WBHB, where nearly eleven million acres are public lands. Recreational uses of water, such as fishing and boating, are usually non-consumptive, but dedication of water to environmental purposes can at times exclude other uses. The quality and quantity of good recreational opportunities, however, are highly dependent on water quality and quantity . the two uses are closely interrelated.
Recreation, including tourism, is one of Wyoming.s three major industries. Hunters and anglers alone spent $700,588,360 in the state in the year 2000 (Equality State Almanac, 2000). Major recreational activities dependent on water are fishing, boating, waterfowl hunting, and swimming. Other recreational activities such as big-game and upland game bird hunting, snowmobiling, skiing, sight-seeing, photography, camping, and golfing are also more or less sensitive to water quantity and quality.
2.6.2 . Institutional Considerations
Institutional variables are very important in assessing current and future uses, both environmental and recreational. Management of land, water, wildlife and associated resources occurs within a multifaceted context of institutional constraints. However, perhaps the most basic institutional constraint is fragmented ownership and control of natural resources.
2.6.3 . Land Ownership and Management
An important factor in managing lands and waters for recreational and environmental purposes is the fractured nature of land ownership and control in the WBHB. 15.2 million acres land is publicly owned, with management divided among numerous governmental agencies at local, state and national levels. As well, demographic, economic, social and political factors within the Reservation can influence resource management in the whole of the WBHB. Refer to Chapter 1, Table 1.3-1 .Land Ownership in the WBHB. a tabulation of the diverse nature of land management in the WBHB.
2.6.4 . Threatened, Endangered, and Candidate Taxa:
The presence of threatened or endangered species of plants and animals, or of species that might be considered for such listing, can make water management and development more complex. A number of taxa in Wyoming are so listed. Section 2 (c)(2) of the Endangered Species Act requires state and local agencies to cooperate with federal agencies in issues involving such taxa. Particularly in cases in which federal land is involved, such cooperation means conducting wildlife and plant studies of the targeted area. Some of the listed animal and plant taxa are found in the WBHB. Animal Species include the grizzly bear, whooping crane, Kendall Warm Springs dace, bald eagle, black-footed ferret, lynx, Preble.s meadow mouse, Pike minnow (squawfish), razorback sucker, Wyoming toad, and gray wolf. Listed plant species are Colorado butterfly plant, blowout penstemon, Ute ladies. tress, and desert yellowhead. There are also other taxa that have been proposed for addition to the Threatened list, and a long list of Candidates (258 species) for endangered or threatened status.
Efforts are ongoing to protect and restore populations of the Yellowstone Cutthroat Trout in the WBHB, particularly in the drainages of the Greybull, Wood, and South Fork of the Shoshone rivers. Shovelnose Sturgeon have been released in the Bighorn River in an effort to restore those populations.
In regard to threatened and endangered species, however, the U. S. Fish and Wildlife Service states that .While it is prudent to take candidate taxa into account during environmental planning, neither the substantive nor procedural provisions of the Act apply to a taxon that is designated as a candidate.. Nonetheless, as a practical matter, the presence or possible presence of Threatened, Endangered, Proposed, or Candidate taxa in locales that could be affected by water projects, must be considered by developers. Wildlife and plant (and cultural) studies are routinely done early on in most projects, particularly if public lands are involved.
2.6.5 . Wild and Scenic Rivers
Wyoming.s only Congressionally designated .Wild and Scenic River. is a twenty-mile stretch of the Clarks Fork River in Park County. Other WBHB streams have been suggested as deserving protective status, including the Porcupine drainage in Big Horn County, and Wiggins Fork in Fremont County. (U.S. National Park Service, 1982).
The Clarks Fork heads in Montana.s Beartooth Mountains, flows into Yellowstone Park and Park County, and then north to Montana again. The river provides wilderness-type fishing and kayaking, especially in its spectacular canyon. Fishing pressure is higher outside the park, in the lower reaches of the river. The possibility of damming the river for purposes of storage, power generation, bringing new land under irrigation, and perhaps transferring Clarks Fork water into the Shoshone River Basin, has been investigated (WWDC, Clarks Fork Level II, 1986).
2.6.6 . Glaciers
The Wind River Mountains are home to the largest glacier field in the lower forty-eight states. The field covers about 17 square miles, and seven of the ten largest glaciers in the lower 48 are in this field. The melt waters from these glaciers contribute to the flow of the Wind/Bighorn River, and are thought to be particularly important in maintaining fisheries and irrigation water in late summer and early fall (July through October). For further discussion on the glaciers and their impact on the Wind River base flows, see Section 2.8, chapter 2, page 44, Wind River Range Glaciers.
2.6.7 . Yellowstone National Park
Yellowstone, the nation.s and the world.s oldest national park, is a World Heritage Site. Although management of Yellowstone National Park is the province of the U. S. National Park Service, Wyoming takes the position that the Park Service needs permitting from the state to use the water. Within the portion of Yellowstone in the WBHB drainage, the Park Service has received permits from the state to drill wells for the purpose of monitoring water levels and condition, and has a surface water right to one acre foot per year for domestic use at its East Entrance facilities. Fishing inside Yellowstone National Park is licensed by the park service and does not require a Wyoming (or any state) license. Recreational and environmental management within Yellowstone National Park is done by the Park Service.
Visitors to Yellowstone National Park provide the bulk of the WBHB.s tourism. From 1990 through 2000, recreational visitors to Yellowstone National Park averaged nearly three million people per year, but the East Entrance, west of Cody, averaged fewer than 400,000 per year during the 1992-98 period (Yellowstone National Park, Visitation Statistics). The South Entrance, reached through Fremont and Teton Counties (as well as from the west and south) averaged more than 800,000 per year during the same period. These numbers suggest that perhaps 500,000 to 600,000 people bound for Yellowstone pass through the WBHB each year. The percentage of visitors who stop to recreate in the WBHB is probably best suggested by sale of short-term non-resident fishing licenses, 30,372 in 2000 (Wiley, 2001).
2.6.8 . Wind River Indian Reservation (WRIR)
The Wind River Indian Reservation, home of the Eastern Shoshone and Northern Arapaho Tribes, covers more than two million acres in Fremont and Hot Springs counties. Within the boundaries of the WRIR are extensive private lands, and the WRIR operates within a context of tribal, federal, state and local authority and activity. Natural resources on the WRIR are in general jointly owned by the two Tribes. Tribal water rights date from the 1868 Treaty between the United States and the Shoshone Tribe. Water is managed under the Wind River Water Code, jointly adopted in 1991 by the Tribes (Collins, August, 2000).
A Water Resources Control Board is the .primary enforcement and management agency responsible for controlling water resources on the Reservation.. (Wind River Water Code, 1991). Lengthy legal proceedings between the State of Wyoming and the Tribes awarded the right to 500,000 acre feet of water to the Tribes, of which 209,000 acre feet are reserved for future use. The Tribes sought to utilize their awards for such environmental/recreational purposes as wildlife usage or instream flows in litigation, but failed in court to make such changes.
Within the WRIR are more than 200 lakes and over 1000 miles of streams. Fishing on the WRIR requires a Tribal license. The Tribes reported selling 2,472 permits in 1998, and 3,577 in 1999. About 60% of these sales were to non-residents (University of Wyoming, Cooperative Extension Service, 1999). There is significant potential for further development of recreational opportunities, including water-based activities, in the WRIR.
2.6.9 . Reservoir-Allocated Conservation Pools and Recreation Permits
"Conservation storage" describes all of the storage capacity allocated for beneficial purposes, and is usually divided into active and inactive areas or pools. "Active storage" or .Active Conservation Pool. refers to the reservoir space that can actually be used to store water for beneficial purposes. Each reservoir has an allocation for an Active Conservation Pool, which holds reservoir inflow for such uses as irrigation, power, municipal and industrial, fish and wildlife, navigation, recreation, water quality, and other purposes. .Inactive storage" refers to water needed to increase the efficiency of hydroelectric power production, to areas beneath the lowest outlet structures, where water can't be released by gravity, and to areas expected to fill up with sediments.
Table 2.6-1 displays the size of the conservation pools in WBHB reservoirs. For a detailed description of the permitted water rights in the WBHB that have a recreational component, see Chapter 2, Section 9, of the Technical Memorandum Environmental and Recreational Use.
Table 2.6-1: WBHB Reservoir Conservation Pools (Acre-feet)
| Reservoir | Active | Inactive | Total |
| Bighorn | 336,103 | 477,576 | 813,679 |
| Boysen | 378,184 | 179,097 | 557,281 |
| Buffalo Bill | 604,817 | 41,748 | 646,565 |
| Bull Lake | 151,737 | 822 | 152,559 |
| Pilot Butte | 29,918 | 665 | 30,583 |
| WBHB | 1,500,759 | 699,908 | 2,200,667 |
2.6.10 - Instream and Maintenance Flows and Bypasses
In Wyoming, instream flow water rights cannot be issued to private interests, only the state can hold them. The Wyoming Instream Flow Statue (41-3-1001 to 1014) narrows the use of instream flow rights for fishery purposes only (Sue Lowry, Director of Policy, Wyoming State Engineer.s Office, August 2002). However, maintenance of instream flows can also benefit water quality, riparian and flood plain management, ground water recharge, and aesthetic considerations.
The Wyoming Game and Fish Commission (WGFC) since 1986, has taken action to identify streams, for which the filing of applications for instream flow water rights were appropriate. The WGFC established general guidelines that are used to determine where to request applications for instream flow segments: the stream must be an important fishery, located on public lands or lands with guaranteed public access, or have existing instream flow agreements (Annear, T. C., and Dey, P. D., 2001). Chapter 2, Section 9 of the Technical Memorandum Environmental and Recreational Use provides detailed data on Instream Flow Applications in the WBHB. There is a total of 280,520 acre feet requirement permitted, and another 277,716 acre feet requirement pending. WGFC will likely request that more streams will be filed in the near future (Annear, T. C., WGFC, personal communication, July 2, 2001).
2.6.11 . Wetlands and Riparian Areas
Riparian areas and wetlands are ecologically important, helping to maintain streamflows, reduce erosion, and provide wildlife habitat. These beneficial effects contribute to higher quality recreational opportunities also, and have beneficial impacts for livestock as well. Wetlands are classified as lacustrine, palestrine, and riverine. Lacustrine wetlands lie in lowland channels, similar to but smaller than lakes. Palustrine systems are small, shallow water bodies, generally with lots of tree or shrub cover, and riverine wetlands lie along streams. A detailed listing of the type and acreage of wetlands are shown by county in Table 2.6-2. Figure 2.6-1 maps wetland areas in the WBHB.
Table 2.6-2 WBHB Wetlands (Types and Acreages by County)
| County | Lacustrine | Palustrine | Riverine | County Total |
| Big Horn | 8,054.52 | 22,582.79 | 5,286.18 | 35,923.49 |
| Fremont | 39,154.51 | 55,714.73 | 11,567.73 | 106,436.97 |
| Hot Springs | 114.00 | 4,791.81 | 1,259.32 | 6,165.13 |
| Johnson | 51.54 | 256.98 | 0.00 | 308.52 |
| Natrona | 0.00 | 1,182.00 | 14.46 | 1,196.46 |
| Park | 326,840.46 | 72,551.65 | 49,509.75 | 448,901.86 |
| Sheridan | 0.00 | 19.35 | 0.00 | 19.35 |
| Teton | 86,390.22 | 42,602.19 | 36,999.33 | 165,991.74 |
| Washakie | 627.22 | 4,845.70 | 11,961.54 | 17,434.46 |
| Total | 461,232.47 | 204,547.20 | 116,598.31 | 782,377.98 |
The U.S. Department of Agriculture has a number of programs administered by its Natural Resources Conservation Service (NRCS) that are relevant to wildlife habitat and riparian areas. Among these initiatives are the Wildlife Habitat Incentive Program (WHIP), the Environmental Quality Incentive Program (EQIP), the Conservation Resource Program (CRP), and the Wetlands Reserve Program (WRP). WHIP works with public and private organizations to improve riparian and wetland areas, as well as in upland improvement projects (U.S. Department of Agriculture, Natural Resource Conservation Service: http://www.nrcs.usda.gov/). EQIP works with landowners on soil, water, and related concerns.
2.6.12 . Waterbodies with Water Quality Impairments
Waters are declared .impaired. when they fail to support their designated uses after full implementation of the National Pollution Discharge Elimination System permits and "best management practices." Under the Clean Water Act, every state must update its .303(d). list of impaired waters every two years after reviewing "all readily available data and information." A listing of information on waterbodies in the WBHB that are considered quality impaired under section 303(d) of the Clean Water Act is available online at http://deq.state.wy.us.
2.6.13 . Summary of Consumptive Uses
Evaporation
In the WBHB.s dry climate, evaporation losses are significant, particularly from the larger reservoirs. The Wind/Bighorn River traverses the lowest portions of the basins, where warmer weather increases evaporation rates. Evaporative losses are not specifically mentioned in the Yellowstone River Compact between Wyoming and Montana, but are accounted for in the gage readings used to calculate each state.s allocation (Lowry, 2002.). Refer to Section 2.7 - Water Use From Storage, for evaporative losses from storage.
Direct Wildlife Consumption
There is no easy way to quantitatively estimate the amount of water required by wildlife in the WBHB. Differences in species, terrain, food sources, weather and climate are all relevant to the water needs of wildlife. Moose, for instance, are far more dependent on riparian areas than are pronghorns. Waterfowl and upland game birds have differing needs. The more moisture in the feed sources, the less water most wildlife consume directly. In times of drought, most herbivores require more drinking water.
Pat Tyrell, in a review of the topic in the Green River Basin plan, noted that estimates of wildlife use of surface water in that basin ranged from 100 to 400 acre-feet per year. Tyrell concludes that .while some uncertainty exists in the exact consumption value, its probable magnitude is not so high as to materially affect the water plan. (Tyrell, 2000). This conclusion seems reasonable, since beef cattle, on average, consume approximately 8 to 10 gallons of water per day, and sheep about one gallon (Wyoming Agricultural Statistics Service, 2001). The consumptive water needs of wildlife would be much lower than those of domestic livestock. If the WBHB were to double the estimated amount of water consumed by wildlife in the Green River Basin, it would be 200 to 800 acre feet . still not a large amount. It seems likely that Tyrell.s estimate is conservative. If there were 250,000 animals in the WBHB each drinking a gallon a day the total consumption would only be .76 acre feet per day, or 280 acre feet per year. Distribution of water on ranges is probably a more significant problem than quantity. Forage is not as fully utilized by livestock or wildlife when it is too far from water.
2.6.14 . Recreational Demands
Water is important in both outdoor and indoor recreation. Although in terms of volume the water demand for .indoor. (in the present context meaning such facilities as swimming pools and water parks) is not high, such facilities are significant socially and can be economic assets. School, municipal, private, and commercial swimming facilities exist in most of the WBHB.s larger towns. The water demand of such facilities is for the most part captured as part of municipal water demand.
Outdoor recreation is an integral part of the WBHB.s culture. The larger reservoirs, in particular Buffalo Bill, Boysen, and Bighorn, are major water-based recreation destinations. Fishing, boating, and picnicking are popular pastimes at these reservoirs. The drainages of the Shoshone, the Clarks Fork, the upper Wind, and the Bighorn all attract anglers, as do many reaches of the rivers themselves. Rafting and boating is carried on in all the rivers, with kayaking and whitewater rafting available in canyon reaches of the rivers. Water is an important amenity in all the state parks in the WBHB. In addition to public waters, there are a few small private fishing reservoirs.
There are about 95 river miles along the Wind/Bighorn River from Boysen Dam to Bighorn Canyon. A 1986 Bureau of Land Management (BLM) report, prepared with the cooperation of the WGFC, estimated that most recreationists on this reach of the river were residents, with heavy use areas receiving around 1200 visitor days per year, medium use areas averaging perhaps 600 to 800 user days, and low use areas fewer than 500. The heavier use areas were mostly around the larger towns situated on the river . Thermopolis, Worland, Basin, Greybull and Lovell. Water quality is best through the southern reach of the river, near Thermopolis. In this vicinity the stream is fairly rapid, seldom freezes over, the water is usually clear, and there are good populations of fish and waterfowl. The BLM report noted that on the river there are limited opportunities for river recreation and flatboating (U.S. Department of the Interior, BLM, 1986).
2.6.15 . State Parks
There are five state parks in the WBHB: Medicine Lodge in Big Horn County, Hot Springs in Hot Springs County, Sinks Canyon and Boysen in Fremont County, and Buffalo Bill in Park County. The WBHB.s state parks are estimated to attract more than a million visitor-days per year as calculated from Wyoming State Parks and Historic Sites Fee Program, Appendix C, .Visitation Statistics,. 2001. State Parks and Historical Sites defines .Visitors. as .the total number of persons entering a park or site to carry on one or more recreation activities, . while .a visitor day is 12 visitor hours that may be accumulated continuously or simultaneously by one or more visitors..
Water is an attraction at all of these parks. Boysen and Buffalo Bill are located at large reservoirs, Hot Springs (which hosts the most visitors) and Sinks Canyon State Parks are located at unique water resources, and Medicine Lodge Creek adds significantly to the attractiveness of its namesake park. In addition to the state parks, there is a state-designated historical site at Legend Rock in Hot Springs County.
2.6.16 . Fishing
Fishing is probably the WBHB.s major water-based outdoor recreational activity, although pleasure boating and waterfowl hunting are popular also. The major source of data collected on fishing is the WGFC.s license sales and creel censuses, but these data provide only a rough indication of fishing pressure. The available quantitative data on fishing are not readily adaptable to individual waters because angler surveys are usually conducted on major waters, in response to specific needs (Annear, June 2002).
In the year 2000, 20,942 resident and 30,372 non-resident licenses were sold in the five counties of the WBHB (Wiley, 2001). A comparison of fishing license sales in 1995 and 2000 indicates that during that period resident license sales dropped by about 8% in the WBHB as a whole, while non-resident sales increased by about 20%. There were about 25% more non-resident licenses than resident sold in 2000. This is a notable change from 1995, when the difference was less than 10%. Only about 5% of non-resident licenses sold are annual permits, however. Again, sales of Wyoming fishing licenses in 2001 declined by more than eight percent compared to sales in 2000 (American Sportfishing Assn). It seems clear that fewer than half of the WBHB.s residents are recreational fishermen.
The majority of fishing licenses sold in the WBHB, both resident and non-resident, are sold in Fremont and Park Counties (Wiley, 2001). This suggests that the drainages of the upper Wind and the Shoshone see the heaviest stream fishing pressure. The Clarks Fork is another important fishery, and there are many popular streams and mountain lakes on the west side of the Bighorn Mountains. Boysen and Buffalo Bill Reservoirs are particularly popular fishing venues. Wind River Canyon itself is on the Wind River Indian Reservation (WRIR), and both state and reservation licenses are required. Fishing pressure in the canyon is probably decreased by this requirement, but the stretch remains a fairly popular destination. Several miles of the Bighorn River below (north) of Wind River Canyon, in the Thermopolis area, provide good fishing as well.
Among the reservoirs, Boysen and Buffalo Bill are particularly important fisheries. Other important reservoirs for fishing (and other water sports) are Deaver Reservoir, Lake Cameahwait, Newton Lakes, Ocean Lake, and Pilot Butte and Ralston Reservoirs. Many of the fishing streams are in the mountains, on the national forests (Bighorn and Shoshone), or in Yellowstone National Park. Fishing pressure varies with ease of access, and high mountain lakes and streams are quite fragile ecologically. Both the national forests include sizable wilderness areas. The Wyoming Game and Fish Commission (WGFC) manages wildlife and fisheries on the national forests, but not in the national park. About half of each national forest is within the Wind/Bighorn drainage.
The WGFC manages fisheries with the objectives of providing angling diversity, sustaining enough catchable fish, and establishing and maintaining areas which boast trophy fish, wild fish, and unique fish. Threats to fisheries include habitat losses due to erosion (both natural and man-made), inadequate instream flow, barriers to fish migration and spawning (such as dams and dewatered channels), fish losses due to diversions or non-point pollution, and competition to native species from non-native species or algae which produce oxygen deficits.
The WGFC has established a .walk-in. fishing program to enable public access to waters surrounded by private lands. Landowners cooperate with the WGFC to allow such access. There are 20 such areas below (north of) Boysen Reservoir and below WRIR boundaries. This program provides access points to fishing on the Bighorn, Greybull, and Shoshone Rivers, and Nowood and Paintrock Creeks. In the Wind River area the WGFC has not been as successful in securing walk-in access, although it has secured a fishing easement near Dubois (Deromedi, 2002).
Anticipating continuing growth in demand for stream fishing venues, the WGFC notes that ensuring an adequate supply of good fishing spots .is dependent on maintaining adequate streamflows in existing good segments and restoring streamflows in streams that have the potential to support good recreational fisheries.. (Annear, 2002). An available opportunity for public input in fisheries management and development lies in helping to identify potential fisheries, and suggesting ways to improve or maintain them. Opportunities to maintain adequate water flows to support all uses, wildlife and human, do exist. Cooperative water use agreements can often be worked out, and conservation of water may enable streamflows in some segments to be maintained or even increased.
2.6.17 . Waterfowl
Wyoming straddles two migratory waterfowl flyways, the Pacific (west of the Continental Divide) and the Central. All of the WBHB is east of the Continental Divide, within the Central flyway. Hunting of migratory waterfowl is largely controlled by guidelines issued by the U.S. Fish & Wildlife Service.
The WBHB is divided by the WGFC into two waterfowl management areas. The Wind River Basin (essentially Fremont County) is area 4C, while the Bighorn River Basin (the other four counties) is designated 4A. The vast majority of waterfowl hunting in Wyoming is for ducks and geese, although coot, snipe, rail and sandhill crane are also hunted, but in the WBHB ducks and geese account for nearly all the waterfowl harvest.
While data on specific locations are unavailable, the Game and Fish Commission estimated that in 2000, the WBHB duck hunter days totaled 13,395, with a harvest of 19,333 ducks. The WBHB is second only to the North Platte drainage in volume of duck hunting in Wyoming. Goose hunter-days in the WBHB were estimated to be 7,730, with a harvest of 5,331 birds. The heaviest duck and goose hunting occurs after the middle of November, extending into early February for geese.
Ducks Unlimited, which has over 4,000 members in Wyoming, reports that during the 1999-2000 hunting season 11,062 federal duck stamps were sold in the state. The WGFC reports that in the year 2000 a total of 36,208 bird licenses were sold in the state. From 1995 through 2000 an average of 24,647 geese and 54,187 ducks were harvested per year. License sales for both resident and non-resident bird licenses have increased sharply over the past five years, and the harvest trend is upward (Wyoming Game and Fish Department, 2001).
Maintenance and improvement of existing wetlands and riparian areas, and establishment of new ones will be helpful in maintaining and improving habitat for waterfowl. This is a good example of the interrelationship of recreational and environmental considerations. Agricultural cropping patterns are also a factor in waterfowl populations.
2.6.18 . Adequacy of Present Recreational Resources
It seems likely that most WBHB recreational resources are lightly used relative to national standards. The trend in resident fishing permit sales in the WBHB has been slightly down, which might be expected given the aging population and the out-migration of many younger Wyomingites. There seems at the same time to be a trend toward higher sales of non-resident licenses, although only about five percent of these are annual permits. However, the WGFC "anticipates continuing increases in demand for stream and river angling," and notes that satisfying this demand "is dependent on maintaining adequate streamflows in existing good segments and restoring streamflows in streams that have the potential to support good recreational fisheries." The Department notes that public help in identifying where these segments are or might be and hints on how such waters might be better managed "is an important opportunity for participants in the water planning process" (Annear, 2002).
Other strategies that can be useful in increasing the supply of fishing opportunities in the WBHB are designated .catch and release. areas, increased planting of catchable fish and/or fry, and the manipulation of size limits and catch limits.
A number of projects to diversify and add to water-based recreational opportunities have been suggested. Among them are improved signage to identify waterbodies, improved access for users, provision of more handicap access, and development and promotion of eco-tourism at water-based recreation areas. Whitewater recreation parks might be established as well. Boating and skiing, of course, are also water-based activities, as are snowmobiling, sled dogging, skiing, and the like. There is potential to increase the number of venues and of participants in such activities (Hansen, 2002). Most of these activities, of course, are non-consumptive. However, funding mechanisms and project sponsors are not clear. Other projects can be designed to provide recreational opportunities as multiple-use components.
2.7 . Water Use From Storage
2.7.1 . Major Reservoir Information
The WBHB contains several large reservoirs used for various purposes including storage for irrigation, municipal, industrial, recreation, fish propagation, and flood control. Various federal, tribal, and private interests own the reservoirs described in this report. For purposes of the WBHB Water Plan, reservoirs having storage capacity of 500 acre feet or greater are the focus of this analysis. Table 2.7-1 identifies the reservoirs that are considered in the surface water assessment presented as part of the WBHB Plan.
2.7.2 . Reservoir Descriptions
A detailed description of each reservoir can be found in Chapter 2, Section 9 of the Technical Memorandum Environmental and Recreational Use. Table 2.7-1 shows a brief description of each reservoir with greater than 500 acre-feet of storage capacity.
2.7.3 . Evaporation
Evaporation from reservoirs is a consumptive use. These reservoirs include: Boysen, completed in 1952 (water storage, however, was initiated in October, 1951), Bighorn Lake, completed in 1966, and the entire series of reservoirs developed in the Cottonwood Drain (e.g. Lake Cameahwait and Middle Cottonwood Reservoir). Figure 2.7-1 shows the locations of the reservoirs in the WBHB.
To compute evaporation losses of each reservoir with a storage capacity of greater than 500 acre-feet, the Wyoming Climate Atlas was utilized. Table 2.7-2 of this text provides a map of mean annual lake evaporation adapted from Lewis, 1978. In order to distribute annual evaporative losses on a monthly basis, monthly evaporation data were obtained from the US Bureau of Reclamation.s web site for the Buffalo Bill and Boysen Reservoirs. This data was combined with the estimated monthly evaporation data for the City of Lander provided in Martner, 1986 to develop an average monthly distribution.
Evaporation losses for each reservoir were estimated by plotting their location on the map of annual evaporation, determining an annual loss rate through means of linear interpolation, and establishing the monthly evaporative loss based on the derived distribution described above. The above process provided a reasonable estimate of the gross evaporative loss.
To determine net evaporative losses, reservoir locations were plotted on a map of average annual precipitation, Lowham, 1988. Annual precipitation depth for each reservoir was determined by linear extrapolation. A monthly precipitation distribution was developed by obtaining average monthly precipitation depths over a 30-year period, for 12 weather stations scattered across the project area. Monthly precipitation depth is determined by using the derived distribution to determine the estimated annual precipitation depths for each reservoir.
Data describing the gross evaporation and precipitation as well as any available data on average End-of-Month (EOM) reservoir storage are found in the Technical Memorandum, Chapter 2, Section 10, Water Use From Storage. Table 2.7-2 presents an estimate of the maximum net evaporation loss for each reservoir considered in the Wind/Bighorn River surface water model. Calculations for net evaporative loss are conservative as the surface area considered is equal to the high water line.
Table 2.7-1 . Reservoirs with Greater than 500 ac-ft of Storage Capacity
| Reservoir Name | Source | Use | Priority Date | Permitted (ac-ft) |
| Albert Wardell Reservoir | Wardell Draw | Irr-stk | 12/24/1954 | 294.8 |
| Albert Wardell Reservoir Enlg. | Wardell Draw | Irr-stk | 11/21/1961 | 265.0 |
| Adelaide Reservoir | Adelaide Creek | Irr. | 8/8/1910 | 4,763.5 |
| Anchor Reservoir | S.F. Owl Creek | Irr. | 12/18/1933 | 17,412.0 |
| Beck Lake | S.F. Shoshone River | Irr-dom | 7/24/1908 | 623.0 |
| Beck Lake Enlg. | S.F. Shoshone River | Irr-dom | 8/26/1969 | 15.0 |
| Bighorn Lake | Bighorn River | Irr-rec | Montana Right | 1,328,360.0 |
| Boysen Reservoir | Bighorn River | Dom-irr-mun-pwr-ind | 10/22/1945 | 757,851.0 |
| Buffalo Bill Reservoir | Bighorn River | Dom-irr-mun-pwr-ind | 3/5/1904 | 644,540.0 |
| Bull Lake Reservoir | Bull Lake Creek | Dom-irr-mfg-pwr | 12/26/1906 | 151,951.0 |
| Cameahwait Reservoir | Cottonwood Drain Draw | Fish-wildlife-irr-stk | 1/29/1973 | 6,683.1 |
| Christina Reservoir | Little Popo Agie River | Mine-mill-irr-stk-dom | 9/1888 | 3,860.0 |
| Deaver Reservoir | Short Draw | Fish-irr-mun-rec | 6/18/1991 | 719.5 |
| Debatable Reservoir | Willow Creek | Irr. | 9/16/1910 | 582.3 |
| Enterprise Reservoir | Roaring Fork | Irr-dom-stk | 8/30/1933 | 1,697.5 |
| Fairview Reservoir | Manny Draw | Irr-dom-stk | 12/7/1934 | 1,411.0 |
| Foster No. 1 Reservoir | Sage Creek | Irr. | 11/2/1935 | 573.1 |
| Greybull Valley Reservoir | Greybull River | Irr-rc | 11/14/1989 | 33,169.0 |
| Jack Pot Reservoir | Alkali Creek | Irr-RR | 1/4/1911 | 772.0 |
| Lake Creek Reservoir | Lake Creek | Irr. | 10/1/1935 | 1.,373.0 |
| Leavitt Reservoir | Beaver Creek | Irr. | 4/9/1954 | 643.5 |
| Louis Lake Reservoir | Louis Creek | Pwr | 1/6/1926 | 8,013.8 |
| Luce Reservoir | Paint Creek | Irr. | 8/7/1905 | 2.128.8 |
| Middle Cottonwood Res. | Cottonwood Drain Draw | Irr-stk-fish-wildlife | 1/29/1973 | 612.2 |
| Newton Reservoir | Trail Creek | Irr. | 2/7/1898 | 4,225.2 |
| Perkins & Kinney Reservoir | South Sage Creek | Irr. | 10/4/1893 | 746.3 |
| Pilot Butte Reservoir | Big Wind River | Irr-pwr | 8/8/1906 | 34,600.0 |
| Prairie Reservoir | Dry Muddy Creek | Irr. | 10/16/1911 | 578.0 |
| Sage Creek Reservoir | Sage Creek | Irr. | 1228/1901 | 2,785.0 |
| Shell Creek Reservoir | Shell Creek | Irr. | 10/20/1911 | 1,949.0 |
| Shoshone Reservoir | Shoshone Creek | Irr. | 7/15/1937 | 9,740.4 |
| Teapot Reservoir | Dry Creek | Irr. | 9/9/1916 | 1,577.5 |
| Ten Sleep Reservoir | Ten Sleep Creek | Irr-dom-fire-rec-stk | 1/31/1938 | 3,508.9 |
| Thomas Reservoir | North Rawhide Creek | Irr. | 9/25/1900 | 863.5 |
| Thompson No. 1 Reservoir | Owl Creek | Irr. | 12/4/1907 | 920.2 |
Table 2.7-2 Annual Maximum Net Evaporative Loss
| Reservoir Name | Surface Area (acres) | Evap. (in) | Precip. (in) | Net Evap. (ac-ft) |
| Albert Wardell Reservoir | 66.2 | 42.6 | 8.0 | 190.7 |
| Adelaide Reservoir | 14.5 | 45.0 | 17.0 | 33.8 |
| Anchor Reservoir | 437.0 | 40.0 | 15.2 | 903.1 |
| Beck Lake | 110.0 | 40.5 | 10.0 | 279.6 |
| Bighorn Lake | 17,279.0 | 42.0 | 10.0 | 46,077.3 |
| Boysen Reservoir | 19,660.0 | 40.8 | 9.0 | 52,099.0 |
| Buffalo Bill Reservoir | 8,315.0 | 40.0 | 14.0 | 18,015.8 |
| Bull Lake Reservoir | 3,186.0 | 35.0 | 10.0 | 6,637.5 |
| Cameahwait Reservoir | 414.4 | 40.8 | 8.5 | 1,115.4 |
| Christina Reservoir | 350.0 | 36.1 | 19.0 | 498.8 |
| Deaver Reservoir | 80.0 | 41.7 | 6.0 | 238.0 |
| Debatable Reservoir | 86.0 | 39.0 | 13.0 | 186.4 |
| Enterprise Reservoir | 134.1 | 37.7 | 16.8 | 233.6 |
| Fairview Reservoir | 140.7 | 42.6 | 8.5 | 399.8 |
| Foster No. 1 Reservoir | 140.7 | 40.0 | 22.3 | 207.5 |
| Greybull Valley Reservoir | 691.1 | 41.5 | 9.5 | 1,842.9 |
| Jack Pot Reservoir | 98.1 | 45.0 | 10.0 | 286.2 |
| Lake Creek Reservoir | 59.1 | 40.0 | 16.0 | 118.1 |
| Leavitt Reservoir | 48.8 | 43.9 | 10.0 | 137.9 |
| Louis Lake Reservoir | 282.2 | 37.7 | 16.8 | 491.5 |
| Luce Reservoir | 62.0 | 39.5 | 18.4 | 109.0 |
| Middle Cottonwood Res. | 116.6 | 40.5 | 8.6 | 310.0 |
| Newton Reservoir | 150.8 | 40.0 | 12.0 | 351.9 |
| Perkins & Kinney Reservoir | 44.5 | 40.0 | 18.0 | 82.0 |
| Pilot Butte Reservoir | 950.0 | 37.2 | 9.2 | 2,216.7 |
| Prairie Reservoir | 81.5 | 38.5 | 9.5 | 197.0 |
| Sage Creek Reservoir | 226.0 | 40.9 | 12.0 | 544.3 |
| Shell Creek Reservoir | 113.5 | 45.0 | 17.0 | 264.8 |
| Shoshone Reservoir | 502.8 | 36.9 | 20.0 | 708.1 |
| Teapot Reservoir | 185.0 | 35.0 | 9.8 | 388.5 |
| Ten Sleep Reservoir | 280.6 | 45.0 | 15.8 | 682.8 |
| Thomas Reservoir | 45.0 | 40.0 | 21.7 | 68.6 |
| Thompson No. 1 Reservoir | 49.5 | 41.2 | 11.3 | 123.3 |
| Sunshine Reservoir | 1,158.5 | 40.0 | 15.4 | 2,374.9 |
| Wiley Reservoir | 67.5 | 40.8 | 13.3 | 154.7 |
| Worthen Meadows Res. | 92.0 | 37.7 | 19.2 | 141.8 |
2.8 . Wind River Range Glaciers
2.8.1 . Introduction
The Wind River Range of Wyoming is the headwaters of the three major drainage systems in the United States, the Wind-Bighorn-Yellowstone-Missouri-Mississippi, Snake-Columbia, and Green-Colorado drainages. The range is also home to a total of 63 glaciers, covering 17 square miles, greater than the total of all other glaciers in the American Rockies at 12 square miles. Seven of the ten largest glaciers in the continental United States are located in the Wind River Range. Of the total area of glaciers in the Wind River Range, by area, 77% are located in the Wind River drainages, with the remainder draining to the Green and Snake Rivers (Marston, et. al., 1991). Based upon a literature search of available documents relating to the glaciers in the Wind River Range, the glaciers have been retreating during recent times. Glaciers have been compared to natural reservoirs, which store water in the form of ice during cool periods both on an annual and long-term climatological scale, and release water during warmer periods. The melt water from the glaciers contributes to the flow in the Wind River, and is thought to be important during late summer and early fall to supplement flows in the Wind River needed for irrigation and fisheries, and for the fulfillment of interstate water compacts. This report summarizes the results of Wind River glacier literature review, and addresses three potential scenarios for future impacts to the Wind River due to glacial changes.
2.8.2 . Glacial Recession and Paleoclimatic Research
The earliest references to the Wind River glaciers are found dating back to 1851, with formal studies as early as 1878. Most of the studies indicate that the glaciers have been steadily retreating since the 1850.s, with the exception of Wentworth and Delo, (1931), who reported that Dinwoody Glacier had readvanced by 1930 to the furthest terminus of the late Neoglacial period. Renewed retreat occurred during the 1930.s, slowing in the 1940.s with little or no retreat during the late 1940.s, then continuing to retreat from the 1950.s to the present.
Very little research was performed on the glaciers from 1960 until 1988. From 1988 to the present there has been renewed interest in the glaciers as sources of paleoclimatic and environmental data. Researchers estimate that the glaciers may disappear within 20 years if retreat continues to occur at the rates observed during this past century. This belief has contributed to a sense of urgency among the scientists who wish to obtain ice cores for research purposes before the glaciers melt completely. (Schuster, Naftz, et. al., 2000).
Ice cores from Upper Fremont Glacier were analyzed by the USGS using data from electrical conductivity measurements (ECM), oxygen isotope ratios, concentrations of elements including chlorine, sulfur, mercury, and radioactive tritium, and Carbon 14 dating of a grasshopper leg belonging to an extinct species found in ice core near the base of the glacier. The data was then compared with known events such as volcanic eruptions, periods of nuclear testing, and other natural and anthropogenic events which could have left a chemical signature in the ice. A combination of these time indicators was used to refine the chronological time line of the ice core. The data for Upper Fremont Glacier indicates that the glacier was formed during a cooling period known as the Little Ice Age, which occurred from approximately 1740 to 1845 A.D. The end of the Little Ice Age appears to have been quite abrupt, occurring within a span of less than 10 years. Prior to the Little Ice Age, tree ring records show evidence of a warming period, which extended from approximately 1650 to 1740 (Naftz, et. al., 1996, 2002 and Schuster, et. al., 2000).
2.8.3 . Potential Watershed Impacts of Glaciers
The total annual runoff from glaciers in the Wind River Range is estimated to be approximately 56,756 acre feet (70 x 106 m3) for the annual melting period of July through October. Assuming equitable distribution of flows based upon aerial location, 77% of glacial runoff would enter Wind River drainages, or 43,783 acre feet (54 x 106 m3) on an annual basis. This flow represents approximately 8% of the total flow in the Wind River during the same period (Marston, Pochop, et. al., 1989). The two primary creeks by which glacial meltwater is conveyed to the Wind River are Bull Lake Creek and Dinwoody Creek. Dinwoody Creek, which is fed by both Gannett and Dinwoody Glaciers, drains more glacial area than any other single headwater creek in the continental United States (Wentworth and Delo, 1931). The following table summarizes the results of limited streamflow gaging efforts on Dinwoody Creek in July, 1988 by Pochop, Marston, et. al., and extrapolation of that data by comparison with flow measurements made in the Cascade Mountains. Dinwoody Creek is estimated to convey 25% of the total ice-melt contribution to the Wind River.
Table 2.8-1
ESTIMATED CONTRIBUTION OF DINWOODY AND GANNETT GLACIERS
TO DINWOODY CREEK FLOWS
| MONTH | ESTIMATED ICE MELT (ACRE-FT) | DINWOODY CREEK FLOW (ACRE-FT) | % OF FLOW FROM ICE MELT |
| JUNE | 691 | 27790 | 3 |
| JULY | 4080 | 30642 | 13 |
| AUGUST | 3268 | 19990 | 16 |
| SEPTEMBER | 2117 | 7929 | 27 |
| OCTOBER | 812 | 2527 | 32 |
The above estimates (Marston, Pochop, et. al., 1989) show the importance of glacial meltwater to total flows during the late season flows (27% and 32% of Dinwoody Creek during September and October, respectively). Similar estimates have not been made on other glacial fed creeks in the Wind River Range. Three scenarios are discussed regarding the potential impacts glacial change may have on flows in the Wind River.
Scenario 1: No Significant Climate Change
Under scenario 1, the assumption would be that the climate will remain fairly stable within observed average ranges, with brief periods of glacial accumulation followed by periods of drought and glacial melting on a decadal scale. One example of this type of behavior would be the brief glacial advance from 1920 to 1935 at Dinwoody Glacier, replenishing water reserves, followed by a melting period. Alternatively, snowfall contributing to glacial accumulation could roughly equal glacial ablation, resulting in continued release of melt without an overall net loss in glacial volume. The effects of glacial recession or advance would remain relatively constant, and the overall streamflows would not vary significantly. The overall impact would be minimal to irrigators and other stream uses.
Scenario 2: Drought Conditions Persist
The assumption made by Marston, et. al., and Naftz, et. al. regarding the life span of the glaciers was that the current warm / dry climate trends will continue without ceasing, and cause the disappearance of the glaciers within 20 years. If this occurs, flow to the Wind River could be reduced by approximately 8%, creating or exacerbating shortages for irrigators and instream flow demands. Under this scenario, the effects are predicted to be most noticeable during late summer and early fall, when runoff from snowmelt and rains is minimal and water use is high. If these climate predictions are correct, the loss of glacial input to Wind River flows will not be the only reduction in flow, as snow pack and annual precipitation will be expected to fall below observed averages, further reducing flows.
Scenario 3: Return of Cool / Wet Period
Review of the dates of cooling periods and warming trends presented as a result of ice core and tree ring data from the Wind River Range indicates that warming and cooling cycles are natural phenomena. Geologists estimate that there have been seven major continental glacial episodes in Earth.s history, punctuated by many smaller events such as the Little Ice Age. Five different periods of glacial advance and retreat have been documented in the Wind River Range. Glacial ice core and tree ring data indicates a warming trend of approximately 90 years from 1650 to 1740, a 105 year cooling period known as the Little Ice Age from 1740 to 1845, another warming trend for 75 years extending from 1845 to 1920 followed by a brief cooling trend from 1920 to 1935, with 67 years of warming from 1935 to the present. If an average of these cycle lengths is taken as 70 years, it would not be unreasonable to predict that a new cooling episode may occur in the near future. Paleoclimatological data suggests that the shift between warm and cool periods may be quite abrupt, and the scale of such an event may be relatively large, such as the Little Ice Age, or small such as the brief advance of Dinwoody Glacier in the 1920.s and 1930.s. For an extended planning period of 50 years, the question would be the timing of such an event. If the cooling period were to occur within the next 15 to 20 years, before the glaciers melt completely, the glaciers would be replenished for future melt contributions to flows in the Wind River. If the current warming cycle continues for a longer period of time, the available flows would be diminished, much like Scenario 2 above, until conditions change. Jan Curtis, the Wyoming State Climatologist, indicates that if the current pattern of drought-wet years continues, increasing annual precipitation and resulting increases in glacial mass should occur over the next twenty years.
2.8.4 . Summary
The meltwater from glaciers in the Wind River Range contributes to flow in the Wind River. The glaciers have been observed to be receding in recent decades, and are estimated by some to be completely gone in 20 years if current weather trends continue. If this were to occur, flows in the Wind River could be diminished by as much as 8%, impacting irrigators, instream flow demands, and interstate compacts. A review of ice core records, tree ring data, and historical temperature and precipitation data indicates that the climate has a cyclic nature, with alternating cool/wet and warm/dry periods. The impact of climate on the glaciers and subsequently the Wind River water users will depend on the timing of the next cool/wet period. In the event that the current dry period continues for an extended period of time, decreased quantities of base flow in the Wind River will exacerbate shortages caused by low precipitation and snowpack. However, if cool/wet weather patterns return, increasing annual precipitation would result in renewed advance of the glaciers, providing storage for future dry periods.
2.9 . Water Conservation
2.9.1 . Overview
Water conservation is the intelligent use, or wise management of water. Water is a finite resource, essential economically, ecologically, and sociologically. Good management considers all these aspects of water use. The original goal of Wyoming.s Water Law was to foster agricultural development and other recognized .beneficial uses.. The definition of beneficial uses includes: .Water rights can be issued to anyone who plans to make beneficial use of the water. Recognized beneficial uses include: irrigation, municipal, industrial, power generation, recreational, stock, domestic, pollution control, instream flows, and miscellaneous. Water right holders are limited to withdrawals necessary for the purpose. For example, irrigators are allowed to divert up to 1 cfs (cubic foot per second) for each 70 acres under irrigation (Wyoming State Engineer.s Office (SEO), 1972).
The SEO, Department of Agriculture, WGFC, WDEQ/LQD, State Forestry, State Parks, and WWDC play important roles in water management at the state level. At the local level, conservation districts, water districts, municipalities, and irrigation organizations are important players. Conservation Districts in the WBHB are headquartered in Cody, Dubois, Thermopolis, Riverton, Meeteetse, Lander, Lovell, Greybull, and Worland. The Wind River Indian Reservation manages water systems on the Reservation.
Given that over 61% of the WBHB is Federal land, the Bureau of Land Management, Bureau of Reclamation, Fish and Wildlife Service, Park Service, and U.S. Department of Agriculture agencies, such as the Forest Service and Natural Resource Conservation Service, manage resources or are programmatically active in virtually all areas of the WBHB. These agencies make assistance, technical and/or financial, available to landowners or associations wishing to develop, improve the use of, or conserve water. This plethora of official and quasi-official agencies, combined with numerous private or public groups representing tourism, agriculture, hunting and fishing, municipalities, industrial, and business, ensures a broad representation of interests in the development of water management policies and decisions.
2.9.2 . Agriculture
In terms of consumptive use, agricultural irrigation using surface water is by far the largest water use in the WBHB (as in Wyoming and the West as a whole). Much of the water used for irrigation returns to the water table and to streams eventually, of course, but irrigation withdrawals remain a far larger consumer of water than municipal, domestic, or industrial uses. Major crops include alfalfa, grass hay, sugar beets, beans, corn, malt barley, and spring grains.
According to BOR Water Conservation Plans, there are approximately 380 miles of major irrigation district canals and ditches using water from Bureau of Reclamation reservoirs. These are primarily dirt conveyances, with potential water losses as high as 40%. Although it has been estimated that up to 75% of irrigation water may return to the system through overland and underground flow, return flows vary according to weather, terrain and soil conditions (Wyoming State Engineer.s Office, 2000).
Most of the WBHB.s agricultural water comes from the Wind/Bighorn drainage, but the Shoshone and Clarks Fork watersheds are also important. Park County leads the WBHB in the value of agricultural sales, and the larger part of that value is produced in the Shoshone drainage. The Greybull/Wood River drainage around Meeteetse, the upper reaches of which are also in Park County, is part of the Bighorn drainage.
Irrigation is essential for most crop production in the WBHB. Major crops are alfalfa, small grains, and sugar beets. Alfalfa production dominates in terms of acreage and value, and also requires the most water. Sugar beets are important in some areas, and also demand considerable water. Spring grains (oats, barley) require less water. (Wyoming Water Resources Center, 1992). Irrigation methods vary in efficiency, with sprinkler irrigation generally considered most efficient, followed by gated pipe and lined ditches. Automated diversion and sprinkling can be helpful in maximizing the efficiency and effectiveness of water application. Center pivot systems cost around $75,000 for a quarter mile system. Pivot systems 9-12 feet high are good for such crops as corn, and can achieve 80-85% efficiency. Micro pivots (about 6' high . too low for corn) cost around $40,000 to $50,000. Gated pipe is the next most efficient system, while flood irrigation runs 40-60% efficiency. While not many such systems are in use in the WBHB, micro-irrigation, drip systems with pressure-flow regulation, are promising in some situations.
Another management option is the burial of gypsum blocks in fields. Gypsum blocks absorb and release water. Measurement of the water in the blocks indicates the amount of moisture in the soil, helping the farmer determine when it is necessary to irrigate. The use of gypsum blocks may save, on average, about one irrigation cycle per season.
Many farmers and ranchers actively seek to diversify income sources, deriving income for the same ground from multiple uses. Some raise corn and after cropping rent the fields for livestock feeding on stalks. After cropping, some plant radishes or turnips to kill nematodes and provide winter graze. A key tactic is re-irrigation after cropping, which encourages late growth for forage. Diversification opportunities include seed production, setting up small feedlots, providing space for commercial beehives, offering space for recreation activities, and, in some areas, selling bentonite.
Other conservation methods include contouring fields to improve water distribution and good maintenance of headgates and ditches. Canals and ditches may need to be lined, since many of the soil types found in the WBHB do not seal well. On rangeland, maintaining, enhancing, or creating riparian areas is beneficial ecologically and practically. Intermittent streams, as well as perennial ones, can be enhanced in terms of both quality and quantity of water, browse, wildlife habitat, and erosion control. Cost sharing programs for conservation purposes are available from several governmental agencies (Galloway, 2001).
2.9.3 . Public Water Systems
Public water systems (PWS) are charged with supplying the populace with safe and adequate supplies of potable water. There are currently 58 active municipal and non-municipal community public water systems in the WBHB. Thirty-six of these are serviced by ground water. These systems serve, collectively, about 59,000 people. Total daily water usage by these systems is about 10.6 million gallons per day, or about 180 gallons per day per person. The source of about 69% of the water used in these systems is surface water.
The EPA lists 174 permitted water systems within the WBHB, serving everything from rest stops and campgrounds to larger municipalities. A community water system, by EPA definition, is .any water system that serves 15 connections or 25 people per day for a minimum of 60 days per year..
Water conservation measures are scarce in Wyoming: of the 188 systems listed in the WWDC.s 2002 report on public water systems, only 29 report having tiered rates as a water conservation measure, 24 have ordinances prohibiting the wasting of water and two report providing subsidies for efficiency. There are 25 entities that have some other form of water conservation measures in place. The average reported percentage of water loss due to leakage is 8.5% ( http://wwdc.state.wy.us).
In the WBHB, according to the 2002 report of the WWDC, thirteen water systems have some form of conservation measure. Wasting ordinances are the most common measure (although used in a minority of systems), while tiered rates are used in three systems. Greybull and Lander report a 10% reduction of water usage due to conservation measures, while Byron reports a 25% reduction. Other systems did not report any reductions.
The primary factor discouraging overuse of water is probably cost to the user. As long as water is accurately metered and appropriately billed, it will generally be used in a reasonably conservative manner. The same logic applies to commercial and industrial water users, especially those which rely on public water systems.
In Wyoming the average cost of treated water is about $1.90 per thousand gallons. One WBHB industry was using over 66,419 gallons per day (gpd) for cooling compressors. The company discovered it could operate on 23,081 gpd by installing a recirculating cooling system. This provided an annual savings of 11 million gallons per year of treated water, lowering water costs as well as the bill for wastewater, which is based on the amount of metered water used (Donnell & Allred, Inc., August 2002).
2.9.4 . Environmental and Recreational Considerations
Non-consumptive uses of water have become increasingly important, for a variety of reasons. Growing societal sensitivity about ecological considerations is an important factor. Additionally, the economic value of recreational opportunities and facilities is well known, tourism is a fundamental component of Wyoming.s economy. It can be enhanced by the development of more and higher-quality water-related recreational opportunities. Such opportunities include the desire of people to enjoy clean, relatively pristine water. Consideration of the ideational and recreational value of water is now a fundamental element in water planning and conservation.
Many visitors to the WBHB come to experience relatively unspoiled natural vistas and high-quality outdoor recreational opportunities. Most of these opportunities, such as fishing, pleasure boating (including white-water rafting and kayaking), swimming, photography, nature viewing, hunting, backpacking and skiing are fundamentally non-consumptive in terms of water usage. Providing infrastructure for these kinds of amenities makes the WBHB a more attractive place to live, and thus may aid economic development efforts.
A list of suggestions for recreational facilities to be considered in water development includes whitewater recreation parks, fishing access at all state highway stream crossings, identification signage at all stream and canal highway and road crossings, handicapped access to fishing and hunting at existing and future impoundments and lakes, canoe and rafting access and portages at existing and future low-head dams, diversions, etc., and development and promotion of eco-tourism components at water projects (Hansen, August, 2001).
Agricultural water uses also have recreational, environmental, and ecological effects. These effects must not be overlooked, although some may seem more ecologically benign than others. In regard to wastewater, for instance, the Greater Yellowstone Coalition notes that: Even though it is a major concern, water .waste. is an imprecise term. Comparing the ecosystem consequences of water delivery systems is more complex than adding and subtracting volumes of water. For example, while pipelines and sprinkler systems may be more efficient in transporting water and delivering it precisely, they are less effective than flood irrigation systems for recharging ground water and enhancing private land for wildlife. Overgrown, unlined irrigation ditches provide habitat and movement corridors, and flooded fields offer nesting habitat to species such as sandhill cranes ( http://www.greateryellowstone.org, 2002). This statement encapsulates the complexity of water management in the WBHB. Water .loss. is a .natural. occurrence, but human actions, such as constructing dams and irrigation systems, add to .natural. evaporation from lakes, ponds, streams and wetlands.
Riparian areas produce forage and habitat for both domestic livestock and wildlife, and are ecologically important in many other ways, including erosion control. Reservoirs maintain conservation pools, generate power, control flooding, ensure streamflows, enable solids to settle out, improve downstream water quality, and provide recreational opportunities. Waterfowl and upland game bird hunting, as well as the well being of wildlife of all sorts, are helped by good water conservation.
2.9.5 . Summary
All these considerations are important elements in the WBHB.s economy, its quality of life, and in water management regimes that may be developed. In the WBHB, as in Wyoming as a whole, focal points for water managers are many. Irrigation, livestock water, industrial, municipal, recreational, ecological, and fish and wildlife uses must all be considered. Whether labeled water conservation, wise use, or multiple use, what is required is careful definition, consideration and balancing of all beneficial uses.
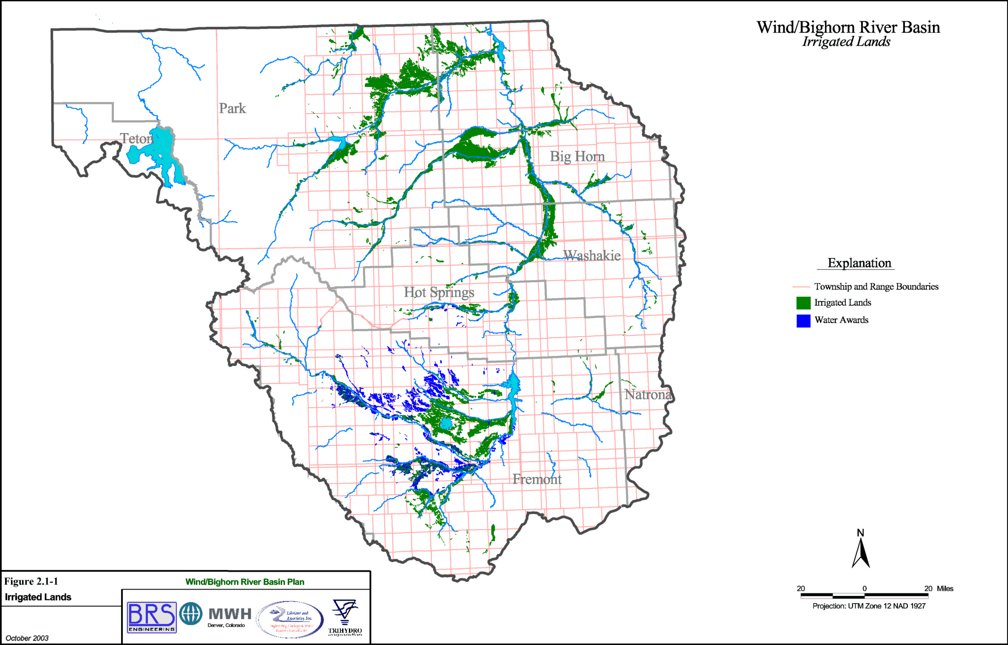
(Click on image to enlarge)

(Click on image to enlarge)
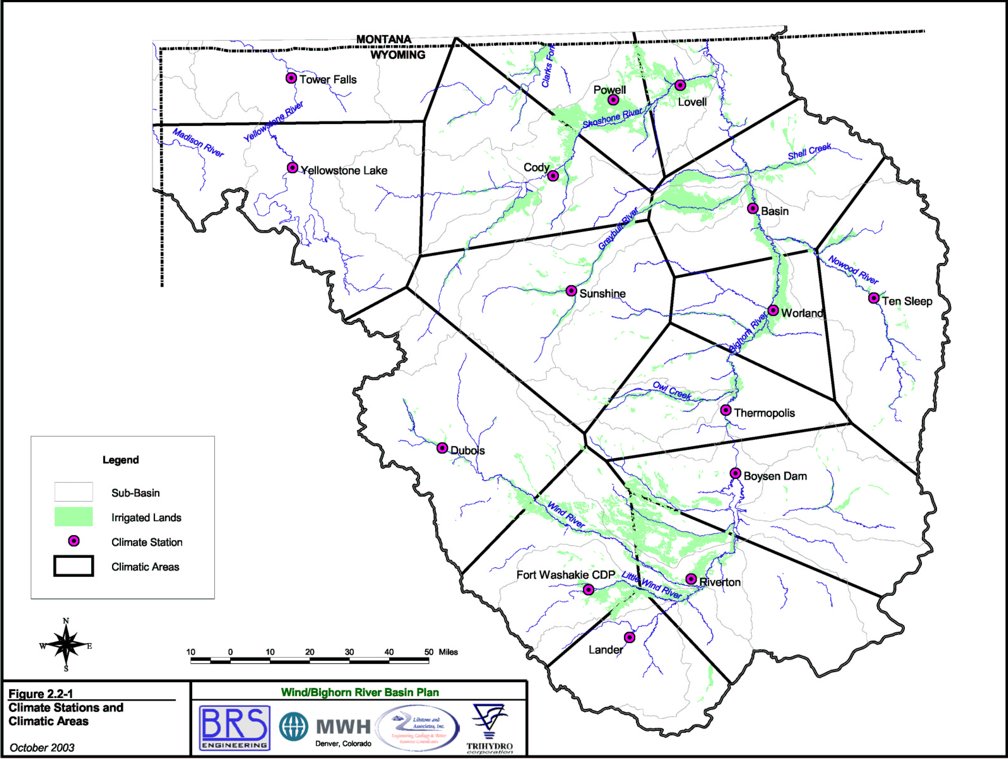
(Click on image to enlarge)
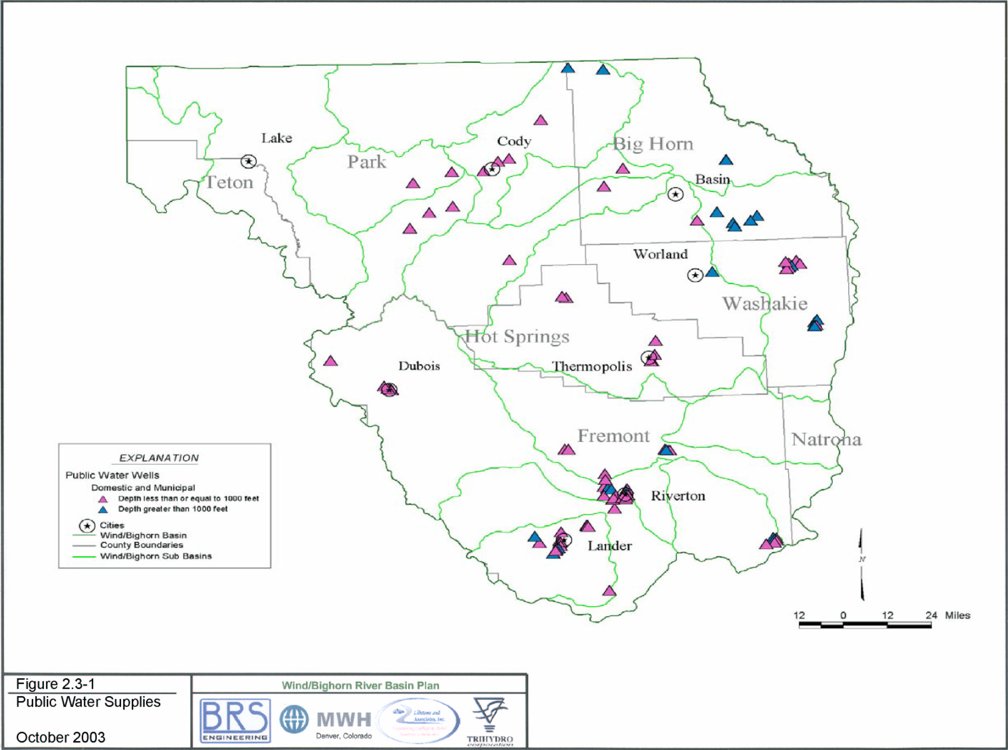
(Click on image to enlarge)
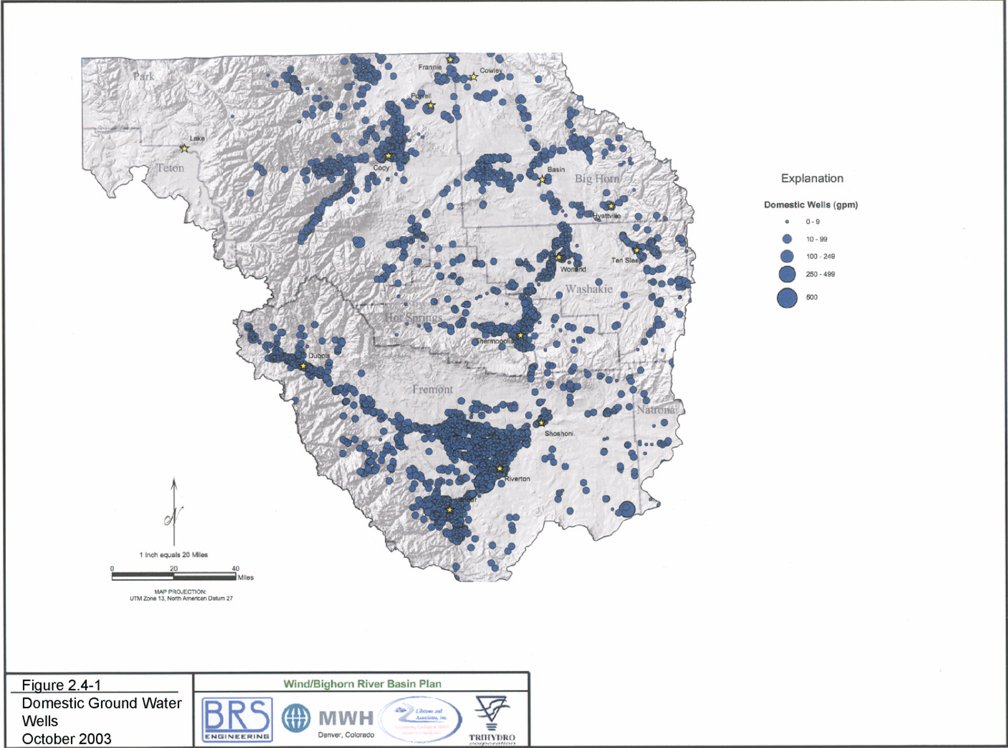
(Click on image to enlarge)
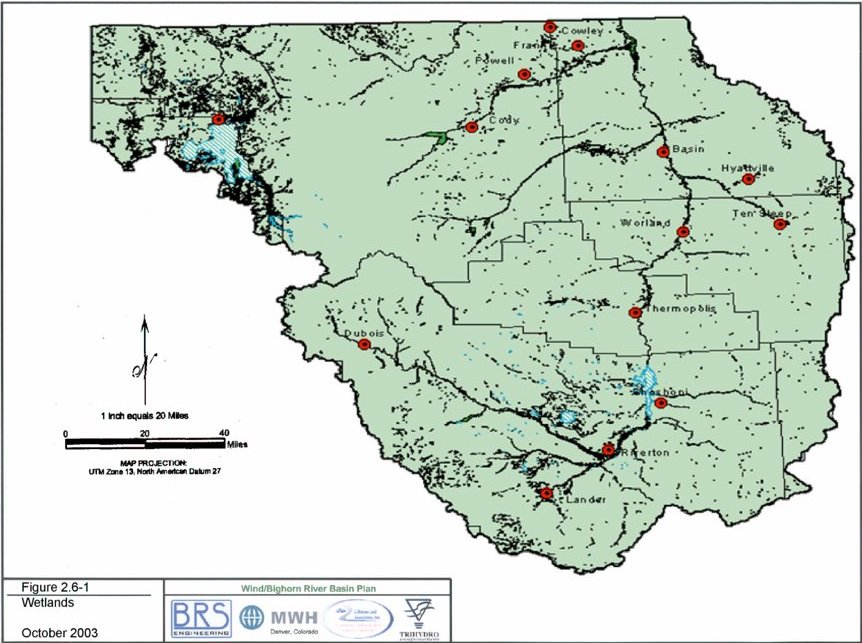
(Click on image to enlarge)
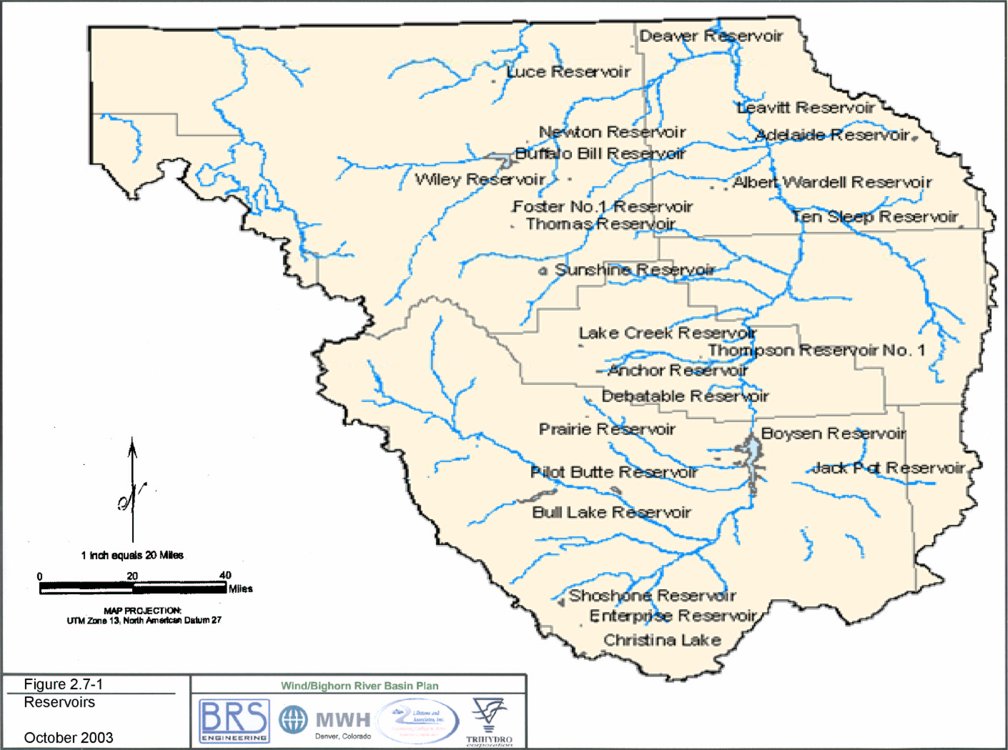
(Click on image to enlarge)