Wyoming State Water Plan
Wyoming State Water Plan
Wyoming Water Development Office
6920 Yellowtail Rd
Cheyenne, WY 82002
Phone: 307-777-7626

Wyoming Water Development Office
6920 Yellowtail Rd
Cheyenne, WY 82002
Phone: 307-777-7626


| SUBJECT: |
Appendix C Task 3A. Surface Water Data Collection and Study Period Selection |
| PREPARED BY: | Bear River Basin Planning Team |
| DATE: | July 27, 2000 |
Introduction
A major purpose of the state river basin plans is to determine the availability of water in each basin for future development. The State Water Planning Process Feasibility Study determined that three 12-month spreadsheet models (one each representing dry-year, normal-year, and wet- year streamflows), constitute an appropriate level of detail for a modeling tool to verify existing uses and evaluate future surface water uses.
The Bear River Basin, because it encompasses parts of three states and is governed by an interstate river commission, has excellent data records. Records of streamflow and diversions are well maintained and extensive. Streamflows used in the three spreadsheets are to be typical of the three different hydrologic conditions, and are to be developed by averaging observed gage flows that occurred during historical dry, normal, and wet years. Accordingly, the objectives of this task were to:
Figure 1 displays a schematic diagram of the Bear River Basin and the location of selected USGS gaging stations.

Figure 1. Bear River Schematic
Study Period Selection
Review of Streamflow and Diversion Records
Ideally, the modeling study period should be representative of long-term hydrologic conditions in the basin. In order to determine this, available streamflow data were compiled from the USGS Water-Data Report, Surface Water. This report lists discontinued and active surface water discharge, water quality, sediment and biological stations. Based on this review, Table 1 was prepared to show the period of record for selected gages within the Bear River Basin.
Table 1
Partial List of USGS Gage Stations in the Bear River Basin within Wyoming, Utah, and Idaho
| USGS Station No. | USGS Station Name | Drainage Area (mi2) | Period of Record1 | |
|---|---|---|---|---|
| From | To | |||
| 10011200 | West Fork Bear River at Whitney Dam, near Oakley, UT | 6.79 | Oct-63 | Sep-86 |
| 10011400 | West Fork Bear River below Deer Creek near Evanston, WY | 52.2 | Oct-73 | Sep-86 |
| 10011500 | Bear River near UT-WY State Line | 172 | Jul-42 | Present |
| 10012000 | Mill Creek at UT-WY State Line | 59 | Oct-49 | Sep-62 |
| 10012500 | Mill Creek near Evanston WY | 60.6 | Oct-46 Oct-56 |
9/48; Sep-57 |
| 10014000 | Bear River above Sulphur Creek near Evanston, WY | 282 | Oct-46 | Sep-56 |
| 10015700 | Sulphur Creek above Reservoir below La Chapelle Cr. near Evanston, WY | 64.2 | Oct-57 | Sep-97 |
| 10015900 | Sulphur Creek below Reservoir, near Evanston, WY | 69.2 | Apr-58 Oct-60 May-96 May-97 |
Sep-59; Oct-92; Sep-96; Sep-97 |
| 10016000 | Suphur Creek near Evanston, WY | 80.5 | Oct-46 | Sep-57 |
| 10016900 | Bear River at Evanston, WY | 443 | Jun-84 | Present (Summer Flows) |
| 10017000 | Yellow Creek near Evanston, WY | 79.2 | Feb-43 Oct-49 |
Sep-45; Sep-78 |
| 10019000 | Bear River at Evanston, WY | 715 | 14-Apr | Sep-56 |
| 10020100 | Bear River above Reservoir near Woodruff, UT | 752 | Oct-61 | Present |
| 10020200 | Woodruff Narrows Reservoir, near Woodruff, UT | 784 (Storage Data) |
1991 | Oct-97 |
| 10020300 | Bear River below Reservoir, near Woodruff, UT | 784 | Oct-61 | Present |
| 10020500 | Bear River near Woodruff, UT | 870 | Oct-42 | Sep-61 |
| 10026500 | Bear River near Randolph, UT | 1616 | Oct-44 | Sep-92 |
| 10027000 | Twin Creek at Sage, WY | 246 | Apr-43 Jul-76 |
Sep-62; Sep-81 |
| 10028500 | Bear River below Pixley Dam, near Cokeville, WY | 2032 | May-66 | Present (Summer Flows) |
| 10032000 | Smiths Fork near Border, WY | 165 | Jun-42 | Present |
| 10032700 | Muddy Creek above Mill Creek near Cokeville, WY | 20.7 | Oct-64 | Sep-69 |
| 1032800 | Mill Cr. near Cokeville, WY | 8.07 | Oct-65 | Sep-69 |
| 10035000 | Smiths Fork at Cokeville, WY | 275 | Jun-42 | Sep-52 |
| 10038000 | Bear River Below Smiths Fork, near Cokeville, WY | 2447 | Oct-54 Sep-97 Sep-98 |
Apr-97; Apr-98; Present |
| 10039500 | Bear River at Border, WY | 2486 | Oct-37 Oct-96 |
Sep-96; Present (season) |
| 10041000 | Thomas Fork near WY-ID State Line | 113 | Oct-49 | Sep-92 |
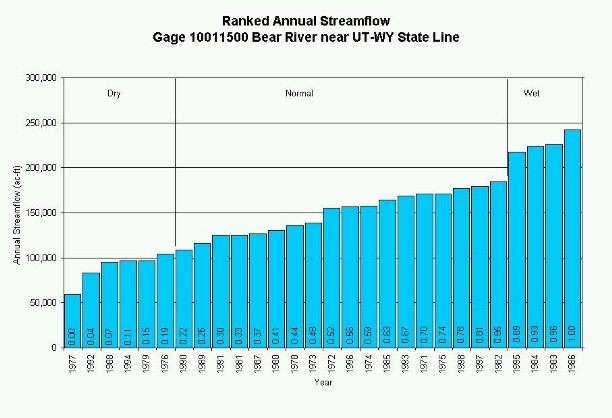
A tentative selection of a study period of 1971 to 1998 was analyzed to assess the stationarity and homogeneity of this period relative to the long-term hydrology of the basin. The starting year of 1971 was selected because a review of the gage records indicates that most major gages were in place by this time. Also, a preference of at least 20 to 30 years of monthly time series data for streamflows was desired to attain adequate statistics of this sample set of data. The ending year of the study period was selected as 1998, the most recent year with verified and published USGS data. To analyze whether this proposed study period is representative, the annual flows at the USGS Gage No. 10011500 (Bear River near UT-WY State Line) and USGS Gage No. 10039500 (Bear River at Border, WY), which represent the Upper and Central Divisions, respectively (Figures 2 and 3), were reviewed. These gages have the longest records of any of the mainstem Bear River Basin gages, and as indicators of long-term versus short-term statistics, are applicable to their respective entire basins. Characteristics of the long-term records and the proposed study period are tabulated in Tables 2 and 3 for the two gages.
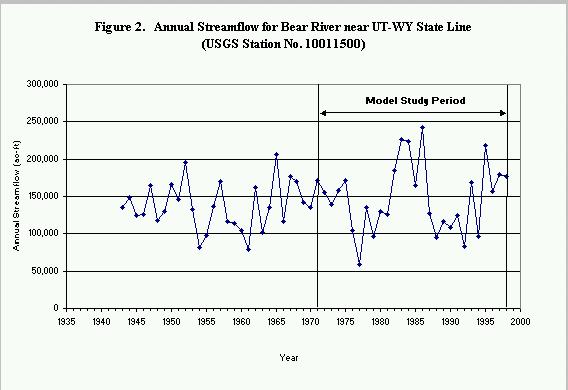
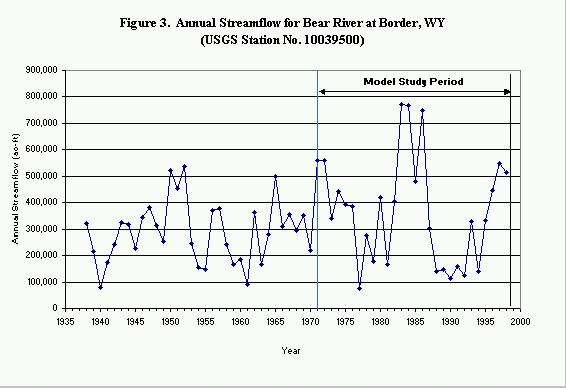
Tables 2 and 3 show that the means of the two periods are very similar at each gage, differing by less than 4% and 13%, respectively. Standard deviations for the shorter period are higher, which is to be expected for a smaller sample size. Most notably, the model study period includes the three highest annual flows of record for each gage (1984, 1983, and 1986). Likewise, the model study period includes the driest year of record for each gage (1977). Figures 2 and 3 show that the model period includes the most enduring drought of record (1986 to 1992) for the upper and lower gages, respectively. Usually the concern is that the shorter period of record does not include extremes found in the longer record, but in this case, extremes of both wet and dry are clearly included in the proposed study period.
Table 2
Characteristics of Annual Flow Series for
10011500 Bear River near Utah-Wyoming State Line
| 1943-1998 Record | 1971-1998 Record | |||||
|---|---|---|---|---|---|---|
| Mean (ac-ft) | 142,409 | 147,787 | ||||
| Standard Deviation | 39,499 | 46,127 | ||||
| Three Highest Years | 1984 | 1983 | 1986 | 1984 | 1983 | 1986 |
| Three Highest Values (ac-ft) | 223,490 | 226,030 | 242,250 | 223,490 | 226,030 | 242,250 |
| Three Lowest Years | 1977 | 1961 | 1954 | 1977 | 1992 | 1988 |
| Three Lowest Values (ac-ft) | 58,990 | 79,310 | 82,220 | 58,990 | 82,950 | 95,230 |
Table 3
Characteristics of Annual Flow Series for
10039500 Bear River at Border, WY
| 1938-1998 Record | 1971-1998 Record | |||||
|---|---|---|---|---|---|---|
| Mean (ac-ft) | 324,564 | 366,837 | ||||
| Standard Deviation | 165,583 | 204,093 | ||||
| Three Highest Years | 1983 | 1984 | 1986 | 1983 | 1984 | 1986 |
| Three Highest Values (ac-ft) | 772,910 | 766,040 | 749,690 | 772,910 | 766,040 | 749,690 |
| Three Lowest Years | 1977 | 1940 | 1961 | 1977 | 1990 | 1992 |
| Three Lowest Values (ac-ft) | 74,820 | 79,290 | 89,380 | 74,820 | 114,150 | 125,290 |
The modeling of river basins and determination of available supply is governed by the existing uses, in addition to the existing water supply. Diversion records for the major diversions in Wyoming and aggregated diversions for those in Utah and Idaho were gathered and reviewed. Records for the Upper Division in Wyoming are comprehensive for 1971 to present, while for the Central Division they are longer. The selection of 1971 as the starting year was based largely on the quality and availability of this record.
Review of Reservoirs
Because a single annual cycle will be used to model each hydrologic condition, the average data developed for input to the model should be derived from an operationally consistent time period that represents present conditions. Since construction or major modification of a reservoir during the study period would influence the downstream gages, reservoir history places significant control on selection of the gages used as input to the model. For this reason, major reservoirs (greater than 10,000 acre-feet) that have been constructed or modified during the past fifty years were reviewed to consider their influence on selection of the study period and the use of gage data in the model, with the following summarized results:
	      Name		      Total Storage Capacity	 Priority Date of
                                                                Final Enlargements
	Sulphur Creek Reservoir		19,800 ac-ft			1986
	Woodruff Narrows Reservoir	57,300 ac-ft			1980
Using the period 1987 to present when both reservoirs were fully operational would severely
limit the hydrologic period with which to determine average hydrologic conditions.
Additionally, since the 1986 enlargement of Sulphur Creek Reservoir was only about 10,000
acre-feet, which is about five percent of the flow in the mainstem below the reservoir, the
impacts of the reservoir were considered to be less important than selecting a longer time period.
The effects of Sulphur Creek Reservoir were accounted for in the spreadsheet model by
calculating a reach gain and/or loss in that section of the river and/or subtracting change of
storage and evaporation losses.
The enlargement of Woodruff Narrows Reservoir in 1980 by about 29,000 acre-feet was 15 % of the flow in the Bear River at the reservoir. In the Woodruff Narrows Reservoir reach defined in the spreadsheet model, the effects of the reservoir are accounted for because there are no other diversions or significant inflows in the reach between the mainstem gages above and below the reservoir.
The inputs to the spreadsheet model will be based on the historical records of upstream gages above any significant man-made impacts. The reach gains and/or losses in downstream reaches will be based on the difference between average historic gage recordings for the different hydrologic conditions. This is explained in greater detail in the Task 3B - Surface Water Spreadsheet Model Development memorandum.
Selected Study Period
The availability of flow and diversion records led the project team to a conclusion that 1971 to 1998 should serve as the study period. This 28-year period is statistically similar to long-term conditions, and includes representative dry, normal, and wet years. Complete records are available for diversions in the Upper Division of the basin beginning in 1971. At this time, 1998 is the latest year for which validated streamflow data are available from the USGS. The effects of the reservoirs on the hydrologic record can be factored into the calculation of reach gains and/or losses and does not significantly affect the choice of study period.
Determination of Basic Hydrologic Data Used in Spreadsheet Model (Modeling Gages)
Since the modeling of the river basin will be based on average dry-, normal-, and wet-year hydrologic conditions, a method was needed to determine these hydrologic conditions. The use and analysis of long-term USGS gage records was the basis for the determination of hydrologic conditions. The records for the study period at each gage were reviewed and based on the criteria presented here, gages used in the spreadsheet model were selected.
The periods of record for gaging stations listed in Table 1 were reviewed. Gages that were in operation during most, if not all, of the study period were selected for evaluation as modeling gages. Nine of these gages were discontinued prior to 1971, thereby failing this requirement. If a gage was in operation only during the irrigation season, but throughout the study period, it was still included in the evaluation as a potential modeling gage. Table 4 lists the fourteen gages that met these initial screening criteria.
Table 4
Potential Modeling Gages for Determining Hydrologic Conditions
| Gage | Gage Name |
|---|---|
| 10011200 | West Fork Bear River at Whitney Dam near Oakley, UT |
| 10011400 | West Fork Bear River below Deer Creek near Evanston, WY |
| 10011500 | Bear River near Utah-Wyoming State Line |
| 10015700 | Sulphur Creek above Reservoir below La Chapelle Creak near Evanston, WY |
| 10015900 | Sulphur Creek below Reservoir near Evanston, WY |
| 10016900 | Bear River at Evanston, WY |
| 10020100 | Bear River above Reservoir near Woodruff, UT |
| 10020300 | Bear River below Reservoir near Woodruff, UT |
| 10026500 | Bear River near Randolph, UT |
| 10028500 | Bear River below Pixley Dam near Cokeville, WY |
| 10032000 | Smiths Fork near Border, WY |
| 10038000 | Bear River below Smiths Fork near Cokeville, WY |
| 10039500 | Bear River at Border, WY |
| 10041000 | Thomas Fork near WY-ID State Line |
The above list of potential modeling gages was further narrowed by applying the following criteria:
This process resulted in ten gages remaining under consideration as shown in Table 5.
Table 5
Selected Modeling Gages for Determining Hydrologic Conditions
| Gage | Gage Name |
|---|---|
| 10011500 | Bear River near Utah-Wyoming State Line |
| 10015700 | Sulphur Creek above Reservoir below La Chapelle Creak near Evanston, WY |
| 10016900 | Bear River at Evanston, WY |
| 10020100 | Bear River above Reservoir near Woodruff, UT |
| 10020300 | Bear River below Reservoir near Woodruff, UT |
| 10026500 | Bear River near Randolph, UT |
| 10028500 | Bear River below Pixley Dam near Cokeville, WY |
| 10032000 | Smiths Fork near Border, WY |
| 10038000 | Bear River below Smiths Fork near Cokeville, WY |
| 10039500 | Bear River at Border, WY |
Filling of Missing Data
Prior to determining the average hydrologic conditions in dry, normal, and wet years, some of the missing data at the 10 selected gages had to be filled. Sufficient time series data in the 10 selected gages is present so that the statistical properties of the records are not affected by the data filling exercise.
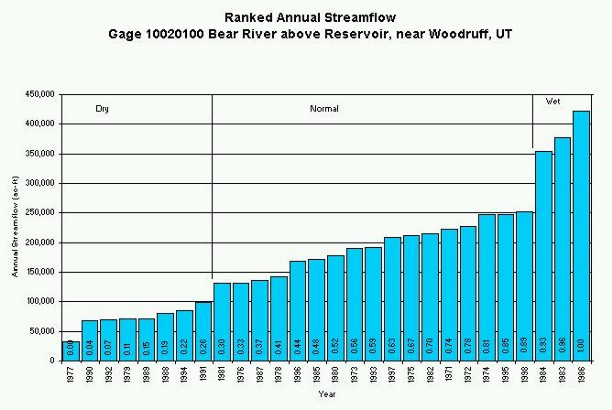
Three of the selected gages contained complete data records for the entire study period (Gage Nos. 10011500, 10020100, and 10020300). These gages contained monthly data for all months of all years in the study period. The remaining seven gages were missing data ranging from several months, when a gage was temporarily out of operation, to several years because a gage was either discontinued or not yet established. Two of these seven gages record streamflow measurements only during the irrigation season (April through September).
A correlation matrix was prepared which evaluated the correlations between all possible gage pairs in the basin. Linear regression models were then developed to estimate the missing data. For a regression relationship to be acceptable, the following criteria had to be met:
With these criteria in mind, regression models were computed using the monthly streamflow data and missing data were estimated. The general form of the models was as follows:
Missing streamflow at Gage 1= A * Measured streamflow data at Gage 2 + B where:A is the slope, and
B is the Y-intercept of the best-fit line determined by linear regression.
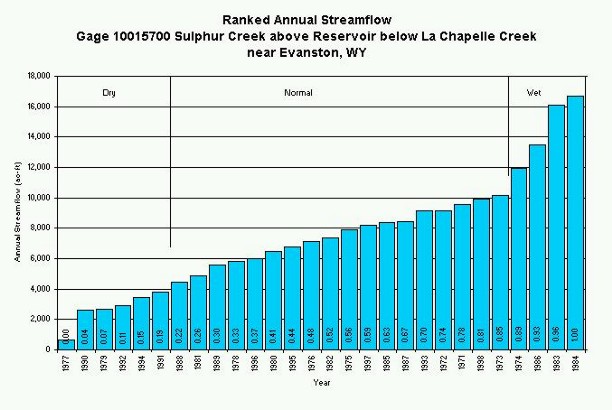
Correlations meeting these criteria could not be determined for one gage (Gage No. 10015700 - Sulphur Creek above Reservoir below La Chapelle Creek near Evanston, WY) when monthly data were evaluated. That is, no correlations could be found between this and any other gages resulting in an r2 value greater than 0.80. However, acceptable correlations did exist when annual flow data were compared. For this gage only, the annual streamflow was first estimated for missing years. These values were then disaggregated based upon the average monthly distribution of annual flows for dry, normal, and wet years.
Appendix A presents detailed discussions of the results of this analysis.
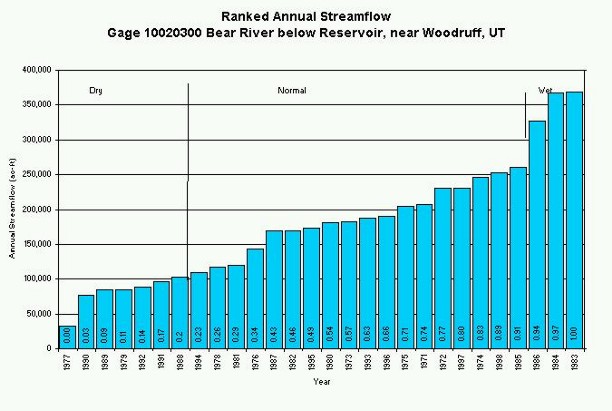
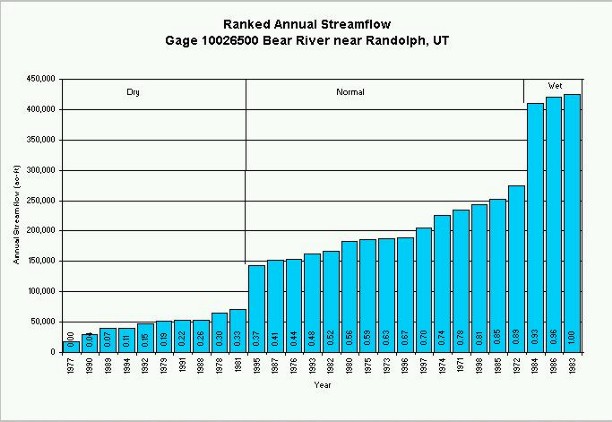
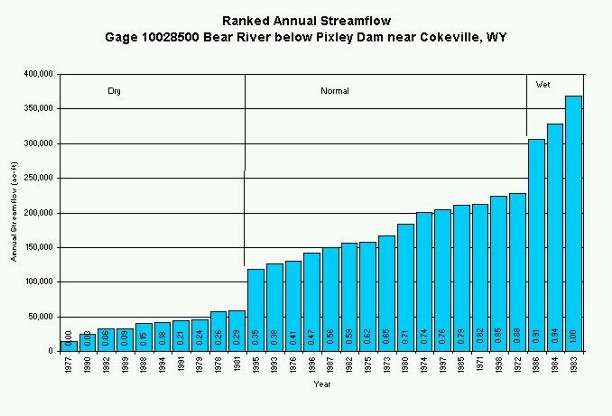
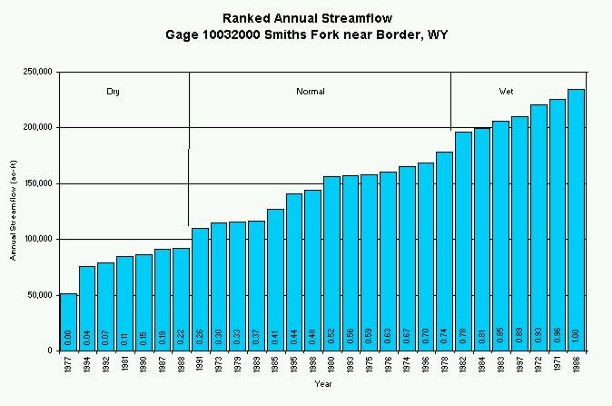
Determination of Dry, Normal, and Wet Years
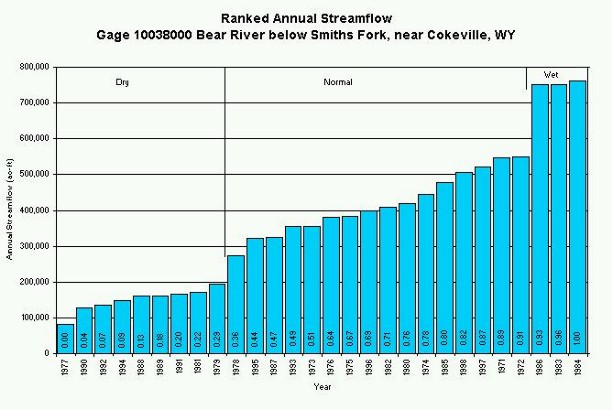
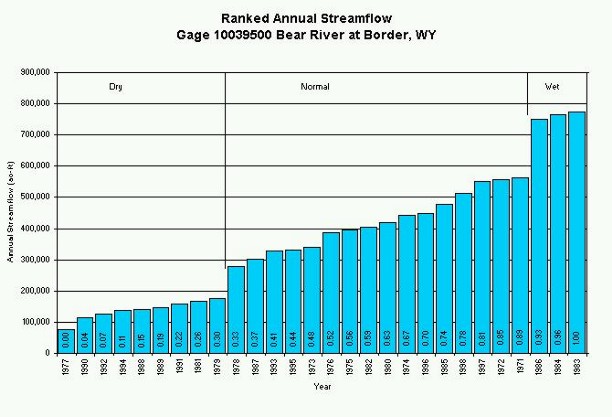
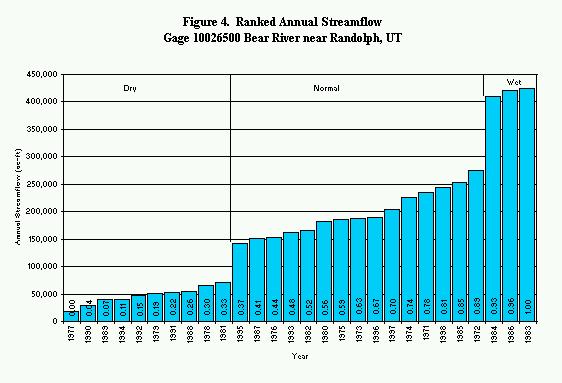
For each gage, plots of ranked total annual streamflow were generated. Figure 4 displays the annual streamflow data for the Bear River near Randolph, UT, gage as an example of the methodology (Gage No. 10026500). Examination of this figure reveals distinct and obvious trends in the volume of annual streamflow. The steps or breaks in volumes between low, normal, and wet years were used to characterize the average hydrologic conditions for this gage. Each gage was evaluated in a similar manner.
For those gages that did not exhibit such distinct and obvious breaks between either dry years and normal years or normal years and wet years, the driest or wettest 20 percent of the study period years were identified. Using this criteria, a gage record could be divided at one hydrologic extreme using the “20 percent rule” and at the other hydrologic extreme with the “break rule”. The results of this analysis are summarized in Table 6 (Appendix B presents the corresponding plots and determination of dry, normal, and wet hydrologic conditions for each gage).
Table 6
Characterization of Dry, Normal, and Wet Years for Bear River Model Modeling Gages
The end result of this analysis is to determine the base hydrology for input to the spreadsheet model. Table 7 summarizes the average annual discharges associated with the dry, normal, and wet hydrologic conditions. In similar fashion, the diversion records were reviewed and average diversion volumes were calculated using the corresponding dry, normal, and wet years from the streamflow analysis. These were also the base input for water use in the model.
Table 7
Average of Dry, Normal and Wet Year Streamflow for Modeling Gages
| USGS Gage | Average of Dry Years (ac-ft) |
Average of Normal Years (ac-ft) |
Average of Wet Years (ac-ft) |
|---|---|---|---|
| 10011500 Bear River near Utah-Wyoming State Line | 89,123 | 149,659 | 227,358 |
| 10015700 Sulphur Cr ab Res bel La Chapelle Cr near Evanston, WY | 2,676 | 7,521 | 14,548 |
| 10016900 Bear River at Evanston, WY | 81,986 | 182,738 | 336,043 |
| 10020100 Bear River above Reservoir near Woodruff, UT | 71,834 | 192,534 | 384,830 |
| 10020300 Bear River below Reservoir near Woodruff, UT | 80,819 | 187,477 | 354,220 |
| 10026500 Bear River near Randolph, UT | 50,567 | 207,135 | 418,250 |
| 10028500 Bear River below Pixley Dam near Cokeville, WY | 39,228 | 174,299 | 334,394 |
| 10032000 Smiths Fork near Border, WY | 80,067 | 143,786 | 213,284 |
| 10038000 Bear River below Smiths Fork, near Cokeville, WY | 149,938 | 416,578 | 754,807 |
| 10039500 Bear River at Border, WY | 138,129 | 421,233 | 762,880 |
APPENDIX A
ESTIMATION OF MISSING DATA
There are no data for water year 1998 at Gage No. 10015700. No regression relationships meeting the project criteria (r2 > 0.80) could be determined between this gage and others when the monthly data were evaluated. A linear regression relationship was developed between the annual flow at the Bear River gage located above Woodruff Reservoir (Gage No. 10020100) and the annual flow at the Sulphur Creek gage. These gages share an overlapping period of record from October 1961 through September 1997. The relationship is:
Annual Flow at Gage 10015700 = 0.0377 * Annual Flow at Gage 10020100 + 456.8
r2 = 0.83
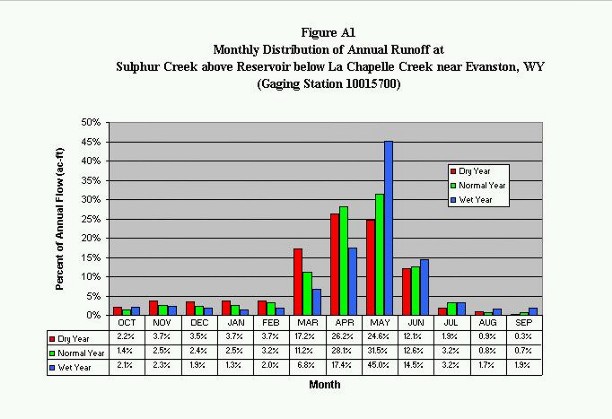
This relationship was used to estimate the annual flow at Gage No. 10015700 for the 1998 water year. The determination of dry, normal, and wet years was then made using the complete data set. To estimate the monthly streamflow needed for the spreadsheet model, the mean monthly proportion of the annual discharge was computed for each hydrologic condition. The results of this analysis are presented in Figure A1. Using the “normal year” distribution, the monthly discharges for the 1998 water year were estimated.
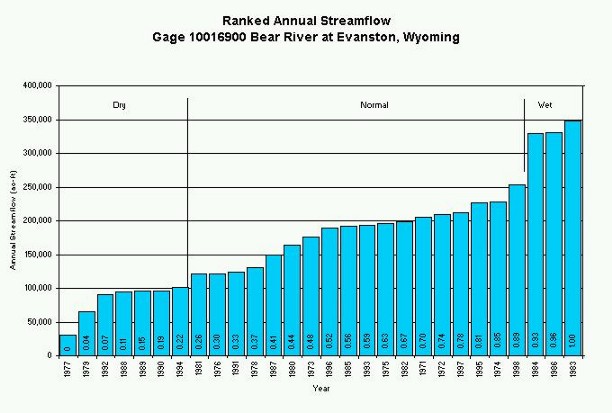
This gage contains summer flows only and is missing all data between 1971 and 1984. A linear regression relationship was developed between the monthly flow at the Bear River gage located above Woodruff Reservoir (Gage No. 10020100) and the Bear River at Evanston Gage. These two gages share an overlapping period of record from June 1984 to September 1998. A linear relationship based upon the monthly flows was determined from the overlapping data:
Flow at Gage 10016900 = 0.922* Flow at Gage 10020100 + 668.8
r2 = 0.92
This relationship was used to synthesize monthly flow data for the winter periods from 1984 through 1998 and all months for the period 1971 through 1983 prior to determining dry, normal, and wet year conditions.
Operation of this gage was discontinued following the 1992 water year. A linear regression relationship was developed between monthly flows at Bear River below Smiths Fork gage (Gage No. 10038000) and the gage near Randolph. These two gages share an overlapping period of record from October 1954 through September 1992. A linear relationship based upon the monthly flows was determined from the overlapping data:
Flow at Gage 10026500 = 0.5129* Flow at Gage 10038000
r2 = 0.92
This relationship was used to synthesize monthly flow data for the period of October 1992 through September 1998 prior to determining dry, normal, and wet year conditions.
Flow at Gage 10028500 = 0.4534* Flow at Gage 10038000 + 1679.6
r2 = 0.91
This relationship was used to estimate ungaged flows (October through May) for the period from 1971 through 1998.
There are data missing from the record in the 1972 and 1990 water year. In general, there were poor relationships between flow at this gage and other gages. Although it is desirable to utilize an adjacent gage, (e.g. Gage No. 10038000 - Bear River below Smiths Fork near Cokeville, WY), the best correlation was found between this gage and the Bear River near Randolph, UT (Gage No. 10026500).
A linear regression relationship was developed between the monthly flow at the Bear River gage near Randolph (Gage No. 10026500) and the Smiths Fork gage. These two gages share an overlapping period of record from October 1961 to September 1998. A linear relationship based upon the monthly flows was determined from the overlapping data:
Flow at Gage 10032000 = 0.5617* Flow at Gage 10026500 + 3729.9
r2 = 0.80
This relationship was used to estimate the 13 missing monthly records prior to determining dry, normal, and wet year conditions.
There are a total of 11 monthly data missing from the record in the 1990, 1997 and 1998 water years. A linear regression relationship was developed with the monthly flow at the Bear River gage located near the Wyoming/Utah border (Gage No. 10039500). These two gages share an overlapping period of record from October 1954 to September 1998. A linear relationship based upon the monthly flows was determined from the overlapping data:
Flow at Gage 10038000 = 0.9794* Flow at Gage 10039500 + 668.8
r2 = 0.99
This relationship was used to synthesize monthly flow data prior to determining dry, normal, and wet year conditions.
There are a total of 8 monthly data missing from the record in the 1997 and 1998 water years. A linear regression relationship was developed between the monthly flow at the Bear River gage located below Smiths Fork (Gage No. 10038000). These two gages share an overlapping period of record from October 1954 to September 1998. There were no months in which data were missing at both gages. A linear relationship based upon the monthly flows was determined from the overlapping data:
Flow at Gage 10039500 = 1.004* Flow at Gage 10038000 + 249.4
r2 = 0.99
This relationship was used to synthesize monthly flow data prior to determining dry, normal, and wet year conditions.
APPENDIX B
DETERMINATION OF WET, NORMAL, AND DRY YEAR CONDITIONS
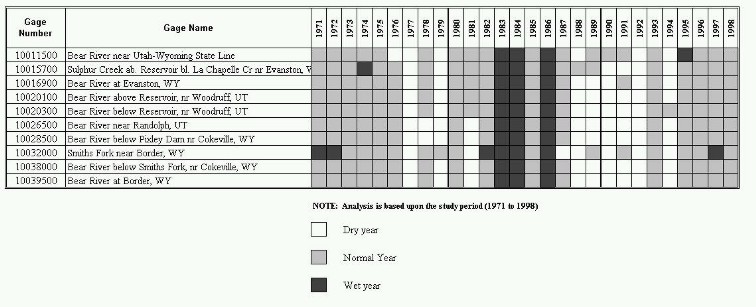
Using the method and criteria presented in this task memorandum, the modeling gages were analyzed and the dry, normal, and wet years were determined. Information on the hydrologic conditions at each gage was used in the model to determine the base hydrology and also to identify the years from which diversion data were selected. Following are figures for each of the gages. The selected years are shown on the figures.