Wyoming State Water Plan
Wyoming State Water Plan
Wyoming Water Development Office
6920 Yellowtail Rd
Cheyenne, WY 82002
Phone: 307-777-7626

Wyoming Water Development Office
6920 Yellowtail Rd
Cheyenne, WY 82002
Phone: 307-777-7626


| SUBJECT: |
Appendix P Task 3D. Available Surface Water Determination |
| PREPARED BY: | Bear River Basin Planning Team |
| DATE: | July 21, 2000 |
1.0 Introduction
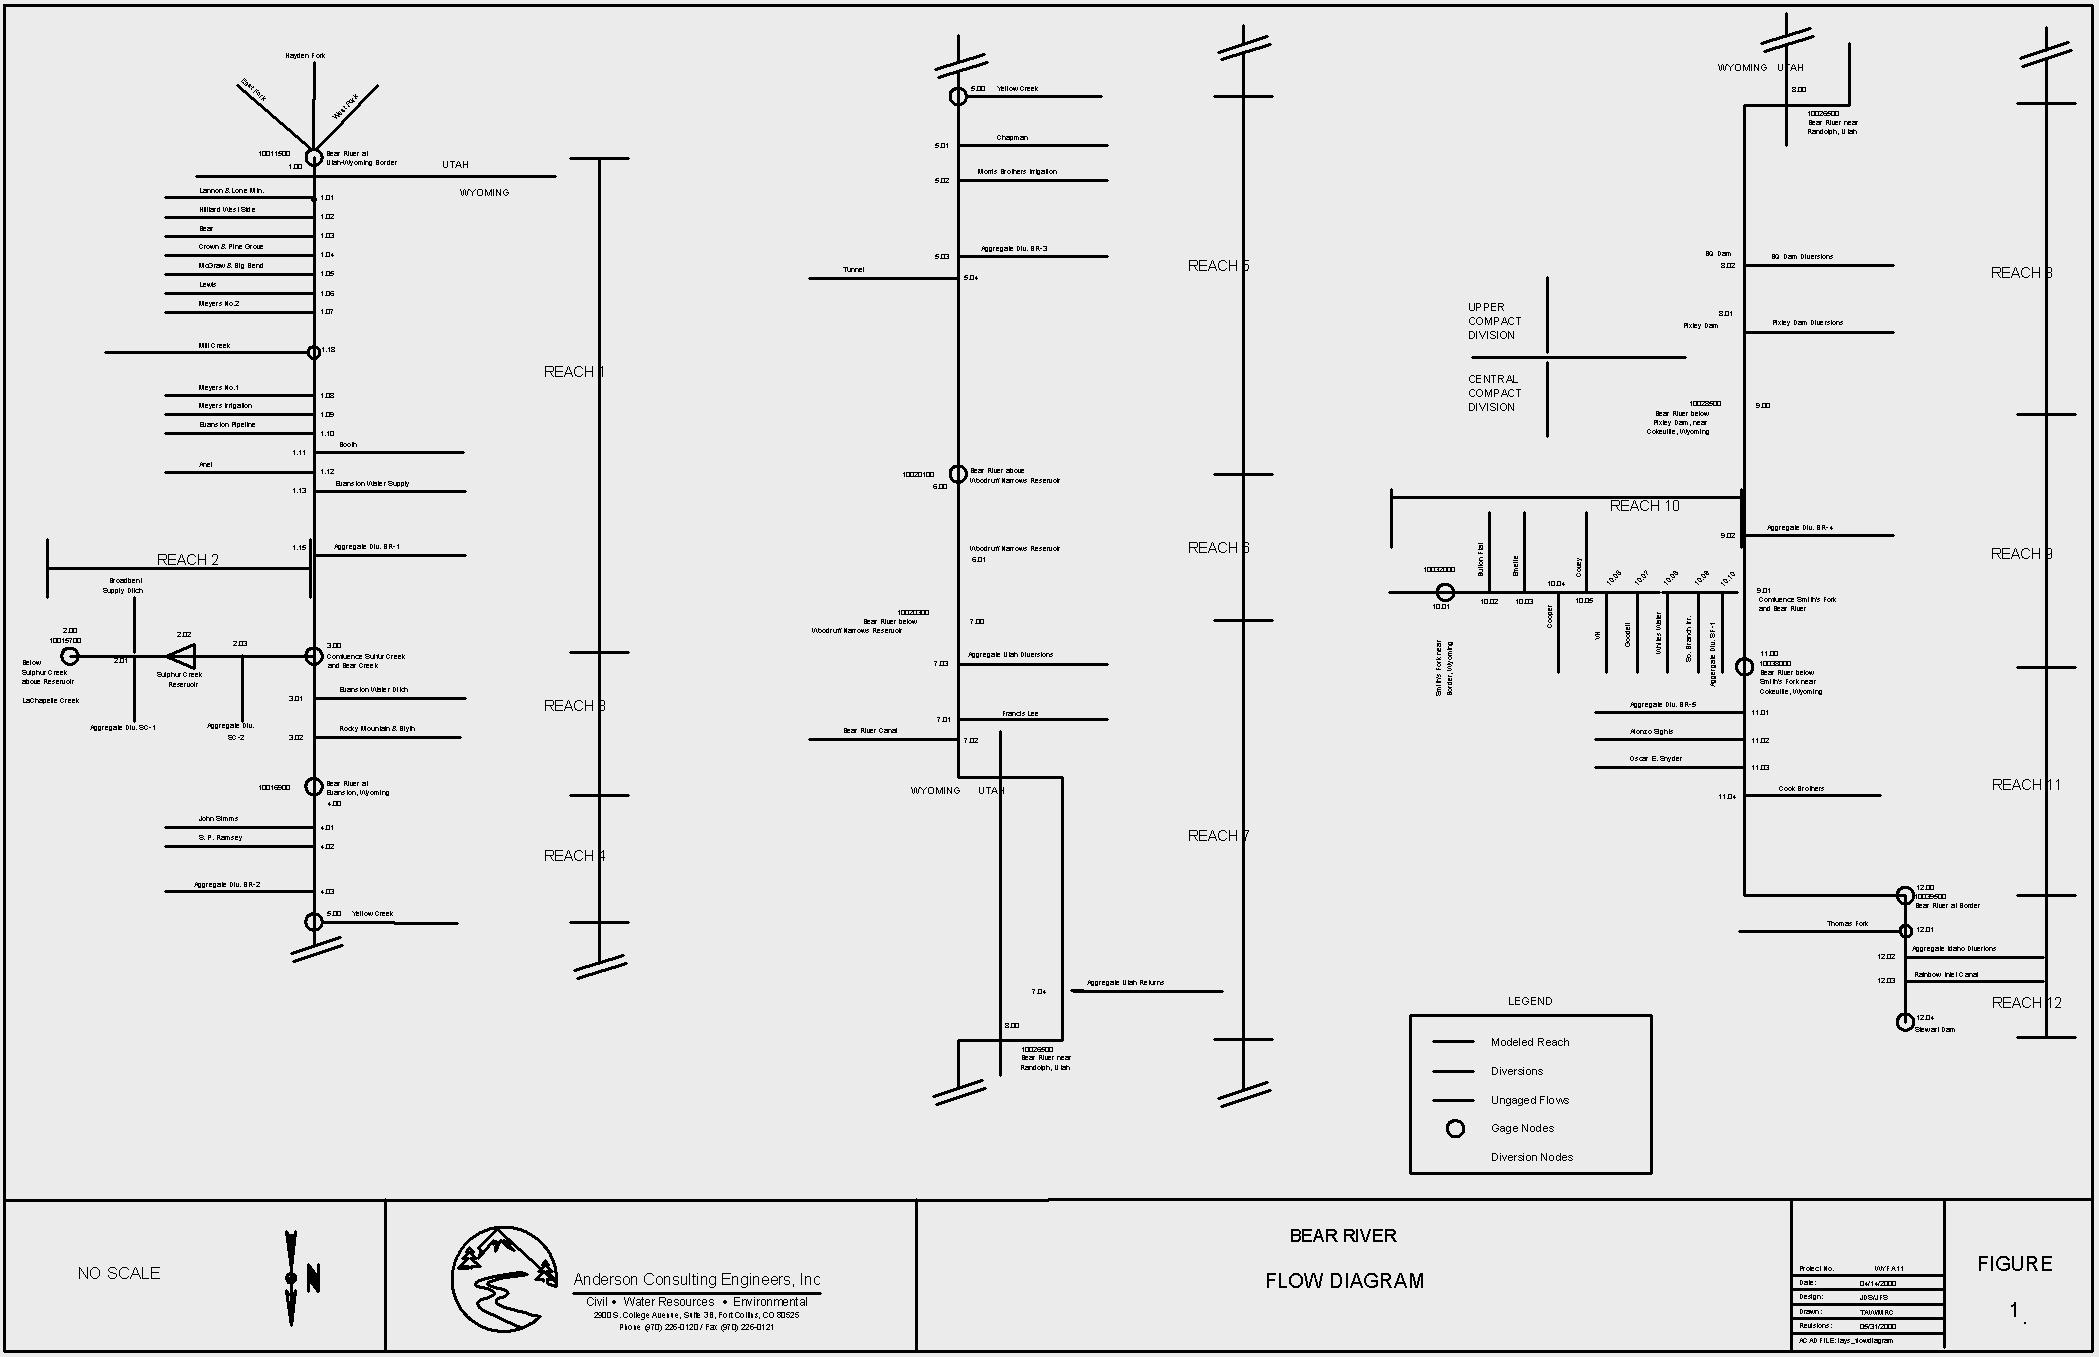
The Bear River Spreadsheet Model is a complex spreadsheet which incorporates multiple diversions, reservoirs, gaging stations, and other water resources within the Bear River located in the extreme southwest corner of Wyoming (see Figure 1). The purpose of the model is to provide a planning tool to the State of Wyoming for use in determining those river reaches in which flows may be available to Wyoming water users for future development. The purpose of this task is to assess the availability of water in the Bear River Basin for future development.
Individual spreadsheet models were developed which reflect each of three hydrologic conditions: dry, normal, and wet year water supply. As discussed in the Task 3A Memorandum, Surface Water Data Collection and Study Period Selection, each model relies on historical data to estimate the hydrologic conditions. Such factors as streamflow, diversions, and irrigation returns are analyzed to determine the type of hydrologic condition. The development of the model is discussed in the Memorandum for Task 3B, Surface Water Spreadsheet Model Development. The calibration of the spreadsheet model is discussed in the Memorandum for Task 3C, Water Model Calibration.
2.0 Basin Hydrology Overview
The development of an accurate and extensive database was an important objective of this study. The model serves as a repository for this database, particularly useful for looking at different typical hydrologic conditions in the basin. To gain a general understanding of the basin, a basin-wide water budget can be estimated from this database. In a typical or average normal year, the basin diversions use virtually all the water produced in the Upper and Central Divisions of the Bear River Basin. The average annual gross diversions total about 750,000 acre-feet, while the flow passing Stewart Dam is less than 10,000 acre-feet. The base hydrology for the normal year condition shows inflows to the system of about 525,000 acre-feet, which indicate the return flows from diversions are used several times before the river flows past Stewart Dam.
During dry years this same pattern of water use occurs, with water management being increasingly difficult to effectively deliver the diminished supply. Inflows to the system average almost 200,000 acre-feet. Diversions equal 389,000 acre-feet and the flow passing Stewart Dam is only 7,000 acre- feet. During wet years, however, basin inflows average about 1,015,000 acre-feet, with significant annual flows averaging over 58,000 acre-feet passing Stewart Dam. Diversions are equally increased to 1,169,000 acre-feet on average.
3.0 Available Flow
Several forms of model output can be accessed and utilized to determine the available water supply. These include river flow data (nodes or reaches), target (average historic diversions used in the model as demands and fulfilled if water available) and actual diversions (nodes, reaches, or comparison to historic), and evaluations of Compact Allocations (Upper or Central Divisions). These will be used to determine the available flow in the basin on a monthly basis at various points or reaches and during various hydrologic conditions.
Although the model simulates the water emergency conditions identified by the Bear River Compact under present levels of basin development, there are additional stipulations in the Amended Compact that address the authority and ability of upper basin states to store water and develop new projects. These will be summarized in Section 4.2, in particular, the affects of Article VI, paragraphs A, B, and C. Also of concern for the development of new projects is the timing of diversions. Most of the language addressing water emergency conditions in the Compact is associated with irrigation season flows, that is, divertible flow. The available water determination is shown on a year-round basis, with some assumptions about the Compact limitations during non-irrigation season for both divisions. In particular, the ability of upstream basin states to store water based on the levels in Bear Lake was not modeled in the spreadsheets.
3.1 Available Water Determination
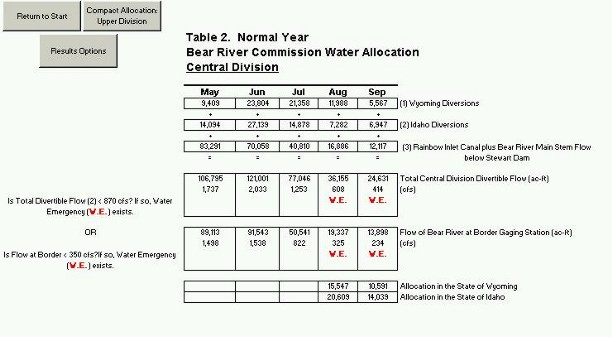
An effort was made to incorporate sufficient detail in the spreadsheet models to determine whether water emergency conditions exist as defined in the Bear River Compact for either the Upper or Central Divisions. Table 1 is the output table for the normal year hydrology of the Bear River Commission's Water Allocation: Upper Division, which uses the Water Commissioner's worksheet to determine if a water emergency exists in the Upper Division under the present level of basin development. Table 2, similarly, is the output table for the normal year hydrology of the Bear River Commission's Water Allocation for the Central Division. These tables determine whether an emergency condition exists; however, no attempt was made in the model to restrict diversions based on this determination.
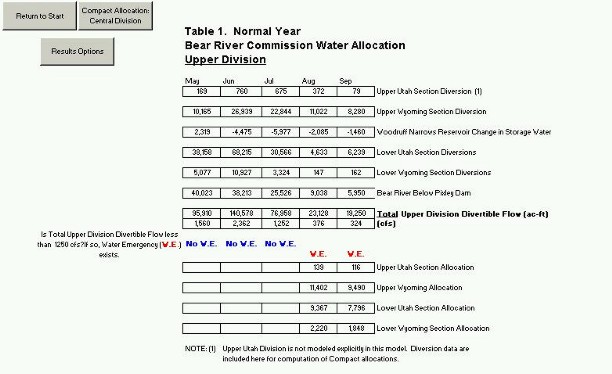
Some assumptions that were made to facilitate the assessment of available water follow. In reviewing the water allocation worksheets for each division, any month where a water emergency occurs under the present development level will not allow for any new development. All three hydrologic conditions were reviewed and the divisions were analyzed separately, although in reality, a diversion in the Upper Division may affect the available flows and, hence, the divertible flow in the Central Division. The Water Allocation worksheets for Compact purposes are only imposed during the irrigation season, May through September, so a further review of non-irrigation season flows is made to determine the water available on a yearly basis.
After the available water supply for each division based on compact limitations for present development levels is assessed, a review of another output table from the model, Table 3, the Outflow Worksheets by Reach is analyzed to determine which reaches are preferable based on available water. The table shows the summary of outflow by reaches for the normal year condition and is referenced to determine where in each division available flows may be diverted.
Table 3. Bear River Basin Water Availability
Summary of Outflow by Reach for Normal Year Hydrology (AF)
| Flow Downstream of Each River | Jan | Feb | Mar | Apr | May | Jun | Jul | Aug | Sep | Oct | Nov | Dec |
| Reach 1 | 3,772 | 3,734 | 9,086 | 18,659 | 48,550 | 51,850 | 13,527 | 3,064 | 2,660 | 5,072 | 4,203 | 3,985 |
| Reach 2 | 396 | 491 | 1,305 | 3,251 | 5,239 | 2,387 | 187 | 1,291 | 1,547 | 864 | 657 | 386 |
| Reach 3 | 4,168 | 4,225 | 10,391 | 21,921 | 53,606 | 54,331 | 14,865 | 3,051 | 3,304 | 4,877 | 4,941 | 4,373 |
| Reach 4 | 4,675 | 4,753 | 11,805 | 23,207 | 57,940 | 58,764 | 17,047 | 2,723 | 2,855 | 5,172 | 5,221 | 4,783 |
| Reach 5 | 4,675 | 4,753 | 11,805 | 23,199 | 56,646 | 57,017 | 16,545 | 3,138 | 3,182 | 5,494 | 5,325 | 4,783 |
| Reach 6 | 3,447 | 3,544 | 7,158 | 20,048 | 53,673 | 60,309 | 22,031 | 4,371 | 4,119 | 4,150 | 3,578 | 3,365 |
| Reach 7 | 6,813 | 7,466 | 16,963 | 28,230 | 33,156 | 18,920 | 1,789 | 577 | 1,516 | 6,868 | 7,553 | 6,901 |
| Reach 8 - Pixley Dam Release | 4,745 | 4,836 | 11,520 | 18,627 | 40,023 | 38,213 | 25,526 | 9,038 | 5,950 | 6,162 | 5,932 | 5,260 |
| Reach 9 | 13,649 | 13,859 | 28,008 | 52,402 | 88,566 | 92,123 | 50,178 | 19,419 | 14,348 | 16,943 | 16,393 | 14,929 |
| Reach 10 | 7,177 | 7,113 | 12,258 | 25,619 | 40,329 | 40,813 | 16,436 | 6,485 | 6,443 | 9,072 | 8,590 | 7,872 |
| Reach 11 - Flow at Border Gage | 14,320 | 14,374 | 28,460 | 55,596 | 89,113 | 91,543 | 50,541 | 19,337 | 13,898 | 17,291 | 16,919 | 15,260 |
| Reach 12 - Stewart Dam Release | 299 | 291 | 485 | 378 | 646 | 2,506 | 1,004 | 691 | 949 | 659 | 513 | 422 |
3.2 Results
Tables 4 and 5 show the water availability for the Upper and Central Divisions, respectively. The Upper and Central Divisions were addressed separately, although the development of a new project in the Upper Division will inevitably impact the available flows in the Central Division. In the Upper Division, Table 4 lists the model flows at Pixley Dam for the three hydrologic conditions. The second item of information in the table is the Total Divertible Flow as defined by the Compact. This is the total diversions by Wyoming and Utah plus the flow passing Pixley Dam (see also Table 1). The third item is the flow of 1,250 cfs as compared to the total divertible flow identified in the compact, below which an emergency condition is triggered. The fourth item is the determination of available flow by month for each condition. Lastly, from a review of the flow by reach tables of model output, the preferable reaches where this flow is available are listed in order of maximum available flow to minimum.
Table 4. Bear River Basin Water Availability
Upper Division
| Jan | Feb | Mar | Apr | May | Jun | Jul | Aug | Sep | Oct | Nov | Dec | ||
| 1.Flow below Pixley Dam | |||||||||||||
| Dry | 1,972 | 1,665 | 3,744 | 3,934 | 1,693 | 7,601 | 6,842 | 2,572 | 1,492 | 1,735 | 2,225 | 1,959 | 37,464 |
| Normal | 4,745 | 4,836 | 11,520 | 18,627 | 40,023 | 38,213 | 25,526 | 9,038 | 5,950 | 6,162 | 5,932 | 5,260 | 175,832 |
| Wet | 6,098 | 7,736 | 20,226 | 32,192 | 83,950 | 92,935 | 40,990 | 20,293 | 18,027 | 150,040 | 13,319 | 8,975 | 359,781 |
| 2. Total Divertable Flow (AF) | |||||||||||||
| Dry | - | - | - | - | 56,919 | 83,905 | 33,057 | 12,208 | 7,619 | - | - | - | 193,708 |
| Normal | - | - | - | - | 95,910 | 140,578 | 76,958 | 23,128 | 19,250 | - | - | - | 355,824 |
| Wet | - | - | - | - | 144,576 | 213,983 | 90,951 | 35,618 | 28,889 | - | - | - | 514,017 |
| 3. Min. Compact Flow Required | |||||||||||||
| (AF) | 0 | 0 | 0 | 0 | 76,861 | 74,381 | 76,861 | 76,861 | 74,381 | 0 | 0 | 0 | 379,344 |
| (cfs) | 0 | 0 | 0 | 0 | 1,250 | 1,250 | 1,250 | 1,250 | 1,250 | 0 | 0 | 0 | |
| 4. Available Flow for WY (AF) | |||||||||||||
| Dry | 1,972 | 1,665 | 3,744 | 3,934 | 0 | 9,524 | 0 | 0 | 0 | 1,735 | 2,255 | 1,959 | 26,788 |
| Normal | 4,745 | 4,836 | 11,520 | 18,627 | 19,049 | 66,197 | 97 | 0 | 0 | 6,162 | 5,932 | 5,260 | 142,426 |
| Wet | 6,098 | 7,736 | 20,226 | 32,192 | 67,715 | 139,602 | 14,090 | 0 | 0 | 15,040 | 13,319 | 8,975 | 324,994 |
| 5. Preferable Reaches | |||||||||||||
| 7,8,3,4,5 | 7,8,3,4,5 | 7,8,3,4,5 | 7,8,3,4,5 | 4,5,6 & 7 | 4,5,6 & 7 | 4,5,6 & 7 | none | none | 7,8,3,4,5 | 7,8,3,4,5 | 7,8,3,4,5 | ||
| Notes: | 1. Flow below Pixley Dam is gage 10028500 Bear
River below Pixley Dam. This Constitutes the flow out of the Uppper Division 2. Total Divertable Flow is combined diversions (present development) of Wyoming and Utah in Upper Division including flow below Pixley Dam (1,250 cfs limit) 3. Minimum Compact Flow is minimum of flow above 1,250 cfs (Total Divertable Flow, including Pixley Dam release) or zero for non-irrigation season. 4. Available Flow is physically available flow, based on present development, above required Compact flows, which is flow in item 1 during non-irrigated seasons or flow in item 2 minus item 3 in irrig. season 5. Preferable reaches are stream reaches where flow physically occurs, but may be impacted by potential projects in other reaches of this division. |
Similarly, Table 5 for the Central Division lists the flow at the Border Gage in item 1. Item 2 is the flow below Stewart Dam, item 3 is the total divertible flow as identified in the Compact, item 4 is an assumption of the Compact's limiting flow on a year-round basis, and items 5 and 6 are the same as for the Upper Division.
Table 5. Bear River Basin Water Availability
Central Division
| Jan | Feb | Mar | Apr | May | Jun | Jul | Aug | Sep | Oct | Nov | Dec | ||
| 1.Flow at WY/ID Border Gage | |||||||||||||
| Dry | 8,348 | 7,587 | 12,348 | 13,549 | 18,140 | 22,467 | 14,131 | 6,274 | 5,638 | 6,792 | 8,400 | 8,060 | 131,734 |
| Normal | 14,320 | 14,374 | 28,460 | 55,596 | 89,113 | 91,543 | 50,541 | 19,337 | 13,898 | 17,291 | 16,919 | 15,260 | 426,652 |
| Wet | 18,950 | 22,400 | 51,690 | 75,760 | 156,070 | 218,602 | 81,847 | 37,510 | 32,103 | 34,320 | 32,543 | 24,390 | 786,185 |
| 2.Flow below Stewart Dam (AF) | |||||||||||||
| Dry | 581 | 644 | 624 | 451 | 490 | 666 | 663 | 796 | 706 | 721 | 407 | 309 | 7,058 |
| Normal | 299 | 291 | 485 | 378 | 646 | 2,506 | 1,004 | 691 | 949 | 659 | 513 | 422 | 8,843 |
| Wet | 188 | 201 | 495 | 430 | 11,587 | 29,122 | 13,762 | 640 | 742 | 511 | 384 | 314 | 58,376 |
| 3. Total Divertable Flow (AF) | |||||||||||||
| Dry | - | - | - | - | 35,843 | 43,034 | 29,962 | 15,945 | 10,623 | - | - | - | 135,407 |
| Normal | - | - | - | - | 106,795 | 121,001 | 77,046 | 36,155 | 24,631 | - | - | - | 365,628 |
| Wet | - | - | - | - | 197,323 | 257,533 | 110,055 | 57,043 | 43,434 | - | - | - | 665,388 |
| 4. Min. Compact Flow Required | |||||||||||||
| (AF) | 21,521 | 19,438 | 21,521 | 20,827 | 53,495 | 51,769 | 53,495 | 53,495 | 51,769 | 21,521 | 20,827 | 21,521 | 411,199 |
| (cfs) | 350 | 350 | 350 | 350 | 870 | 870 | 870 | 870 | 870 | 350 | 350 | 350 | |
| 5. Available Flow for WY (AF) | |||||||||||||
| Dry | 0 | 0 | 0 | 0 | 0 | 0 | 0 | 0 | 0 | 0 | 0 | 0 | 0 |
| Normal | 0 | 0 | 6,939 | 34,769 | 53,300 | 69,232 | 23,551 | 0 | 0 | 0 | 0 | 0 | 187,791 |
| Wet | 0 | 2,962 | 30,169 | 54,933 | 134,549 | 197,775 | 56,560 | 3,548 | 0 | 12,799 | 11,716 | 2,869 | 507,881 |
| 6. Preferable Reaches | |||||||||||||
| none | 9, 11 & 12 | 9, 11 & 12 | 9, 11 & 12 | 9, 11 & 12 | 9, 11 & 12 | 9, 11 & 12 | 9, 11 & 12 | none | 9, 11 & 12 | 9, 11 & 12 | 9, 11 & 12 | ||
| Notes: | 1. Flow at WY/ID Border Gage is gage 10039500
Bear River at Border, above Idaho diversions. One of Compact flow limitations/triggers is flow
of 350 cfs at this gage. 2. Flow below Stewart Dam reported by PP&L, is referenced in compact as part of other minimum of 870 cfs in item 4 (other part is Total Divertable Flow). 3. Total Divertable Flow is combined diversions (present development) of Wyoming and Idaho in Central Division plus flow below Stewart Dam. 4. Minimum Compact Flow is minimum of flow above 350 cfs at Border Gage or flow of 870 cfs (Total Divertable Flow, including Stewart Dam release). 5. Available Flow is physically available flow, based on present development, above required Compact flows, which are minimum of flow in item 3 above 870 cfs or flow in item 1 above 350 cfs. 6. Preferable reaches are stream reaches where flow physically occurs, but may be impacted by potential projects in Upper Division and potential projects in other reaches of this division. |
From these tables, it can be seen that dry year yields (yield is defined here as the water available for diversion and future permanent use) for the Upper Division are essentially only available during the non-irrigation season and total about 27,000 acre-feet. Available water is non-existent in the Central Division. For all three hydrologic conditions the available flows in the Upper Division are available lower in the basin (reaches 7 and 8 are higher; see Figure 1) during the non-irrigation season and are available higher in the basin during the runoff period (early irrigation season). This is reasonable as the flows are generally more available during the peak runoff months and the available flows later in the year are a result of irrigation returns and baseflow. In the Central Division, the flows are available mainly on the mainstem reaches of 9, 11 and 12, since the Smiths Fork generally captures and uses all available flow and the Thomas Fork was not explicitly modeled (the reach gain in reach 12 is a result of Thomas Fork and could yield available water).
Yields during normal and wet years are available in both divisions, although year round yields are still not available, particularly in the upper division. During a typical normal year, the available water is about 150,000 acre-feet in the Upper Division and about 190,000 acre-feet in the Central Division, distributed as shown in the tables.
In wet years, which for this study were the three wettest years (1983, 1984, and 1986) in the study period, there is no water available in August and September in the Upper Division and no water available in the Central Division in September based on Compact Allocations. There is about 325,000 acre-feet available in the Upper Division, mainly during the runoff period. In the Central Division, the water available exceeds 500,000 acre-feet.
4.0 Potential Projects and Model Utilization
Many of the potential projects that divert available flow during high flow months (spring runoff) versus a year-round diversion will require storage projects. The retirement of existing diversions or water uses that serves to increase the water availability was not assessed during this project task, however, the model is fully capable of addressing this scenario.
The type of new water use will limit the divertible flow, e.g., a large diversion with small consumptive use, which returns most of the diversion before water-short reaches of the system are impacted, may be easier to develop than a small, but large, consumptive use. For the purposes of this task assessment, the divertible flow was assumed to be a net diversion, i.e., only the consumptive use is assessed.
4.1 Direct Diversion Versus Storage Projects
There are essentially 8 dry years in the 28 year study period, during which a direct diversion project would not receive any water (about 3 out of every 10 years there are no divertible flows). In reviewing Tables 4 and 5, there are virtually no available flows in either division during dry year periods, in any months, therefore a direct diversion without storage offers limited supply. To guarantee a firm yield during these dry year periods, a storage project, which would capture flows during normal or wet years, would be required.
Turning to the normal year hydrologic study, the best development plan would be to build storage of about the yield available during these years - 150,000 to 190,000 acre-feet in either the Upper or Central Divisions. The yield that is available for firm contract out of the facility would be about half of this volume. There would be the need to carry over some storage to guard against dry year yields (zero) and to take into account losses from the reservoir which would decrease the available water. The firm yield would be on the order of 75,000 acre-feet in the Upper Division and 95,000 acre-feet in the Central Division.
A review of the wet years shows much higher available flows, but they occur only in three years out of 28 years or about 11 percent of the time. Planning and constructing facilities on these occurrences would oversize the storage vessel and would not substantially increase the firm yield of a water supply, although there is up to 500,000 acre-feet available during these wet periods.
4.2 Additional Considerations
Article VI of the Amended Bear River Compact allocates additional storage to the states, above that which existed as of February 4, 1955, which for Wyoming was determined to be 2,150 acre-feet. Additionally, the paragraphs of this article allocate additional depletions to the states for any diversions after January 1, 1976. These new depletions and storage projects must be assessed relative to the available flows and the Compact allocations. Existing conditional projects of Wyoming's which have been approved since January 1, 1976, must also be reviewed as they may decrease the available flows.
According to paragraph A of Article VI, Wyoming's apportionment of 35,500 acre-feet would be 17,750 acre-feet, a portion of which has been committed to reservoir enlargements since February 4, 1955. The additional storage rights under paragraph B allocated to Wyoming of 35,000 acre-feet are limited by the depletions they cause above Stewart Dam in excess of depletions as of January 1, 1976. For Wyoming, this additional depletion is 13,000 acre-feet, again further limited by potential projects approved by Wyoming, but not constructed and operating, and, therefore, not modeled during this study. This study includes all existing depletions made by river diversions and mapped by irrigated lands. A further limitation under paragraph B is that diversions to storage can not be exercised when the storage in Bear Lake is below elevation 5,911.00 feet. The operation of Bear Lake is not incorporated in the model, although this needs to be assessed in planning for new developments in the basin.
5.0 Summary
Given the limitations and restrictions on new developments delineated in the Amended Bear River Compact and the language in Article VI of the Compact that states that "Water depletions permitted under this Paragraph B shall be calculated and administered by a Commission-approved procedure", it will be difficult to model the impact and affect of potential projects a priori. This spreadsheet model will, however, be useful in screening new projects and estimating impacts.
The determination of available flow is assessed based on the simulations of the spreadsheet models for the three hydrologic conditions. Simulations based on these estimated water availabilities to determine the impacts of the potential new diversion or projects was not performed with the models during this task. These should be configured in the model and simulated for each with and without project condition. The resultant flows in each reach should be analyzed, as well as any shortages to existing diversions that may occur or the creation of a water emergency condition. These assessments will be made during later tasks after potential projects are better defined.