Wyoming State Water Plan
Wyoming State Water Plan
Wyoming Water Development Office
6920 Yellowtail Rd
Cheyenne, WY 82002
Phone: 307-777-7626

Wyoming Water Development Office
6920 Yellowtail Rd
Cheyenne, WY 82002
Phone: 307-777-7626


| SUBJECT: |
Appendix O Ground Water Resource Investigation |
| PREPARED BY: | Bear River Basin Planning Team |
INTRODUCTION
This memorandum discusses the approach, analysis and results obtained for Task 3E. "Available Ground Water Determination." The primary goal of Task 3E was to provide a general overview of ground water resources in the Bear River basin. Specific task objectives include:
Note that the level of effort for this task did not include field investigations, ground water modeling efforts, or testing of wells. Available published information regarding the ground water resources in the Bear River Basin was reviewed. Information from well owners, drillers, and pump installers was not gathered under this scope of work, but may be considered in future planning efforts.
APPROACH
To accomplish the task objectives, the following approach was taken:
Data Collection
Data useful in analyzing the ground water resource of a basin include:
Water quality is important for determining whether ground water is suitable for various uses. Domestic and municipal water supplies generally require higher quality water than do agricultural, industrial, and stock watering supplies.
Data was obtained from existing reports, existing databases, and websites.
Existing Reports
Reports and articles were obtained through searches at the following libraries:
A list of the reports reviewed is included in the Sources Section of this memorandum. Extensive information was obtained from reports by the U.S Geological Survey (USGS, 1963, 1989 and 1996). Most of the aquifer descriptions came from the report by Cheryl A. Eddy-Miller (USGS, 1996) on the water resources of the Lincoln County portion of the basin.
Existing Databases
The principal source of data came from USGS and State of Wyoming databases. USGS sources include the Ground Water Site Inventory (GWSI) and Ground Water Quality databases. These databases were also the primary data sources for Cheryl Eddy-Miller's report (USGS, 1996). The USGS's GWSI database contained data for 119 wells and springs located in the basin. Database information includes:
The USGS's Water Quality database (Quality database) contains data on approximately 1800 parameters. USGS provided us with a query of well and spring samples from the Bear River Basin. The query includes 24 parameters that are general water quality indicators. The query contains analyses from 57 wells and 49 springs.
The State Engineer's Water Well Inventory database (State database) reports compiled administrative information from 1,015 wells in the basin including the following information:
Websites
Several websites were investigated to understand the available information for the Bear River basin, including the on-line library listings for the USGS and WRDS. The most useful websites include the University of Wyoming Spatial Data & Visualization Center (SDVC) (http://www.sdvc.uwyo.edu/) and the Wyoming Water Resources Data System (WRDS) site ( http://www.wrds.uwyo.edu/).
Data Compilation
The GIS coverage of the Geologic Map of Wyoming, developed by Love and Christiansen (1985), was obtained from SDVC and clipped to show only the geology of the Bear River basin. In addition, a new polygon theme was created that combined the alluvial aquifers into one polygon and the bedrock aquifers into another polygon. This basemap, described in more detail under the Hydrogeology subsection, provides a simple visual representation of the location of alluvial versus bedrock aquifers.
Information stored in the two USGS databases and the State Engineer's Water Well Inventory database pertain to specific geographic points, i.e. well locations. Therefore, their usefulness as a tool for understanding ground water issues can be greatly enhanced by placing them into a GIS format. GIS point coverages were created from both the GWSI database and the State database showing the location of the wells and springs. The attributes from the respective database are assigned to each point in the GIS coverages. Some of the more useful attributes from the GWSI coverage include the well yield, well aquifer name where available, and well use code (i.e. domestic, irrigation, etc.). To further enhance its usefulness, for each well in a defined aquifer both the geologic description and the water bearing characteristics of the formation were added as attributes to the coverage.
The GIS coverage developed from the State database includes attributes similar to the GWSI coverage. In addition, depth to ground water information is available for some locations. Again, for each well in a defined aquifer both the geologic description and the water bearing characteristics of the formation were added as attributes to the coverage.
A GIS point coverage was also created from the USGS Water Quality database. Attribute information in this coverage includes sample results for total dissolved solids (TDS), Flouride, Iron, Sufate, Chloride, as well as other constituents.
Because data is limited, the GIS coverages are useful tools with which to base general conclusions concerning the ground water resources in specific basin areas. Planners can use the tool to identify the aquifers that have been developed in the vicinity of proposed new developments. Qualified hydrogeologists can use the coverage to extrapolate the data and come to more educated conclusions concerning site specific aquifer potential and likely water quality. Note that site specific investigations will still need to be done come to more definite conclusions concerning any specific area's ground water development potential.
Analysis Approach
Information was used from the existing reports, databases, and the GIS tools developed as part of this task to:
RESULTS
Existing Well and Spring Data
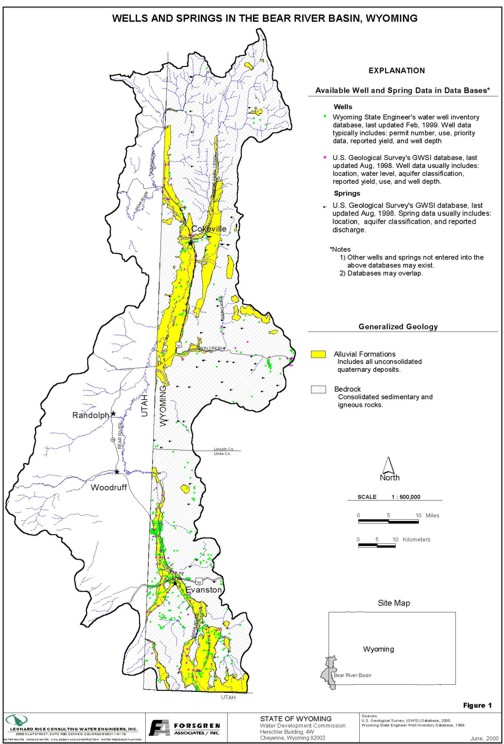
Figure 1 shows the distribution of wells and springs that are included in the Wyoming State Engineer's Water Well Inventory and the USGS GWSI database. Note that figures referenced in this memorandum are included at the end of the text. This figure of the two well data GIS coverages developed for this project, shows that most wells are in the vicinity of the Bear River in the Uinta County portion of the basin. Well depth information from the State coverage indicates that most of these wells are producing from the alluvial aquifer. Most of the inventoried springs are located in the central portion of the study area in the vicinity of Twin Creek.
Geology
Geology controls the occurrence and movement of ground water. The geology of the Bear River Basin is extremely complex. The Bear River Basin is located in part of Wyoming's "Overthrust Belt." Overthrust geology is characterized by folded and faulted sedimentary rocks, which have been eroded to form ridges and valleys. Several mountain ranges make up the Overthrust Belt and divide the Bear River Basin from the Green River Basin to the east and the Great Salt Lake Basin to the west. There are several publications that describe the geology of the Overthrust Belt in greater detail, primarily for use by Geologists, referenced in the Sources Section.
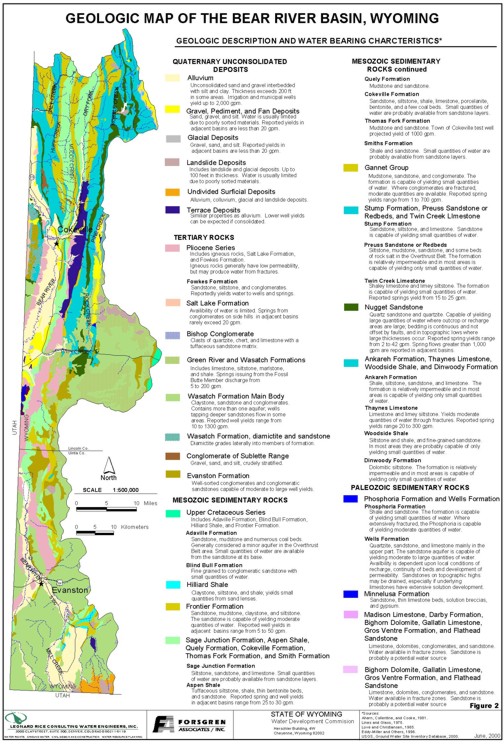
Figure 2 is the modified version of Geologic Map of Wyoming by Love and Christiansen (1985) that shows the surface exposure of numerous sedimentary formations. The geologic description and water bearing characteristics of each formation, reported by Eddy-Miller (USGS, 1996), have been included along side the geographic reference. The descriptions may include observations from outside the Bear River Basin. This figure is an extremely useful tool for understanding the geology in the basin.
The rock sequences in the Overthrust Belt were deposited by alternating transgressive and regressive seas throughout geologic history and range in thickness from several feet to several thousand feet. After deposition, the flat lying deposits were subsequently faulted and folded which is reflected by the present north - south outcrop orientation in Figure 2. The direction formations currently slant or dip depends on local faults and folds. These faults and folds have a strong influence on ground water flow rates and direction. Younger formations exist beneath older formations as a result of high angle thrust faulting. Some formation names are different for similar deposits located outside the Bear River Basin.
Hydrogeology
An aquifer is a geologic unit that provides usable water to wells and springs. Several potential aquifers are located at depths within reach of typical drilling rigs. Due to the complex geology and numerous formations, the water bearing geologic formations have been grouped into alluvial and bedrock formations shown on most figures. Alluvial formations include all Quaternary unconsolidated deposits described on Figure 2 including:
Bedrock formations include older consolidated Tertiary, Mesozoic, and Paleozoic rocks. Most well entries in the two well coverage databases do not report the formation wells draw water from. However, based on the well locations shown in Figure 1, it appears that most wells are completed in alluvial materials.
Alluvial Aquifer
The aquifer that consists of saturated stream alluvium within approximately 2 miles of the Bear River is referred to herein as the Alluvial Aquifer. Alluvium consists of sand and gravel interbedded with silt and clay (Robinove, 1963). Ground water within the Alluvial Aquifer is stored and transmitted between grains. This "pore" space is reportedly large (up to 25 percent by volume) in the Alluvial Aquifer making it very permeable and productive. Alluvial Aquifer thickness is generally less than 100 feet, but may exceed 200 feet in some areas (Lines and Glass, 1975). The average depth of the 35 alluvial wells with reported depth information in the State database is 106 feet. The outline of alluvial formations shaded on most figures is a general outline of the Alluvial Aquifer.
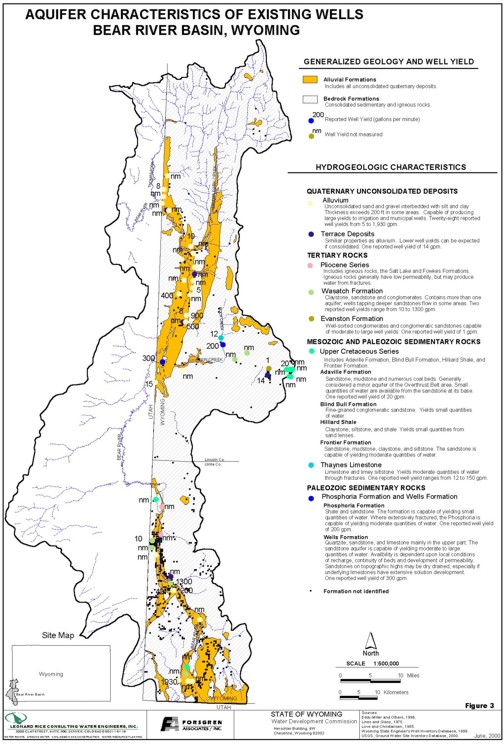
Figure 3 shows the geologic formations from which wells identified in both the USGS and State database reportedly produce water. As shown, most wells in the database do not have the producing formation identified. Of the 56 wells with formation data, twenty-eight wells are completed in the alluvium. The number of wells without formation information that physically fall within the boundaries of the alluvium formations, as shown in Figure 3, suggests that the Alluvial Aquifer is the most utilized aquifer. The wells that are spatially within the Alluvial Aquifer boundary have reported well yields that range from 5 to 1,930 gallons per minute (gpm).
Bedrock Aquifers
The USGS (1996) reports that 35 formations yield small to moderate quantities of water to wells in Lincoln County. Some bedrock formations may contain several aquifers. Bedrock aquifers include sandstones, conglomerates, and limestones. Bedrock formations that are made of relatively impermeable materials are considered aquifers if they contain water in interconnected joints, fractures, or faults. Figure 3 shows: the distribution of the 20 wells identified in the State or GWSI databases as completed in 8 bedrock formations; their reported yields; and brief aquifer descriptions. The average depth of these 20 bedrock wells is 440 feet, with a range from 26 to 1200 feet deep. Table 1 shows the number of wells that reportedly produce water from each formation. The Wasatch and Adaville Formations have the most reported wells of the bedrock aquifers in the basin with 7 and 6 wells respectively. The highest reported bedrock well yield is from the Wasatch Formation near Evanston (1,300 gpm).
The GIS well coverages developed and shown in Figure 3, provide a useful tool for decision- makers. For instance, if there was interest in developing a new well near Evanston, Figure 3 shows that existing wells in the vicinity yield 200, 427, and 1300 gpm. The GIS coverages can also be used to visually depict any attribute including well depth, aquifer type, water level, well use (domestic, irrigation, etc), and water rights information (permit number, priority date).
| TABLE 1: WELL YIELD AND SPRING DISCHARGE | ||||||||
| FORMATION COMPLETED IN | WELLS | SPRINGS | ||||||
| Wells Reported | Wells With Yield Data | Yields Range (gpm) | Average Well Yield(gpm) | Springs Reported | Springs With Discharge Data | Discharge Range (gpm) | Total Spring Discharge (gpm) | |
| Alluvial Formations | ||||||||
| Alluvium (Alluvial Aquifer) | 28 | 10 | 5-1930 | 420 | 0 | --- | --- | --- |
| Landslide Deposits | 0 | --- | --- | --- | 1 | 1 | 2000 | 2000 |
| Terrace Deposits | 7 | 1 | 14 | 14 | 1 | 1 | 20 | 20 |
| Total Alluvial Formations | 35 | 11 | 5–1930 | --- | 2 | 2 | 20-2000 | 2020 |
| Bedrock Formations | ||||||||
| Pliocene Series | 2 | 0 | nm | nm | 0 | --- | --- | --- |
| Fowkes Formation | 0 | --- | --- | --- | 3 | 3 | 5-125 | 132 |
| Green River Formation (Fossil Butte Member) | 0 | --- | --- | --- | 7 | 7 | 5-200 | 284 |
| Wasatch Formation | 7 | 2 | 10-1300 | 437 | 9 | 8 | 1-15 | 43 |
| Evanston Formation | 1 | 1 | 1 | 1 | 1 | 1 | 25 | 25 |
| Upper Cretaceous Series | 2 | 0 | nm | nm | 0 | --- | --- | --- |
| Adaville Formation | 6 | 1 | 20 | 20 | 0 | --- | --- | --- |
| Sage Junction Formation | 0 | --- | --- | --- | 1 | 0 | nm | nm |
| Thomas Fork Formation | 0 | --- | --- | --- | 2 | 1 | nm to 1 | 1 |
| Gannet Group | 0 | --- | --- | --- | 8 | 6 | 1-700 | 837 |
| Preuss Sandstone or Redbeds |
0 | --- | --- | --- | 3 | 2 | 1-50 | 70 |
| Twin Creek Limestone | 0 | --- | --- | --- | 2 | 2 | 15-25 | 40 |
| Nugget Sandstone | 0 | --- | --- | --- | 6 | 5 | 2-42 | 59 |
| Thaynes Limestone | 1 | 1 | 12-150* | 81 | 3 | 3 | 20-300 | 365 |
| Woodside Shale | 0 | --- | --- | --- | 2 | 2 | 2-10 | 12 |
| Phosphoria Formation | 1 | 1 | 200 | 200 | 1 | 1 | 300 | 300 |
| Wells Formation | 1 | 1 | 300 | 300 | 0 | --- | --- | --- |
| Total Bedrock Formations | 21 | 7 | 1-1300 | --- | 48 | 41 | 1-700 | 2168 |
| Uncertain | 87 | 25 | 5-811 | 89 | 6 | 3 | 1-50 | 120 |
| Total | 143 | 43 | 1-1930 | --- | 56 | 46 | 1-700 | 4308 |
| Notes: nm = Discharge or yield not measured * This well reports two different yields from separate measurements Sources: US Geological Survey Ground Water Site Inventory (GWSI) database. | ||||||||
Figures 1 - 3 and Table 1 suggest that:
Ground Water Flow
The Alluvial Aquifer is recharged through precipitation, agricultural diversions, and discharge from bedrock aquifers. The USGS (1989) reports that ground water in the Bear River alluvium flows toward or parallel to the Bear River, except where local pumping exists.
Bedrock aquifers are generally recharged by precipitation and flow between aquifers. Ground water generally flows toward springs and streams through aquifer pore spaces or through fractures. The rate and amount of ground water flow in bedrock aquifers is less than flow in the Alluvial Aquifer. The direction of ground water flow in bedrock aquifers is locally controlled by folds and faults. The amount of flow between aquifers and the localized flow direction could not be determined because of a lack of data. However, the general dip (i.e. slant) of the basin is to the east, therefore, water recharging bedrock formations in the Bear River basin may discharge to the Green River basin.
Springs
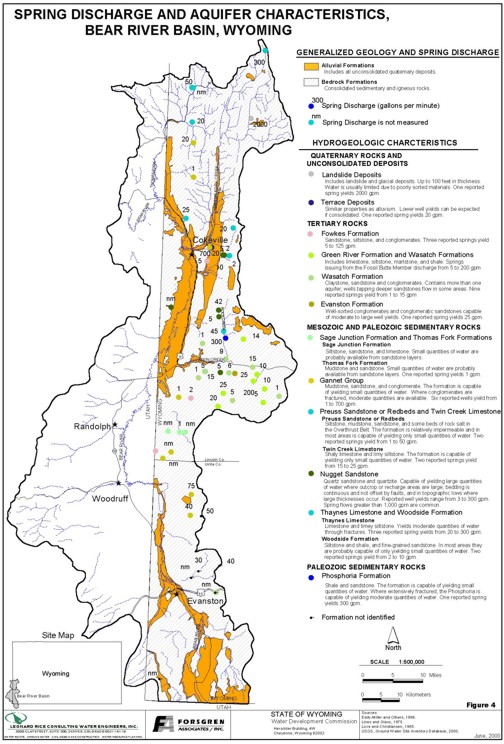
The perennial flow in the Bear River results from ground water discharge from bedrock aquifers to springs or alluvium. The USGS (1996) reports that 35 formations yield small to moderate quantities of water to springs in Lincoln County. Figure 4 shows the spring distribution including:
The Wasatch Formation has the most bedrock springs followed by the Gannet Group and Nugget Sandstone. Table 1 also includes a summary of spring formation and discharge data. Nine springs in the Wasatch Formation discharge between 1 and 15 gpm. Sandstones and conglomerates in the Gannet Group reportedly discharge the most water to streams (total discharge of 837 gpm) from eight springs that reportedly discharge between 1 and 700 gpm. Although no wells are reported to produce from the Nugget sandstone, it has the third highest number of reported springs (6), which yield between 2 and 42 gpm.
According to the USGS database, two springs were measured from alluvial formations. One spring reportedly discharges from a landslide deposit, classified as a Quaternary Unconsolidated Deposit, at a rate of 2000 gpm in the northeastern portion of the study area. The source of this spring may be the underlying Nugget sandstone and not the overlying alluvial formation. Note that other springs exist that are not included in the database.
Storage
Ground water storage is a function of aquifer area and the amount of producible water contained in the pore spaces and fractures. The areal extent of the Bear River alluvium shown on Figures 1, 2 and 4 equals approximately 107,530 acres. Based on information published for other areas, and engineering experience, 20 percent of the alluvial aquifer volume was estimated to be recoverable ground water. The average saturated thickness of 26 wells reportedly completed in the alluvium is 106 feet. Alluvium is thinner along the edges and in the Bear River tributaries. If the average saturated thickness is estimated at 25 feet, the amount of producible ground water in storage is approximately 500,000 acre-feet.
Note that there are many uncertainties associated with estimating the amount of producible ground water from storage. However, the general magnitude suggests that it is significant. No attempt was made to determine the amount of ground water in storage in bedrock aquifers due to the complex geology and lack of aquifer storativity data.
Yield
Yield is defined in terms of well yield and long-term aquifer yield. The long-term aquifer yield is discussed under the ground water development potential later in this memorandum.
Well Yield
Well yield is important to consider when planning the number of wells and amount of storage needed for development. Well yield is the maximum rate at which a well can pump without lowering the water in the well below the pump intake (Freeze and Cherry, 1979). The maximum amount a well can produce is a function of well construction, aquifer characteristics, and the location, number and pumping amounts of nearby wells. Well characteristics include:
Aquifer properties used to determine maximum well yields include aquifer:
Well yield is also a function of how long the well is pumped and the effects of nearby pumping wells. Since these data are scarce, reported well yield data was used as a subjective measure of the physical well potential from various aquifers.
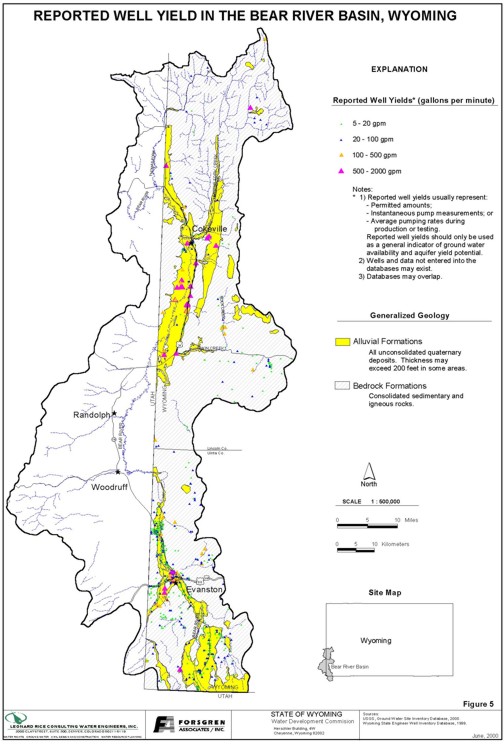
Reported Well Yield
Reported well yields are either permitted amounts; instantaneous measurements by the pump installer (a function of the pump size); or actual long-term test data. Reported well yields are used as a qualitative measure of well yield considering the following qualifying assumptions:
Figure 5 shows reported well yield ranges. Based on the available information, it appears that most high capacity wells (>500 gpm) are completed in the Alluvial Aquifer. The large number of high capacity wells in the vicinity of Evanston confirms that the Alluvial Aquifer is a source of municipal and industrial supply. The city of Evanston has three Alluvial Aquifer wells ranging in depth from 65 to 185 feet that yield between 425 and 730 gpm (Robinove, 1963). There are also six wells in the vicinity of Cokeville that are completed in the Alluvial Aquifer ranging in depth from 117 to 248 feet and yield between 400 and 4,500 gpm (Lines and Glass, 1975; and Robinove, 1963). The even distribution of high capacity alluvial wells south of Cokeville suggests that the Alluvial Aquifer is an important agricultural water supply source in that area.
Most of the low yield wells throughout Unita County that have an identified use in the database are classified as domestic wells. Therefore, the low yields should not be considered a limitation on potential yields of the aquifers. As shown, several high yield bedrock wells also exist in the County. The City of Evanston has a bedrock aquifer well completed in the Wasatch Formation that yields 1,300 gpm (TriHydro, 2000). The GIS coverage can be used to show the range of expected well yields from various geologic formations.
Ground Water Quality
Water Quality data were obtained from the U. S. Geological Survey's Water Quality database, which contains data on approximately 1800 parameters. The USGS provided a database query of wells and springs located in the Bear River Basin that includes 24 water quality parameters that are considered general water quality indicators. The queried database contains 121 water quality analysis records from 57 wells and 49 springs. A GIS coverage was developed from this database that provides a spatial reference for the water quality samples. Twenty-four water quality parameters are reported in the database and corresponding GIS attribute table including:
Wyoming Water Quality Standards
The Wyoming Ground Water Standards report five classes of ground water:
Since agriculture, livestock, domestic, and municipal uses are the primary uses in the basin, water quality results were compared to the Class I - III standards. Table 2 shows the standards for the water quality parameters that were exceeded in at least one well sample (chloride, fluoride, iron, sulfate, and total dissolved solids). The number of samples for water quality parameters other than TDS is too small to base conclusions on, therefore TDS is the only parameter discussed in more detail.
| TABLE 2: Water Quality Standards | |||
| Water Quality Standards | |||
| Parameter | Class I Domestic Mg/L |
Class II Agriculture Mg/L |
Class III Livestock Mg/L |
| Chloride | 250 | 100 | 2000 |
| Fluoride | 1.4–2.47 | --- | --- |
| Iron | 0.3 | 5.0 | --- |
| Sulfate | 250 | 200 | 3000 |
| Total Dissolved Solids (TDS) | 500 | 2000 | 5000 |
| Source: Wyoming Department of Environmental Quality | |||
Total Dissolved Solids
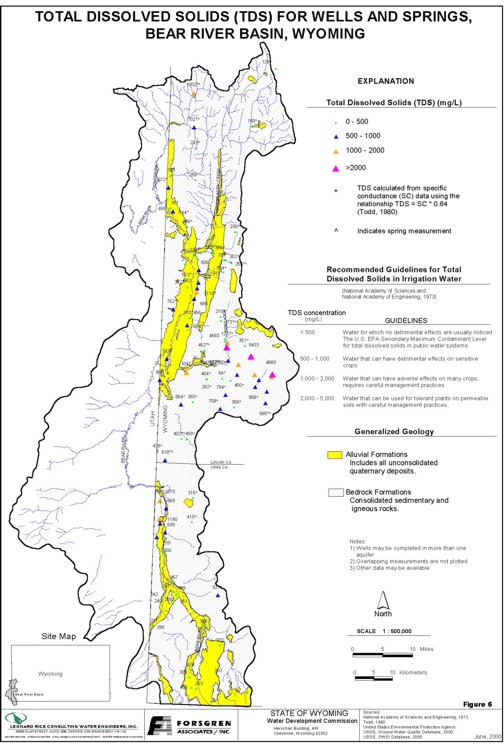
TDS is a measure of the dissolved solid mineral content and is a general indicator of the suitability of water for various uses. The U.S. EPA and the Wyoming Ground Water Standard for TDS in public water systems is 500 mg/L. The Wyoming Ground Water Standard for agricultural use is 2000 mg/L and for livestock use is 5000 mg/L. Table 3 lists the US EPA recommended guidelines for TDS in irrigation water and its effects on crops.
| TABLE 3: RECOMMENDED GUIDELINES FOR TDS IN IRRIGATION WATER* | |
| TDS Concentration (mg/L) | Guidelines |
| <500 | Water for which no detrimental affects are usually noticed. |
| 500 – 1000 | Water that can have detrimental affects on sensitive crops. |
| 1000 – 2000 | Water that can have adverse affects on many crops; requires careful management practices. |
| 2000 – 5000 | Water that can be used for tolerant plants on permeable soils with careful management practices. |
| * National Academy of Science and Engineering, 1973 | |
Table 4 shows TDS sample results from wells and springs completed in various geologic formations. Twenty-four of the results were estimated by multiplying reported specific conductances by a factor of 0.64 (Todd, 1980).
| TABLE 4: AQUIFER TOTAL DISSOLVED SOLIDS FROM WELLS AND SPRINGS | |||||
| FORMATION COMPLETED IN | Number of Samples | Range of TDS | |||
| <500 mg/L |
500-1000 mg/L |
1000-2000 mg/L |
>2000 mg/L | ||
| Alluvial Formations | |||||
| Alluvium (Alluvial Aquifer) | 24 | 16 | 6 | 2 | 0 |
| Landslide | 1 | 1 | 0 | 0 | 0 |
| Terrace Gravels | 8 | 4 | 3 | 1 | 0 |
| Total Alluvial Formations | 33 | 21 | 9 | 3 | 0 |
| Bedrock Formations | |||||
| Evanston | 2 | 0 | 1 | 0 | 1 |
| Fossil Butte Member of Green River | 7 | 1 | 6 | 0 | 0 |
| Fowkes | 3 | 3 | 0 | 0 | 0 |
| Gannet | 8 | 6 | 2 | 0 | 0 |
| Nugget | 6 | 5 | 1 | 0 | 0 |
| Pliocene Series | 2 | 0 | 2 | 0 | 0 |
| Phosphoria | 2 | 0 | 0 | 1 | 1 |
| Preuss Sandstone | 3 | 1 | 1 | 1 | 0 |
| Sage Junction | 1 | 1 | 0 | 0 | 0 |
| Thaynes Limestone | 4 | 4 | 0 | 0 | 0 |
| Thomas Fork | 1 | 1 | 0 | 0 | 0 |
| Twin Creek Limestone | 1 | 1 | 0 | 0 | 0 |
| Upper Cretaceous Series | 2 | 1 | 0 | 1 | 0 |
| Wasatch | 14 | 7 | 4 | 2 | 1 |
| Wells | 1 | 0 | 1 | 0 | 0 |
| Woodside | 2 | 2 | 0 | 0 | 0 |
| Total Bedrock | 59 | 33 | 18 | 5 | 3 |
| Uncertain | 14 | 9 | 2 | 3 | 0 |
| Source: USGS Ground Water Quality Database | |||||
Thirty-three alluvial wells were tested for TDS. TDS concentrations ranged from 190 to 1,030 mg/L.
Fifty-nine wells with TDS analysis were completed in bedrock deposits. TDS concentrations from bedrock wells and springs range from 54 to 5,403 mg/L. As shown in Table 4, only five of the bedrock formations have more than three TDS measurements. Therefore, conclusions cannot be drawn for most of the formations. However, the limited information in Table 4 may suggest that:
Figure 6 highlights the TDS concentrations from wells and springs from the GIS coverage containing the water quality measurement results from the Quality database. This figure shows that TDS concentrations increase from south to north in the Alluvial Aquifer. This is likely a result of high TDS bedrock spring discharge in the Twin Creek Area and increased agricultural return flows. As shown in the Figure 6, measured TDS in the Alluvial Aquifer rarely exceeds the 1,000 mg/L standard for agricultural use.
The following conclusions regarding the Alluvial Aquifer are based on the water quality measurements and corresponding GIS coverage. The Alluvial Aquifer ground water quality:
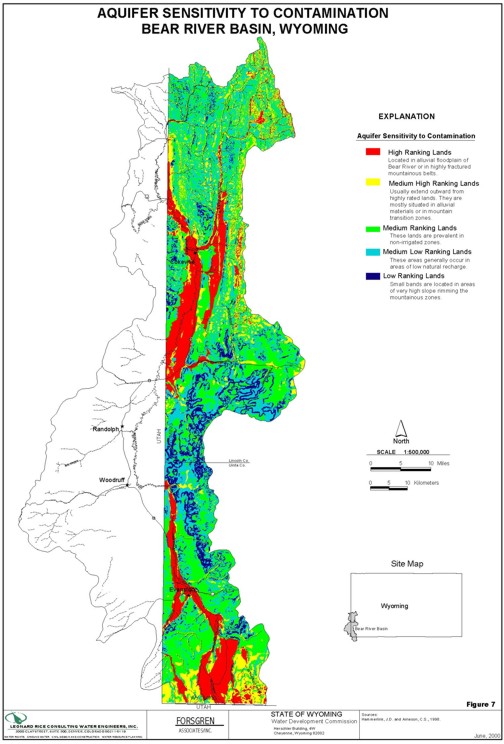
Aquifer Sensitivity/Vulnerability
The Wyoming Department of Environmental Quality in conjunction with the Wyoming Department of Agriculture, University of Wyoming's Spatial Data and Visualization Center, the Wyoming State Geological Survey, and the U.S. EPA developed a system to assess the sensitivity and vulnerability of ground water to surface water contamination. Aquifer vulnerability maps were developed to define the potential for surface contamination to impact ground water in the uppermost aquifer. Figure 7 is a map of aquifer sensitivity to contamination. The highest rated lands are located primarily on alluvial deposits adjacent to rivers, streams, and lakes or in highly fractured bedrock areas. Figure 8 is a map of aquifer vulnerability to pesticide contamination in the uppermost aquifer. Ground water is vulnerable in areas with high water tables, sandy soils, and presumed pesticide application. The areas with the highest vulnerability are found in the floodplains of the major streams.
GROUND WATER DEVELOPMENT POTENTIAL
The ground water development potential is the difference between the existing level of development and the maximum withdrawal rate that is sustainable without causing undesirable impacts.
Impacts for each developed aquifer include:
The physical ability of an aquifer to produce water is a function of the same aquifer properties that are important in determining well yield. In addition, long-term aquifer yield is a function of the amount of recharge that occurs. If pumping exceeds recharge, aquifer dewatering (lowering water table) will result and yields will diminish. Recharge includes:
Any reduction in these inflows will eventually reduce the long-term yield and development potential of ground water in the basin.
Bear River Alluvial Aquifer Long-term Yield
Wells in the Bear River Alluvial Aquifer can sustain high well yields because aquifer drawdown is minimized by recharge from Bear River surface water. Because of this, long- term well yield is probably not constrained by declining water levels. Additional aquifer development is possible as long as water from the Bear River is available for recharge. The amount of additional development depends on whether existing water rights and interstate compacts are satisfied.
Water quality issues may constrain long-term yields in the future. Increased agricultural use could degrade ground water quality through the introduction of fertilizer and other contaminants to the alluvial aquifer. Municipal effluent recharge may also degrade aquifer water quality. Although no significant decline in ground water quality has been reported, it may limit ultimate development.
Bedrock Aquifer Long-term Yield
Limited recharge and relatively low permeability are the primary reasons why bedrock aquifers have low well yields and low long-term aquifer yields. Away from streams, bedrock aquifer recharge consists of effective precipitation and seepage between aquifers. These amounts are usually low. Therefore, additional bedrock development could exceed these inflows and cause unacceptable water level declines or reduced spring yields.
Spring discharge can be used as subjective measure of long-term aquifer yield. Table 1 shows measured spring discharge from individual aquifers. Although these measurements do not represent all spring discharge in the basin, they can be assumed to represent the minimum aquifer recharge.
The sum of measured spring discharges from the Gannet Group is 837 gpm. If this is assumed to be a conservative measure of aquifer recharge, 837 gpm of additional water may be available to wells without causing significant aquifer water level declines. Likewise, the sum of the other measured spring discharges from bedrock aquifers is around 4300 gpm, so conservatively 4300 gpm, or around 7,000 acre-feet per year, may be available for future development.
In other studies of western basins, long-term bedrock aquifer yield has been estimated to be equal to the effective precipitation recharge (precipitation that reaches the ground water system). A conservative estimate of effective precipitation is around 2 percent of the average basin precipitation of 11 inches, or 14,000 acre-feet per year. The precipitation and the distribution of recharge varies, however, 14,000 acre-feet per year is believed to be a better minimum recharge estimate than 7,000 acre-feet per year.
Like Alluvial Aquifers, the ground water development potential for bedrock aquifers is also constrained by depletions to the surface water system caused by pumping. Additional withdrawals could reduce spring discharges to unacceptable levels. Under certain conditions, bedrock pumping can immediately reduce spring flows even if the well is located several miles away. Bedrock pumping also reduces the amount of subsurface recharge to the Alluvial Aquifer, which discharges into the Bear River. Depletions caused by bedrock well pumping usually occur over a longer time scale and depend on how hydraulically connected the aquifer is to the surface water system. In general, bedrock well depletions take longer to occur the further away (distance and depth) the well is from the surface water system.
Water quality issues also can constrain future bedrock aquifer development. Pumping an aquifer with good water quality could induce recharge of poorer quality from another aquifer. In addition, the presence or development of oil, gas and minerals could influence ground water quality and development.
CONCLUSIONS
Much of the effort associated with the ground water resource investigation was spent developing spatial data tools, i.e. GIS coverages. These tools were then used, along with information from previous studies, to generalize the existing aquifer development and to estimate development potential. These tools are useful for water administrators, decision- makers, and others interested in future development potential in the Bear River basin. The GIS coverages should be updated as additional ground water information is developed or existing data from other sources becomes available.
The ground water development potential is the difference between the level of existing development and the maximum sustainable withdrawal rate that does not cause undesirable impacts. Based on the available data and existing studies, it appears that no significant undesirable affects have yet occurred in the basin and that water is available for additional development.
Sources:
Ahern, J., Collentine, M., and Cooke, S. Occurrence and characteristics of ground water in the Green River Basin and Overthrust Belt, Wyoming. Water Resources Research Institute, University of Wyoming, 1981.
Eddy-Miller, Cheryl A., Plafcan, Maria, and Clark, Melanie L. Water Resources of Lincoln County, Wyoming. U.S. Geological Survey, Water-Resources Investigations Report 96-4246, 1996.
Eddy-Miller, Cheryl A., and Norris, Jodi R. Pesticides in Ground Water – Lincoln County, Wyoming, 1998-99. U.S. Geological Survey, Fact Sheet 033-00, March, 2000.
Glover, Kent C. Stream-Aquifer System in the Upper Bear River Valley. USGS Water Resources Investigations Report 89-4173, 1989.
Hamerlinck, J.D., and Arneson, C.S., editors. Wyoming Ground Water Vulnerability Assessment Handbook, Volume 1: Background, Model Development, and Aquifer Sensitivity Analysis. Spatial Data and Visualization Center Publication, SDVC 98- 01-1, University of Wyoming, Laramie Wyoming, 1998.
Hamerlinck, J.D., and Arneson, C.S., editors. Wyoming Ground Water Vulnerability Assessment Handbook, Volume 2: Assessing Ground Water Vulnerability to Pesticides. Spatial Data and Visualization Center Publication, SDVC 98-01-2, University of Wyoming, Laramie Wyoming, 1998.
Lines, G.C. and Glass, W.R. Water Resources of the Thrust Belt of Western Wyoming. U.S. Geological Survey Hydrologic Investigations Atlas HA-539, 1975.
Love, J.D. and Christiansen, A.C. Geological Map of Wyoming. U.S. Geological Survey, Scale 1:500,000, 1985.
Love, J.D. and Christiansen, A.C., and Ver Ploeg, A.J. Stratigraphic Chart Showing Phanerozoic Nomenclature for the State of Wyoming. Geological Survey of Wyoming Map Series 41, 1993
National Academy of Sciences and National Academy of Engineering. Water Quality Criteria. U.S. Environmental Protection Report, EPA-R3-73-033.
Ogle, Kathy Muller, Eddy-Miller Cheryl A., and Busing, Christopher J. Estimated Use of Water in Lincoln County, Wyoming, 1993. USGS Water Resources Investigations Report 96-4162., 1996.
Robinove, Charles J. and Berry, Delmar W. Availability of Ground Water in the Bear River Valley -with a section on Chemical Quality of the Water, by John G. Conner, (USGS Water Supply Paper 1539 V., 1962.
Roehler, H.W. Introduction to Greater Green River Basin Geology, Physiography, and History of Investigation U.S.G.S. Professional Paper 1506-AS, 1992
Todd, David Keith. Groundwater Hydrology, Second Edition. New York, NY: John Wiley & Sons, Inc., 1980.
TriHydro Corporation. Hydrogeologic Report: North Uinta County Improvement and Service District Water Supply Master Plan Uinta County, Wyoming. TriHydro Corporation, 2000.
TriHydro Corporation. Phase I Report: Level II Feasibility Study Ground-Water Alternatives Investigation Cokeville, Wyoming. TriHydro Corporation, 1992.
TriHydro Corporation. Phase II Report: Well Construction and Testing Program Level II Feasibility Study Cokeville, Wyoming. TriHydro Corporation, 1993.
United States Geological Survey. Wyoming Ground Water Site Inventory Database, Bear River Basin, Wyoming Subset, 2000.
United States Geological Survey. Wyoming Water Quality Database, Bear River Basin, Wyoming Subset, 2000.
Wyoming Department of Environmental Quality. Quality Standards for Groundwaters of Wyoming. Wyoming Department of Environmental Quality, Chap. VIII, P. 87, 1993.
Wyoming State Engineer's Office. Wyoming Well Permits Coverage. Spatial Data and Visualization Center, August, 1999.
Wyoming State Engineer's Office. Wyoming Water Rights. Wyoming State Engineer, 1999.