Wyoming State Water Plan
Wyoming State Water Plan
Wyoming Water Development Office
6920 Yellowtail Rd
Cheyenne, WY 82002
Phone: 307-777-7626

Wyoming Water Development Office
6920 Yellowtail Rd
Cheyenne, WY 82002
Phone: 307-777-7626


| SUBJECT: |
Appendix Q Future Economic and Demographic Scenarios |
| PREPARED BY: | Edward Harvey and Doug Jeavons, BBC Consulting |
| DATE: | October 6, 2000 |
Introduction
This memorandum describes economic and demographic projections for the Bear River Basin (Basin) under three alternative scenarios. The study team's economic and demographic projections for the Basin are addressed as follows:
This memorandum is one of four that comprise the water demand projections for the Basin. An overview of economic and demographic conditions in the Basin, and more specific description of current conditions in key economic and water use sectors, was provided in Memo 1. The third memorandum describes the future water demand projections, based upon the economic and demographic projections detailed in this memorandum. Memo 4 offers projections of recreational water needs.
Approach
There are numerous approaches to developing economic and demographic projections for a regional economy, ranging from simple statistical extrapolation to sophisticated econometric modeling. The projection approaches vary in terms of complexity, the amount of information they convey, and the amount of data they require. The following paragraphs provide a description of existing economic and demographic projections for the Bear River Basin area and the study team's assessment of the appropriateness of those projections for the purposes of this study. This section concludes with an overview of the forecasting approach adopted by the study team, and reviewed by the Wyoming Water Development Commission, and an overview of the three planning scenarios that drive the subsequent projections.
Review of Existing Projections. The study team reviewed a number of existing economic and demographic projections for potential suitability for use in this study. These projections come from various sources, including:
Exhibit 1, below, provides a summary of the review of each existing economic and demographic projection.
Exhibit 1. Alternative Economic and Demographic Techniques
Potentially Applicable to the Bear River Basin
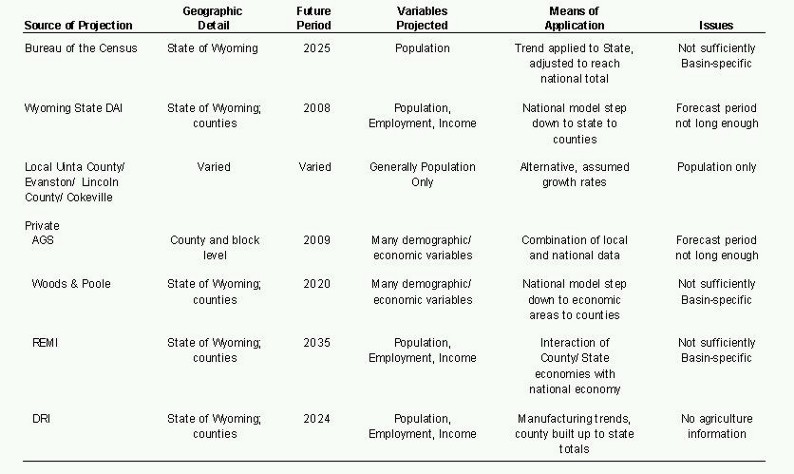
Economic Base Methodology. The economic and demographic projection approach adopted by the study team for this effort employs an established technique in regional economics known as “economic base analysis.” The economic base approach is a "bottom-up" method that has the advantages of focusing directly on specific activities that are likely to drive economic and demographic changes in the future and providing a substantial level of detail about those activities in the future, while at the same time being less data intensive than econometric modeling approaches. Essentially, this approach involves the following five steps:
Economic Base High Case Scenario. In the simplest terms, the economic base high case scenario incorporates the study team's views of the most growth in each of the key sectors that is reasonably likely to occur over the forecast horizon. It is remotely possible that one or more of the key sectors could grow even more than we have assumed under this case or an unforeseen, new basic economic activity could become established and flourish in the region. However, because this scenario incorporates the aggressive assumption that each of the key sectors will achieve its highest reasonably likely growth at the same time, the study team believes this scenario represents a useful upper bound for subsequent water planning purposes.
Economic Base Low Case Scenario. The economic base low case scenario embodies the study team's views of the lowest growth (or largest contraction) reasonably likely to occur in each of the key sectors over the planning horizon. While even lower economic activity levels in one or more sectors are not impossible, the assumption of simultaneous low activity levels in each of the key sectors makes this scenario a supportable lower bound for planning purposes. While the low scenario obviously will not impose pressure on regional water resources, this scenario is sometimes used for purposes of determining the financial risk involved with potential water resource enhancements.
"Top-Down" Population Projection Scenario. The third scenario incorporated in this study involves a substantially different approach than the economic base scenarios. This scenario approach, also being incorporated into one of the scenarios developed in the Green River Basin Plan, focuses on total population projections for the region based upon the existing Bureau of Census projections for the State of Wyoming and the DAI projections of county population through 2008 (discussed earlier in Exhibit 1). While this approach does not directly provide information about employment levels or activity levels in specific sectors, future water demands can be related to the scenario either by interpolation based upon total population comparisons to the more specific economic base scenarios (the method employed in this study) or through independent projections of non-municipal water use in agriculture, industry and other activities (the method employed by the Green River Basin study team).
As discussed at the conclusion of this memo, the top-down approach ultimately resulted in a projected level of population growth that falls between the two economic base scenarios. While this result makes the top down approach, in effect, the middle scenario, it is important to recognize that none of the three scenarios should be viewed as the most likely future scenario.
Economic Base Scenario Assumptions for Key Sectors – Agriculture
Local interviews and research into both historic agricultural practices and competing environmental interests provide insight into potential factors that may influence the future of agriculture in the Bear River Basin. Potential factors that could significantly impact agriculture within the Basin include public land grazing policies and the potential development of a wildlife refuge near Cokeville, in Lincoln County. The following are summary observations about prospects for Bear River Basin agriculture in the future.
A detailed assessment of the agricultural impacts of the proposed refuge is laid out in the FWS’s Draft Environmental Impact Statement. Impacts on irrigated acreage include a stipulation that 25%, or approximately 3,024 acres of wet meadow hay acreage, be removed from production within the fee acquisition area (DEIS 1990, p. 14). In addition, although local ranchers will continue to crop 1,800 acres of meadow, 400 acres of this will be converted to small grain production as protection against waterfowl crop depredation (DEIS 1990, p. 14). Full refuge implementation will also result in the potential loss of an estimated 6,300 tons of forage on wet meadow haylands that is currently available to ranchers for aftermath grazing in the fall months (DEIS 1990, p. 121).
The CMWR has been open since 1993, but acreage acquisition for the refuge has been a slow process. Currently, the FWS has purchased or maintains easements on roughly 8,000 of the planned 26,657 acres in the refuge. The primary reasons for the slow rate of land acquisition are inconsistent agency funding sources and resistance on the part of local ranchers to sell their land (Damberg). Acquired acreage currently is being leased back to ranchers, with no real change in land or water use on the acreage. Any future water use impoundments for wildlife would require proof for the State of Wyoming that no current water users would be injured by such impoundments (Willis).
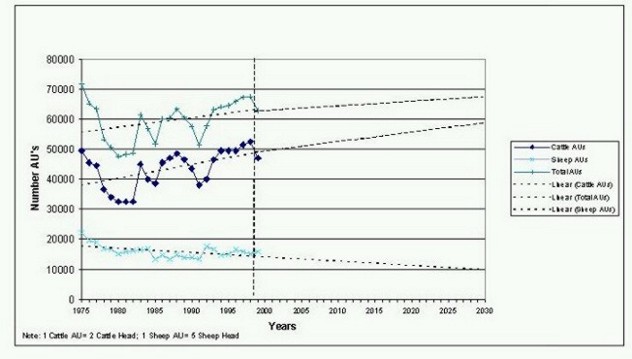
Since livestock are the most important cash crop of the Basin agricultural sector, BBC’s analysis of agricultural sector water use is based largely on livestock inventory data for Lincoln and Uinta Counties (Wyoming Agricultural Statistics Service). In order to standardize the analysis in terms of livestock forage levels, county level livestock inventories were converted to “Animal Units.” This metric is equal to the sum of cattle inventories divided by two and sheep inventories divided by five, and represents a measure of the average livestock inventory. Using trend analysis, total animal units were then projected from the last year of historical data (1999) to the end of the planning horizon (2030).
In order to scale the analysis from the county to the basin level, estimated trends are applied to Basin-specific allotment data, obtained from the BLM, on the stocking capacity of each allotment within the Basin as measured in animal unit months (AUM’s). AUM’s are then converted to Animal Units by dividing by the average length of time that livestock spend grazing on public rangeland (3.59 months). A key assumption is that the change in livestock inventory in the Basin follows the same time- trend as inventories in the rest of Lincoln and Uinta counties.
The irrigated hay acreage analysis assumes a long-term relationship between producer decisions about livestock stocking levels and irrigated hay production. Using trend analysis, this estimated relationship was applied to the projected livestock trends from the previous step. The resulting trends are then applied to GIS-estimated, 1998 irrigated acreage levels for the Basin (Leonard Rice Consulting Water Engineers) to project changes in irrigated acreage over the planning horizon.
Exhibit 2. Projected Animal Units: Bear River Basin Counties
(High Scenario)
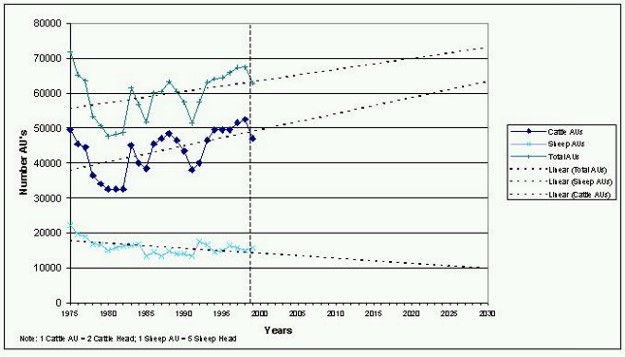
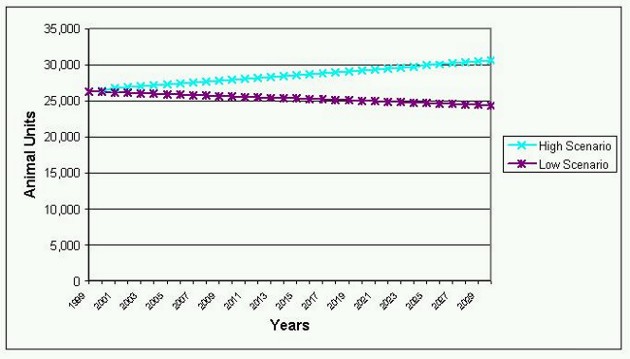
Under this scenario, BBC projects a total of about 31,000 animal units will be grazed in the Basin at the end of the planning horizon. Basin-level projections for the both the High Scenario and the Low Scenario (discussed later) are depicted in Exhibit 3.
Exhibit 3. Projected Animal Units: Bear River Basin
(With Cokeville Meadows Refuge)
Under the high scenario irrigated hay acreage will slightly increase from current levels for the duration of the thirty-year projection period (See Exhibit 4). Specifically under the high scenario, BBC projects a total of about 69,000 acres of irrigated hay within the Basin in the year 2030. This more gradual rate of increase for irrigated acreage, relative to the projected livestock inventory growth rate, reflects continuation of the historic trend of a gradual increase in livestock levels per irrigated acre.
Exhibit 4. Projected Acres Irrigated Hay: Bear River Basin
(With Cokeville Meadows Refuge)
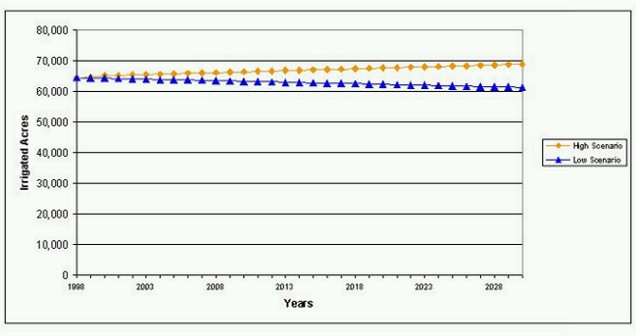
Exhibit 5. Projected Animal Units: Bear River Basin Counties
(Low Scenario, Without Cokeville Meadows Refuge)
The second important assumption for the Low Scenario is that the CMWR will be fully implemented according to the plan detailed in the DEIS by the end of the planning horizon. Implementation of the CMWR results in a reduction of about 4,000 Basin animal units by 2030. Under this scenario, BBC projects a total of slightly more than 24,000 animal units will be grazed in the Basin at the end of the planning horizon.
Under both assumptions that constitute the Low Scenario, irrigated hay acreage within the Basin declines gradually over the 30 year planning horizon (see Exhibit 4 above). Specifically under the low scenario, BBC projects a total of just over 61,000 acres of irrigated hay within the Basin in the year 2030. This result stems from the livestock projections for this scenario and assumed continuation of historical increases in the number of animal units per irrigated hay acre within the Basin. In addition, full implementation of the CMWR implies that about 3,400 acres of irrigated hay within the Basin will be taken out of production.
Historic trends and local interviews both provide indications of potential future changes in Bear River Basin oil and gas production. In light of the considerable attention focused on Coalbed Methane production in other parts of Wyoming in recent years, the study team also evaluated the potential for this type of activity in the Bear River Basin. The following are summary insights into the prospects for energy production and related activities in the future.
Exhibit 6. Historical Natural Gas Production, BCF,
1979-1999 for Major Wyoming Counties
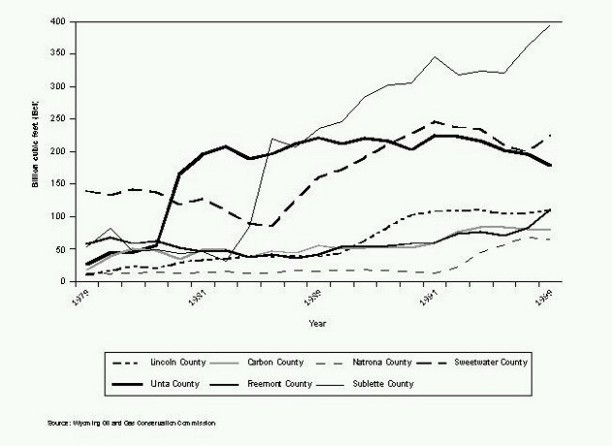
Wyoming's natural gas production is being accounted for by younger fields in Sweetwater and Sublette counties. Under the low scenario, Wyoming natural gas production will increase from about 1.2 Tcf to about 3.0 Tcf by 2030, however Basin natural gas production will be exhausted in approximately 2027. Historic and low scenario production for the Basin and the State of Wyoming are depicted in Exhibit 7.
Exhibit 7. Natural Gas Production – Low Case
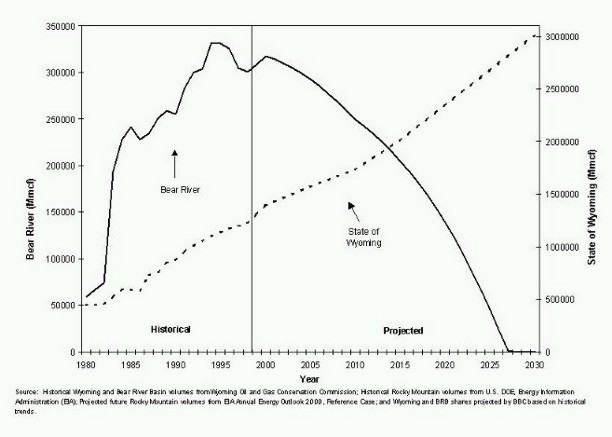
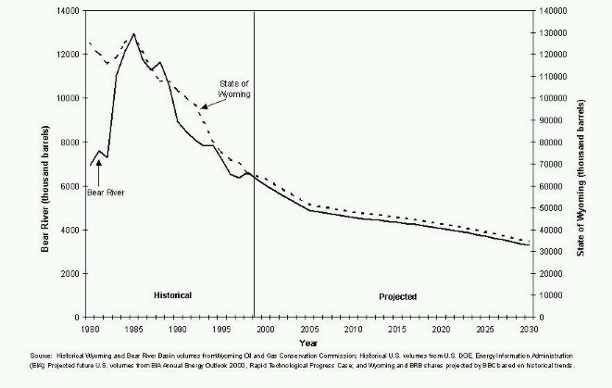
Exhibit 8. Natural Gas Production – High Case
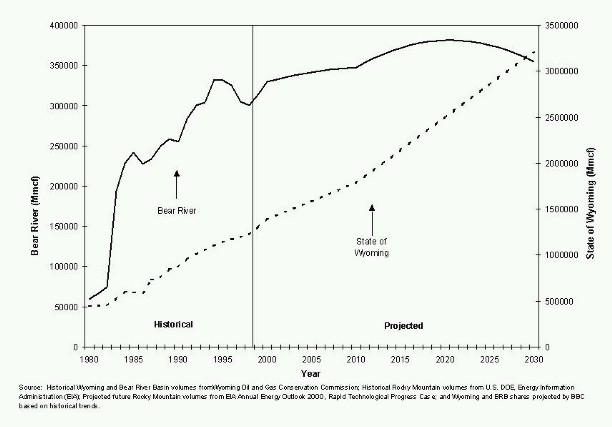
Exhibit 9. Crude Oil Production – Low Case
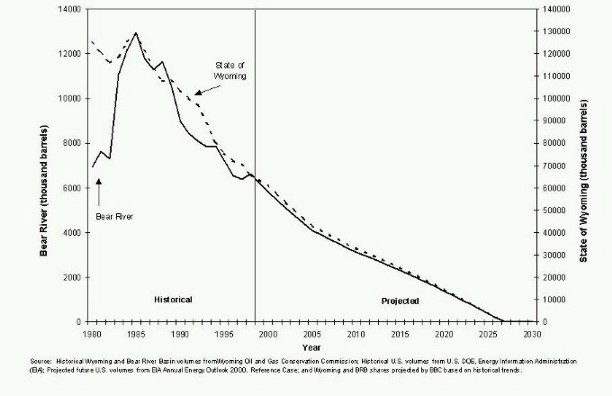
Exhibit 10. Crude Oil Production – High Case
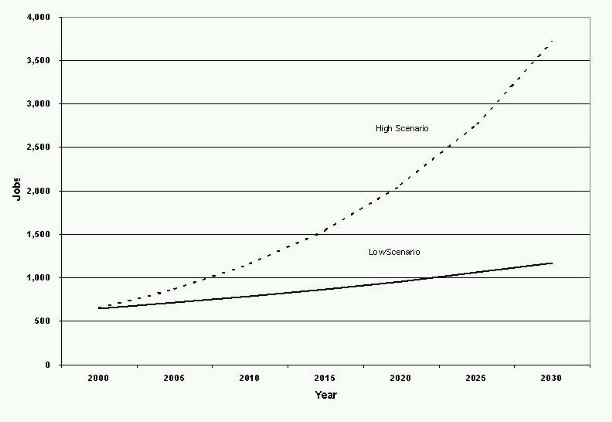
Local interviews indicate that several factors are likely to impact the level of future tourism/visitor related activity in the Basin. Specifically, the continued population growth in the nearby Salt Lake City Metropolitan Area, the increases in traffic on Interstate 80 and the Evanston area's efforts to become a more frequent overnight or destination location for tourists should all serve to increase the size of the tourism/visitor sector of the Evanston economy. The following are summary insights into the prospects for tourism and visitor related activities in the future, as well as a description of the underlying assumptions for the high and low scenario projections.
Exhibit 11. Number of Visitors, Evanston, WY
Visitor Expenditures and Jobs Supported by Tourism – High Scenario
| Number Visitiors |
Total Visitor Expenditures ($Millions) |
Number Jobs Supported | |
| Total Overnight | 801,164 | $38.5 | 1,219 |
| Peak | 363,748 | $17.4 | 552 |
| Off Peak | 437,415 | $21.1 | 667 |
| Total Pass Through | $9.0 | 297 | |
| Peak | $2.8 | 94 | |
| Off Peak | $6.2 | 203 | |
| Grand Total | $47.5 | 1,516 | |
| Peak | $20.3 | 645 | |
| Off Peak | $27.3 | 871 | |
| *Peak Months are June, July and August Off-Peak months are the rest of the year Source: Based on Wyoming Department of Transportation Traffic Projections | |||
Exhibit 12. Number of Visitors, Evanston, WY
Visitor Expenditures and Jobs Supported by Tourism – Low Scenario
| Number Visitiors |
Total Visitor Expenditures ($Millions) |
Number Jobs Supported | |
| Total Overnight | 529,000 | $25.4 | 810 |
| Peak | 240,000 | $11.5 | 360 |
| Off Peak | 289,000 | $13.9 | 440 |
| Total Pass Through | $7.2 | 240 | |
| Peak | $2.3 | 70 | |
| Off Peak | $4.9 | 160 | |
| Grand Total | $32.6 | 1,040 | |
| Peak | $13.8 | 440 | |
| Off Peak | $18.8 | 600 | |
| *Peak Months are June, July and August Off-Peak months are the rest of the year Source: Based on Wyoming Department of Transportation Traffic Projections | |||
Economic Base Scenario Assumptions for Key Sectors –
Manufacturing/Other Basic Employment
Apart from traditional economic base activities in agriculture, energy and tourism, the Bear River Basin, and the Evanston area in particular, have recently attracted a number of firms manufacturing goods or providing business services to customers outside the region. This component of the local economic base is still in the relatively early stages of development and is, consequently, more difficult to characterize and project than the more traditional components of the local economic base. Given continued growth of the Salt Lake City area's economy and Evanston's economic development strengths as a proximate, but non-metropolitan alternative to location on the Wasatch Front, these activities are likely to become increasingly important to the local economy in the future. The following insights were developed from local interviews and interviews with the Wyoming Business Council, as well as analysis of economic data for Uinta County published by the BEA-REIS.
Exhibit 13. Average Annual Increase In Manufacturing Employment
1969-1997
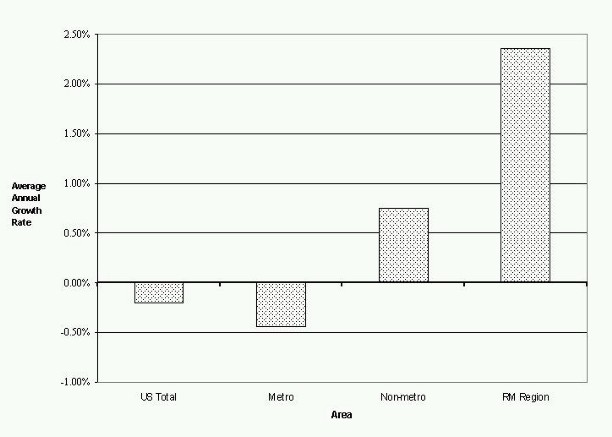
Exhibit 14. Manufacturing Employment 1969-1997,
3 Year Moving Average
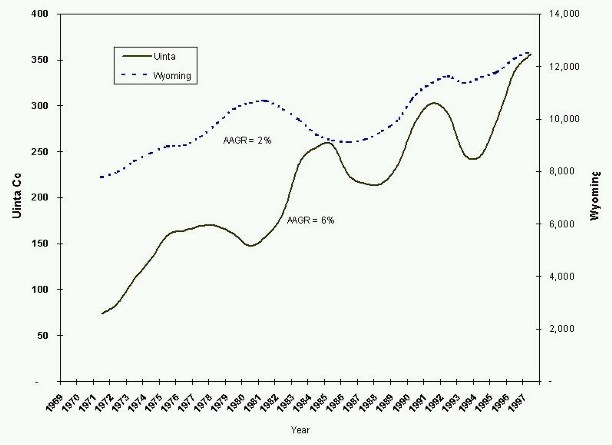
Exhibit 15. Projected Basin Employment in Manufacturing &
Non-Local Commercial Sectors
(Excluding Tourism/Agriculture and Energy Related Firms)
Overall Economic and Demographic Projections
The preceding evaluations and assumptions were incorporated into a model of Bear River Basin employment and population in order to develop aggregated estimates of total residents and total jobs in 2030 under the Economic Base High Scenario and Economic Base Low Scenario. As indicated previously, a third scenario of total population growth was developed using an alternative, top-down, approach. The following text describes the development of overall economic and demographic projections for the Bear River Basin in 2030.
Projected Total Employment in 2030. Under the assumptions regarding changes in key economic activities described earlier in this memo, the study team projects that Bear River Basin basic employment under the high case scenario will increase from about 4,165 jobs at present to a little over 9,000 jobs by 2030. This increase would be largely driven by growth in tourism related employment and manufacturing and business services as well as relative stability in energy related employment in the Basin, as shown in Exhibit 16. Net out-commuting of Basin residents to jobs in other locations is also projected to rise, reflecting both a continuation of substantial current commuting to mining jobs in Sweetwater County and an increase in commuting to jobs in resort areas and metropolitan Utah.
At present the ratio, or multiplier, between direct basic employment and total employment in the Uinta County portions of the basin is estimated to be approximately 2.5 – indicating that each basic job supports approximately 1.5 additional jobs in local services. This figure is within the range of multipliers the study team has examined in other, similarly situated and sized economies in other parts of the Rocky Mountain Region, although it is towards the higher end of the range. The relatively large multiplier likely reflects both the Evanston area's role as a center for trade and services in the region and, especially, the high wages paid in the local energy sector. Given the smaller proportion of the 2030 economic base accounted for by the energy sector, the study team believes it is likely the basic to total employment multiplier will decrease from 2.5 to approximately 2.3.
Exhibit 16. Current and Projected Employment Breakdown
in Bear River Basin
| Current Employment Bear River Area Only |
2030--High Scenario Bear River Area Only |
2030--Low Scenario Bear River Area Only | ||||
| Uinta Co | Lincon Co | Uinta Co | Lincon Co | Uinta Co | Lincon Co | |
| Basic Employment | ||||||
| Agriculture | 260 | 265 | 260 | 265 | 245 | 230 |
| Tourism/Visitor Related | 640 | 50 | 1,500 | 130 | 1,040 | 100 |
| Energy Related | 900 | 0 | 900 | 0 | 0 | 0 |
| Other Industry (Manuf./Bus. Services) | 650 | 0 | 3,700 | 100 | 1,170 | 0 |
| Highway/Railroad Construction and Service | 100 | 0 | 100 | 0 | 100 | 0 |
| State/Federal Government | 500 | 0 | 500 | 0 | 500 | 0 |
| Net Outcome | 800 | NA | 1,500 | NA | 1,200 | NA |
| Subtotal | 3,850 | 315 | 8,460 | 495 | 4,225 | 330 |
| Indirect Basic/Local Service Employment |
||||||
| Subtotal | 5,650 | 185 | 11,000 | 300 | 5,530 | 200 |
| Total Employment | 9,500 | 500 | 19,460 | 795 | 9,785 | 530 |
| Total Employment/Direct Basic Ratio* |
2.5 | 1.6 | 2.3 | 1.6 | 2.3 | 1.6 |
Projected Total Population in 2030. For the high and low scenarios developed through the economic base projection approach, projections of total Bear River Basin population were derived from the preceding employment projections. Deriving the population estimates from the projected employment totals for the Basin required four steps:
Exhibit 17. Employment and Population Projections for Bear Rive Basin
(Numbers Reflect Only Portions of Counties Within Basin)
| 1999 | 2030--High | 2030--Low | ||||
| Uinta Co | Lincon Co | Uinta Co | Lincon Co | Uinta Co | Lincon Co | |
| Estimated/Projected Jobs | 9,500 | 500 | 19,496 | 740 | 9,800 | 530 |
| Estimated/Projected Employed Persons* | 6,770 | 390 | 13,890 | 580 | 6,980 | 410 |
| Umemployment Rate | 6.9% | 6.2% | 6% | 6% | 6% | 6% |
| Labor Force | 7,270 | 420 | 14,780 | 620 | 7,430 | 440 |
| Labor Force Participation Rate | 83% | 70% | 75% | 70% | 75% | 70% |
| Population Age 16 or Older | 8,760 | 600 | 19,710 | 890 | 9,910 | 630 |
| Proportion of Population 16 or Older | 63% | 63% | 70% | 70% | 70% | 70% |
| Total Population | 13,900 | 940 | 28,160 | 1,270 | 14,160 | 900 |
| *Number of employed persons is less than number of jobs due to multiple jonholding by individual | ||||||
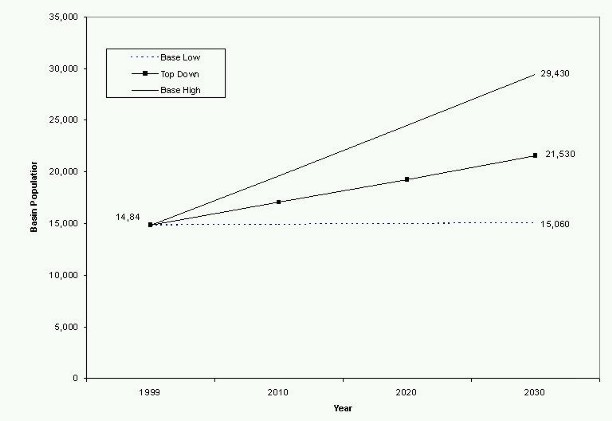
Projected Population Under The "Top Down" Scenario. As discussed earlier in this memorandum, the study team developed a third set of population projections for the Bear River Basin by incorporating information from the Census Bureau's long-term projections for the State of Wyoming as well as the relative growth rates projected for Wyoming cities and counties through 2008 by the Department of Administration and Information. Under this scenario, the Bear River Basin is projected to have 21,530 residents in 2030.
Exhibit 18, below, provides a graphic depiction of the three alternative population projections for the Bear River Basin.
Exhibit 18. Alternative Population Projections for Bear River Basin
Summary
The study team projected three future scenarios for economic and demographic growth in the Bear River Basin, through the year 2030. Two of the scenarios employed an economic base modeling approach, in which prospects for key sectors that either bring money into the region and/or are the source of substantial water use were analyzed in detail. Based upon these analyses, a low and high case alternative forecast was developed for each key sector. Total employment, and corresponding population, was then estimated based upon the key sector projections. The third scenario employed an alternative, top down approach. This scenario, which became the middle case, involved developing a local population forecast based upon the U.S. Department of Commerce, Bureau of Census projections for the State of Wyoming as a whole and the Wyoming Department of Information and Administration, Division of Economic Analysis. Each of these three alternative scenarios is equally likely to occur.
The three scenarios portray markedly different potential futures for the region. Under the high case scenario, activity and employment in the energy producing sector would remain relatively stable, agricultural production and irrigated acreage would increase modestly, and there would be substantial growth in tourism related employment and, especially, in new manufacturing and commercial activities targeted toward customers outside the region. Under the low case, there would be modest declines in agriculture due to public land grazing availability and implementation of the Cokeville Meadows Wildlife Refuge, energy activity would essentially cease by 2030, and growth in tourism and manufacturing/commercial activity would essentially be just sufficient to offset the loss of jobs in the energy sector.
Projected Bear River Basin population in 2030 under the high case would exceed 29,000 residents, compared with about 21,500 residents under the middle case and a little more than 15,000 residents under the low case, which is similar to year 2000 Basin population.
References
Applied Geographic Solutions, Inc. PCensus data product, 2000.Personal Interviews/Written CommunicationsCokeville Meadows National Wildlife Refuge Proposal, Final Environmental Impact Statement, June 1992.
Proposed Cokeville Meadows National Wildlife Refuge, Draft Environmental Impact Statement, October 1990.
Cumberland/Uinta Allotment Cooperative Management Plan, Bureau of Land Management, Wyoming State Office, January 2000.
Interview with Ken Klinker, Uinta County Development Coordinator, May 2000.
Interview with Paul Knopf, City of Evanston Community Development Director, May 2000.
Interview with Eugene Joyce, City of Evanston Economic Development Director, May 2000.
Interview with Gurn Brown, University of Wyoming, Lincoln County Cooperative Extension, May 2000.
Interview with Michael K. DeBerry, Wyoming Asset Manager, Chevron USA Production Company, May 2000.
Interview with Brian Honey, City of Evanston, City Engineer, May 2000.
Interview with Stan Thompson, Cokeville City Council, May 2000.
Interview with Len Wooley, Wyoming Business Council, Regional Director -- Southeast Region, July 2000.
Kemmerer Resource Management Plan, Kemmerer Resource Area, Rock Springs District, Bureau of Land Management, April 1986.
Map of Irrigated Lands, Bear River Basin, Wyoming, Leonard Rice Consulting Water Engineers Inc./ Forsgren Associates, Inc., June, 2000.
National Agricultural Statistics Service, Published Online Estimates Database, /www.nass.usda.gov:81/ipedb/.
Smithsfork Allotment Draft Interim Management Plan, Bureau of Land Management, April 2000.
U.S.Department of Agriculture, Census of Agriculture, 1997.
U.S. Department of Commerce, Bureau of Census, 1990 Census of Population and Housing.
U.S. Department of Commerce, Bureau of Economic Analysis, Regional Economic Information System, 1999.
U.S. Department of Energy, Energy Information Administration, historic state, regional and national natural gas and petroleum production statistics, 2000.
U.S. Department of Energy, Energy Information Administration, Annual Energy Outlook, projected energy demand by source of supply and producing region, 2000.
Wyoming Agricultural Statistics, 1999, Wyoming Agricultural Statistics Service.
Wyoming Department of Administration and Information, Division of Economic Analysis, 2000 municipal population projections, 2000.
Wyoming Oil and Gas Conservation Commission, Natural Gas and Petroleum Production Statistics by County, various years.
Wyoming Department of Health, Vital Statistics, various years.
Birge, Dave, Wyoming Department of Transportation.Data SourcesElliot, Shawn, Mountain Land Association of Governments.
Festin, Scott, Wasatch Front Regional Council of Governments.
Hyde, Jamie, Utah Governor’s Office of Planning and Budget.
Joyce, Eugene, Economic Development Director, City of Evanston.
Knopf, Paul, Community Development Director, City of Evanston.
Madia, Mark, Executive Director, Evanston Chamber of Commerce.
Marsh, Susan, Recreation Specialist, USFS, Bridger-Teton National Forest.
Noble, Dan, Administrator, Wyoming Department of Revenue.
Bureau of Economic Analysis, Full and Part-Time Employment by Industry, Uinta County, Wyoming. Published on the web at URL: www.bea.doc.gov/regional/reis/ca25/ca25_56041.htm.County Population Projections for the Wasatch Front Region, Utah Governor’s Office of Planning and Budget. Published on the web at URL: www.governor.state.ut.us/dea.
Report on the Economic Impact of the Travel Industry in Wyoming, 1999, Morey and Associates/ Department of Economics, University of Wyoming.
Uinta County IMPLAN coefficients. (cite?)
Wyoming Department of Revenue, Monthly Net Sales Tax Distributions by County for FY-99 and FY-00, Excise Tax Division, Published on the web at URL: revenue.state.wy.us/exciseframe.htm.
Wyoming Department of Transportation, Monthly Summary, Automatic Traffic Recorder, Evanston East Station, January 1999 through December 1999.