Wyoming State Water Plan
Wyoming State Water Plan
Wyoming Water Development Office
6920 Yellowtail Rd
Cheyenne, WY 82002
Phone: 307-777-7626

Wyoming Water Development Office
6920 Yellowtail Rd
Cheyenne, WY 82002
Phone: 307-777-7626


6.1 Historic and Current Economic and Demographic Conditions
The starting point for the development of water demand projections requires an understanding of the current economic and demographic conditions in the basin. The identification of historic changes and trends in the basin, plus the evaluation of the most important sectors from an economic and water use standpoint, helped define the emphasis for future economic and demographic scenarios. A detailed analysis of historic and current economic conditions is described in the "Historic and Current Economic and Demographic Conditions " memorandum included in Appendix Q.
6.1.1 Historic Population Growth
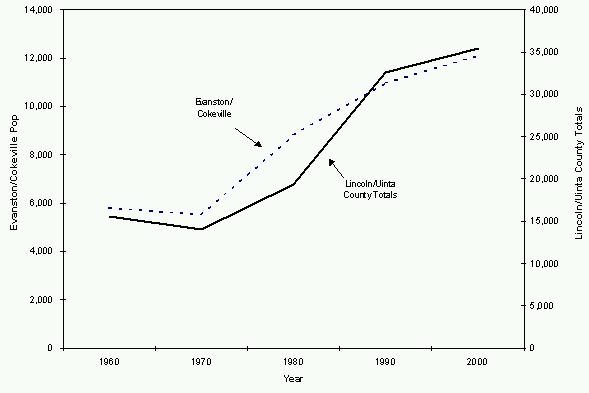
Since 1960, the combined population of Evanston and Cokeville has increased at an average annual rate of about four percent. This long-term average, however, masks considerable fluctuation during this 40-year period. As shown in Figure 33, the population of the two communities actually declined during the 1960s, but grew rapidly during the decades of the 1970s and 1980s. The 1990s have been characterized by comparatively slow, but steady, growth, with the combined population of Evanston and Cokeville increasing at an average annual rate of less than one percent over the past ten years. In general, the rates of population growth in Evanston and Cokeville closely correspond to the rates of population growth for Uinta and Lincoln Counties as a whole, also shown in Figure 33, over the past four decades.
Figure 33
Population of Evanston and Cokeville and the Remainder of Lincoln and Uinta
Counties, 1960 to 2000
6.1.2 Historic and Current Employment
It is estimated that there are currently 20,000 full and part-time jobs located in Uinta and Lincoln Counties. Approximately 10,000 of these jobs are located within the Bear River Basin portions of the two counties, with approximately 9,500 jobs located in the Uinta County part of the Basin (principally in and around Evanston) and about 500 jobs located in the Lincoln County portion.
Uinta County employment grew rapidly from the late 1970s through the mid-1980s during the period of intense oil and gas development activity, now known locally as "The Boom." After experiencing a slight decline in total employment during the late 1980s, Uinta County jobs have grown steadily at about the same rate as the State as a whole during the 1990s. In general, Lincoln County employment growth during the past three decades has been slower than either Uinta County or the State as a whole. An exception was the brief period of power plant construction during the mid-1980s; county employment fell back shortly thereafter to levels comparable to the pre-construction period.
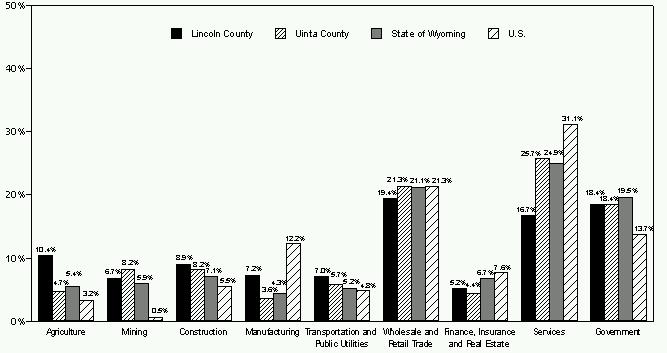
Figure 34 shows the shares of total employment in Lincoln County, Uinta County, the State of Wyoming, and the U.S. for major industry divisions. The following conclusions can be drawn from this figure and information gathered for the basin:
Figure 34
Composition of 1998 Employment by Sector
6.2 Future Economic and Demographic Scenarios
An economic base analysis was used to project future growth in the Bear River Basin, as described in the "Future Economic and Demographic Scenarios" memorandum included in Appendix Q. This "bottom up" method has the advantages of focusing directly on specific activities that are likely to drive economic and demographic changes in the future. This approach involved the following five steps:
Two planning scenarios were developed using the economic base approach. The planning horizon was 30 years, therefore growth was estimated through the year 2030. The High Case Scenario incorporates the most growth in each of the key sectors that is reasonably likely to occur over the forecast horizon. This scenario incorporates the aggressive assumption that each of the key sectors will achieve its highest likely growth at the same time, providing an upper bound for water planning purposes.
The Low Case Scenario incorporates the lowest growth reasonably likely to occur in each of the key sectors. This provides the lower bound for planning purposes. Although this scenario will not impose pressure on regional water resources, it can be used to determine the financial risk involved with potential water resource enhancements.
Based on the analysis of historic and current employment, four key sectors were identified that are the most likely to continue to be important to future economic growth in the Bear River Basin as follows:
6.2.1 Agriculture Sector
Agriculture sector projections were based on historic trends and assumptions about 1) future BLM grazing policies and 2) whether the Cokeville Meadows Wildlife Refuge will be fully implemented by the end of the projection time horizon.
Crop production in the Bear River Basin consists mainly of hay (irrigated meadow and alfalfa) used for supplemental livestock feed. The vast majority of hay grown within the basin in consumed by basin livestock during the winter months. Since livestock are the most important cash crop of the basin agricultural sector, the analysis of the agricultural sector is based largely on livestock inventory. In order to standardize the analysis in terms of livestock forage levels, livestock inventories are converted to "Animal Units." This is equal to the sum of cattle inventories divided by two and sheep inventories divided by five.
High Case Scenario
The High Case Scenario for agricultural production reflects the assumptions that the BLM will continue historical grazing policies and that the Cokeville Meadows Wildlife Refuge will remain largely unimplemented. Under this scenario, cattle production continues to increase and sheep production continues to decline by about one percent annually. By the end of the planning horizon, there are projected to be 31,000 cattle animal units and 10,000 sheep animal units within the Bear River Basin. Under this scenario, irrigated acreage would increase slightly to about 69,000 acres in the year 2030. The number of ranches and total farm jobs would remain at approximately current levels, assuming increased labor efficiency.
Low Case Scenario
The Low Scenario for agricultural production reflects changes in the two assumptions. The first is that the BLM will expand its "no-conversion of sheep to cattle" grazing policy to other allotments in the basin, producing a decline in grazing capacity on public lands. This would reduce the projected animal units by 4,000. The second is that the Cokeville Meadows Wildlife Refuge will be fully implemented, reducing the basin animal units by approximately 4,000 at the end of the planning horizon. Therefore, the total projected cattle animal units at the end of the planning horizon would be about 24,000. Under this scenario, irrigated acreage would decrease slightly to about 61,000 acres in the year 2030. The basin would lose a total of 50 farm jobs by the year 2030.
6.2.2 Energy Sector
Energy sector projections were based upon local insights into the life cycle of the Bear River Basin oil and gas fields, USDOE Energy Information Administration (EIA) long range projections of energy supply and statistical analyses to project first Wyoming production, then basin production. Essentially, the low and high scenarios reflect differing assumptions regarding: a) national and regional total gas and oil production, and b) the proportion of Wyoming gas production, and Rocky Mountain Region oil production, that will be supplied by operations within the Basin.
High Case Scenario
The High Case Scenario for natural gas production reflects EIA High Technology Case projections for natural gas production in the Rocky Mountain Region, with a slower decline in the Basin proportion of total Wyoming gas production due to renewed exploration and enhanced recovery techniques. Under this scenario basin production and associated processing will be approximately 15 percent more than current production. Oil production reflects EIA High Technology Case projections for natural gas production in the lower 48 states. Under this scenario, basin production and processing decreases by approximately 50 percent from current production.
Low Case Scenario
The Low Case Scenario for natural gas and oil production reflects EIA Reference Case projections for natural gas production in the Rocky Mountain Region, plus information regarding existing oil and gas fields in the basin. Under this scenario basin gas production and processing will cease by 2027. Basin oil production and processing will cease by 2026.
6.2.3 Tourism Sector
Tourism sector projections were based upon 1) increases in traffic counts projected by the Wyoming Department of Transportation at the Evanston East traffic counter station, and 2) projected population growth for the Davis, Morgan, Salt Lake and Weber Counties in the Wasatch Front region of Utah. Note that water related recreational uses are expected to increase significantly in the next 30 years, which will contribute to tourism in the basin. Projected increases in recreational uses are detailed in the "Future Recreational Demands" memorandum included in Appendix Q.
High Case Scenario
The High Case Scenario for tourism reflects, in part, the assumption that basin visitation will increase in proportion with projected increases in I-80 traffic in the Evanston area. Estimated tourist related employment in Evanston would be more than two times current levels, reflecting an average annual growth of 2.9 percent.
Low Case Scenario
The Low Case Scenario for tourism reflects the assumption that growth in the basin will occur at the same rate as growth in the population of the Wasatch Front region in Utah, the primary source of non-highway visitors. Estimated tourist related employment in Evanston would rise by slightly more that 60 percent, reflecting an average annual growth of 1.6 percent.
6.2.4 Manufacturing Sector
The high scenario for the manufacturing sector is based on the historic trend in manufacturing job growth in the Evanston area. The low manufacturing sector scenario reflects, in part, an anticipated slowdown in growth in manufacturing employment in the nearby Wasatch Front and reflects the close economic ties between Evanston and the Utah economic centers and the fact that Evanston is a potential alternative for firms looking to be near, but not in the midst of, the Salt Lake City Metropolitan Area.
High Case Scenario
The High Case Scenario for manufacturing, light industrial, and business service activities, is projected to increase at an average annual growth rate of six percent per year. Total employment in these activities will rise from a current level of about 650 jobs to over 3,000 jobs by 2030.
Low Case Scenario
The Low Case Scenario for manufacturing, light industrial, and business service activities, is projected to increase at an average annual growth rate of two percent per year. Total employment in these activities will rise from a current level of about 650 jobs to over 1,200 jobs by 2030.
6.2.5 Overall Economic and Demographic Projections
The future economic projections were incorporated into a model of Bear River Basin employment and population in order to develop aggregated estimates of total residents and total jobs in 2030 under the Economic Base High Scenario and Economic Base Low Scenario. Table 21 shows the current and projected employment breakdown, by sector, in the Bear River Basin.
Table 21
Current and Projected Employment Breakdown
| Current Employment Bear River Area Only |
2030 -- High Scenario Bear River Area Only |
2030 -- Low Scenario Bear River Area Only | Uinta Co | Lincoln Co | Uinta Co | Lincoln Co | Uinta Co | Lincoln Co |
|---|---|---|---|---|---|---|
| Basic Employment | ||||||
| Agriculture | 260 | 265 | 260 | 265 | 245 | 230 |
| Tourism/Visitor Related | 640 | 50 | 1,500 | 130 | 1,040 | 100 |
| Energy Related | 900 | 0 | 900 | 0 | 0 | 0 |
| Other Industry (Manuf./Bus. Services) | 650 | 0 | 3,700 | 100 | 1,170 | 0 |
| Highway/Railroad Construction and Services | 100 | 0 | 100 | 0 | 100 | 0 |
| State/Federal Government | 500 | 0 | 500 | 0 | 500 | 0 |
| Net Outcommuting | 800 | NA | 1,500 | NA | 1,200 | NA |
| Subtotal | 3,850 | 315 | 8,460 | 495 | 4,255 | 330 |
| Indirect Basic/Local Service Employment | ||||||
| Subtotal | 5,650 | 185 | 11,000 | 300 | 5,530 | 200 |
| Total Employment | 9,500 | 500 | 19,460 | 795 | 9,785 | 530 |
| Total Employment/Direct Basic Ratio* | 2.5 | 1.6 | 2.3 | 1.6 | 2.3 | 1.6 |
The two scenarios portray markedly different potential futures for the region. Under the high case scenario, activity and employment in the energy producing sector would remain relatively stable, agricultural production and irrigated acreage would increase modestly, and there would be substantial growth in tourism related employment and, especially, in new manufacturing and commercial activities targeted toward customers outside the region. Under the low case, there would be modest declines in agriculture due to public land grazing availability and implementation of the Cokeville Meadows Wildlife Refuge, energy activity would essentially cease by 2030, and growth in tourism and manufacturing/commercial activity would essentially be just sufficient to offset the loss of jobs in the energy sector.
Projected Bear River Basin population in 2030 under the high case would exceed 29,000 residents, compared a little more than 15,000 residents under the low case, which is similar to year 2000 basin population.
6.3 Future Water Demand Projections
Water demands are derived by multiplying current or projected demographic or economic activity by the water use factors for each activity. These water use factors are based on existing water use estimates, described in Section 3.0. Total water diversions and consumptive use are presented and discussed for each sector for both High Case and Low Case scenarios. A detailed analysis is discussed in the "Future Demand Projections" memorandum included in Appendix Q.
6.3.1 High Case Scenario Projected Water Use
Total basin water diversion requirements are projected to increase by about seven percent from year 2000 to year 2030 under the High Case Scenario. Under normal water year conditions, this amounts to about 21,400 acre-feet; under dry hydrologic conditions (high demand year) the increase would be about 29,000 acre-feet. Table 22 shows the current and projected water diversion demand for the High Case Scenario. Table 23 shows the corresponding consumptive use under the High Case Scenario.
Table 22
Current and Projected Annual Bear River Water Diversion Demand in Acre-Feet
High Case Scenario
| Current Demands | 2030 High Scenario Demands | |||
|---|---|---|---|---|
| Normal Demand Year | High Demand Year | Normal Demand Year | High Demand Year | |
| Demand by Type of Use | ||||
| Agriculture Irrigation Livestock Agriculture Subtotal |
294,668 528 295,196 |
419,185 528 419,713 |
311,577 611 312,188 |
443,239 611 443,850 |
| Municipal Evanston Residential Commercial Institutional Subtotal Cokeville Municipal Subtotal | 2,087 638 1,067 3,792 653 4,446 |
2,286 705 1,386 4,377 653 5,030 |
4,228 1,310 2,162 7,700 664 8,364 |
4,631 1,447 2,807 8,886 664 9,550 |
| Rural Domestic | 500 | 500 | 959 | 959 |
| Industrial | 459 | 680 | 494 | 731 |
| Total Demand | 300,601 | 425,923 | 322,005 | 455,091 |
| Demand by Source of Supply | ||||
| Surface Water | 293,454 | 416,212 | 314,042 | 444,416 |
| Ground Water | 7,147 | 9,710 | 7,963 | 10,675 |
| Total Demand | 300,601 | 425,923 | 322,005 | 455,091 |
| * Note that High Demand Year corresponds to Dry Hydrologic Conditions | ||||
Table 23
Current and Projected Annual Bear River Water Consumptive Use in Acre-Feet
High Case Scenario
| Current Demands | 2030 High Scenario Demands | |||
|---|---|---|---|---|
| Normal Demand Year | High Demand Year | Normal Demand Year | High Demand Year | |
| Demand by Type of Use | ||||
| Agriculture Irrigation Livestock Agriculture Subtotal |
94,528 528 95,056 |
136,251 528 136,779 |
99,953 611 100,564 |
144,070 611 144,681 |
| Municipal Evanston Residential Commercial Institutional Subtotal Cokeville Municipal Subtotal | 1,262 387 655 2,304 505 2,809 |
1,468 455 976 2,899 507 3,406 |
2,557 794 1,3264 4,678 513 5,192 |
2,973 935 1,977 5,885 516 6,400 |
| Rural Domestic | 500 | 500 | 959 | 959 |
| Industrial | 459 | 680 | 494 | 731 |
| Total Demand | 98,825 | 141,365 | 107,209 | 152,772 |
| Demand by Source of Supply | ||||
| Surface Water | 95,829 | 137,460 | 103,629 | 148,229 |
| Ground Water | 2,996 | 3,906 | 3,580 | 4,543 |
| Total Demand | 98,825 | 141,365 | 107,209 | 152,772 |
| * Note that High Demand Year corresponds to Dry Hydrologic Conditions | ||||
The following summarizes uses for the High Case Scenario:
6.3.2 Low Case Scenario Projected Water Use
Total water diversion requirements under the low case scenario are projected to be slightly lower in 2030 than they were in 2000. However, in any given year from 2000 to 2030, there might be the need for 120,000 more acre-feet in a high demand, dry year compared with a normal year. Table 24 shows the current and projected water diversion demand for the Low Case Scenario. Table 25 shows the corresponding consumptive use under the Low Case Scenario.
Table 24
Current and Projected Annual Bear River Water Diversion Demand in Acre-Feet
Low Case Scenario
| Current Demands | 2030 Low Scenario Demands | |||
|---|---|---|---|---|
| Normal Demand Year | High Demand Year | Normal Demand Year | High Demand Year | |
| Demand by Type of Use | ||||
| Agriculture Irrigation Livestock Agriculture Subtotal |
294,668 528 295,196 |
419,185 528 419,713 |
277,139 487 277,627 |
394,249 487 394,736 |
| Municipal Evanston |
0 | 0 | 15,305 | 21,434 |
| Municipal Evanston Residential Commercial Institutional Subtotal Cokeville Municipal Subtotal | 2,087 638 1,067 3,792 653 4,446 |
2,286 705 1,386 4,377 653 5,030 |
2,126 659 1,087 3,872 471 4,342 |
2,329 728 1,412 4,468 471 4,938 |
| Rural Domestic | 500 | 500 | 504 | 504 |
| Industrial | 459 | 680 | 0 | 0 |
| Total Demand | 300,601 | 425,923 | 297,779 | 421,614 |
| Demand by Source of Supply | ||||
| Surface Water | 293,454 | 416,212 | 291,261 | 412,753 |
| Ground Water | 7,147 | 9,710 | 6,518 | 8,860 |
| Total Demand | 300,601 | 425,923 | 297,779 | 421,614 |
| * Note that High Demand Year corresponds to Dry Hydrologic Conditions | ||||
Table 25
Current and Projected Annual Bear River Water Consumptive Use in Acre-Feet
Low Case Scenario
| Current Demands | 2030 Low Scenario Demands | |||
|---|---|---|---|---|
| Normal Demand Year | High Demand Year | Normal Demand Year | High Demand Year | |
| Demand by Type of Use | ||||
| Agriculture Irrigation Livestock Agriculture Subtotal |
94,528 528 95,056 |
136,251 528 136,779 |
88,905 487 89,393 |
128,146 487 128,634 |
| Municipal Evanston |
0 | 0 | 4,862 | 6,780 |
| Municipal Evanston Residential Commercial Institutional Subtotal Cokeville Municipal Subtotal | 1,262 387 655 2,304 505 2,809 |
1,468 455 976 2,899 507 3,406 |
1,286 399 667 2,352 364 2,716 |
1,495 470 994 2,959 365 3,324 |
| Rural Domestic | 500 | 500 | 504 | 504 |
| Industrial | 459 | 680 | 0 | 0 |
| Total Demand | 98,825 | 141,365 | 97,475 | 139,242 |
| Demand by Source of Supply | ||||
| Surface Water | 95,829 | 137,460 | 94,829 | 135,809 |
| Ground Water | 2,996 | 3,906 | 2,646 | 3,433 |
| Total Demand | 98,825 | 141,365 | 97,475 | 139,242 |
| * Note that High Demand Year corresponds to Dry Hydrologic Conditions | ||||
The following summarizes uses for the Low Case Scenario:
6.4 Comparison of Projected Demand to Available Surface Water Supplies
Available surface water, defined in Section 5.2, was compared to High Case Scenario projected demands for normal and dry hydrologic years. The geographic allocation of future monthly water demands reflects the following:
6.4.1 Diversion Demands versus Available Surface Supply in Normal Years
Table 26 shows the projected monthly increase in required surface water supply to meet increased demands under the High Case Scenario for normal hydrologic year conditions in the Upper and Central divisions. These are compared to the available surface water, defined in Section 5.2, to show surpluses and shortages.
Table 26
Projected Increase in Diversion Demands versus Available Supply
Normal Year Conditions (all values in acre-feet)
| Upper Division | |||||
| Projected Demand Growth by Month | Available Surface Supply | Surplus/(Shortage) | |||
|---|---|---|---|---|---|
| Agriculture | Other | Total | |||
| Jan | 2 | 156 | 158 | 4,745 | 4,587 |
| Feb | 2 | 150 | 152 | 4,836 | 4,684 |
| Mar | 2 | 152 | 155 | 11,520 | 11,365 |
| Apr | 38 | 145 | 183 | 18,627 | 18,444 |
| May | 813 | 237 | 1,050 | 19,049 | 17,999 |
| Jun | 2,725 | 491 | 3,217 | 66,197 | 62,980 |
| Jul | 3,210 | 698 | 3,908 | 97 | (3,811) |
| Aug | 1,457 | 803 | 2,260 | 0 | (2,260) |
| Sep | 405 | 551 | 956 | 0 | (956) |
| Oct | 42 | 269 | 311 | 6,162 | 5,851 |
| Nov | 2 | 141 | 143 | 5,932 | 5,789 |
| Dec | 2 | 143 | 145 | 5,260 | 5,115 |
| Total | 8,702 | 3,936 | 12,637 | 142,425 | 129,788 |
| Central Division | |||||
| Projected Demand Growth by Month | Available Surface Supply | Surplus/(Shortage) | |||
| Agriculture | Other | Total | |||
| Jan | 2 | 0 | 2 | 0 | (2) |
| Feb | 2 | 0 | 2 | 0 | (2) |
| Mar | 2 | 0 | 2 | 6,939 | 6,937 |
| Apr | 10 | 0 | 10 | 34,769 | 34,759 |
| May | 610 | 0 | 610 | 53,300 | 52,690 |
| Jun | 2,804 | 0 | 2,804 | 69,232 | 66,428 |
| Jul | 3,008 | 0 | 3,008 | 23,551 | 20,543 |
| Aug | 1,575 | 0 | 1,575 | 0 | (1,575) |
| Sep | 319 | 0 | 319 | 0 | (319) |
| Oct | 22 | 0 | 22 | 0 | (22) |
| Nov | 3 | 0 | 3 | 0 | (3) |
| Dec | 2 | 0 | 2 | 0 | (2) |
| Total | 8,359 | 0 | 8,359 | 187,791 | 179,432 |
During a normal year, the growth in demands are dominated by the agricultural sector in both the Upper and Central divisions, however, growth in demand for non-agricultural purposes will be an important factor only in the Upper Division. During the summer growing season agricultural demands constitute between 64 and 84 percent of total demand growth in the Upper Division. In the Central Division, agricultural demand growth constitutes 100 percent of the total increase in monthly demands through 2030. This difference is due mainly to the growth in municipal water demand projected for the Evanston area over the next 30 years. Therefore, while agricultural demands follow roughly the same monthly distribution in both divisions, the monthly distribution of total demand growth between the divisions varies due to the influence of the non-agricultural sector.
The monthly distribution of available, uncommitted surface water supplies for a normal year is similar for both the Upper and Central divisions. Available supplies begin building with the spring runoff and peak in the month of June. In each division, available supplies stabilize throughout the fall and winter seasons. The main difference is that in the Upper Division some surface water supplies remain available nine months of the year, while in the Central Division supplies are available only during the spring runoff period.
Table 26 also shows the difference in the growth of demands and the uncommitted surface water supplies on a monthly basis under normal conditions. In the Upper Division, shortages are projected to only occur during the peak irrigation periods. During the remaining months, uncommitted surface supplies are more than adequate to meet the projected growth in demand. In the Central Division, while monthly shortages are projected to occur from August through February, only August shortages are significant. From March through July, it is estimated that more than enough surface water will be available to meet the projected growth in demand.
6.4.2 Diversion Demands versus Available Surface Supply in Dry Years
Table 27 shows the projected monthly increase in required surface water supply to meet increased demands under the High Case Scenario for dry hydrologic year conditions in the Upper and Central divisions. These are compared to the available surface water, defined in Section 5.2, to show surpluses and shortages.
Table 27
Projected Increase in Diversion Demands versus Available Supply
Dry Year Conditions (all values in acre-feet)
| Upper Division | |||||
| Projected Demand Growth by Month | Available Surface Supply | Surplus/(Shortage) | |||
|---|---|---|---|---|---|
| Agriculture | Other | Total | |||
| Jan | 2 | 180 | 183 | 1,972 | 1,789 |
| Feb | 2 | 173 | 176 | 1,665 | 1,489 |
| Mar | 2 | 176 | 178 | 3,744 | 3,566 |
| Apr | 51 | 168 | 219 | 3,934 | 3,715 |
| May | 1,128 | 274 | 1,403 | 0 | (1,403) |
| Jun | 3,789 | 568 | 4,356 | 9,524 | 5,168 |
| Jul | 4,463 | 806 | 5,269 | 0 | (5,269) |
| Aug | 2,025 | 927 | 2,952 | 0 | (2,952) |
| Sep | 561 | 636 | 1,197 | 0 | (1,197) |
| Oct | 58 | 311 | 369 | 1,735 | 1,336 |
| Nov | 2 | 163 | 165 | 2,255 | 2,090 |
| Dec | 2 | 165 | 168 | 1,959 | 1,791 |
| Total | 12,088 | 4,547 | 16,635 | 26,788 | 10,153 |
| Central Division | |||||
| Projected Demand Growth by Month | Available Surface Supply | Surplus/(Shortage) | |||
| Agriculture | Other | Total | |||
| Jan | 2 | 0 | 2 | 0 | (2) |
| Feb | 2 | 0 | 2 | 0 | (2) |
| Mar | 2 | 0 | 2 | 0 | (2) |
| Apr | 12 | 0 | 12 | 0 | (12) |
| May | 847 | 0 | 847 | 0 | (847) |
| Jun | 3,899 | 0 | 3,899 | 0 | (3,899) |
| Jul | 4,183 | 0 | 4,183 | 0 | (4,183) |
| Aug | 2,189 | 0 | 2,189 | 0 | (2,189) |
| Sep | 441 | 0 | 441 | 0 | (441) |
| Oct | 30 | 0 | 30 | 0 | (30) |
| Nov | 3 | 0 | 3 | 0 | (3) |
| Dec | 2 | 0 | 2 | 0 | (2) |
| Total | 11,612 | 0 | 11,612 | 0 | (11,612) |
The distribution of demand growth during dry years has many of the same characteristics as normal years. The main difference is that in a dry year, the growth in demand for the agricultural sector increases to a much greater extent than in the non-agricultural sector. Demand growth in a dry year for the agricultural sector in both the Upper and Central divisions increased by 40 percent over what they were in a normal year. In contrast, the Upper Division non-agricultural growth in demand increased by only 16 percent. Overall demand growth in dry years is approximately 35 percent greater than under normal year climate and hydrologic conditions.
Annual uncommitted surface supplies declined dramatically in both divisions for dry year conditions versus normal year conditions. For the Upper Division, annual available supplies shrank to 19 percent of what they were under normal conditions. The largest monthly percentage declines comes during the months of May through September, when agricultural usage is at its highest. During this period, available supplies go to zero for all months except June, which declines to 14 percent of what was available in a normal year. For the Central Division, available supplies during dry year conditions go to zero during all months of the year.
The significant decline in available surface water supplies has important consequences for the monthly surplus/shortage totals projected for each division. Whereas under normal year conditions both the Upper and Central Divisions experienced very few months with significant projected shortages, under dry year conditions, both divisions experience significant projected shortages during the summer irrigation season. It should be noted that sequential dry years would aggravate these shortages considerably.
6.4.3 Supplemental Supplies
Projected future water supply demands will require supplemental water from storage or from ground water, since there is essentially no available water for diversion during dry years. Storage or supplemental ground water is required for normal and wet years if future water use is to occur in other than the high runoff months.
It is estimated that supplemental storage, limited by Bear River Compact restrictions, is feasible in the Bear River Basin. In addition, increased ground water development could be a viable source for meeting the projected demands.
6.5 Future Water Use Opportunities
6.5.1 Economic Development Opportunities
Wyoming's approach to basin planning includes the identification and prioritization of future water use opportunities. Specifically, it was the intent of the planning process to generate a "long-list" of opportunities to be presented to the BAG. Based on the comments from the BAG and others, a "short-list" would then be generated reflecting the more attractive and feasible opportunities for further consideration as an outcome to the plan.
This process involved extensive interviews with representatives from government, larger industrial entities, agriculture, energy, and tourism. These interviews did not result in the identification of any extraordinary economic plans or opportunities beyond the growth scenarios previous discussed in Section 6.2.
These findings were presented to the BAG for their comment and concurrence. The BAG expressed consensus relative to the economic planning scenarios presented herein. In addition, members of the public and the BAG were unable to identify additional specific economic opportunities impacting water use. No short-list, therefore, is included in the Bear River Basin Plan. As opportunity(s) are identified in the future, the spreadsheet modeling software created as part of the planning effort will be a valuable tool in ascertaining the feasibility and/or impacts of individual projects.
6.5.2 Storage Opportunities
As indicated above, projected future water supply demands will require supplemental water from storage or from ground water, since there is essentially no available water for diversion during dry years. Storage potential is discussed as follows:
Bear River Compact Storage Limitations
The original 1958 Bear River Compact acknowledged the right of each member state to store water in existing water storage reservoirs constructed upstream of Stewart Dam prior to February 4, 1955. In the case of Wyoming, the compact indicates that Wyoming's pre-compact (pre-1955) storage rights total 2,150 acre-feet. It is interesting to note that Wyoming's actual developed pre-compact permitted storage totals 3284.43 acre-feet. This information is summarized in Appendix I.
The Bear River Compact also granted additional storage rights above Stewart Dam, of 35,500 acre feet in a given water year, to be split evenly between Wyoming and Utah (17,750 acre-feet each). These storage allocations are subordinate to direct flow and fill during the non-irrigation season. Between 1959 and 1976, the State of Wyoming permitted storage reservoirs totaling 17,759.56 acre-feet. (See Appendix I) The 1978 Amended Bear River Compact granted further storage entitlements in the amount of 70,000 acre-feet above Stewart Dam. Again, this storage entitlement was split evenly between Wyoming and Utah. These storage rights are also subordinate to direct flow and diversion rights. In addition, these reservoirs cannot be filled when the water surface elevation of Bear Lake is below 5911.00 feet.
Bear River Compact Storage Availability
In the event that the water surface elevation of Bear Lake drops below 5911 feet, compact restrictions on storage go into effect as indicated above. These restrictions, however, do not impact storage rights granted under the original 1958 compact. Hence, Wyoming is entitled to fill the following storage under the 1958 Compact.
Pre-1976 Permitted Volume:	                        13,183
Additional Woodruff Narrows Allocation:      	           250
                                                        13,433 acre-feet
Note that the Needle Rock Reservoir on Yellow Creek was permitted, but never
constructed. In addition, Keith Putnam elected not to construct a reservoir on Rabbit
Creek and has been granted the right to transfer his compact depletion to other lands.
Both of these pre-1976 allocations totaling 163.5 acre-feet are available for re-allocation.
An application is still pending for the Ferney Glade Reservoir on the Smiths Fork which
was filed on 8-1-1960 for 5201 acre-feet of storage. The 4,100 acre-feet allocated to
Smith's Fork was primarily intended for this project. No development has occurred on
the Thomas Fork in Wyoming. Therefore, Wyoming's remaining 1958 Compact
allocations are as follows:
			Smiths Fork		        4,100
			Thomas Fork			   55
			Putnam Allocation		   63
                   Needle Rock Allocation	        100.5
  		                                       4318.5 acre-feet
As indicated above, the pre-compact (pre-1955) storage developed in Wyoming totals
3284.43 acre-feet. This, combined with the 13,433 acre-feet of storage developed under
the 1958 compact, totals 16,717.43 acre-feet of storage that can be filled in Wyoming
even when the Bear Lake level drops below 5911 feet in elevation. It is worth noting that
Wyoming temporarily assigned additional 1958 compact allocations to other reservoirs
(Woodruff Narrows, Broadbent, and Sulphur Creek) in the basin when Bear Lake levels
dropped below 5911 feet in the early 1990's.
Available Physical Supply (Direct Diversion vs. Storage Potential)
There are essentially 8 dry years in the 28 year study period, during which a new direct diversion project would not receive any water (about 3 out of every 10 years there are no divertible flows). As previously shown in Tables 19 and 20, there are virtually no available flows in either division during dry year periods, in any months. To guarantee a firm yield beyond existing allocations during these dry year periods, additional storage reservoirs would be required.
Based on the normal year hydrology, the best development plan would be the construction of storage up to the yield available during these years - 150,000 and 190,000 acre-feet in either the Upper or Central Divisions respectively. There would be the need to carry over some storage to guard against dry year yields (zero) and to take into account evaporation and seepage losses from the reservoir(s). The firm yield, therefore, would be on the order of 75,000 acre-feet in the Upper Division and 95,000 acre-feet in the Central Division. It should be noted that storage facilities this large would exceed Wyoming's compact allocation.
A review of the wet years shows much higher available flows, but they occur only in three years out of 28 years or about 11 percent of the time. Planning and constructing facilities on these occurrences would result in an oversized reservoir and would not significantly increase the firm yield of a water supply, even though there is up to 500,000 acre-feet available during these wet periods years.
Alternative Reservoir Sites
There have been several previous studies directed toward the feasibility and capacity of various reservoir sites within the Bear River Basin. In 1958, Banner & Associates studied potential sites on Twin Creek, Upper Bear River (East & West Forks), Mill Creek (13 sites), Yellow Creek (2 sites), and Smith's Fork (3 sites) under contract to the Wyoming Natural Resources Board. Forsgren Perkins Engineering completed a detailed study of the West Fork site in 1985 for the WWDC. GBR Consultants completed as study of the Smiths Fork (Teichert-Bagley) site for the WWDC that same year. These sites and their potential capacities are shown schematically on Figure 35.
The potential for future reservoir construction was presented to the BAG on several occasions for discussion. The consensus of the BAG was to not pursue or list storage as a short-list option at this time. This feeling was, in part, due to economic concerns (cost vs. benefit) and environmental permitting concerns. Nonetheless, storage is a viable option in the future as the need and/or economic desirability of storage changes.
Smiths Fork Reservoir Sites
Near the completion of the planning study, water users from the Cokeville area approached the Wyoming Water Development Commission to initiate discussions relative to developing storage on Smith's Fork. Based on the modeling efforts, Smith's Fork has excellent storage potential from a hydrologic standpoint. As indicated above, there is a permit pending for the Ferney Glade Reservoir on Smith's Fork which was filed in 1960 for 5201 acre-feet. A larger reservoir would likely require the partnership and participation of downstream states, and perhaps an amendment to the Bear River Compact.
6.5.3 Conservation Opportunities
The state of Wyoming is supportive of water conservation as an environmentally responsible policy. In many cases, water conservation offers an economic benefit to water users. In the case of municipalities, for example, reduced water consumption translates into reduced treatment and operational costs. The same can be true of industrial water users.
In the case of irrigation, one would expect agricultural users to benefit through increased overall water availability due to conservation measures. However, in the Bear River Basin, as in many basins in the west, this is not necessarily the case. Current land application practices in the Upper Division almost exclusively involve flood irrigation. As a result of this inefficient practice the Bear River is recharged, with up to 50% of the return flows re-entering the streams later in the irrigation season when divertible flows would normally be much less. This essentially in-ground storage actually benefits water users late in the irrigation season. Irrigation conservation may be more economically attractive in the Central Division where Water Emergency conditions typically occur earlier in the season.
There are various voluntary conservation and preservation programs in place that could benefit water users in the basin. These programs include:
