Wyoming State Water Plan
Wyoming State Water Plan
Wyoming Water Development Office
6920 Yellowtail Rd
Cheyenne, WY 82002
Phone: 307-777-7626

Wyoming Water Development Office
6920 Yellowtail Rd
Cheyenne, WY 82002
Phone: 307-777-7626


Water supply planning requires consideration of many factors, including hydrology, water quality, physical facilities, and legal and institutional requirements. Surface water spreadsheet models were developed to:
Existing mapping and previous ground water studies and planning documents were reviewed and summarized into a discussion on the potential for additional ground water development. Existing well locations and yields were important in projecting future ground water development opportunities.
5.1 Surface Water Spreadsheet Models
The Bear River Spreadsheet Model is a complex system of spreadsheets which incorporate diversions, reservoirs, streamflow gaging stations, and historic legal and institutional constraints. Individual spreadsheet models were developed which reflect each of three hydrologic conditions: dry, normal, and wet year water supply. Each model relies on historical data from the 1971 to 1998 study period to estimate the hydrologic conditions.
Although the models do not explicitly account for water rights or compact allocations, historic operations based on these constraints are represented by the models. The individual models were used to identify water that could be put to future use in the Bear River Basin based on physical and legal availability. The development of the models relied on the following information, discussed in previous sections:
The models were developed in Microsoft Excel 2000 with a user-friendly menu-driven approach that will allow the State of Wyoming to easily update and maintain the model and to make initial assessments of water development projects proposed in the future. Figure 27 shows the Bear River Basin Planning Model initial screen. This interface directs the user to the individual spreadsheet for each hydrologic condition. Appendix P provides a detailed memorandum on the spreadsheet development and use.
Figure 27
Bear River Planning Model Initial Screen
5.1.1 Surface Water Spreadsheet Model Development
To mathematically represent the Bear River system, the river system was divided into twelve reaches based primarily on the location of USGS streamflow gaging stations. These reaches are shown in Figure 28, which is a screen captured directly from the spreadsheet models.
Other key locations, such as reservoirs or confluences with major tributaries, were also used to determine the extent of reaches. Each reach was then sub-divided by identifying a series of individual nodes representing locations where diversions occur, tributaries converge, or other significant water resources features are located.
Figure 28
Bear River Spreadsheet Model River Reaches
At each node, a water budget, or mass balance, computation is completed to determine the amount of water that flows downstream out of the node using the following mathematical equation:
River flows from upstream reaches
Return flows from upstream diversions
Reach gains from ground water or ungaged tributaries
Outflows are:
River flows to downstream reaches
Headgate diversions
Evaporation (at reservoir nodes)
Reservoir releases (at reservoir nodes)
Reach losses or seepage to ground water
Change in Storage is zero except at reservoir nodes.
Total flow into the node and diversions or other losses from the node are calculated. At non-storage nodes, the difference between all inflows and outflows is the amount of flow available to the next node downstream. For storage nodes, an additional loss calculation for evaporation and the change in storage are evaluated. Mass balance calculations are repeated for all nodes in a reach, with the outflow of the last node being the inflow to the top node in the next reach.
5.1.2 Input Worksheets
The spreadsheet models represent 100 percent of the surface water use on the Bear River mainstem in Wyoming, either as explicit key structures or aggregate structures described in Section 3.2.1. In addition, water use from Smith's Fork, and Sulphur Creek are also modeled. Sulphur Creek, and Woodruff Narrows Reservoirs are represented in the model. Other Bear River tributaries, not administered under the Bear River Compact, are not specifically modeled, but are represented by gaged and ungaged streamflows.
Specific inputs used by the model to calculate the basin water balance include:
Because the Bear River Compact accounting requires total diversions within the Upper and Central Divisions, diversions in the Utah portions of the Upper Division and diversions in the Idaho portion of the Central Division were represented in the modeling effort as aggregate structures. Specific details regarding the inputs to the spreadsheet model are included in Appendix P.
5.1.3 Results Worksheets
Results of the surface water spreadsheet models are provided in tabular form. The "Outflow Calculations: By Node" table summarizes the net flow for each node. The nodes are grouped by reach and a comparison of simulated flows with historic gaged flows are provided at USGS streamflow locations.
The "Summary of Diversion Calculation: By Node" table summarizes the computed diversion at each node. In addition, the "Comparison of Estimated vs. Historic Diversions" table presents comparison results and indicates any shortages occurring to target diversion volumes.
An effort was made to incorporate sufficient detail in the spreadsheet models to determine whether water emergency conditions exist as defined in the Bear River Compact for either the Upper or Central Divisions. The Water Commissioners worksheets for both divisions were computerized and all appropriate flows and diversions were tabulated. These tables determine whether an emergency condition exists; however, no attempt was made in the model to restrict diversions based on this determination. Figure 29 shows the "Bear River Commission Water Allocation: Central Division" table from the wet year spreadsheet model.
Figure 29
Bear River Spreadsheet Model Water Allocation Table
The results were reviewed, and compared to historic trends and known operations. This was to assure that the models provide a basis for assessing available water during dry, normal, and wet hydrologic conditions. The procedures and results are detailed in the "Surface Water Calibration" memorandum provided in Appendix P. This review determined that the Bear River Basin Spreadsheet Model can be used to reasonably estimate water availability in various reaches of the river during dry, normal and wet conditions on a monthly basis.
5.2 Surface Water Availability
An effort was made to incorporate sufficient detail in the spreadsheet models to determine whether water emergency conditions exist as defined in the Bear River Compact for either the Upper or Central Divisions. In addition, output tables were developed that would help facilitate the assessment of available water. The following general procedures were followed to assess surface water availability:
A detailed discussion on available water and compact and administration constraints to development of that water is provided in the "Task 3D Available Surface Water Determination" memorandum provided in Appendix P.
5.2.1 Upper Division Available Flows
Table 19 shows the water availability for the Upper Division. The table presents the following information for dry, normal, and wet year hydrologic conditions:
Table 19
Bear River Basin Water Availability - Upper Division
| Jan | Feb | Mar | Apr | May | Jun | Jul | Aug | Sep | Oct | Nov | Dec | |
|---|---|---|---|---|---|---|---|---|---|---|---|---|
| 1. Flow below Pixley Dam (AF) | ||||||||||||
| Dry | 1,972 | 1,665 | 3,744 | 3,934 | 1,693 | 7,601 | 6,842 | 2,572 | 1,492 | 1,735 | 2,255 | 1,959 |
| Normal | 4,745 | 4,836 | 11,520 | 18,627 | 40,023 | 38,213 | 25,526 | 9,038 | 5,950 | 6,162 | 5,932 | 5,260 |
| Wet | 6,098 | 7,736 | 20,226 | 32,192 | 83,950 | 92,935 | 40,990 | 20,293 | 18,027 | 15,040 | 13,319 | 8,975 |
| 2. Total Divertiable Flow (AF) | ||||||||||||
| Dry | - | - | - | - | 56,919 | 83,905 | 33,057 | 12,208 | 7,619 | - | - | - |
| Normal | - | - | - | - | 95,910 | 140,578 | 76,958 | 23,128 | 19,250 | - | - | - |
| Wet | - | - | - | - | 144,576 | 213,983 | 90,951 | 35,618 | 28,889 | - | - | - |
| 3. Min. Compact Flow Required (AF) | 0 | 0 | 0 | 0 | 76,861 | 74,381 | 76,861 | 76,861 | 74,381 | 0 | 0 | 0 |
| (cfs) | 0 | 0 | 0 | 0 | 1,250 | 1,250 | 1,250 | 1,250 | 1,250 | 0 | 0 | 0 |
| 4. Available Flow for WY (AF) | ||||||||||||
| Dry | 1,972 | 1,665 | 3,744 | 3,934 | 0 | 9,524 | 0 | 0 | 0 | 1,735 | 2,255 | 1,959 |
| Normal | 4,745 | 4,836 | 11,520 | 18,627 | 19,049 | 66,197 | 97 | 0 | 0 | 6,162 | 5,932 | 5,260 |
| Wet | 6,098 | 7,736 | 20,226 | 32,192 | 67,715 | 139,602 | 14,090 | 0 | 0 | 15,040 | 13,319 | 8,975 |
| 5. Preferable Reaches | 7,8,3,4,5 | 7,8,3,4,5 | 7,8,3,4,5 | 7,8,3,4,5 | 4,5,6,7 | 4,5,6,7 | 4,5,6,7 | none | none | 7,8,3,4,5 | 7,8,3,4,5 | 7,8,3,4,5 |
Notes:
| ||||||||||||
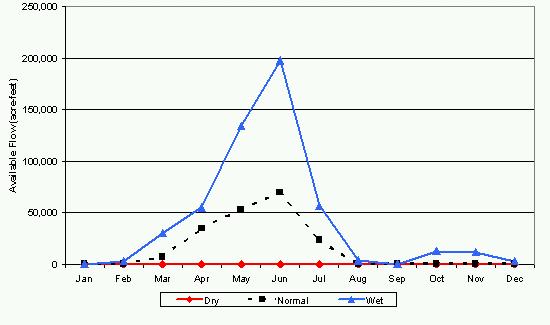
Figure 30 shows the total available monthly flow in the Upper Division for dry, normal, and wet hydrologic years.
Figure 30
Upper Division Available Monthly Streamflow during Dry, Normal, and Wet
Hydrologic Years
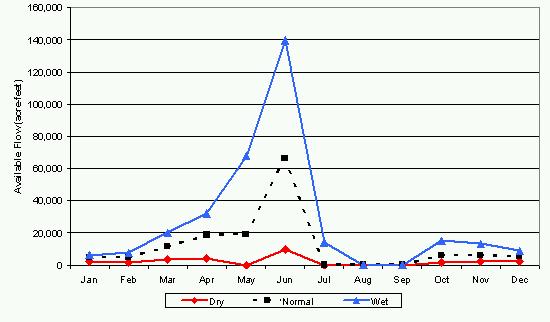
The following summarizes the Upper Division available flows:
5.2.2 Central Division Available Flows
Table 20 shows the water availability for the Central Division. The table presents similar information to the Upper Division table for dry, normal, and wet year hydrologic conditions as follows:
Table 20
Bear River Basin Water Availability - Central Division
| Jan | Feb | Mar | Apr | May | Jun | Jul | Aug | Sep | Oct | Nov | Dec | |
|---|---|---|---|---|---|---|---|---|---|---|---|---|
| 1. Flow at WY/ID Border (AF) | ||||||||||||
| Dry | 8,348 | 7,587 | 12,348 | 13,549 | 18,140 | 22,467 | 14,131 | 6,274 | 5,638 | 6,792 | 8,400 | 8,060 |
| Normal | 14,320 | 14,374 | 28,460 | 55,596 | 89,113 | 91,543 | 50,541 | 19,337 | 13,898 | 17,291 | 16,919 | 15,260 |
| Wet | 18,950 | 22,400 | 51,690 | 75,760 | 156,070 | 218,602 | 81,847 | 37,510 | 32,103 | 34,320 | 32,543 | 24,390 |
| 2. Flow below Stewart Dam (AF) | ||||||||||||
| Dry | 581 | 644 | 624 | 451 | 490 | 666 | 663 | 796 | 706 | 721 | 407 | 309 |
| Normal | 299 | 291 | 485 | 378 | 646 | 2,506 | 1,004 | 691 | 949 | 659 | 513 | 422 |
| Wet | 188 | 201 | 495 | 430 | 11,587 | 20,122 | 13,762 | 640 | 742 | 511 | 384 | 314 |
| 3. Total Divertiable Flow (AF) | ||||||||||||
| Dry | - | - | - | - | 35,843 | 43,034 | 29,962 | 15,945 | 10,623 | - | - | - |
| Normal | - | - | - | - | 106,795 | 121,001 | 77,046 | 36,155 | 24,631 | - | - | - |
| Wet | - | - | - | - | 197,323 | 257,533 | 110,055 | 57,043 | 43,434 | - | - | - |
| 4. Min. Compact Flow Required (AF) | 21,521 | 19,438 | 21,521 | 20,827 | 53,495 | 51,769 | 53,495 | 53,495 | 51,769 | 21,521 | 20,827 | 21,521 |
| (cfs) | 350 | 350 | 350 | 350 | 870 | 870 | 870 | 870 | 870 | 350 | 350 | 350 |
| 4. Available Flow for WY (AF) | ||||||||||||
| Dry | 0 | 0 | 0 | 0 | 0 | 0 | 0 | 0 | 0 | 0 | 0 | 0 |
| Normal | 0 | 0 | 6,939 | 34,769 | 53,300 | 69,232 | 23,551 | 0 | 0 | 0 | 0 | 0 |
| Wet | 0 | 2,962 | 30,169 | 54,933 | 134,549 | 197,775 | 56,560 | 3,548 | 0 | 12,799 | 11,716 | 2,889 |
| 6. Preferable Reaches | none | 9,11,12 | 9,11,12 | 9,11,12 | 9,11,12 | 9,11,12 | 9,11,12 | 9,11,12 | none | 9,11,12 | 9,11,12 | 9,11,12 |
Notes:
| ||||||||||||
Figure 31 shows the total available monthly flow in the Central Division for dry, normal, and wet hydrologic years.
Figure 31
Central Division Available Monthly Streamflow
during
Dry, Normal, and Wet Hydrologic Years
The following summarizes the Central Division available flows:
5.2.3 Use of the Bear River Spreadsheet Model
Direct Diversion Assessment
The spreadsheet modeling effort shows that there is not a reliable year-round source of water for a new diversion in most years. The model can be used to identify the shortages for a proposed water use that may be supplemented by purchase of existing storage shares or ground water. In addition, the model can be used to determine the increased available flow due to retirement of existing diversions.
Storage Assessment
Based on the results of the spreadsheet modeling effort, new surface water uses will likely require storage. There is essentially no available water for diversion during dry years. In addition, storage is required for normal and wet years if future water use is to occur in other than the high runoff months.
There are limitations and restrictions to additional storage outlined in the Bear River Compact. These have been summarized in Section 2.2.1 and discussed in detail in the storage memorandum included in Appendix I. Although these restrictions are difficult to assess basin-wide, the spreadsheet model can be used to screen new storage projects and determine if they meet the Compact requirements for additional storage.
5.3 Ground Water Availability
The ground water resources technical memorandum, attached as Appendix O, provides an analysis of the geology and associated aquifer systems in the Bear River Basin. The following general approach was used to identify the potential for future ground water development in the Bear River Basin in Wyoming:
Existing reports, identified in Appendix O, were helpful in understanding the hydrogeology in the basin, however, the primary source of data used to analyze ground water development potential came from the USGS Ground Water Site Inventory (GWSI) database and the Wyoming State Engineer's Water Well Inventory database. Information stored in these databases include:
5.3.1 Data Compilation and Use
Information stored in both databases pertain to specific geographic points, i.e. well locations. Therefore, their usefulness as a tool for understanding ground water issues was greatly enhanced by placing them into a GIS format. GIS point coverages were created from both the GWSI database and the State database showing the location of the wells and springs. The attributes from the respective database are assigned to each point in the GIS coverages, and maps were generated as analysis tools.
Because data are limited, the GIS coverages are useful tools with which to base general conclusions concerning the ground water resources in the basin. Planners can use the tool to identify the aquifers that have been developed in the vicinity of proposed new developments. Qualified hydrogeologists can use the coverage to extrapolate the data and come to more educated conclusions concerning site specific aquifer potential. Note that site specific investigations will still need to be done to come to more definite conclusions concerning a specific area's ground water development potential.
5.3.2 Well Yield
Well yield is important to consider when planning the number of wells for development. Well yield can be defined as the maximum rate at which a well can pump without lowering the water in the well below the pump intake. The maximum amount a well can produce is a function of well construction; aquifer characteristics; and the location, number, and pumping amounts of nearby wells. Well yield is also a function of how long the well is pumped. Since these data are scarce, reported well yield data were used as a subjective measure of the physical well potential from various aquifers. Reported well yields are either permitted amounts; instantaneous measurements by the pump installer (a function of the pump size); or actual long-term test data. Reported well yields are used as a measure of well yield considering the following qualifying assumptions:
Figure 32 shows the database coverage of reported well yield ranges in the basin. Based on the available information, it appears that
5.3.3 Long-term Aquifer Yield
The physical ability of an aquifer to produce water is a function of the same aquifer properties that are important in determining well yield. In addition, long-term aquifer yield is a function of the amount of recharge that occurs. If pumping exceeds recharge, aquifer dewatering (lowering water table) will result and yields will diminish. Recharge includes:
Any reduction in these inflows will eventually reduce the long-term yield and development potential of ground water in the basin.
Alluvial Aquifer Yield
The Bear River alluvial aquifer is defined as the aquifer that consists of saturated stream alluvium generally within 2 miles of the Bear River. Wells in the alluvial aquifer can sustain high well yields because aquifer drawdown is minimized by recharge from Bear River surface water. Because of this, long-term well yield is probably not constrained by declining aquifer water levels. Additional aquifer development is possible as long as water from the Bear River is available for recharge. The amount of additional development that can occur is dependent on assuring that existing water rights and interstate compacts are satisfied. Therefore, the quantity of water in the alluvial aquifer available for development is equal to the amount of surface water available to augment surface water depletions due to that development. In other words, the available surface water identified in Section 5.2 is the total that can be consumed from river withdrawals and alluvial aquifer wells combined.
Bedrock Aquifer Yields
Aquifers that are not within the stream alluvium are generally referred to as bedrock aquifers. Producing wells have been identified in at least 17 different bedrock formations. Limited recharge and relatively low permeability are the primary reasons why most bedrock aquifers have low well yields and low long-term aquifer yields. Bedrock aquifer recharge generally consists of effective precipitation and seepage between aquifers. These amounts are usually low. Therefore, additional bedrock development could exceed these inflows and cause unacceptable water level declines or reduced spring yields. As discussed in Appendix O, it is conservatively estimated that around 14,000 acre-feet per year can likely be removed from bedrock aquifers without causing a decrease in overall aquifer storage.
Like alluvial aquifers, the ground water development potential for bedrock aquifers is also constrained by depletions to the surface water system caused by pumping. Additional withdrawals could reduce spring discharges to unacceptable levels. Bedrock pumping also reduces the amount of subsurface recharge to the alluvial aquifer, which discharges into the Bear River. Bedrock well depletions take longer to occur the further away (distance and depth) the well is from the surface water system. However, the amount of additional development that can occur is also dependent on assuring that existing water rights and interstate compacts are satisfied.
5.3.4 Ground Water Availability Summary
Current ground water withdrawal estimates indicate that, on average, less than 3,000 acre-feet per year of ground water is currently used in the Bear River Basin. The majority of this use is from the alluvial aquifer. Future development of this aquifer could provide additional water to meet increased demands, however there are limitations and restrictions to additional depletions outlined in the Bear River Compact. These restrictions consider withdrawals from the alluvial aquifer similar to river withdrawals.
It is estimated that additional development in the bedrock aquifers up to 14,000 acre-feet per year would be sustainable. Well development in the bedrock aquifers needs to be studied in greater detail to determine the impact on Bear River flows and the extent to which compact restrictions may apply.
