Wyoming State Water Plan
Wyoming State Water Plan
Wyoming Water Development Office
6920 Yellowtail Rd
Cheyenne, WY 82002
Phone: 307-777-7626

Wyoming Water Development Office
6920 Yellowtail Rd
Cheyenne, WY 82002
Phone: 307-777-7626


The basin water quality profile provides an inventory of current water quality issues and trends in the basin. Similar to the existing water use profile, surface and ground water quality was assessed in preparation for subsequent sections in the report. Current surface water quality issues serve as a basis for determining whether available surface water is of sufficient quality for future development and use. Current ground water quality is used as an indicator of whether additional ground water can be used to meet future demands.
4.1 Surface Water Quality
Water quality issues within the Bear River basin are monitored by a number of organizations and committees. One of these organizations, the Bear River Basin Water Quality Task Force has been instrumental in the coordination of water quality work within the tri-state (Idaho, Utah, and Wyoming) basin. The Task Force coordinates water quality planning issues with the appropriate regulatory agencies for each state. The primary regulatory agency that manages water quality issues within Wyoming is the Water Quality Division (WQD) of the Wyoming Department of Environmental Quality (DEQ). The WQD developed water quality standard which are documented in Chapter 1, Wyoming Water Quality Rules and Regulations. Chapter 1 is available on the WQD WEB Site at http://soswy.state.wy.us/rules/search.htm. The surface water quality standards are divided based on four surface water classifications:
Figure 22 shows the current stream classifications for the Bear River Basin. Detailed information regarding state, interstate, and federal water quality standards and monitoring are documented in the surface water quality memorandum attached as Appendix N.
When assessing water quality, it is important that there is a historic record of measurement taken at the same location, representing a range of flow regimes. The USGS has five surface water quality monitoring stations located within the Wyoming portion of the Bear River Basin that have significant historical water quality records. These stations, shown in Table 16 and located on Figure 22, monitor Class 2 stream segments.
Table 16
USGS Surface Water Quality Stations
| Gage ID | Stream Name | Period of Record |
|---|---|---|
| 10020100 | Bear River above Reservoir near Woodruff | 1985-Present |
| 10027000 | Twin Creek at Sage | 1975-1981 and 1989-Present |
| 10035000 | Smith's Fork at Cokeville | 1983-1988, 1989-1992 and 1993-Present |
| 10038000 | Bear River below Smith's Fork | 1992-Present |
| 10039500 | Bear River at Border | 1965-1989 |
Although levels of potassium, nitrogen, and sediment are of specific concern to downstream interests at Bear Lake, only sporadic measurements are available in the Bear River Basin in Wyoming. Therefore, it is difficult to determine if water flowing from Wyoming is contributing to the levels downstream. However, Total Dissolved Solids (TDS), a measure of the total amount of dissolved salts in water, is easily measured and is frequently used as an indicator of overall water quality. TDS has been measured over a relatively long period of time with some consistency at the five USGS water quality stations shown in Table 16. TDS measurements at the gaged locations were analyzed to determine:
Table 17 shows the Wyoming Water Quality Rules and Regulations TDS standards for domestic, agricultural, and livestock use.
Table 17
TDS Standards
| Pollutant | Domestic | Agricultural | Livestock |
| Total Dissolved Solids | 500 mg/L | 2000 mg/L | 5000 mg/L |
4.1.1 Compliance with Standards
Measurements at the five USGS gages were reviewed to determine if they were in compliance with the TDS standards. The following summarizes the review:
Surface water in the Bear River and Smith's Fork is of sufficient quality for domestic use. Surface water in Twin Creek is of sufficient quality for livestock and agricultural use, which is the primary use on Twin Creek. Because Twin Creek had the highest concentration of TDS in the basin, the other measured water quality parameters on Twin Creek (dissolved manganese and total nitrogen) were also reviewed. This review showed that both dissolved manganese and total nitrogen are within the acceptable range set by the Safe Drinking Water Act.
4.1.2 Relationship between TDS and Streamflow
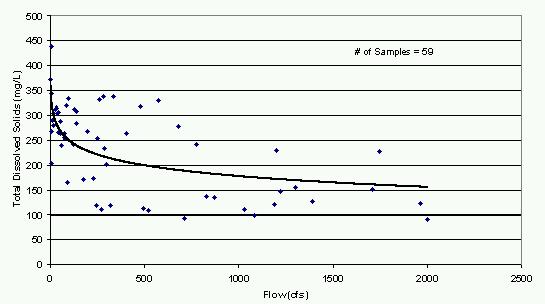
Figure 23 shows the relationship between TDS and Streamflow at the USGS gage above Woodruff Narrows Reservoir. As shown, TDS decreases with an increase in flow. This expected trend can be attributed to the source of water during different flow regimes. In the late spring and early summer, much of the flow is direct runoff from snow melt. In the late summer and non-irrigation months, a greater percent of the total flow is from agricultural and municipal return flows. Note that agricultural return flows are lagged over a four month period and these return flows are generally higher in TDS due to both human influence and naturally occurring constituents in the soil. Each of the five USGS gage sites show this general trend. As expected, the measurements also show that TDS is higher during dry years.
Figure 23
USGS Gage - Bear River above Reservoir, near Woodruff, UT
4.1.3 Variation in TDS from Upstream to Downstream Gages
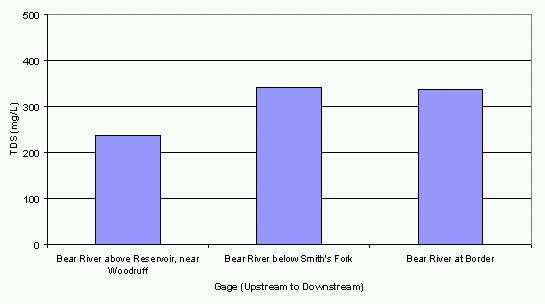
Figure 24 shows the average TDS for the available data from the Bear River above (Woodruff Narrows) Reservoir downstream to the Bear River below Smith's Fork and the Bear River at Border. As shown, the TDS increases from upstream to downstream, reflecting the use, return, and reuse of the limited resource. Twin Creek enters the Bear River between Woodruff Narrows Reservoir and Smith's Fork, which also may contribute to the increase in TDS in that reach. The reach from the Bear River below Smith's Fork to Border has little development, reflected in the TDS concentrations which remain relatively constant between the two gages.
Figure 24
Average Total Dissolved Solids along
Bear River from Upstream
to Downstream
4.1.4 Variation in TDS Over Time
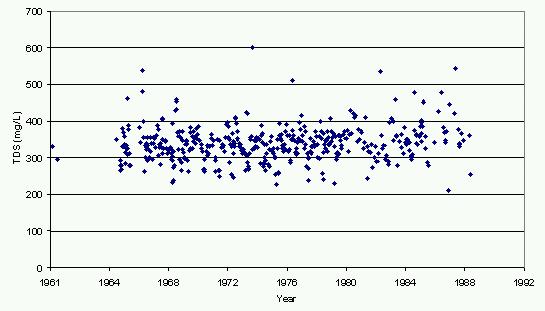
Figure 25 shows the amount of TDS measured at the Bear River at Border gage from 1961 through 1989. The TDS has been relatively constant over the available period. The other four gages also show that TDS has not increased over the period of records.
Figure 25
TDS at Bear River at Border, WY - 1961 through 1989
4.1.5 Total Maximum Daily Loads / 303(d) List
Total Maximum Daily Loads (TMDLs) are the amounts of pollutants a waterbody can receive and still maintain its designated uses. TMDLs are required to be established for each pollutant that is contributing to the impairment of a waterbody. Development of TMDLs must consider both point source and non-point source pollution and additionally must account for natural background conditions.
Section 303(d) of the Clean Water Act requires States to:
Bridger Creek is currently the only stream segment in the basin that is on the 303(d) list. The impairment on Bridger Creek was indicated as physical degradation due to non- point source pollution causing potential impairment of aquatic life use support, and was listed as a low priority for developing TMDLs. Two stream segments within the Bear River Basin were delisted from the 1998 303(d) list; Yellow Creek below the Evanston Waste Water Treatment Plant, and the Bear River below the Cokeville Waste Water Treatment. These waterbodies were delisted due to the implementation of ammonia, fecal coliform and total residual chlorine TMDLs for Yellow Creek, and the implementation of fecal coliform and total residual chlorine TMDLs for the Bear River.
Wyoming DEQ is working closely with their counterparts in Utah and Idaho to establish appropriate TMDL standards in the basin. At the time of this report, the process is still on-going.
4.1.6 Surface Water Quality Summary
The following summarizes the surface water quality in the Bear River Basin:
4.2 Ground Water Quality
Ground water quality data were obtained from the U.S. Geological Survey's Water Quality database, as discussed in Appendix O. A GIS coverage was developed from this database that provides a spatial reference for over 24 water quality parameters from 57 wells and 49 springs. Because of limited data for most parameters, only Total Dissolved Solids (TDS) is discussed in more detail.
As discussed in the Surface Water Quality Section, TDS is a measure of the dissolved solid mineral content and is a general indicator of the suitability of water for various uses. The U.S. EPA and the Wyoming Ground Water Standard for TDS in public water systems is 500 mg/L. The Wyoming Ground Water Standard for agricultural use is 2000 mg/L and for livestock use is 5000 mg/L. Table 18 lists the U.S. Environmental Protection Agency (EPA) recommended guidelines for TDS in irrigation water and its effects on crops.
Table 18
EPA Recommended Guidelines for TDS in Irrigation Water
| TDS Concentration (mg/L) | Guidelines |
| <500 | Water for which no detrimental affects are usually noticed. |
| 500 – 1000 | Water that can have detrimental affects on sensitive crops. |
| 1000 – 2000 | Water that can have adverse affects on many crops; requires careful management practices. |
| 2000 – 5000 | Water that can be used for tolerant plants on permeable soils with careful management practices. |
Figure 26 shows the location of wells with TDS measurements, and the corresponding TDS values, from the USGS database. As shown, most of the wells are in the alluvial aquifer. With the exception of the Twin Creek area, most of the TDS measurements are from the alluvial aquifer. Some TDS amounts were obtained from water conductivity measurements. TDS concentrations from thirty-three alluvial wells ranged from 190 to 1,030 mg/L as follows:
TDS concentrations from 59 bedrock aquifer wells and springs range from 54 to 5,403 mg/L as follows:
Because these measurements represent 17 different bedrock formations, any generalization concerning specific bedrock aquifer quality is speculative. Measurements in individual formations are discussed in the memorandum attached as Appendix O.
Figure 26 highlights the TDS concentrations from wells and springs. This figure shows that TDS concentrations increase from south to north in the alluvial aquifer. This is likely a result of high TDS bedrock spring discharge in the Twin Creek Area and increased agricultural and municipal return flows. As shown, measured TDS in the alluvial aquifer rarely exceeds the 1,000 mg/L standard for agricultural use.
4.2.1 Ground Water Quality Summary
Unlike continuous surface water quality gages, ground water quality measurements in the Bear River Basin have generally not been taken at the same location over time. Therefore, it is difficult to make assessments regarding trends in water quality. In addition, the number of measurements from individual bedrock formations are limited, and it is recognized that each formation is unique. However, generally conclusions can be made regarding the alluvial aquifer ground water quality: