Wyoming State Water Plan
Wyoming State Water Plan
Wyoming Water Development Office
6920 Yellowtail Rd
Cheyenne, WY 82002
Phone: 307-777-7626

Wyoming Water Development Office
6920 Yellowtail Rd
Cheyenne, WY 82002
Phone: 307-777-7626


TECHNICAL MEMORANDUM
| SUBJECT: | Snake/Salt River Basin Plan Memo 3: Future Water Demand Projections |
| PREPARED BY: | BBC Research & Consulting |
| DATE: | November 25, 2002 |
Introduction
This memorandum describes future water demand projections for the Snake/Salt River Basin (Basin) under three alternative scenarios. The first portion of the memorandum focuses on the five key economic water use sectors and describes the study team’s water use projections for those sectors in the Basin in three separate sections:
The second portion of the memorandum focuses on environmental water use within the Basin. The study team’s water use projections for this sector are presented in a similar fashion.
The bulk of this memorandum is based upon BBC estimates and projections. Other information was gathered from publicly available secondary sources and from personal and telephone interviews conducted by BBC Research and Consulting (BBC) from May through October 2002. References are listed at the end of this memorandum.
This memorandum is the third in a series of three technical memoranda related to water demands authored by the study team for the Wyoming Water Development Commission. An overview of the current conditions in key economic and water use sectors was provided in Memo 1. The water demand projections for the Basin’s key economic sectors presented here are based on the economic and demographic projections outlined in Memo 2.
Projected Water Use in Economic Sectors Water Use Factors
This section of the memorandum describes the development of the estimated water use relationships for each of the five key water using economic sectors — agricultural, municipal, rural domestic, industrial and recreational facility — within the Basin. Separate estimates of total diversions and consumptive use were calculated for each sector. After a detailed description of the methodology used to develop the water use factor in each sector, the section concludes by presenting a table of all the calculated water use factors for these sectors.
Agricultural Sector
The agricultural sector consists of three primary areas of water use: irrigated crop production, livestock sustenance and dairy water use. It is assumed that all water used by the sector within the Basin comes from surface water diversions.1
As discussed in Memo 2, the majority of the irrigated acreage within the Basin is planted to hay, although some small grains (mostly barley) are grown in both Lincoln and Teton counties. Crop-specific information on monthly consumptive irrigation requirements (CIR) for the period 1971 through 1990 was obtained by the study team (Pochop, 1992). The team then calculated monthly averages for representative “wet,” “dry” and “normal” years for the months of April through October.
The mean and maximum of these crop-specific CIR averages was calculated to represent irrigation water use in a “normal” and “high” year.2 As Exhibit 1 below shows, estimated CIR in a normal year averages about 1.3 acre-feet per acre for hay and 0.9 acre-feet per acre for grain across the Basin as a whole. During a “high” water use year, these averages climb to 1.5 and 1.4 acre-feet per acre respectively. [RJE1]
Unfortunately, analogous records of total surface water diverted for irrigation were unavailable. Diversion estimates thus had to be constructed by inflating annual CIR estimates using estimated application and conveyance efficiencies. Estimated application efficiency depends on the relative share of acreage using a gravity or sprinkler irrigation system. The study team assumed application efficiencies of 50 percent for flooded acreage and 70 percent for sprinkler-irrigated acreage (Venn, 2002). Weighted average irrigation efficiency estimates ranged from roughly 50 percent for acreage in the Upper and Lower Snake and Hoback sub-basins to nearly 70 percent in the Upper and Lower Salt and Teton sub-basins. Note that these diversion estimates assume no supply limitations within the sub-basin.
No conveyance efficiency estimates were readily available, so the 55 percent conveyance efficiency estimated for the central district within the Bear River Basin was uniformly applied throughout the Snake/Salt River Basin. Resulting annual diversion estimates were converted to an acre-foot per acre basis using the estimated irrigated acreage totals. As Exhibit 1 shows, diversions in a “normal” year average about 3.9 acre-feet per acre of hay and 2.3 acre-feet per acre of grain across the Basin as a whole. Corresponding diversions during a “high” year are 4.4 and 2.5 acre-feet per acre, respectively.
Livestock water use factors in the Basin are estimated on a per animal unit basis. Previous estimates have placed daily water requirements at 12 gallons per head for cattle and horses and 2 gallons per head for sheep. (Idaho Department of Water Resources, 1997) Range specialists for the Bridger Teton National Forest estimate a daily requirement of 17.5 gallons for each cow-calf pair (Broyles). Since a cow-calf pair is the most common definition of an animal unit, it is appropriately converted to yield a livestock water use factor of .02 acre-feet per animal unit per year.
Dairy cattle water use factors in the Basin are estimated on a per head basis. Previous studies estimated daily water use factors for dairy cattle at 35 gallons per head (Idaho Department of Water Resources, 1997) and between 22 and 46 gallons per head depending on the season (USGS). The study team chose a daily water use factor of 35 gallons per head, which converts to .04 acre-feet per head on an annual basis. It is assumed that all the Star Valley dairies are too small to have significant facility-cleaning water use requirements.
Municipal Sector
Municipal water use in the Basin includes total water use in four separate municipalities: the City of Jackson in Teton County and the towns of Afton, Alpine and Thayne in Lincoln County. In addition, there are 31 additional water systems in Teton County and 16 additional water systems in northern Lincoln County serving residential populations in unincorporated developments. All municipal water supplies in the Basin come from groundwater wells and springs (Erickson). The City of Jackson and Teton Village are the only residential/commercial water systems in Teton County where a significant share of customers are metered. In contrast, the Town of Alpine and several unincorporated water systems in Lincoln County are 100 percent metered. It is noted, however, that the Town of Afton and Thayne are completely non-metered.
Water use in this sector was analyzed in a simplified fashion on a gallon per day basis due to 1) the large number of diverse water systems within the Basin and 2) the fact that very limited information exists on end-user usage for most of these systems. For each municipal and unincorporated water system, the study team collected estimates of year round population, estimated residential equivalent units (includes seasonal and transient residents) and daily water use estimates on both an annual average and peak day basis. By dividing the daily water use estimates by estimates of resident days, it was possible to derive estimates of daily average per capita consumptive use factors for both Teton and northern Lincoln County during a “normal” year.
In order to estimate both a consumptive use factor during a “high” year and diversion factors during “normal” and “high” years for Teton County, the study team obtained aggregate water delivery and wastewater influent monthly averages for the City of Jackson for the recent 7-year period of 1993 through 1999 (Nelson Engineering, 2002). Corresponding consumptive use totals may be estimated by subtracting influent totals from deliveries. The mean and the maximum of these totals over this 6-year period were calculated to represent current water use in a “normal” and “high” demand year. On average, consumptive use during a “high” demand year was estimated to be 1.6 times that of a “normal” year. In a “normal” year, annual consumptive use is estimated to be 47 percent of total deliveries, and 53 percent of deliveries during the summer months, when an increased share of water use is devoted to outdoor irrigation. During “high” demand years, these percentages climb to 59 percent and 61 percent respectively.
These percentages were applied to Teton County totals because local experts felt that these relationships were reasonably representative of other water systems in Teton County (Norton). As Exhibit 1 shows, current daily municipal consumptive use in Teton County is estimated to range from 180 gallons per capita during a “normal” year to 290 gallons per capita during a “high” year. Similarly, Teton County estimated municipal diversions range from 380 gallons per capita during a “normal” year to 490 gallons per capita during a “high” year.
Estimation of both a consumptive use factor during a “high” year and diversion factors during “normal” and “high” years for Lincoln County was problematic due to a lack of historical data. Both the towns of Afton and Thayne operate on non-discharging lagoon systems, and no historical records were available. The only system that had historical water delivery and wastewater effluent data was the Town of Alpine, and effluent totals were found to be less than one percent of deliveries (Sunrise Engineering, 2002). Accordingly, municipal consumptive use was estimated to be 100 percent of diversions throughout Lincoln County.
In order to calculate diversion and consumptive use factors during a “high” year, water delivery monthly averages for the Town of Alpine for the recent 3-year period of 1999 through 2001 were analyzed. The mean and the maximum of these totals over this period were calculated to represent water use in a “normal” and “high” demand year. On average, water deliveries during a “high” demand year were estimated to be 1.5 times that of a “normal” year. This relationship was assumed to hold for all water systems within Lincoln County. Exhibit 1 shows that current daily municipal consumptive use and diversions in Lincoln County is estimated to range from 350 gallons per capita during a “normal” year to 510 gallons per capita during a “high” year.
Rural Domestic Sector
Throughout the Basin, the remaining residential water use in the Basin consists of domestic use on the individual ranches (and ranchettes) scattered throughout the Basin. These ranches pump their water from individual wells located on their property. Very little information exists on water use in this unmetered sector. The study team thus chose an annual average water use proxy of 200 gallons per capita per day and a peak water use proxy of 430 gallons per capita per day for this sector, as water use in this sector is thought to be comparable to rural water systems such as the Skyline Ranch Improvement and Service District (Norton). The relationship between water demand during a “normal” and “high” year for Teton County water systems was assumed for this sector. In addition, 100 percent consumptive use is assumed for the rural domestic sector. Note that water use for this sector is accounted for in the aggregate, county-level municipal water use factors described above.
Industrial Sector
Industrial water use in the Basin in not substantial. Three primary industrial water users in the Basin were identified as part of the Task 2 analysis: Star Valley Cheese Company (SVC), Northern Food and Dairy (NFD) and Water Star Bottling Company (WSB). Although the WSB has closed since the conclusion of Task 2, the town of Afton is actively recruiting other water bottling companies to take over use of the production facilities (Erickson). All three plants utilize groundwater supplies. SVC obtains its water from the same spring source as the Town of Thayne, utilizing the same pipeline. Both NFD and WSB receive their water directly from the Town of Afton municipal water system, which is supplied by springs and wells.
Current water use for the SVC is estimated to be 140,000 gallons per day, with 120,000 gallons per day discharged from the company’s private water treatment plant to the East Side Canal. Current production at the SVC is estimated to be roughly 16 million pounds of cheese per year. Assuming a 5-day workweek, this translates to annual water use factors of 2.3 gallons diverted per pound of cheese produced and 0.3 gallons of consumptive use per pound of cheese produced. This type of industrial water use is assumed to be invariant during normal and high years.
The NFD plant is estimated to use roughly 150,000 gallons per week in the production of various soy-based products. This translates into an industrial water demand of roughly 24 AF per year. Since no information on annual production totals was available, it was not possible to calculate corresponding water use factors. In addition, 100 percent consumptive use is assumed for the NFD plant (Erickson).
While it was operating, the WSB plant was estimated to use roughly 2.7 million gallons annually. Although production sometimes varied significantly from quarter to quarter, 2001 production was estimated to be 1.4 million gallons of bottled water. This implies a water use factor of 1.9 gallons per gallon of bottled water produced. This type of industrial water use is assumed to be invariant during normal and high years, and consumptive use is assumed to be 100 percent of diversions. The calculated industrial water use factors are presented in Exhibit 1.
Recreational Facility Sector
As discussed in Technical Memoranda 1 and 2, recreational water use is vitally important to the levels of overall economic activity that occur within the Basin. The majority of this use (boating, fishing, etc.) is non-consumptive. At least two important recreational water uses do exist, however, that are both consumptive and critical to existing recreational facilities which in turn are vital for maintaining overall recreation and associated tourism levels: snowmaking at alpine ski areas and golf course irrigation.
Snowmaking
To analyze the water use associated with snowmaking operations, the study team interviewed management representatives of each of the three alpine ski areas within the Basin. Each of these three areas has a significantly different scope of snowmaking operations in place, which translates to significantly different water use factors. The Snow King ski area sits right on the edge of the City of Jackson, and the area buys the water used for snowmaking directly from the city. Because Snow King is at a relatively low elevation, snowmaking operations begin earlier, sometimes starting in early to mid October. Currently, approximately 120 acres at the area receive artificial snow from snowmaking operations. In a typical year, Snow King uses roughly 20 million gallons of water to make snow, but has the capacity to use up to 600 gallons per minute, 24 hours a day if needed. This translates to an annual use of roughly 56 million gallons of water, assuming a 65-day snowmaking operation (Sullivan). This implies water diversion factors of 0.5 acre-feet per acre during a “normal” demand year and 1.4 acre-feet per acre during a “high” demand year.
In contrast to Snow King, Grand Targhee has relied historically on natural snow exclusively and only this year has installed minimal snowmaking operations. Approximately 10 acres at the area will receive artificial snow from snowmaking operations, including portions of the base, Magic Carpet and Tubing Park. Grand Targhee anticipates that roughly 1.25 million gallons of water will be used to make snow this year (Williamson). Because snowmaking operations are minimal and the area plans to continue to rely largely on natural snow, this total is assumed to be invariant during “normal” and “high” demand years. This implies water diversion factors of 0.8 acre-feet per acre during both types of years.
Jackson Hole Mountain Resort is the largest and best-known ski resort in the Basin, and not surprisingly, has the most extensive snowmaking operations. The current acreage base[RJE2] at the area is approximately 265 acres and approximately 60 percent of this acreage can receive artificial snow from snowmaking operations. Jackson Hole Mountain Resort typically uses roughly 80 million gallons in snowmaking operations over the course of 70 days during November, December and January (Blann). This implies water diversion factors of 1.5 acre-feet per acre during a “normal” demand year. Information on maximum snowmaking capacity was not available from the area, so the study team assumed the ratio between diversion factors during a “high” demand year and a “normal” demand year to be half that of Snow King, given the higher elevation enjoyed by Jackson Hole Mountain resort. This assumption implies water diversion factors of 2.2 acre-feet per acre during a “high” demand year.
Distinguishing between diversions and consumptive use for snowmaking operations is difficult, especially given the diversity in the scope of operations that exist within the Basin. In previous studies of such operations at ski areas within the Rocky Mountain region, the study team calculated consumptive use to be roughly 20 percent of total diversions (Koosinan). Accordingly, this percentage was applied uniformly to each of the three ski areas in the Basin to calculate appropriate consumptive use factors for snowmaking operations. Both diversion and consumptive use factors for each ski area appear in Exhibit 1.
Golf Course Irrigation
From roughly May through October, golf is a significant recreational activity within the Basin. There are currently five existing courses in the Basin, and plans are underway to build another three courses in Teton County and possibly another one in northern Lincoln County. In order to analyze golf course irrigation patterns, the study team interviewed superintendents for each of the existing courses, and obtained information regarding new course development from representatives of the Teton County Planning Department.
The two existing Teton County courses, Teton Pines (TP) and Jackson Hole Golf and Tennis (JHGT) are the largest and most extensively used courses in the Basin. Irrigation for these courses may begin as early as mid-April and continue until the end of October. In addition, a more intensive irrigation period occurs during the months of July and August when use is at its peak. TP has approximately 100 acres of turf that is irrigated, irrigates every night, and uses roughly 250,000 gallons per night. Irrigation water use increases to approximately 700,000 gallons per night during the peak use months (Heilbrun, Kitchen). In addition, TP has by far the most extensive water hazards of any course in the basin, covering approximately another 65 acres of surface area (B. Harmon). By comparison, JHGT has roughly 130 acres of irrigated turf but minimal acreage devoted to water hazards. JHGT typically irrigates every second night and uses approximately 150,000 gallons per night throughout the irrigation season. During the peak months, water usage at JHGT climbs to roughly 750,000 gallons per night (Pinardi). Assuming a conveyance efficiency is similar to that assumed for Basin agriculture (55 percent), water diversion factors for a “normal” year of 3.0 and 2.3 acre-feet per acre were calculated for TP and JHGT respectively. Assuming an 80 percent efficiency rate for golf course sprinkler irrigation implies corresponding consumptive use factors of 1.3 and 1.0 acre-feet per acre for these two courses. Similar demand factors for “high” years were calculated assuming that irrigation would occur every night in this instance. Note that the factors for TP remain unchanged since they already irrigate every night.
Three new courses are currently at different stages of planning and development that could come on line in Teton County during the 30-year projection period including the Canyon Club, the 4 Lazy F and a course near Teton Village being developed by Snake River Associates (Moore). Since the Canyon Club is the farthest along, it serves as the model for the other two courses for purposes of this analysis. Assuming each course covers 120 acres and irrigates in a similar fashion as existing courses (200,000 gallons every other night during the shoulder months and 700,000 gallons every night during peak months) diversion factors of 2.6 and 3.2 acre-feet per acre were calculated for “normal” and “high” demand years for each potential new course. Corresponding consumptive use factors are 1.1 and 1.4 acre-feet per acre for these courses.
The three existing Lincoln County courses, Valli Vu (VV), Star Valley Ranch (SVR) and Star Valley Ranch RV Park (SVRV) are much more modest courses than those in Teton County courses described above. None of these courses have significant water hazards. Irrigation for these courses may begin as early as the beginning of May and continue until the end of September. In addition, a more intensive irrigation period occurs during the months of July and August when use is at its peak. VV has approximately 63 acres of turf that is irrigated, irrigates every other night, and uses roughly 250,000 gallons per night. Irrigation water use increases to approximately 375,000 gallons every night during the peak use months (B. Harmon). By comparison, SVR has roughly 100 acres of irrigated turf spread across two courses and 27 holes while SVRV has 80 acres of irrigated turf on its 18-hole course. While SVR follows a similar irrigation pattern as VV (using 700,000 gallons every other night during shoulder months and 1 million gallons every night during peak months) SVRV waters every night throughout the irrigation season, with typical usage of 1 million gallons a night (B. Harmon, G. Harmon, Stewart).
According to local experts, only one new course has the potential to come on line in northern Lincoln County during the 30-year projection period (B. Harmon, G. Harmon, Stewart). The course is known as the Alpine course and would include only 9 holes over 50 acres. A state of the art irrigation system is already in place, and water usage is estimated at 150,000 gallons every other night during the shoulder months and 275,000 gallons every night during peak months. This implies diversion factors of 2.7 and 3.4 acre-feet per acre for “normal” and “high” demand years at this potential new course. Corresponding consumptive use factors are 1.2 and 1.5 acre-feet per acre. Calculated diversion and consumptive use factors for all courses described above during “normal” and “high” demand years appear in Exhibit 1 below.
Projected Annual Water Demands by Scenario
This section presents current and projected annual water demands (both diversions and consumptive use) for the Basin under each of three separate scenarios: high, medium and low water use. The assumptions underlying the agricultural and municipal sectors for each scenario have been previously described in Memo 2 of Task 4, Water Demand Projections. Since they are not a primary driver of the economic base within the Basin, scenario assumptions for the industrial and recreational facility sectors are presented here. In each case, the Mid Scenario represents the study team’s assessment of the most likely occurrence for each of these sectors.
As previously described, the Basin’s industrial sector is comprised of the SVC, the NFD and the WSB. Each facility operates completely independently of the others, and subject to a totally different set of economic influences. The High Scenario assumes that production at the SVC will remain at current levels with the majority of milk input obtained from local dairies in the Star Valley. The Mid Scenario assumes that current production levels will be maintained, but an increased share of the milk inputs will be obtained from non-local dairies. The Low Scenario assumes that the SVC will close or relocate proximate to the larger and more efficient Idaho dairies. In the case of the NFD, production decisions are assumed to be influenced by national (outside the Basin) supply and demand for soy-based products; current production levels are maintained in all three scenarios. In the case of the WSB, the High Scenario assumes that another company is found to take over the production facilities, and that production proceeds at full capacity. The Mid Scenario assumes that future production occurs at current levels. The Low Scenario assumes that the plant remains closed and no future production occurs.
Exhibit 1. Water Demand Factors by Economic Sector, Annual Diversions and Annual Consumptive Use
|
||||||||||||||||||||||||||||||||||||||||||||||||||||||||||||||||||||||||||||||||||||||||||||||||||||||||||||||||||||||||||||||||||||||||||||||||||||||||||||||||||||||||||||||||||||||||||||||||||||||||||
Source: BBC Research & Consulting.
In the recreational facility sector, scenarios are primarily defined by the study team’s assessment of future facility development opportunities. For example, each of the three alpine ski areas has expansions planned over the course of the next decade. In each case, these expansions are scheduled to occur in two separate phases. The High Scenario assumes that the full expansion will be implemented for each alpine ski area. The Mid Scenario assumes that, in each case, only the first phase of the expansion is implemented. The Low Scenario assumes that none of the expansion occurs at any of the Basin’s three alpine ski areas.
Similarly, scenarios are defined by the study team’s assessment of future golf course development in the Basin. Currently, three additional courses are planned for development in Teton County, and one additional course and one expansion of an existing course are planned in northern Lincoln County. The High Scenario assumes that all additional courses and expansions are implemented over the course of the projection period. The Mid Scenario assumes that only two of the three new Teton County courses are developed and that only the expansion of the existing course occurs in Lincoln County. The Low Scenario assumes that none of the additional courses or expansions are implemented.
Water demands are derived by multiplying current or projected demographic or production activity described in Memo 2 by the water use factors presented in the first section of this memo. Total water diversions and consumptive use are presented and discussed for each sector through three pairs of tables, one pair for each scenario. Patterns of change from current to projected future use by sector do not vary much from diversions to consumptive use within each scenario. At the bottom of each exhibit, these totals are aggregated into surface water and ground water totals for the Basin.
High Scenario
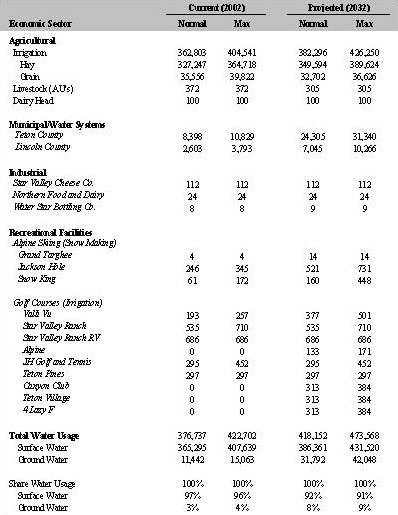
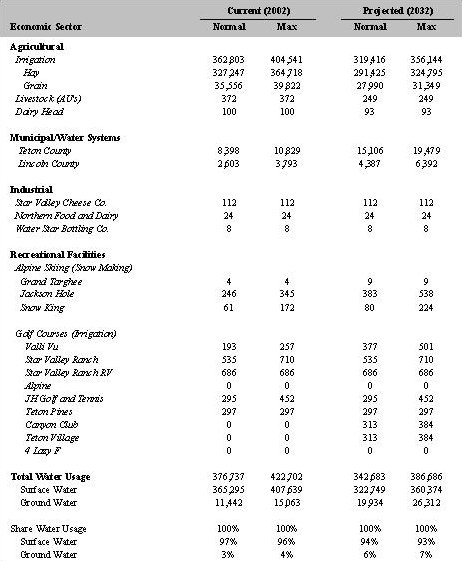
Under the assumption of a “normal” water year, total Basin water diversion requirements are projected to increase by about 11 percent from year 2002 to year 2032 under the High Scenario. In a “high” year, the increase is projected to be around 12 percent. Under “normal” water year conditions, this amounts to an increase of just over 41,000 acre-feet; under “high” demand year conditions, the increase would be about 51,000 acre-feet.
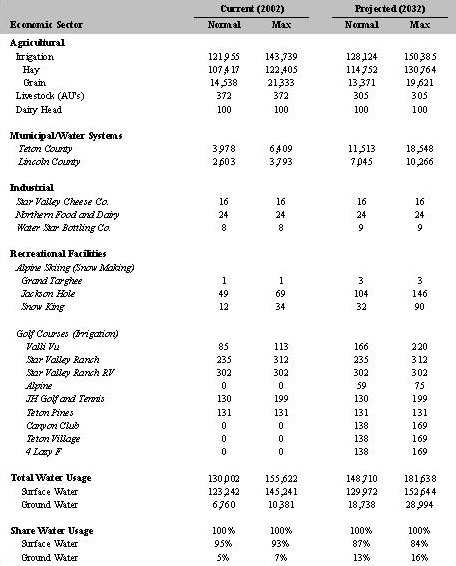
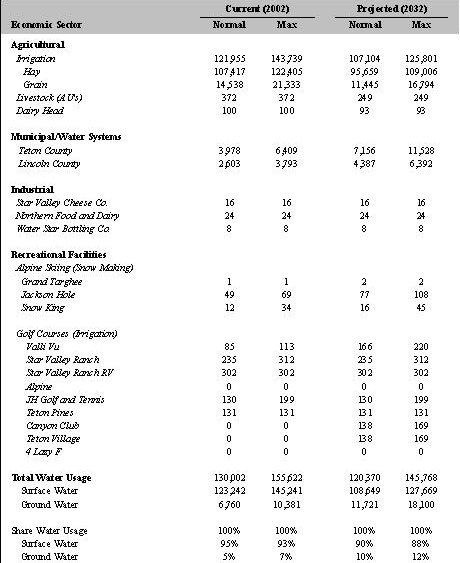
Under the High Scenario, total agricultural water demand grows slightly over the projection period, whether measured in terms of diversions or consumptive use. Despite a lack of growth in the sector, agriculture continues to comprise the vast majority of total water demand under the high scenario; agriculture is responsible for 92 percent of total water diverted and roughly 80 percent of total consumptive use in the year 2032. Consumptive use is only 33 percent of total diversions for irrigated hay production within the Basin, reflecting low efficiencies and reuse of return flows. The vast majority of agricultural water demand remains in irrigated crop production, with less than 1 percent of total projected agricultural diversions and consumptive use going to direct livestock sustenance and dairy water use.
Under the High Scenario, while municipal water demand in the Basin nearly triples over the 30-year projection period, it remains a relatively small sector, accounting for only 8 percent of total water diversions, and 13 percent of total consumptive use. Expressed in percentage terms, the increase is slightly higher in Teton County than Lincoln County because the population increase projected for that county is also slightly higher.
Water demand within the industrial sector is does not change substantially over the projection period under the High Scenario. Industrial diversions and industrial consumptive use are likely to continue to be minor considerations within the Basin, accounting for less than 1 percent of total consumptive use and total diversions.
Water demand in the recreational facility sector increases substantially under the High Scenario. Water used in snowmaking is projected to more than double while golf course irrigation water is projected to increase by roughly 60 percent over the projection period. Overall, this sector is expected to remain relatively small, accounting for approximately 1 percent of water demand, measured either in terms of consumptive use or diversions.
The share of aggregate water demand met by ground water resources within the Basin increases over the projection period under the High Scenario. Groundwater diversions increase from 3 percent to 8 percent while groundwater consumptive use increases from 5 percent to 13 percent. This increase is reflective of the relative increase in the municipal sector combined with the stability exhibited in the agricultural sector under the High Scenario.
Exhibit 2. Current and Projected Annual Snake/Salt River Water Demand High Scenario, Annual Diversions in Acre Feet per Year
Source: BBC Research & Consulting.
Exhibit 3. Current and Projected Annual Snake/Salt River Water Demand High Case Scenario, Annual Consumptive Use in Acre Feet per Year
Source: BBC Research & Consulting.
Low Scenario
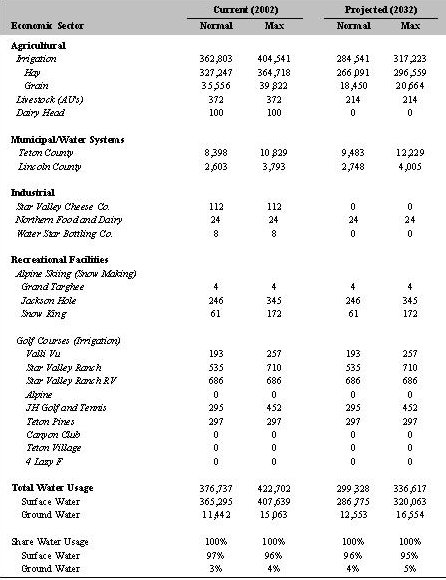
Total water diversion requirements under the Low Scenario in a “normal” year are projected to decline by 20 percent from 2002 to 2032. However, in any given year during this period, there might be the need for an additional 37,000 acre-feet in a “high” demand, dry year compared with a “normal” year.
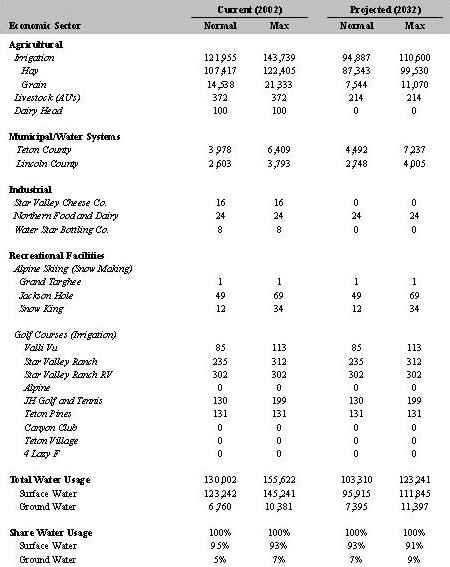
Under the Low Scenario, total water demand in the agricultural sector declines over the projection period due to the changes in the agricultural sector described in the second memorandum of Task 4, Water Demand Projections. Since both irrigation diversions and consumptive use are projected to decline by 19 percent over the projection period, overall agricultural demand declines correspondingly. The decline in livestock water demand directly reflects the increase residential development pressure in the Basin as well as potential grazing policy changes on public lands. Under the Low Scenario, the Star Valley dairy industry disappears over the projection period. Agricultural uses are projected to account for 95 percent of total diversions and 92 percent of total consumptive use by 2032.
In the municipal sector, the 11 percent increase in both diversions and consumptive use is the direct result of the projected increases in Basin population levels. Population in the Basin is projected to grow at a similar rate under the Low Scenario.
Under the Low Scenario, two of the three current industrial water users within the Basin are assumed to be eliminated. Although the overall effect on water demand within the Basin is minute due to the comparatively small amount of industrial water use, this represents the largest projected change in any one sector under the Low Scenario. Industrial diversions are projected to decline by 83 percent while industrial consumptive use is projected to decline by 50 percent while during the projection period.
Water demand in the recreational facility sector remains constant under the Low Scenario as no new ski area expansions or golf course developments are assumed to occur during the projection period. Overall, this sector is expected to remain relatively small, accounting for approximately 1 percent of water demand, measured either in terms of diversions or consumptive use.
Under the Low Scenario, the share of total groundwater diversions and consumptive use is projected to increases by roughly 1 and 2 percent respectively. The larger percentage increase in consumptive use groundwater demand is the result of the larger percentage decline in diversions within the industrial sector, which serve to offset a larger portion of the municipal use increases under the Low Scenario.
Exhibit 4. Current and Projected Annual Snake/Salt River Water Demand Low Case Scenario, Annual Diversions in Acre Feet per Year
Source: BBC Research & Consulting.
Exhibit 5. Current and Projected Annual Snake/Salt River Water Demand Low Case Scenario, Annual Consumptive Use in Acre Feet per Year
Source: BBC Research & Consulting.
Mid Scenario
Assuming a “normal” water year, total Basin water diversion and consumptive use requirements are projected to decline by about 9 percent and 7 percent respectively from year 2002 to year 2032 under the Mid Scenario. In a “high” year, the decline is projected to be similar. The projected difference in aggregate diversions and aggregate consumptive use under “normal” and “high” year water year conditions amounts to roughly 34,000 acre-feet and 10,000 acre-feet respectively.
Under the Mid Scenario, total agricultural water demand declines by roughly 12 percent over the projection period, whether measured in terms of diversions or consumptive use. Despite the projected decline in sectoral demand, agriculture continues to comprise the vast majority of total water demand under the Mid Scenario; agriculture is responsible for 93 percent of total water diverted and roughly 89 percent of total consumptive use in the year 2032 under “normal” year conditions. Consumptive use is only 33 percent of total diversions for irrigated hay production within the Basin. The vast majority of agricultural water demand remains in irrigated crop production, with less than 1 percent of total projected consumptive use going to direct livestock sustenance and dairy water use.
Under the Mid Scenario, while municipal water demand increases by 77 percent over the 30-year projection period, it remains a relatively small sector, accounting for only 6 percent of total water diversions, and 10 percent of total consumptive use within the Basin. Municipal consumptive use is projected to increase by almost 80 percent in Teton County and by 69 percent in northern Lincoln County over the projection period. As before, the larger increase in Teton County reflects the larger increase in population projected for that county.
Under the Mid Scenario, both water diversions and consumptive use in the Basin industrial sector is projected to remain unchanged from current levels. Industrial water use will remain a small component of overall Basin water use accounting for less than 1 percent of total diversions and total consumptive use by the end of the projection period.
Water demand in the recreational facility sector grows substantially under the Mid Scenario as the first phase of the planned ski area expansions and a portion of the planned golf course developments within the Basin are projected to be completed. In spite of the fact that both snowmaking and golf course irrigation demands are projected to increase by 52 percent and 40 percent respectively, this sector remains relatively small overall, accounting for approximately 1 percent of water demand, measured either in terms of diversions or consumptive use. Under the Mid Scenario, the share of total diversions and consumptive use from groundwater sources is projected to increase to roughly 6 and 10 percent respectively. This increase is reflective of the significant increase in the municipal sector combined with the decline exhibited in the agricultural sector under the Mid Scenario.
Exhibit 6. Current and Projected Annual Snake/Salt River Water Demand Mid Case Scenario, Annual Diversions in Acre Feet per Year
Source: BBC Research & Consulting.
Exhibit 7. Current and Projected Annual Snake/Salt River Water Demand Mid Case Scenario, Annual Consumptive Use in Acre Feet per Year
Source: BBC Research & Consulting.
Projected Monthly Demands by Scenario
Current and projected monthly water demands (both diversions and consumptive use) have been prepared for the Basin under the High, Low and Mid scenarios. Monthly water demands are derived by multiplying current and projected annual water demands for each sector by observed monthly shares of annual water use over the historical period. Total water diversions and consumptive use are presented and discussed for each sector through three tables, one for each scenario.
An analysis of the temporal distribution of water demands throughout the year illustrates the seasonal nature of water demand within the Basin. Almost all sectors exhibit a significant difference in demand between the peak summer months and the off-peak winter months. Such distinct seasonal patterns in water demand are characteristic of economies for areas with colder climates similar to the Basin. One simplifying assumption is that the temporal distribution of diversions and consumptive use throughout the year are identical.
The distribution of irrigation water demand was calculated from the aggregate CIR information obtained by the study team. As expected, positive demand for irrigation water occurs only from April through October. Livestock water demand is assumed to be twice as high during the months of April through September to reflect both the presence of the spring calf crop and the increased temperatures during those months. Water demand for the Basin’s dairy industry is assumed to be distributed in a similar fashion (USGS).
Municipal water demand in Teton County was based on the average monthly water use observed for the City of Jackson in 1993-99 (Nelson Engineering, 2002). This seasonal distribution was assumed to extend to all other water systems throughout the county (Norton). The distribution exhibits a baseline demand of between 5 to 7 percent per month for the months of October through May, with nearly half of total water demand in these sectors occurring during the months of June through September.
Municipal water demand in Lincoln County was based on the average monthly water use observed for the Town of Alpine in 1999-2001 (Sunrise Engineering, 2002). The seasonal distribution is similar to that observed for Jackson, and was assumed to extend to all other water system throughout Lincoln county. Baseline demand runs between 5 and 8 percent per month for the months of October through May, and over 50 percent of annual water demand in this sector occurs during the months of June through September.
Industrial water demand in the Basin was assumed to be constant throughout the year, with the exception of the NFD. Since production varies according to nation supply and demand for soy products, the study team derived a seasonal water use distribution from monthly data on the domestic consumption of soybean products (Economic Research Service, 2002). The distribution exhibited minimal variance, peaking slightly from September through November and reaching a minimum during the summer months.
Data used to determine the seasonal distribution of water demand in the recreational facility sector was obtained through interviews with management of local ski areas and golf courses. Water demand in this sector exhibits a bi-modal seasonal distribution. Snowmaking in the Basin begins in early October at Snow King and may run through mid January at Jackson Hole Mountain Resort. Roughly half of the Basin’s snowmaking water use occurs during the month of November. In contrast, the golf course irrigation season may start as early as mid April and run through the end of October at Teton County courses. Lincoln County courses have only a slightly shorter irrigation season. Overall, nearly 60 percent of golf course irrigation water in the Basin is used during the peak months of July and August.
High Scenario
The aggregate temporal distribution of water demand in these sectors within the Basin under the High Scenario is presented in Exhibit 8 below. It is possible to divide the months into three categories of water use: the baseline or off-peak months of September through April; the peak months of June and July; and the shoulder months of May and August.
Exhibit 8. Current and Projected Monthly Snake/Salt River Basin Water Demand High Case Scenario, Estimated Diversions and Consumptive Use in Acre Feet
|
|||||||||||||||||||||||||||||||||||||||||||||||||||||||||||||||||||||||||||||||||||||||||||||||||||||||||||||||||||||||||||||||||||||||||||||||||||||||
Source: BBC Research & Consulting.
The distribution of percentage increases over the 2002-2032 projection period is exactly inverted, with the largest percentage increases coming the baseline months (roughly 160 percent) and the smallest percentage increases coming during the peak months (roughly 9 percent). This result stems from the fact that the largest water-using sector in the baseline months is the municipal sector (the fastest growing sector) while the primary water-using sector in the peak months is the agricultural sector (the slowest growing sector). Low Scenario
The aggregate temporal distribution of water demand in the Basin under the Low Scenario is presented in Exhibit 9 below.
Exhibit 9. Current and Projected Monthly Snake/Salt River Basin Water Demand Low Case Scenario, Estimated Diversions and Consumptive Use in Acre Feet
|
|||||||||||||||||||||||||||||||||||||||||||||||||||||||||||||||||||||||||||||||||||||||||||||||||||||||||||||||||||||||||||||||||||||||||||||||||||||||
Source: BBC Research & Consulting.
Under the Low Scenario, water demand for the Basin increases slightly (between 4 and 6 percent) from October through March but declines from April through September. The sharpest projected decline (roughly 21 percent) comes during the peak summer months. Both the sharp decline projected for the agricultural sector combined with the overall dominance of that sector in terms of water demand determines the pattern of change under the Low Scenario.
Mid Scenario
The aggregate temporal distribution of water demand in the Basin under the Mid Scenario is presented in Exhibit 10 below.
Exhibit 10. Current and Projected Monthly Snake/Salt River Basin Water Demand Mid Case Scenario, Estimated Diversions and Consumptive Use in Acre Feet
|
|||||||||||||||||||||||||||||||||||||||||||||||||||||||||||||||||||||||||||||||||||||||||||||||||||||||||||||||||||||||||||||||||||||||||||||||||||||||
Source: BBC Research & Consulting.
The temporal distribution of water demand under the Mid Scenario essentially splits the difference between the patterns exhibited under the other two scenarios. As can be seen in Exhibit 10, significant increases (between 48 and 69 percent) are projected for the months of October through April (driven by municipal demand) while slight decreases (roughly 10 percent) are projected for the peak months of May through August (driven by agricultural demand). September exhibits a more modest increase of roughly 11 percent.
Projected Water Use in the Environmental Sector
Environmental water uses are difficult to define, and the development (let alone the quantification) of a completely comprehensive list of these uses is beyond the scope of this project. Accordingly, the study team chose to restrict the definition of environmental uses to include only those uses associated with efforts aimed at restoring, maintaining or improving the environmental services provided by the water resource, such as fish and wildlife habitat. An “environmental” memorandum submitted as part of the Task 2 Basin Water Use Profile lists several such efforts that are currently ongoing in the Basin. The study team refined this list and identified a set of important existing and potential environmental efforts within the Basin. These efforts fell into two distinct categories: 1) In-stream Flow (ISF) agreements and 2) Wetlands projects. For each effort, the team quantified current water use, and projected future water use for a High, Low and Mid Scenario. These projections are presented below in three sections. First, water use factors are estimated for each effort. Second, current and projected environmental water uses are presented on an annual basis, in order to examine changes in this sector likely to occur over the projection period. Third, annual totals are presented on a monthly basis, in order to provide insight regarding the seasonal demand projected in this sector.
Water Use Factors
This section of the memorandum describes the development of the estimated water use factors for the Basin’s environmental sector. Because water use in this sector occurs in situ, diversions are assumed to be equivalent to consumptive use. In addition, water used in this sector is assumed invariant from “normal” to “high” water demand years. After a detailed description of the methodology used to develop each water use factor for this sector, the section concludes by presenting a table of all the calculated water use factors.
Instream Flow Agreements
The first category of environmental water demands is existing or potential ISF agreements. Because these flows may not be diverted for other uses, they must be treated as a separate, incremental, water demand within the Basin. Both the temporal and spatial aspects of ISF agreements are important. Most ISF agreements specify an average flow level for all months throughout the year that must be met in a specific reach targeted by the agreement. Additionally, the location of the affected reach is critical, since an ISF requirement will affect all potential upstream uses.
An existing (though informal) ISF agreement within the Basin requires the maintenance of a minimum flow level for a reach of the Snake River, located just below Jackson Lake. Jackson dam enables controlled releases from Jackson Lake in order to maximize the benefit to agricultural water right holders located downstream in Idaho. The Wyoming Game and Fish Department (WGF) determined that historical releases during the winter months were insufficient for maintaining adequate fish habitat in this reach of the river. Accordingly, the WGF and the Bureau of Reclamation (BOR) agreed to release enough water to maintain a minimum flow of 280 cubic feet per second (cfs) from October to April (Gibson). In addition, the State of Wyoming can transfer the storage of 33,000 acre-feet of water from Palisades Reservoir to Jackson Lake for use by WGF. This water is held in reserve and serves as an insurance policy in the event that the BOR is unable to meet the agreed upon minimum flow requirement at some point in the future.
In addition to this agreement, four separate ISF applications have been filed with the Wyoming State Engineers Office (WSE) that affect reaches located within the Basin. Specifically, these applications include reaches on the Salt River (221 cfs), the Greys River (204 cfs from July to March and 350 cfs from April to June) and two separate, but closely proximate reaches on Fish Creek (150 cfs each). The approval of any or all of these applications would significantly increase the amount of water committed to environmental uses within the Basin.
The estimated flow required by ISF agreements may be converted to an annual volume measurement by employing the conversion factor of 724 acre-feet per year for each cfs.
Wetlands Projects
A second category of environmental water demand within the Basin is water dedicated to wetland areas. This water should, in theory, be treated as an incremental water demand because of the environmental services it provides. Maintaining an accurate accounting of such water is difficult, however, because wetlands are often difficult to define, and considerable wetland activity is occurring within the Basin.
There is general agreement that fewer wetlands exist within the Basin today than 100 years ago due to draining for agricultural uses and residential development (Anthony). Since the enactment of the Clear Water Act, however, all regulated (naturally occurring) wetlands that are drained and filled must be mitigated. The Army Corps of Engineers keeps of strict count of the Basin acreage associated with such mitigation projects (Johnson). In addition, a significant amount of pond construction occurs on private residential lands within the Basin for aesthetic reasons (Barney). The water associated with these projects may most accurately be characterized as irrigation since they often utilize the agricultural water right obtained with the land and are frequently accompanied by continued irrigation practices on other portions of the acreage.
Because accurate accounting of wetlands is so difficult, the study team chose a conservative approach for estimating the associated water demand. Only wetlands projects that specifically target wildlife habitat improvement are included in the estimates. While the list of projects presented here is not all-inclusive, it provides a flavor of some existing and potential wetlands projects in the Basin.
The first entry in this category is a group of wetlands projects to be undertaken by the Jackson Hole Land Trust (JHLT). These projects aimed at the restoration of habitat for Wyoming Trumpeter Swans and other waterfowl habitat. The trust has applied for grant funds, available through the North American Wetlands Conservation Act (NAWCA) and administered by the U. S. Fish and Wildlife Service (USFWS). If the grant application is approved, the money will fund projects at 13 separate sites in the Basin, 11 of which involve either the restoration of existing wetlands or the creation of new wetlands. The majority of the projects are located near Jackson with the remainder located on lands adjacent to the Gros Ventre River.
The total affected acreage in these projects is roughly 1,000 acres, including 530 upland acres and 470 wetland acres. Average depth on the affected wetland acres is unknown and probably varies substantially (Sergerstrom). Accordingly, a proxy of 5 feet was used, an amount equivalent to the average irrigation of pasture in Teton County (Sunrise Engineering).
A second set of projects in this category are wetland impoundments within the National Elk Refuge, which is located just north of Jackson and is administered by the United States Fish and Wildlife Service (USFWS). According to its website, the Refuge consists of 25,000 acres, including nearly 1,000 acres of open water and marsh lands (National Elk Refuge web site). According the Refuge biologist, however, the total open-water surface area within the Refuge is roughly 290 acres, including approximately 75 acres of wetlands created from impoundments. These wetland impoundments have an average depth of approximately three feet (Smith).
The final wetlands project included in this analysis is a wildlife viewing area created by the WGF at the upper end of Palisades reservoir in Lincoln County. The project consists of seven separate ponds created through a system of dykes. The surface area of these ponds totals roughly 115 acres, and the total area of the project is estimated to be 300 acres. Total holding capacity of the ponds is estimated to be roughly 215 acre-feet, for an average depth of roughly 1.9 acre-feet per acre (Geyer). While up to 30 cfs may be diverted for this project, the projects holding capacity is assumed to accurately reflect the environmental water demand associated with the project.
Calculated water use factors for all the environmental demands appear in Exhibit 11 below.
Exhibit 11. Environmental Water Demand Factors Snake/Salt River Basin, Wyoming
| |||||||||||||||||||||||||||
Source: BBC Research & Consulting.
Projected Annual Environmental Water Demands by Scenario: High Scenario
Total annual environmental water demand is projected to grow by almost 400 percent from year 2002 to year 2032 under the High Scenario. This amounts to an increase of just over 450,000 acre-feet in environmental water demand.
This increase is the result of two important assumptions: 1) that all existing instream flow applications are approved and 2) that all the wetlands projects proposed by the JHLT are funded and implemented. The instream flow agreements would account for an additional 440,000 acre-feet of environmental water demand or nearly 97 percent of the total estimated increase. Under the High Scenario, it is also assumed that water use currently committed to Snake River minimum flows, NER wetlands and the Palisades wildlife viewing area would remain at current levels. Exhibit 12 below presents current and projected environmental water uses under the High, Low and Mid Scenarios.
Exhibit 12. Annual Demands in Acre Feet per Year — High, Low and Scenarios
|
||||||||||||||||||||||||||||||||||||||||||||
Low Scenario
Under the Low Scenario, total annual environmental water demand is projected to decline by roughly 70 percent from year 2002 to year 2032. This amounts to a decrease of just over 85,000 acre-feet in environmental water demand.
The projected decline under the Low Scenario is solely attributable to the change in assumed annual instream flows in the reach of the Snake River near Moran. The current informal agreement between BOR and WGF is assumed to dissolve, and WGF is thus compelled to release the 33,000 acre-feet currently stored in Jackson Lake in order to preserve fish habitat. In addition, the Low Scenario assumes that none of the instream flow applications currently on file will be approved and that the JHLT is unsuccessful in receiving NAWCA funding for its proposed wetlands projects. All other existing environmental uses are assumed to remain at current levels.
Mid Scenario
Under the Mid Scenario, total environmental water demand is projected to increase by 300 percent from year 2002 to year 2032. This amounts to an increase of just over 340,000 acre-feet in environmental water demand.
Under the Mid Scenario, the overall increase results directly from approval of certain ISF applications and half of the proposed JHLT wetlands projects. Under this scenario, however, only the ISF applications on the Salt and Greys River are assumed to be approved. The ISF applications for Fish Creek are assumed to be denied, because average historical flows are less than the requested ISF amount for seven months during the year. Exhibit 13 below presents historical mean flow levels together with instream flow requests, on a monthly basis, for each of the affected reaches in the Basin.
Exhibit 13. Historical Monthly Mean Flows and Requested Minimum Instream Flows for Affected Reaches in the Snake/Salt River Basin (Measured in Cubic Feet per Second)
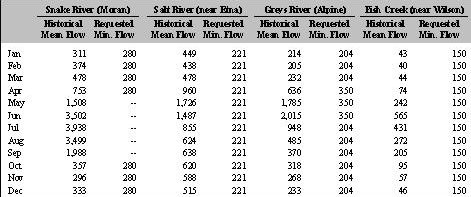
Source: Historical data are averages calculated from USGS monthly flow data published online at http://waterdata.usgs.gov/wy/nwis/monthly. Requested minimum flows are from WGF and from applications on file at the WSE.
According the representatives of the WSE office, it unlikely that applications requesting greater ISF than historical averages will be approved (Geyer). The approved ISF requirements would, nevertheless, be responsible for an additional 330,000 acre-feet of environmental water demand or nearly 98 percent of the total estimated increase. The water currently committed to Snake River minimum flows, NER wetlands and the Palisades wildlife viewing area is assumed to remain at present levels under the Mid Scenario.
Projected Monthly Environmental Water Demands by Scenario
Current and projected monthly environmental water demands have been prepared for the Basin under the High, Low and Mid scenarios. As before, monthly water demands are derived by multiplying the current and projected annual water demands for each sector by observed monthly shares of annual water over the historical period. Monthly demands are presented and discussed through three tables, one for each scenario.
The aggregate distribution of environmental water demand in the Basin was calculated using separate assumptions about each of the individual water uses. For example, positive demand for a minimum flow in the Snake River just below Jackson dam occurs only from October through April. Likewise, each of the ISF applications have temporal specifications. As seen above in
Exhibit 15, while the applications for the Salt River and Fish Creek involve a uniform flow throughout the year, the Grey’s River application has a slightly higher demand during the months of April through June.
Environmental water demand for both the NER wetlands and the JHLT wetland projects is assumed to be uniformly distributed throughout the year. The distribution of environmental water demand for the Palisades wildlife viewing area is assumed to be perfectly correlated with average historical water levels at the Palisades reservoir.
High Scenario
The aggregate temporal distribution of water demand in these sectors within the Basin under the High, Low and Mid Scenarios is presented in Exhibit 14 below.
Exhibit 14. Monthly Distribution of Snake/Salt River Basin Environmental Water Demand
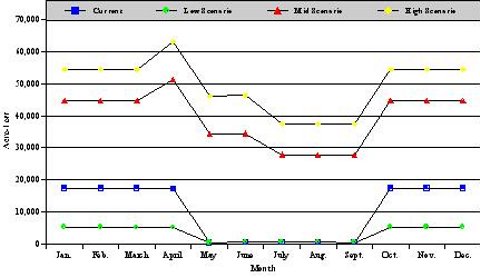
Source: BBC Research & Consulting.
As demonstrated in the above exhibit, ISF requirements are the most important factor in determining the monthly distribution of environmental water demands. For example, current monthly demands are almost completely defined by the minimum flow requirement below Jackson Lake. During the months of October through April when this requirement is in place, environmental water demand in the Basin shifts from less than 1,000 acre-feet to nearly 20,000 acre-feet.
Similarly, the assumption that all ISF applications are approved under the High Scenario serves to dramatically increase water demand in this sector throughout the year. Monthly environmental water demand under the High Scenario ranges between 38,000 and 63,000 acre-feet. Demand is at its low point during the summer months (when there is no minimum flow requirement on the Snake River) and peaks in the month of April when all ISF requirements are at a maximum.Under the Low Scenario, environmental water demand for the Basin remains at current levels from May through September and decreases by roughly 70 percent from October through April. The decline during these months results directly from the assumption that WFG is forced to utilize its water reserves stored in Jackson Lake to maintain fish habitat in the reach of the Snake River near Moran. All other environmental water demands identified here are projected to remain at current levels under the Low Scenario.
Although proportionately smaller, the seasonal distribution of water demand under the Mid Scenario is nearly identical to that projected under the High Scenario. The difference in monthly demands under the two scenarios is roughly 11,000 acre-feet, and is largely determined by the assumption that only two of the four ISF applications will be approved. The assumption that only a portion of the JHLT wetlands projects will be funded under the Mid Scenario also affects this difference, but its impact is much smaller.
Summary
This memorandum has presented the water demand projections developed for the Snake/Salt River Basin under three alternative scenarios. The methodology used to derive the quantitative relationships (water use factors) for each water use sector is outlined and discussed. These water use factors, together with projected demographic and economic information, are applied to develop annual water use projections by sector under three alternative scenarios. Observed monthly distributions of annual totals for each sector allowed the study team to derive monthly aggregate water use projections for each scenario.
Among the economic sectors, the largest projected changes in water demand occur in the municipal sector. Total municipal water demand remains small relative to water demand in the agricultural sector. While the agricultural sector experiences the smallest percentage change over the projection period, the sector’s relative magnitude allows it to drive projected annual and monthly water use patterns. Although industrial water use is largely eliminated under the Low Scenario, the sector’s diminutive size implies a minimal overall impact on water demand in the Basin under any scenario. The recreational facility sector is also comparatively small, but exhibits substantial increases in demand under both the High and Mid scenarios.
The second portion of this memorandum presented water demand projections for the environmental sector. Demand in this sector was defined to include only water used in existing and potential efforts aimed at enhancing environmental services such as fish and wildlife habitat. Scenarios were defined for this sector through the study team’s assessment of the likelihood of future activity in the Basin. The approval or denial of ISF agreements largely drives future water demand in this sector. Wetlands projects undertaken in the Basin make a comparatively minor contribution to water use in the environmental sector.
References
1 In fact, there are roughly 600 acres permitted for ground water use within the basin, but no records were found concerning actual irrigation practices on these acres (Erickson). This amount of acreage was deemed negligible and was thus not included in the analysis.
2 Because “wet,” “dry,” and “normal” years were defined using annual stream flows while calculated consumptive irrigation requirements are a function of precipitation and temperature, some data anomalies occurred within the consumptive irrigation requirement averages. The study team felt that this was the best approach to establish a representative range of consumptive irrigation requirement estimates for each county within the Basin.
Interview with Bill Collins, Teton County Planning Director, October 2001.
Interview with Levi Broyles, Vegetation Management Program Facilitator, Bridger-Teton National Forest, June 2002.
Interview with Walt Grows, Rangeland Management Specialist, Caribou-Targhee National Forrest, June 2002.
Interview with Jody Kennington, Lincoln County Executive Director, Farm Service Agency, USDA, June 2002.
Interview with Doug Powell, Natural Resource Specialist, Pinedale Field Office, Bureau of Land Management, June 2002.
Interview with Michelle Easeley, Natural Resource Specialist, Kemmerer Field Office, Bureau of Land Management, June 2002.
Interview with Alan Gray, Forage Agronomist, Director of Powell Research and Extension Center, University of Wyoming, July 2002.
Interview with Gurn Brown, retired Agricultural Extension Specialist, Lincoln County, July 2002.
Interview with Bill Resor, Owner, Snake River Ranches, BAG Member, July 2002.
Interview with Jim Maher, Teton County Brand Inspector, July 2002.
Interview with Chad Madson, Owner, Yellowstone Horses, October 2002.
Interview with Alan Rosenbaum, Manager, Pinto Ranch, October 2002.
Interview with Jim Sullivan, General Manager, Snow King Ski Area, August 2002.
Interview with Larry Williamson, General Manager, Grand Targhee Ski Area, August 2002.
Interview with Jerry Blann, General Manager, Jackson Hole Mountain Resort, August 2002.
Interview with Bob O’Neil, Director of Guest Activities, Grand Teton Lodge Company, August 2002.
Interview with John King, General Manager, Signal Mountain Lodge, August 2002.
Interview with John Turner, Owner, Triangle X Ranch, August 2002.
Interview with Dick Barker, Owner, Barker Ewing Float Trips, August 2002.
Interview with Susan Marsh, Recreation Staff Officer, Bridger-Teton National Forest, August 2002.
Interview with Wendy Koelfgen, Clerk, Chief Rangers Office, GTNP, August 2002.
Interview with Kim McMahill, Concession’s Specialist, Concessionaires Office, GTNP, August 2002.
Interview with Marty Myer, River Ranger, GTNP, August 2002.
Interview with Chris Wolf, Assistant Professor, Department of Agricultural Economics, Michigan State University, August 2002.
Interview with Bob Norton, Project Engineer, Nelson Engineering, October 2002.
Interview with Ryan Erickson, Project Engineer, Sunrise Engineering, October 2002.
Interview with Robert Koosinan, Steamboat Springs Ski Corporation, 1997.
Interview with Jeff Heilbrun, Mike Kitchen, General Manager and Superintendent, Teton Pines Golf Course, September 2002.
Interview with Bond Harmon, Superintendent, Vali Vu Golf Course and former Superintendent, Teton Pines Golf Course, September 2002.
Interview with Georgette Harmon, Superintendent, Star Valley Ranch Golf Course, September 2002.
Interview with Harold Stewart, Superintendent, Star Valley R.V. Park Golf Course, September 2002.
Interview with John Pinardi, General Manager, Jackson Hole Golf and Tennis, September 2002.
Interview with Curt Moore, Planner, Teton County Planning Department, October 2002.
Interview with Paul Anthony, Planner, Teton County Planning Department, October 2002.
Interview with Rob Gibson, Biologist, Wyoming Department of Game and Fish, October 2002.
Interview with Don Barney, Superintendent, Teton County Road and Bridge Department, October 2002.
Interview with Tom Johnson, Army Corps of Engineers, October 2002.
Interview with Bruce Smith, Refuge Biologist, National Elk Refuge, October 2002.
Interview with Tom Segerstrom, Stewardship Coordinator and Staff Biologist, Jackson Hold Land Trust, October 2002.
Interview with Jeff Geyer, Surface Water Analyst, Wyoming State Engineers Office, October 2002.
Economic Research Service, United States Department of Agriculture, Livestock Baseline Projections, February 2002. http://www.ers.usda.gov/briefing/baseline/.
Economic Research Service, United States Department of Agriculture, Monthly data on "disappearance" of crushed soybean products for domestic consumption, 2002. Data published online at: http://www.ers.usda.gov/briefing/soybeansoilcrops/Data/table1.xls.
Grand Teton National Park, Concessionaire’s Office, unpublished data, 2002.
Grand Teton National Park, Visitor Use Statistics, published on the web at URL: http://www2.nature.nps.gov/stats/.
National Agricultural Statistics Service, Published Online Estimates Database, http://www.usda.gov/nass/.
Nelson Engineering, unpublished data, 2002.
Pochop, Larry, Travis Teegarden, Greg Kerr, Ronald Delaney, and Victor Hasfurther, Consumptive Use and Consumptive Irrigation Requirements in Wyoming, University of Wyoming Cooperative Extension Service and Wyoming Water Research Center, WWRC Publication #92-06, 1992.
Sunrise Engineering, unpublished data, 2002.
U.S. Department of Agriculture, Census of Agriculture, 1997. http://www.nass.usda.gov/census/ [new link 10/2009 HERE].
U.S. Department of Commerce, Bureau of Census, 2000 Census of Population and Housing. http://factfinder.census.gov/home/saff/main.html?_lang=en.
U.S. Department of Commerce, Bureau of Economic Analysis, Regional Economic Information System, 2001. http://www.bea.doc.gov/bea/regional/reis/
U.S. Department of Commerce, Bureau of Economic Analysis, Employment by Industry for Lincoln and Teton Counties, 2000. Published online at http://eadiv.state.wy.us/i&e/i&e.asp.
U.S. Geologic Survey, Estimated Water Use at Dairy Farms in Gooding, Jerome and Twin alls Counties, Idaho, 1990-93. Factsheet from National Water Quality Assessment Program, published online at http://wwwidaho.wr.usgs.gov/nawqa/factsheet/MAUPIN.111.html.
Venn, Brian, Hydraulic Impacts Due to Conversion from Flood to Sprinkler Irrigation Practices, unpublished Masters Thesis, University of Wyoming, 2002.
Wyoming Agricultural Statistics, 2001, Wyoming Agricultural Statistics Service. http://www.nass.usda.gov/wy/ [new link 10/2009 HERE].
Wyoming Department of Administration and Information, Division of Economic Analysis, Profiles of General Housing Characteristics by County and Place, published online at http://eadiv.state.wy.us/housing/HU_2000.htm.
Wyoming Department of Health, Vital Statistics, various years. http://wdhfs.state.wy.us/vital_records/99DATA/menu.pdf [new link 10/2009 HERE].
Personal Interviews/Written Communications Completed in the Year 2002
Anthony, Paul, Teton County Planning Department.
Barker, Dick, Barker Ewing Float Trips.
Barney, Don, Teton County Road and Bridge Department.
Blann, Jerry, Jackson Hole Mountain Resort.
Brown, Gurn, retired Agricultural Extension Specialist.
Broyles, Levi, Bridger-Teton National Forest.
Collins, Bill, Teton County Planning Department.
Dana, Frank, Starr Valley Cheese Factory.
Easeley, Michelle, Bureau of Land Management.
Erickson, Ryan, Sunrise Engineering.
Gibson, Rob, Wyoming Department of Game and Fish.
Gray, Alan, University of Wyoming.
Geyer, Jeff, Wyoming State Engineers Office.
Grows, Walt, Caribou Targhee National Forest.
Harmon, Bond, Vali Vu Golf Course.
Harmon, Georgette, Star Valley Ranch Golf Course.
Heilbrun, Jeff, Teton Pines Golf Course.
Johnson, Tom, Army Corps of Engineers.
Kennington, Jody, Lincoln County Farm Service Agency.
King, John, Signal Mountain Lodge.
Kitchen, Mike, Teton Pines Golf Course.
Koelfgen, Wendy, Grand Teton National Park.
Madson, Chad, Yellowstone Horses.
Maher, Jim, Teton County.
Marsh, Susan, Bridger-Teton National Forest.
McMahill, Kim, Grand Teton National Park.
Moore, Curt, Teton County Planning Deparment.
Myer, Marty, Grand Teton National Park.
Norton, Bob, Nelson Engineering.
O’Neil, Bob, Grand Teton Lodge Company.
Pinardi, John, Jackson Hole Golf and Tennis.
Powell, Doug, Bureau of Land Management.
Resor, Bill, Snake River Ranches.
Rosenbaum, Alan, Pinto Ranch.
Segerstrom, Tom, Jackson Hole Land Trust.
Smith, Bruce, National Elk Refuge.
Stewart, Harold, Star Valley RV Park Golf Course.
Sullivan, Jim, Snow King Ski Area.
Turner, John, Triangle X Ranch.
Williamson, Larry, Grand Targhee Ski Area.
Wolf, Chris, Michigan State University.
Published Data Sources
Bureau of Economic Analysis, Full and Part-Time Employment by Industry, Teton County, Wyoming. Published on the web page for the Division of Economic Analysis at the Wyoming Department of Information and Administration at URL: http://eadiv.state.wy.us/i&e/i&e.asp.
Grazing Use and Open Space Study, Grand Teton National Park and Teton County Wyoming, Review Draft of Report submitted to Congress by United States Department of the Interior, National Park Service, Grand Teton National Park, February 2001.
Housing Needs Assessment, Teton County Wyoming, prepared for Teton County Housing Authority by Prior and Associates, August, 2001.
Land and Resource Management Plan, Bridger-Teton National Forest United States Forest Service.
Lincoln and Teton County IMPLAN coefficients.
Report on the Economic Impact of the Travel Industry in Wyoming, 1999, 2000 Morey and Associates/ Department of Economics, University of Wyoming.
Revised Forest Plan, Caribou-Targhee National Forest, Intermountain Region R-4, United States Forest Service, April 1997.
The Economic Impact of Travel on Wyoming, 1997-2001 State Estimates, Prepared for the State Office of Travel and Tourism, Dean Runyan Associates, December 2001. Teton County Wyoming, Affordable Housing Support Study, Draft, May 2002.
Wyoming Department of Employment , Wyoming Covered Employment, Total Payroll, Annual and Weekly Wages by Region and County 1997 and 1998, Published on the web at http://wydoe.state.wy.us/.
Wyoming Department of Employment, Employing Units, Employment, Total Wages, Average Weekly Wage & Annual Wages for Teton County by Division 1998, Published on the web at URL: http://wydoe.state.wy.us/.