Wyoming State Water Plan
Wyoming State Water Plan
Wyoming Water Development Office
6920 Yellowtail Rd
Cheyenne, WY 82002
Phone: 307-777-7626

Wyoming Water Development Office
6920 Yellowtail Rd
Cheyenne, WY 82002
Phone: 307-777-7626


This chapter presents estimates of the availability of surface water to meet future water uses and also characterizes the potential for ground water development.
As with all chapters in this final plan report, explicit lists of references are not provided. Instead, all references to reports, maps, and personal communications are provided in the various Technical Memoranda prepared during the planning process. The reader is referred to the following technical memoranda for a more detailed description of each topic as well as the list of references:
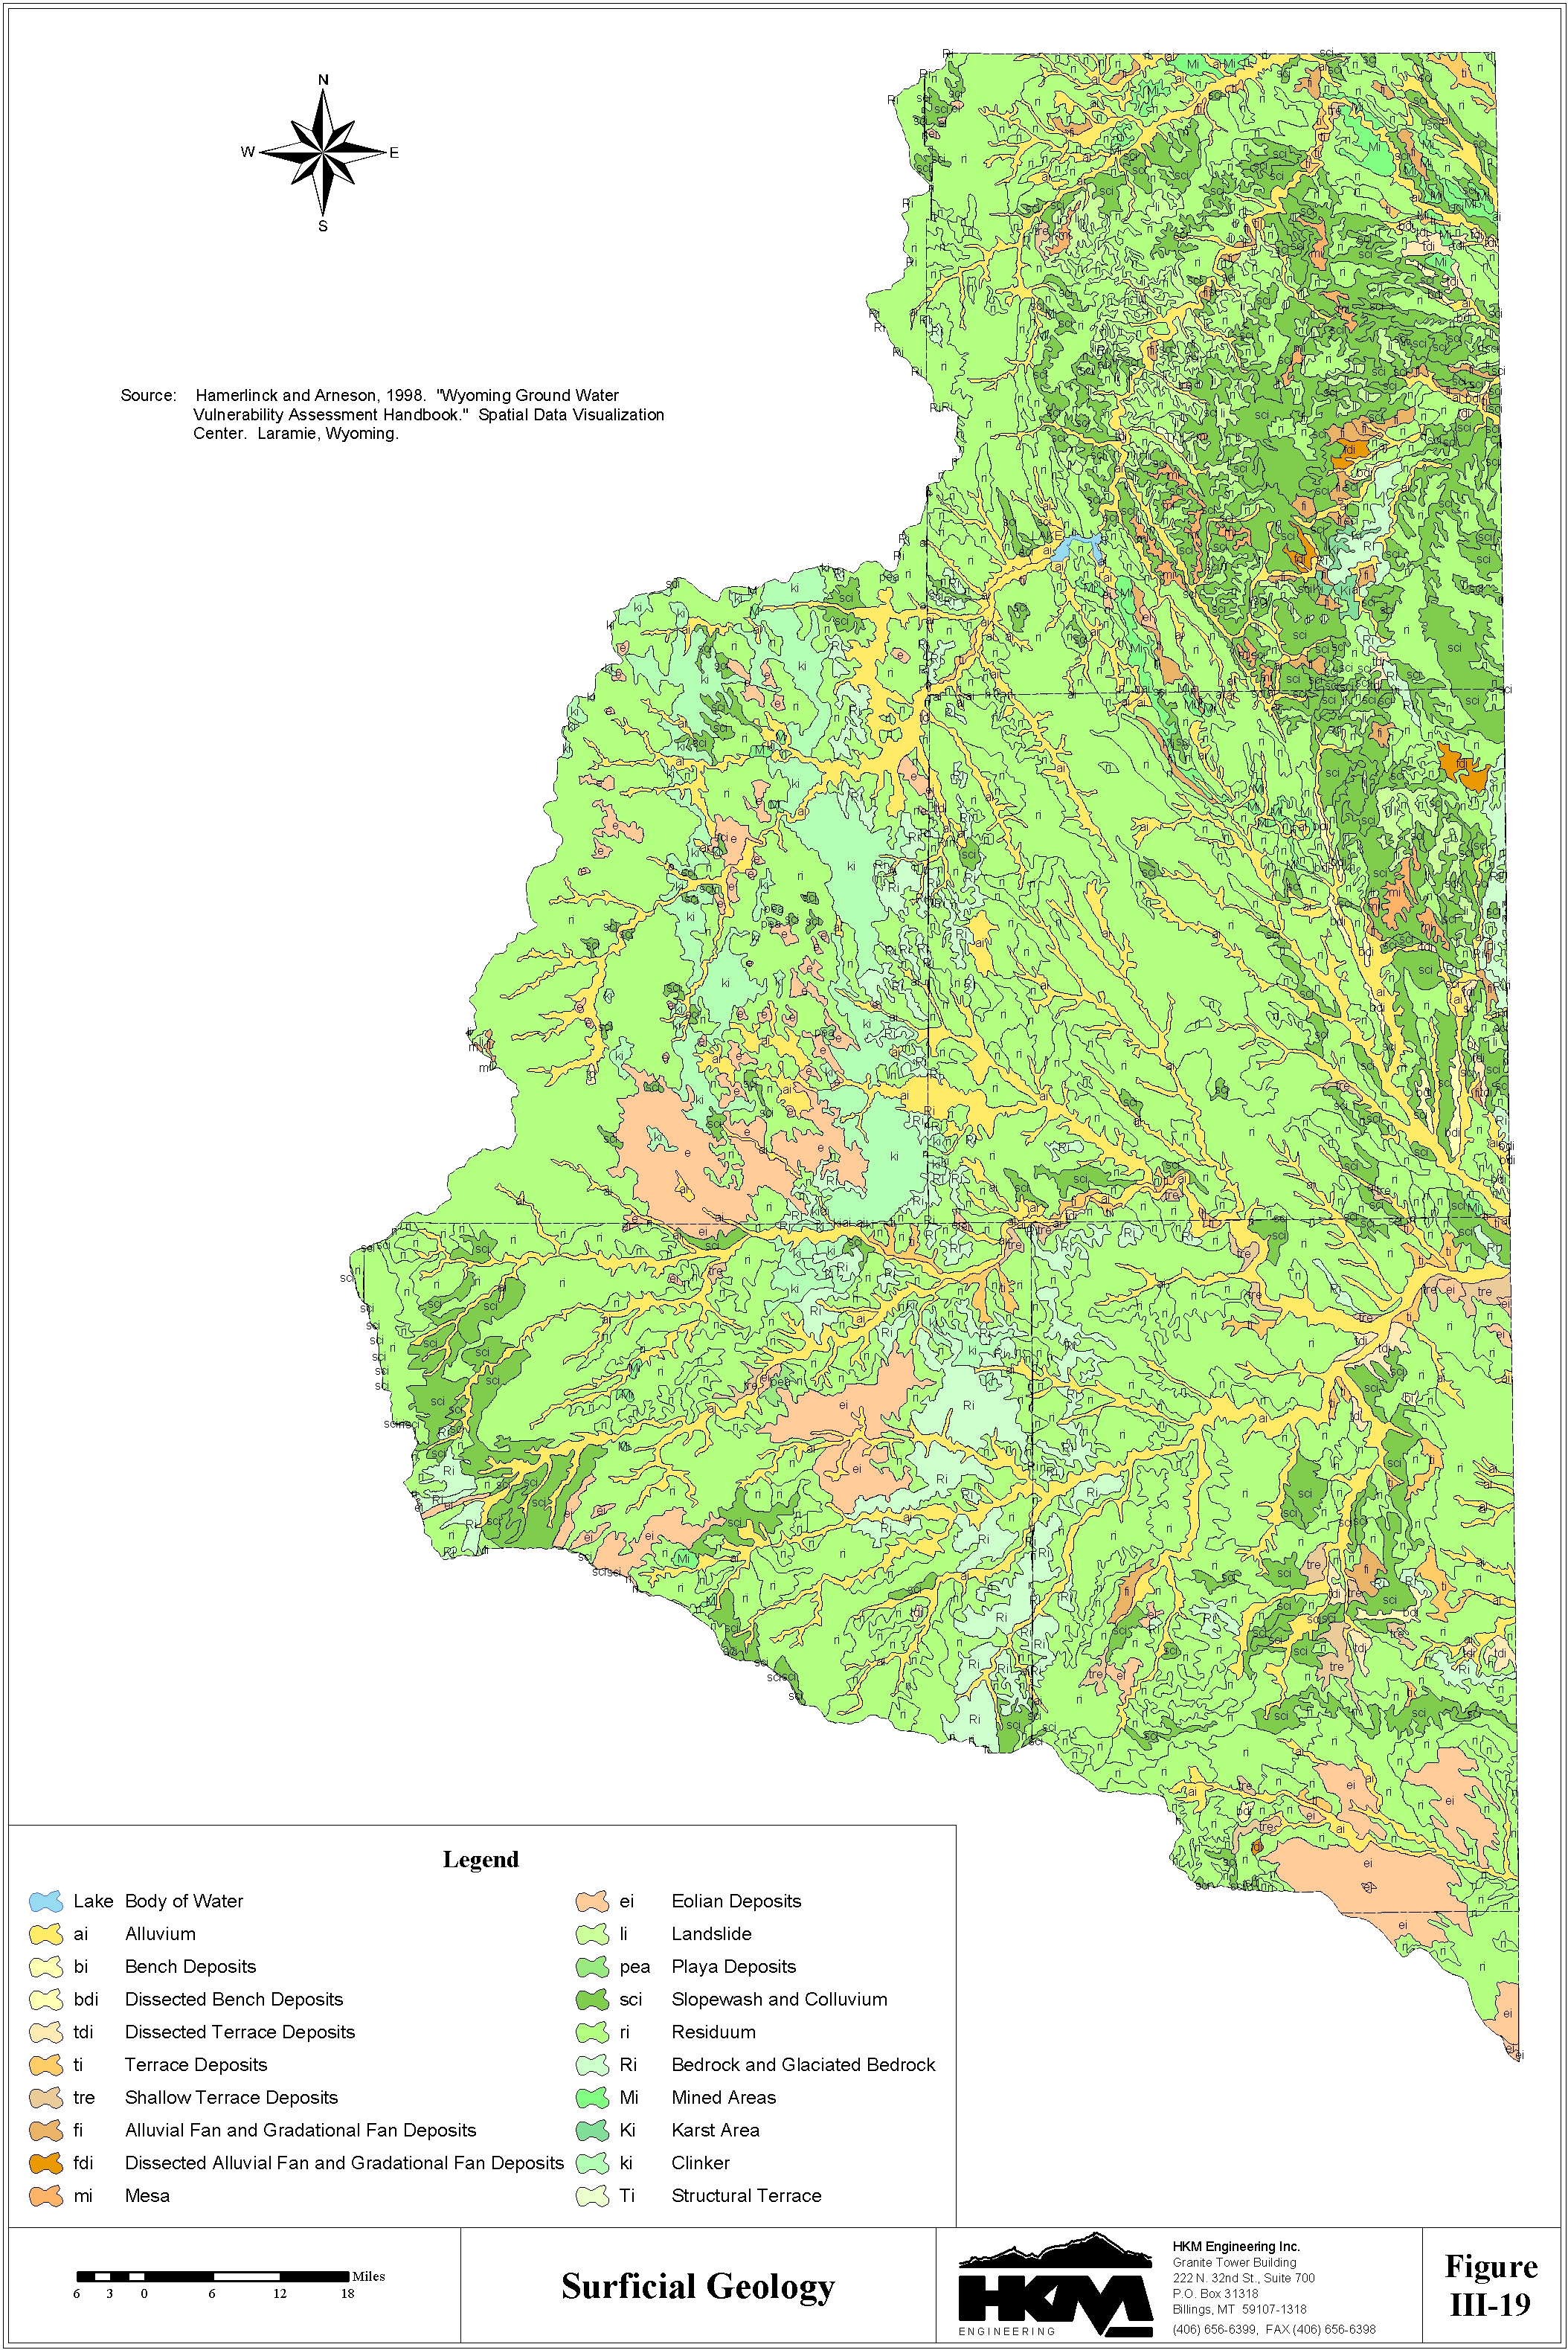
A. Surface WaterThe determination of available surface water is broken down into seven components discussed in the following sections:
Historic Streamflow Records
Available records of streamflow in the Northeast Wyoming River Basins planning area have been compiled for this study.
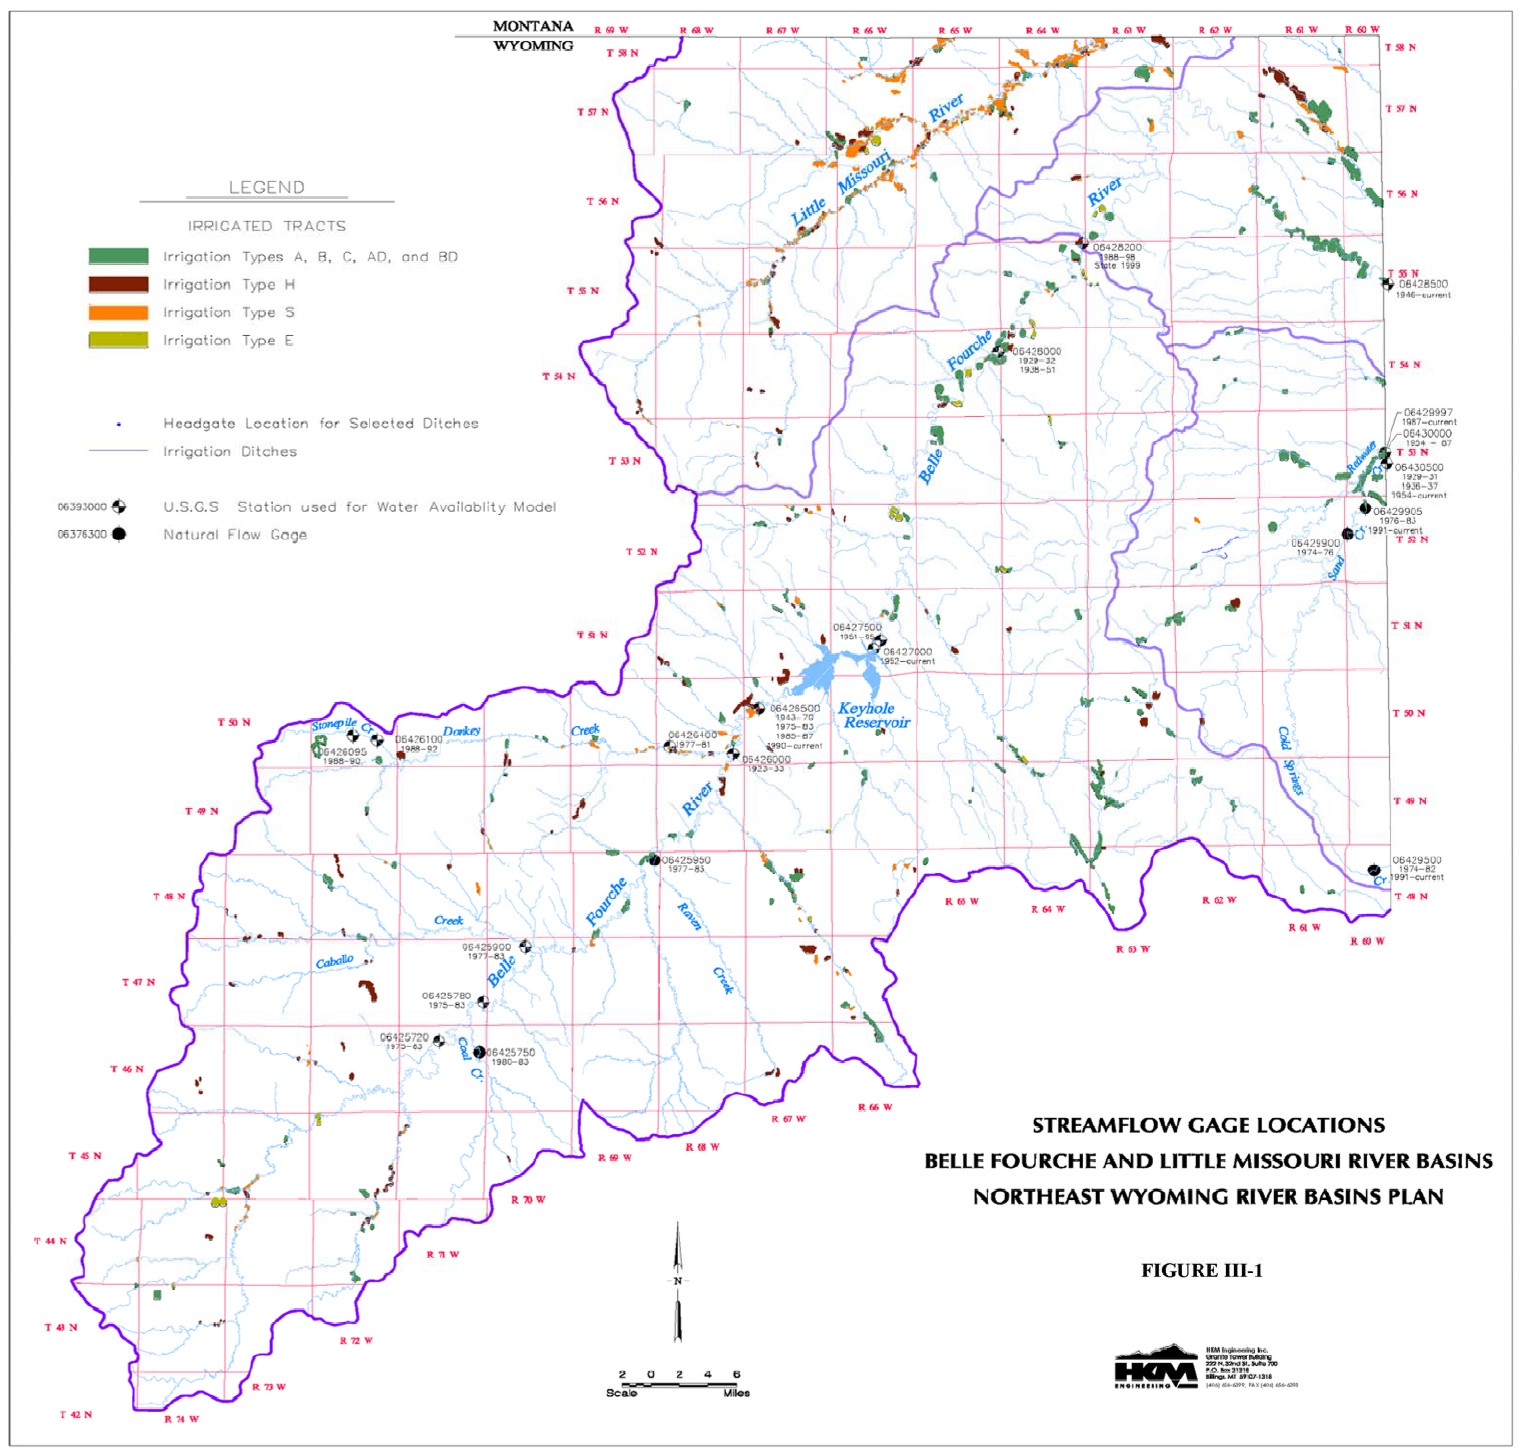
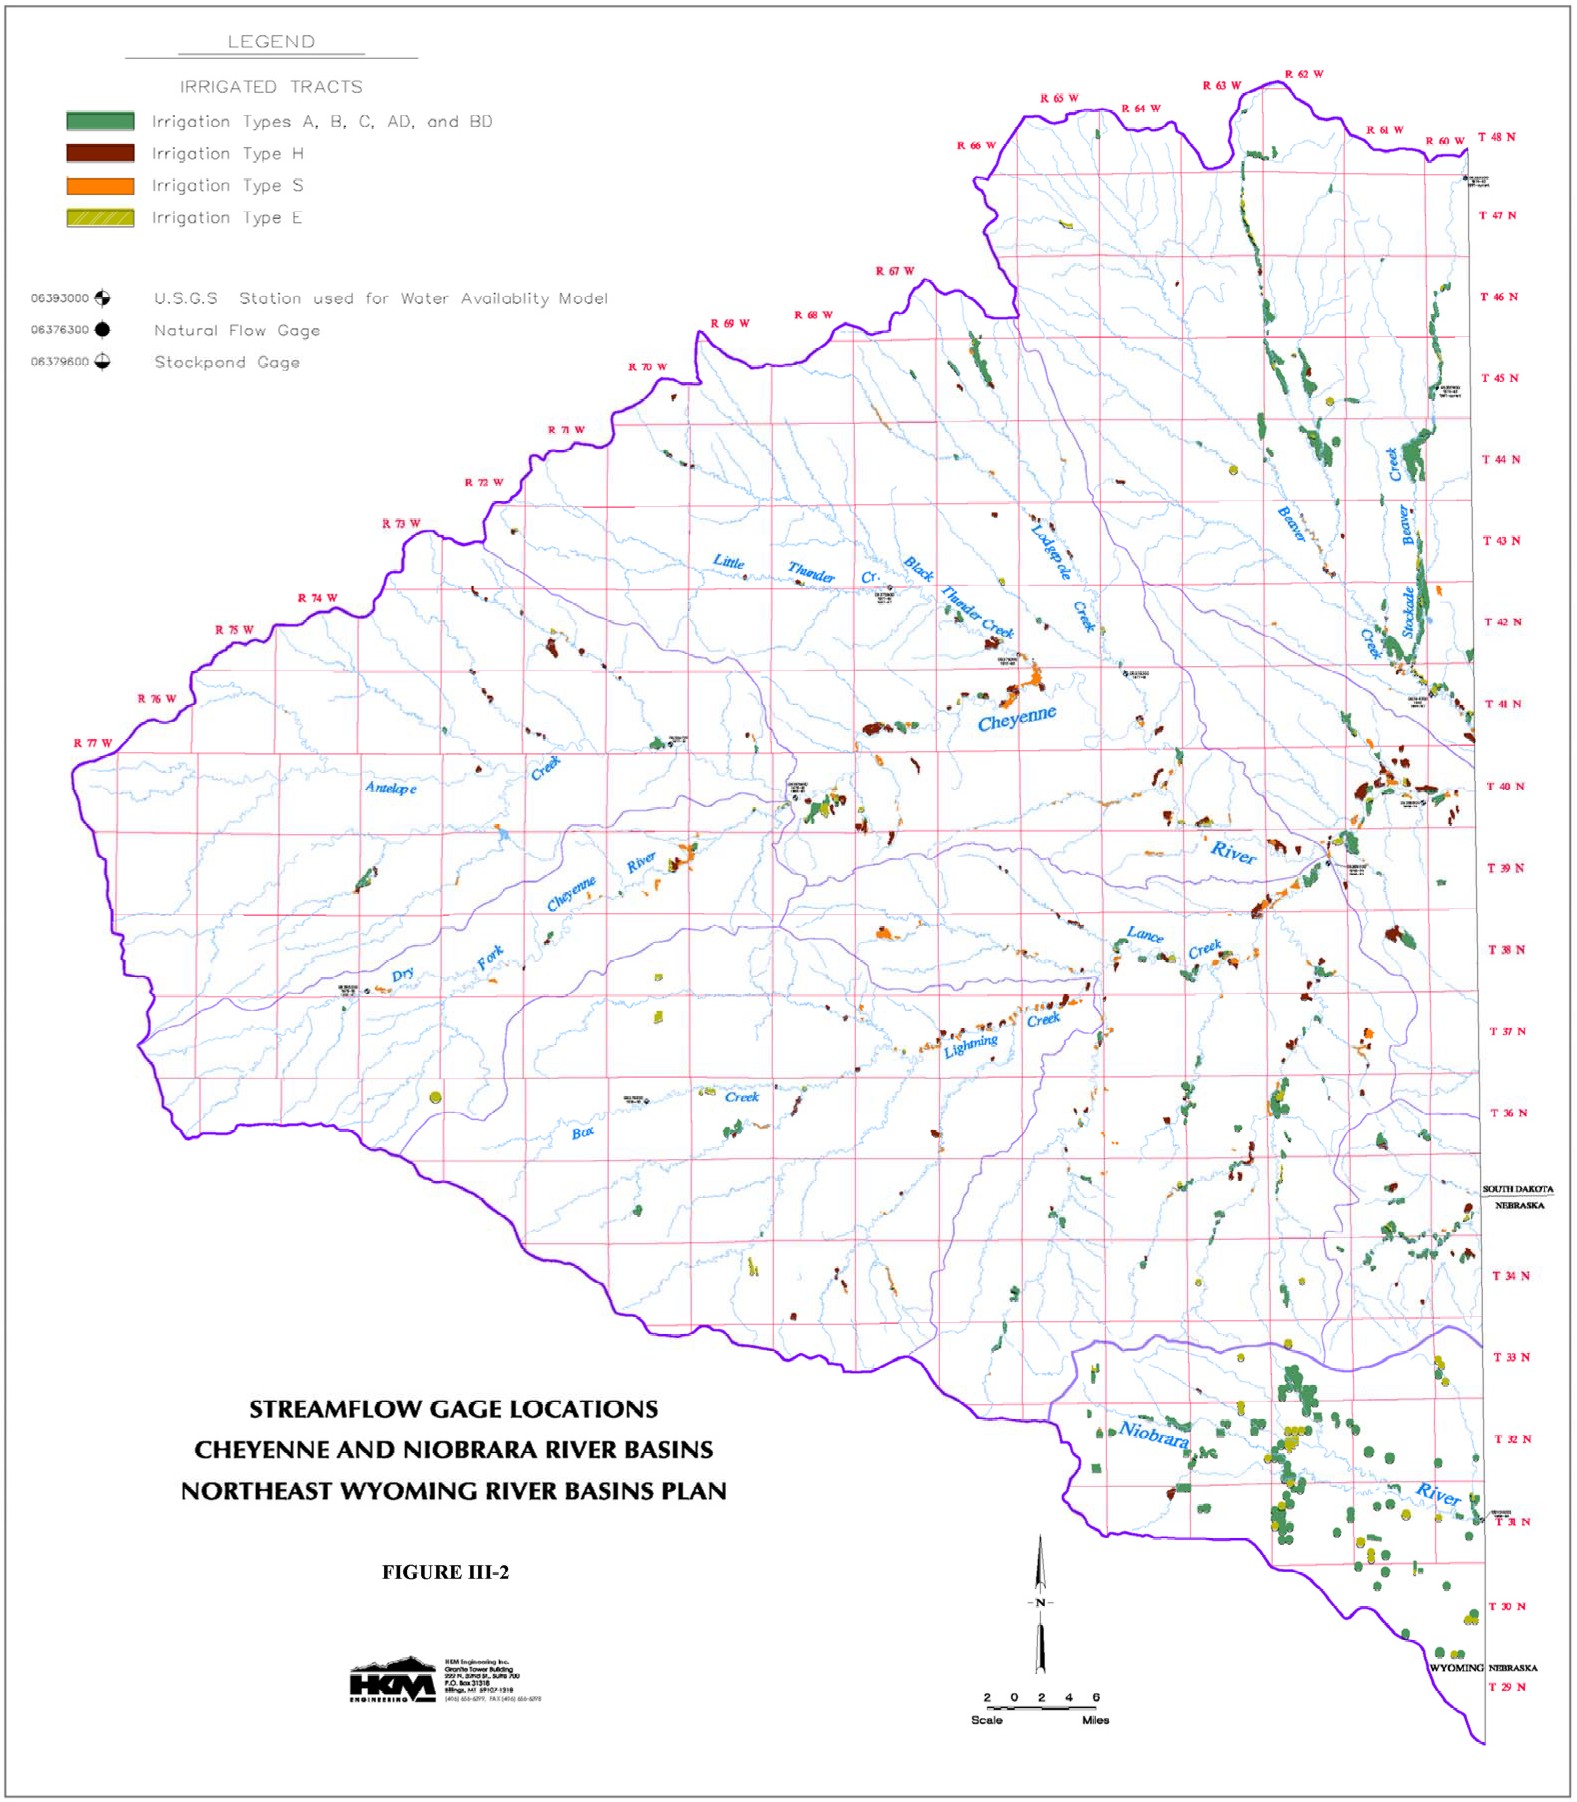
The location of the various streamflow gaging stations are plotted in relation to the significant storage reservoirs and the irrigated lands mapped for the Basin Plan (Figures III-1 through III-2). The streamflow gages that are relatively free from the influence of depletions or storage regulations are characterized as natural flow stations. Where reasonably possible, those gages that are impacted by upstream irrigation depletions were adjusted to remove these effects. The list of streamflow gages inventoried for this study is provided in Table III-1.
Prior to 1970, there were only 13 streamflow gages in operation in the planning area. Beginning in the 1970s and 1980s, with the installation of an additional 18 streamflow gages, records for a total of 31 streamflow stations became available.
Study Period
It is important in any water availability evaluation to select a study period that is long enough to include a variety of hydrologic conditions including an extended period of dry years as well as wet years and normal years. At the same time, it is also important not to select a study period so long that many streamflows must be synthesized to fill-in missing data.
It is desirable in evaluating long-term hydrologic conditions to utilize streamflow records for a station that has a long period of continuous records and that reflects natural (virgin) flow, unaffected by upstream depletions or storage regulation. Unfortunately, no such streamflow gaging station exists in, or in near vicinity to, the Northeast Wyoming River Basins. The USGS has, however, maintained streamflow stations on Beaver Creek near Newcastle (#06394000) and the Cheyenne River at Edgemont, South Dakota (#06395000) since the mid 1940s (Table III-1). The Beaver Creek gage was discontinued in 1998. The records for these gages are impacted by upstream irrigation depletions and storage, primarily in the form of stock ponds. The change in carryover storage from year to year is however expected to be relatively minor and the amount of irrigation depletion in relation to the total streamflow is not expected to vary greatly from year to year. The records for these stations although non-natural can therefore be used as a reasonable representation of annual hydrologic conditions. The USGS has also maintained a streamflow station on the Belle Fourche River below Moorcroft (#06426500) since 1944 with some gaps in the record in the 1970s and 1980s (Table III-1). Similar to stations on Beaver Creek and the Cheyenne River, the streamflow at this gage is impacted by upstream irrigation depletion and stock pond storage. The record for this station can however be used to represent hydrologic conditions in the Belle Fourche drainage. The USBR maintains records of computed inflows into Keyhole Reservoir downstream from the Moorcroft gage (#06426500). This information was utilized to develop a regression relationship between streamflows at the upstream Moorcroft gage and inflows to Keyhole Reservoir to fill-in the missing records in the 1970s and 1980s. The relationship is shown below:
        Q06426500 = 0.671* QKeyhole Inflow  . 386.2

        Where:  Q06426500 is monthly streamflow at Gage #06426500 in acre-feet and
                 QKeyhole Inflow is computed inflow to Keyhole Reservoir from USBR
                in acre-feet.
Table III-1
Streamflow Stations in the Northeast Wyoming River Basins
| Basin | Station Number |
Station Name | Natural Flow | Period of Record in Water Years ** |
Note |
| Cheyenne | 06364700 | Antelope Creek Near Teckla, WY | NO | 1978-1981 | |
| 06365300 | Dry Fork Cheyenne River Near Bill, WY | NO | 1977-1981, 1986-1987 | ||
| 0635900 | Cheyenne River Near Dull Center, WY | NO | 1976-1981, 1986-1987 | ||
| 06375600 | Little Thunder Chreek Near Hampshire, WY | NO | 1978-1981, 1988-1998 | ||
| 06376300 | Black Thunder Creek Near Hampshire, WY | NO | 1973-1990 | ||
| 06378300 | Lodgepole Creek Near Hampshire, WY | NO | 1978-1981 | ||
| 06379600 | Box Creek Near Bill, WY | YES | 1956-1958 | ||
| 06386000 | Lance Creek Near Riverview, WY | NO | 1948-1954, 1956-1983 | ||
| 06386500 | Cheyenne River Near Spencer, WY | NO | 1949-1974 | ||
| 06392900 | Beaver Creek at Mallo Camp, Near Four Corners, WY | YES | 1975-1982, 1991-current | ||
| 06392950 | Stockade Beaver Creek Near Newcastle, WY | NO | 1975-1982, 1991-current | ||
| 06394000 | Beaver Creek Near Newcastle, WY | NO | 1945-1998 | ||
| 06394500 | Beaver Creek Near Burdock, SD | NO | 1905-1907, 1929-1932 | Abt. 2 mi. into SD | |
| 06395000 | Cheyenne River at Edgemont, SD | NO | 1903-1907, 1928-1933, 1947- | Several Miles into SD; No winter records 1903-1906 | |
| Belle Fourche | 06425720 | Belle Fourche River Below Rattlesnake Creek, Near Piney, WY | NO | 1976-1983 | |
| 06425750 | Coal Creek Near Piney, WY | YES | 1981-1983 | ||
| 06425780 | Belle Fourche River Above Dry Creek Near Piney, WY | NO | 1976-1983 | ||
| 06425900 | Caballo Creek at Mouth Near Piney, WY, WY | NO | 1977-1983 | ||
| 06425950 | Raven Creek Near Moorcroft, WY | YES | 1977-1983 | ||
| 06426000 | Belle Fourche River Near Moorcroft, WY, WY | NO | 1923-1933 | ||
| 06426100 | Stonepile Creek at Gillette, WY | YES | 1988-1992 | No Winter records; Adjusted for diversions using Burlington Lake Ditch | |
| 06426400 | Donkey Creek Near Moorcroft, WY | NO | 1977-1981 | ||
| 06426500 | Belle Fourche River Below Moorcroft, WY | NO | 1943-1970, 1976-1983, 1986-1987, 1991-current | ||
| USBR Gage | Inflow to Keyhole Reservoir | NO | USBR: 1952-current | Adjusted for evaporation | |
| USBR Gage | Belle Fourche - Keyhole Reservoir Releases | NO | USBR: 1952-current | ||
| 06427500 | Belle Fourche River Below Keyhole Reservoir, WY | NO | 1951-1995 | ||
| 06428000 | Belle Fourche River at Hulette, WY | NO | 1929-1933, 1938-1952 | ||
| 06428200 | Belle Fourche River Near Alva, WY | NO | 1989-1998 | No winter records | |
| 06428500 | Belle Fourche River at Wyoming-South Dakota State Line | NO | 1947-current | ||
| 06429500 | Cold Springs Creek at Buckhorn, WY | YES | 1975-1982, 1991-current | ||
| 06429900 | Sand Creek at Ranch A Near Beulah, WY | YES | 1975-1976 | Combined with Station 06429905 | |
| 06429905 | Sand Creek Near Ranch A Near Beulah, WY | YES | 1976-1983, 1991-current | ||
| 06430500 | Redwater Creek at Wyoming-South Dakota State Line, WY | NO | 1929-1931, 1936-1937, 1954- | Adjusted for diversion using Murrey Ditch | |
| Niobrara | 06454000 | Niobrara River at Wyoming-Nebraska State Line, WY | NO | 1956-1994 |
**Unless otherwise noted, records were obtained from the USGS
The coefficient of determination (R2) for this relationship is 0.87. The coefficient of determination is defined as the proportion of variation in the independent variable that can be explained by variation in the dependent variable. The higher the value of R2, the stronger the relationship between the two variables. A perfect relationship would have an R2 equal to 1.0. Regression of hydrologic data resulting in R2 greater than 0.7 is typically considered strong enough for data estimating.
The recorded and estimated streamflow records from the gages on Beaver Creek (#06394000), the Cheyenne River (#06395000), and the Belle Fourche River (#06426500) are selected as representative of the hydrologic conditions throughout the Northeast Wyoming River basins.
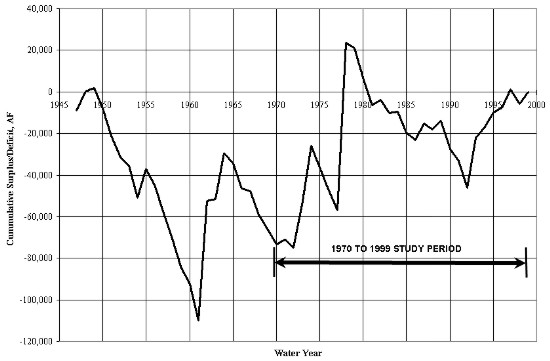
Figures III-3, III-4, and III-5 are Cumulative Surplus/Deficit plots for Beaver Creek, the Cheyenne River, and the Belle Fourche River respectively for the longest concurrent period of record (1947 to 1997 or 1999). A Cumulative Surplus/Deficit plot represents a running total of the annual deviations from the long-term mean annual streamflow. Downward sloping lines (left to right) represent periods of time during which annual streamflow is less than the long-term mean (dry periods). Conversely, upward sloping lines represent years, which are wetter than average (wet periods). As can be seen from these plots, the hydrologic conditions can vary considerably throughout the Northeast Wyoming River Basins in any given period of years. By way of example, the period 1964 to 1970 is generally a wet period on Beaver Creek. Whereas, on the Cheyenne River, this same period is generally average, and on the Belle Fourche River, 1964 to 1970 is generally a dry period. Some similarities do however exist throughout the study area. The periods 1959 to 1961, 1979 to 1985, and 1988 to 1990 are generally dry periods at all locations. The years 1962 and 1978 are also extreme wet years at all locations.
Based on an evaluation of the long-term hydrologic conditions at the three representative streamflow stations, together with the an understanding of the availability of historic streamflow records, the 30-year period 1970 through 1999 was selected as the study period for this Basin Plan. The average annual flow for the period 1970 to 1999 ranges from 9% drier than the long-term period on the Cheyenne River to 12% wetter than the long-term period on the Belle Fourche River. This period also contains extended periods of dry years at all locations including some of the driest years of record as well as periods of normal and wet hydrologic conditions.
A more detailed discussion and supporting documentation for the selection of the study period are provided in the "Surface Water Hydrology" technical memorandum.
Figure III-3
Cumulative Surplus/Deficit of Annual Historic Flows
Beaver Creek Near Newcastle, WY (Station 06394000)
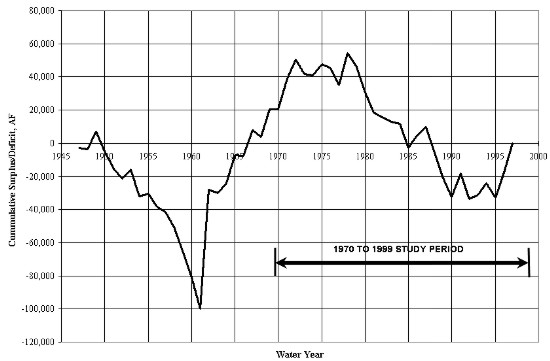
Figure III-4
Cumulative Surplus/Deficit of Annual Historic Flows
Cheyenne River at Edgemont, SD (Station 06395000)
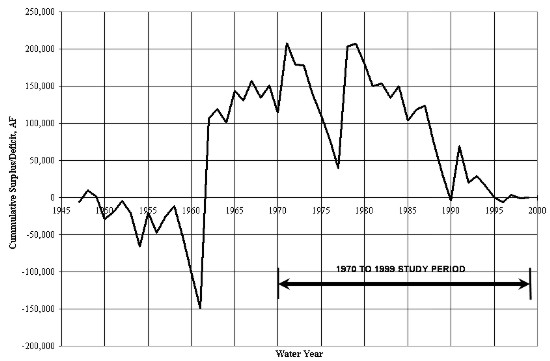
Figure III-5
Cumulative Surplus/Deficit of Annual Historic Flows
Belle Fourche River Below Moorcroft, WY (Station 06426500)
Data Extension
The spreadsheet modeling approach used for the Basin Plan utilizes model nodes located at historic streamflow gaging stations in order to take advantage of the historic records of streamflow at these locations. These records however contain many data gaps during the 1970 to 1999 study period. Monthly streamflows must therefore be estimated for those months, during the study period, with no recorded streamflow data.
The monthly record extension approach used in this study follows the procedure used by the USGS in recent studies. This mixed-station procedure uses the best base station from among all available base stations to fill in each month of missing data for a given gage. The base station producing the smallest standard error of prediction is used for each particular month. The technique used to estimate missing values was developed by Hirsch and is referred to as MOVE.1 (Maintenance of Variance Extension, Type 1). This technique offers the advantage over ordinary least-squares regression of preserving the variance of the unextended records. This procedure was carried out using a computer program developed by the USGS.
The USGS streamflow stations are divided into hydrologically similar groups with each group having at least one gage with sufficient data to develop relationships based on concurrent streamflow for the entire study period. The groupings also represent stations affected by similar reservoir operations. In particular, those stations below Keyhole Reservoir are grouped together because they all experience the same impacts from Keyhole operations. The monthly flow extension procedure is performed for each of these groupings of monthly streamflow data. There is a certain amount of overlap in hydrologic similarity among the various groupings. Some streamflow stations are therefore included in multiple groups.
As mentioned previously, regression of hydrologic data resulting in a coefficient of determination (R2 greater than 0.7) is typically considered strong enough for data estimating. In some instances no significant correlation (R2 less than 0.7) could be found using concurrent monthly streamflows between any base station and the short record station. Annual flow regression rather than monthly flow regression was performed in these instances to fill-in the missing streamflow data. In some cases, no significant correlation (R2 less than 0.7) could be found using the annual flow regression either. Three of these stations were dropped from the study. Four other stations on Beaver Creek and the Niobrara River were retained and the study periods for modeling were adjusted to utilize historic records only. The monthly streamflows for the years of missing data were estimated by applying the average monthly distribution for the period of recorded streamflow to the estimated total annual flow.
The average monthly and annual streamflows during the study period are summarized in Table III-2 for the gaging stations selected for use in the water availability models. Supporting data and computation results for the data extension process is provided in the "Surface Water Hydrology" technical memorandum.
Table III-2
Summary of Average Monthly and Annual Flows (1970 to 1999 unless otherwise noted)
at Gaged Model Nodes
| Basin | Station Number |
Station Name | Natural Flow |
Average Streamflow for 1970-1999 in Acre-Feet | Note | ||||||||||||
| Oct | Nov | Dec | Jan | Feb | Mar | Apr | May | Jun | Jul | Aug | Sep | Annual | |||||
| Cheyenne | 06364700 | Antelope Creek Near Teckla, WY | NO | 97 | 64 | 18 | 22 | 159 | 545 | 291 | 1,520 | 1,005 | 361 | 148 | 93 | 4,323 | |
| 06365300 | Dry Fork Cheyenne River Near Bill, WY | NO | 3 | 6 | 5 | 3 | 17 | 44 | 20 | 194 | 37 | 30 | 8 | 1 | 366 | ||
| 0635900 | Cheyenne River Near Dull Center, WY | NO | 176 | 101 | 26 | 36 | 407 | 798 | 633 | 3,475 | 2,247 | 854 | 425 | 66 | 9,244 | ||
| 06375600 | Little Thunder Chreek Near Hampshire, WY | NO | 3 | 4 | 5 | 5 | 48 | 86 | 11 | 824 | 131 | 135 | 100 | 2 | 1,354 | ||
| 06376300 | Black Thunder Creek Near Hampshire, WY | NO | 307 | 16 | 0 | 51 | 272 | 846 | 308 | 1,788 | 671 | 549 | 405 | 498 | 5,710 | ||
| 06378300 | Lodgepole Creek Near Hampshire, WY | NO | 1 | 2 | 1 | 1 | 2 | 45 | 33 | 223 | 91 | 32 | 34 | 1 | 464 | ||
| 06386000 | Lance Creek Near Riverview, WY | NO | 133 | 111 | 83 | 333 | 870 | 1,205 | 902 | 5,594 | 2,717 | 2,993 | 2,078 | 694 | 17,713 | ||
| 06386500 | Cheyenne River Near Spencer, WY | NO | 275 | 233 | 71 | 1,023 | 1,487 | 866 | 2,040 | 20,050 | 9,286 | 2,103 | 535 | 3,453 | 41,423 | ||
| 06392900 | Beaver Creek at Mallo Camp, Near Four Corners, WY | YES | 112 | 102 | 100 | 97 | 98 | 127 | 138 | 136 | 144 | 131 | 120 | 112 | 1,415 | Study Period: 1975-1982, 1992-1997 | |
| 06392950 | Stockade Beaver Creek Near Newcastle, WY | NO | 786 | 763 | 785 | 769 | 721 | 877 | 785 | 654 | 675 | 699 | 730 | 751 | 8,996 | Study Period: 1975-1982, 1992-1997 | |
| 06394000 | Beaver Creek Near Newcastle, WY | NO | 876 | 804 | 796 | 881 | 2,381 | 5,716 | 2,353 | 3,250 | 2,339 | 1,106 | 797 | 497 | 21,796 | Study Period: 1975-1982, 1992-1997 | |
| 06395000 | Cheyenne River at Edgemont, SD | NO | 1,910 | 1,416 | 684 | 800 | 3,106 | 8,847 | 4,275 | 14,156 | 10,524 | 4,720 | 3,269 | 1,700 | 55,407 | ||
| Belle Fourche | 06425720 | Belle Fourche River Below Rattlesnake Creek, Near Piney, WY | NO | 6 | 6 | 12 | 24 | 79 | 212 | 66 | 685 | 236 | 101 | 149 | 20 | 1,596 | |
| 06425780 | Belle Fourche River Above Dry Creek Near Piney, WY | NO | 21 | 6 | 14 | 45 | 190 | 611 | 131 | 1,097 | 282 | 239 | 179 | 70 | 2,887 | ||
| 06425900 | Caballo Creek at Mouth Near Piney, WY, WY | NO | 13 | 10 | 1 | 10 | 27 | 221 | 30 | 788 | 76 | 99 | 45 | 18 | 1,339 | ||
| 06425950 | Raven Creek Near Moorcroft, WY | YES | 6 | 0 | 0 | 2 | 54 | 169 | 3 | 78 | 2 | 7 | 13 | 0 | 333 | ||
| 06426400 | Donkey Creek Near Moorcroft, WY | NO | 34 | 18 | 33 | 20 | 37 | 1,707 | 145 | 2,309 | 104 | 17 | 5 | 4 | 4,434 | ||
| 06426500 | Belle Fourche River Below Moorcroft, WY | NO | 682 | 203 | 149 | 420 | 1,761 | 4,664 | 2,268 | 5,169 | 2,134 | 997 | 515 | 281 | 19,243 | ||
| USBR Gage | Belle Fourche River - Total Keyhole Reservoir Discharge | NO | 114 | 320 | 0 | 1 | 0 | 881 | 784 | 2,149 | 2,402 | 4,821 | 4,526 | 761 | 16,759 | ||
| 06427500 | Belle Fourche River Below Keyhole Reservoir, WY | NO | 257 | 260 | 103 | 104 | 96 | 1,015 | 760 | 2,194 | 2,362 | 4,833 | 4,600 | 833 | 17,417 | ||
| 06428200 | Belle Fourche River Near Alva, WY | NO | 1,826 | 1,648 | 1,063 | 1,375 | 2,419 | 7,705 | 7,511 | 10,171 | 7,526 | 4,925 | 4,981 | 1,998 | 53,148 | ||
| 06428500 | Belle Fourche River at Wyoming-South Dakota State Line | NO | 2,307 | 2,082 | 1,272 | 1,741 | 3,233 | 10,987 | 10,552 | 15,575 | 12,134 | 6,507 | 5,402 | 2,336 | 74,127 | ||
| 06429905 | Sand Creek Near Ranch A Near Beulah, WY | YES | 1,312 | 1,307 | 1,285 | 1,237 | 1,092 | 1,231 | 1,288 | 1,881 | 1,776 | 1,499 | 1,480 | 1,334 | 16,722 | ||
| 06430500 | Redwater Creek at Wyoming-South Dakota State Line, WY | NO | 2,108 | 2,077 | 2,043 | 2,006 | 1,928 | 2,240 | 2,367 | 3,697 | 3,135 | 2,190 | 2,245 | 2,119 | 28,155 | ||
| Niobrara | 06454000 | Niobrara River at Wyoming-Nebraska State Line, WY | NO | 150 | 151 | 159 | 179 | 207 | 316 | 297 | 249 | 208 | 143 | 151 | 118 | 2,328 | Study Period: 1970-1994 |
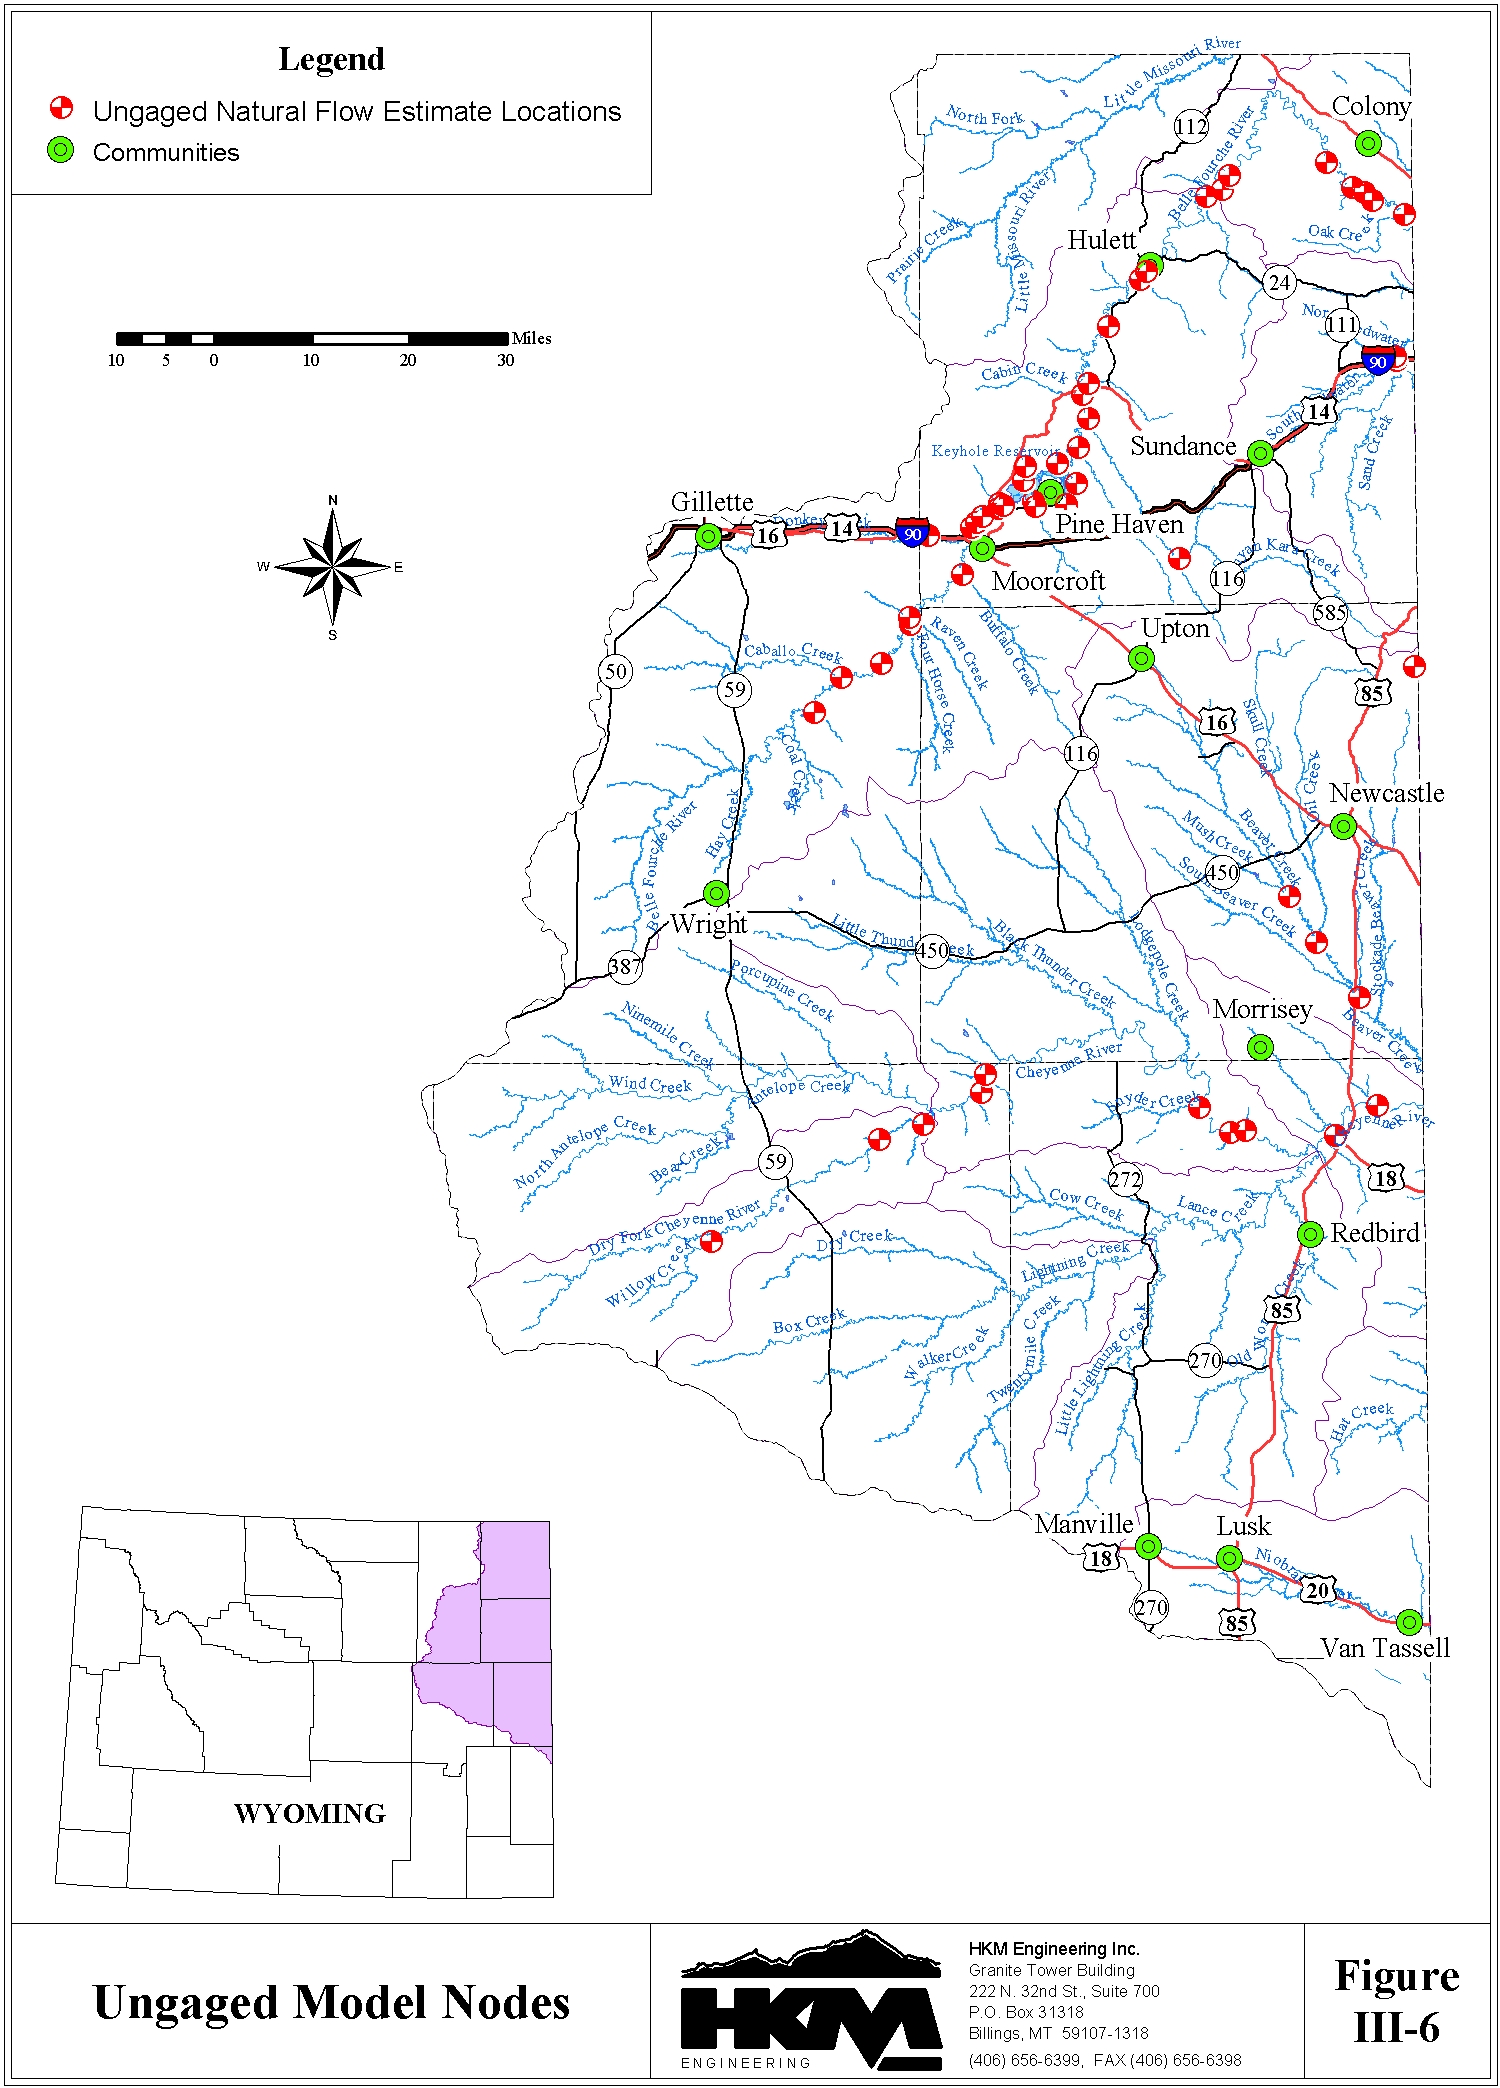
Natural Flow at Ungaged Model Nodes
The water availability models for this Plan have been developed identifying appropriate locations of model nodes in relation to the various surface water diversion points, return flow locations, and storage reservoirs. Model nodes are located, in large part, at historic streamflow gaging stations in order to take advantage of the historic records of streamflow at these locations. Additionally, it is necessary to locate model nodes at locations with no record of streamflow, to appropriately simulate water use in the various drainages. The locations of the ungaged model nodes are shown on Figure III-6.
The following two methods were used to estimate natural flow at these locations:
Natural flow for the majority of the ungaged model nodes was estimated using the second method, which relies on measured natural flow at selected streamflow gages in the Northeast Wyoming River Basins. The natural flow gage in nearest proximity and with the most similar hydrologic conditions was used to estimate natural flow at the ungaged locations. The original selections were further evaluated and, in some cases modified, as part of the calibration of the water availability models. In addition to average annual natural flow at the ungaged model nodes, it is necessary to generate sequential monthly flows at these sites for all years of the study period. This was accomplished by selecting a natural flow gaging station having similar hydrologic characteristics and multiplying the sequential monthly flows at the gaged location by the ratio of the ungaged average annual natural flow to the gaged average annual natural flow. The time distribution of monthly flows at the ungaged sites is, therefore, represented by the streamflow at similar gaged sites. The average monthly and annual streamflows for the study period, for the ungaged model nodes are summarized in Table III-3.
A more detailed discussion of the derivation of the streamflows at the ungaged model nodes is provided in the "Surface Water Hydrology" memorandum.
Table III-3
Summary of Average Monthly and Annual Flows
at Ungaged Natural Flow Nodes
| Basin | Station Name | Estimated Average Streamflow for 1970-1999 in Acre-Feet | ||||||||||||
| Oct | Nov | Dec | Jan | Feb | Mar | Apr | May | Jun | Jul | Aug | Sep | Annual | ||
| Cheyenne | Willow Creek at Mouth in Section 28, T38N, R72W | 9 | 0 | 0 | 3 | 76 | 238 | 4 | 109 | 3 | 10 | 18 | 0 | 470 |
| Woody Creek at Mouth in Section 5, T39N, R69W | 1 | 0 | 0 | 0 | 10 | 31 | 0 | 14 | 0 | 1 | 2 | 0 | 59 | |
| Lake Creek at Mouth in Section 30, T40N, R68W | 3 | 0 | 0 | 1 | 23 | 72 | 1 | 33 | 1 | 3 | 5 | 0 | 142 | |
| Sheep Creek at Mouth in Section 7, T40N, R67W | 1 | 0 | 0 | 0 | 7 | 23 | 0 | 11 | 0 | 1 | 2 | 0 | 45 | |
| Wagonhound Creek at Mouth in Section 31, T41N, R67W | 2 | 0 | 0 | 1 | 15 | 48 | 1 | 22 | 1 | 2 | 4 | 0 | 96 | |
| Snyder Creek at Mouth in Section 23, T40N, R64W | 8 | 0 | 0 | 3 | 71 | 223 | 3 | 103 | 3 | 10 | 17 | 0 | 441 | |
| Boggy Creek at Mouth in Section 32, T40N, R63W | 2 | 0 | 0 | 1 | 20 | 61 | 1 | 28 | 1 | 3 | 5 | 0 | 122 | |
| Sevenmile Creek at Mouth in Section 34, T40N, R63W | 1 | 0 | 0 | 0 | 10 | 30 | 0 | 14 | 0 | 1 | 2 | 0 | 58 | |
| Mule Creek at Mouth in Section 6, T39N, R61W | 4 | 0 | 0 | 1 | 31 | 96 | 1 | 44 | 1 | 4 | 7 | 0 | 189 | |
| Robbers' Roost Creek at Mouth in Section 23, T40N, R61W | 5 | 0 | 0 | 2 | 43 | 136 | 2 | 63 | 2 | 6 | 10 | 0 | 269 | |
| Beaver Creek Just Below Mush Creek in Section 32, T44N, R62W | 33 | 0 | 0 | 10 | 292 | 1,187 | 15 | 546 | 16 | 51 | 77 | 0 | 2,2271 | |
| Oil Creek at Mouth in Section 26, T43N, R62W | 346 | 0 | 0 | 61 | 3,958 | 6,405 | 377 | 2,930 | 87 | 275 | 2,425 | 0 | 16,864 | |
| Blacktail Creek at Mouth in Section 2, T41N, R61W | 200 | 195 | 193 | 186 | 163 | 188 | 191 | 293 | 262 | 240 | 215 | 198 | 2,524 | |
| Dry Beaver Creek at Mouth in Section 4, T47N, R60W | 107 | 99 | 97 | 92 | 95 | 111 | 133 | 136 | 141 | 130 | 118 | 107 | 1,366 | |
| Belle Fourche | Dry Creek at Mouth in Section 29, T47N, R70W | 2 | 0 | 0 | 1 | 14 | 43 | 1 | 20 | 1 | 2 | 3 | 0 | 87 |
| Yellow Hammer Creek at Mouth in Section 10, T47N, R70W | 1 | 0 | 0 | 0 | 5 | 16 | 0 | 7 | 0 | 1 | 1 | 0 | 31 | |
| Whitetail Creek at Mouth in Section 32, T48N, R69W | 1 | 0 | 0 | 0 | 8 | 24 | 0 | 11 | 0 | 1 | 2 | 0 | 47 | |
| Four Horse Creek at Mouth in Section 11, T48N, R69W | 8 | 0 | 0 | 3 | 73 | 228 | 4 | 105 | 3 | 10 | 17 | 0 | 451 | |
| Timber Creek at Mouth in Section 2, T48N, R69W | 2 | 0 | 0 | 1 | 19 | 60 | 1 | 27 | 1 | 3 | 5 | 0 | 119 | |
| Buffalo Creek at Mouth in Section 14, T49N, R68W | 11 | 0 | 0 | 3 | 93 | 290 | 4 | 133 | 4 | 12 | 22 | 0 | 572 | |
| Donkey Creek Just Upsteam of Gage in Sec. 30, T50N, R68W | 0 | 0 | 0 | 413 | 1,135 | 3,278 | 1,555 | 4,005 | 946 | 0 | 0 | 0 | 11,3321 | |
| Trail Creek at Mouth in Section 24, T50N, R68W | 1 | 0 | 0 | 0 | 10 | 32 | 0 | 15 | 0 | 1 | 2 | 0 | 61 | |
| Dry Creek at Mouth in Section 24, T50N, R68W | 2 | 0 | 0 | 1 | 14 | 45 | 1 | 21 | 1 | 2 | 3 | 0 | 90 | |
| Robinson Creek at Mouth in Section 18, T50N, R67W | 1 | 0 | 0 | 0 | 4 | 14 | 0 | 6 | 0 | 1 | 1 | 0 | 27 | |
| Duck Creek at Mouth in Section 8, T50N, R67W | 5 | 0 | 0 | 4 | 59 | 115 | 4 | 53 | 2 | 5 | 24 | 0 | 271 | |
| Miller Creek at Mouth in Section 9, T50N, R67W | 58 | 0 | 0 | 41 | 672 | 1,314 | 44 | 604 | 18 | 57 | 271 | 0 | 3,079 | |
| Smoke Creek at Mouth in Section 9, T50N, R67W | 1 | 0 | 0 | 1 | 17 | 34 | 1 | 16 | 0 | 1 | 7 | 0 | 78 | |
| Berger Creek at Mouth in Section 12, T50N, R67W | 2 | 0 | 0 | 2 | 28 | 56 | 2 | 26 | 1 | 2 | 11 | 0 | 130 | |
| Lone Tree Creek at Mouth in Section 26, T51N, R67W | 5 | 0 | 0 | 4 | 62 | 121 | 4 | 55 | 2 | 5 | 25 | 0 | 283 | |
| Wind Creek at Mouth in Section 13, T50N, R67W | 133 | 0 | 0 | 93 | 1,539 | 3,008 | 101 | 1,382 | 41 | 129 | 620 | 0 | 7,046 | |
| Deer Creek at Mouth in Section 23, T51N, R67W | 28 | 0 | 0 | 20 | 325 | 635 | 21 | 292 | 9 | 27 | 131 | 0 | 1,488 | |
| Eggie Creek at Mouth in Section 21, T51N, R66W | 4 | 0 | 0 | 3 | 45 | 88 | 3 | 40 | 1 | 4 | 18 | 0 | 206 | |
| Mule Creek at Mouth in Section 15, T50N, R66W | 17 | 0 | 0 | 12 | 197 | 385 | 13 | 177 | 5 | 17 | 79 | 0 | 902 | |
| Cottonwood Creek at Mouth in Section 35, T51N, R66W | 5 | 0 | 0 | 3 | 52 | 102 | 3 | 47 | 1 | 4 | 21 | 0 | 238 | |
| Arch Creek at Mouth in Section 11, T51N, R66W | 7 | 0 | 0 | 2 | 62 | 195 | 3 | 90 | 3 | 8 | 15 | 0 | 385 | |
| Inyan Kara Creek at Mouth in Section 25, T52N, R66W | 1,154 | 1,142 | 1,122 | 1,083 | 1,028 | 1,311 | 1,128 | 1,750 | 1,553 | 1,319 | 1,310 | 1,165 | 15,065 | |
| Cabin Creek at Mouth in Section 14, T52N, R66W | 5 | 0 | 0 | 2 | 47 | 148 | 2 | 68 | 2 | 6 | 11 | 0 | 291 | |
| Miller Creek at Mouth in Section 12, T52N, R66W | 5 | 0 | 0 | 1 | 39 | 122 | 2 | 56 | 2 | 5 | 9 | 0 | 241 | |
| Lytle Creek at Mouth in Section 8, T53N, R65W | 3 | 0 | 0 | 1 | 27 | 84 | 1 | 39 | 1 | 4 | 6 | 0 | 166 | |
| Whitetail Creek at Mouth in Section 14, T54N, R65W | 83 | 82 | 81 | 78 | 69 | 77 | 81 | 118 | 112 | 94 | 93 | 84 | 1,052 | |
| Blacktail Creek at Mouth in Section 12, T54N, R65W | 210 | 209 | 205 | 198 | 175 | 197 | 206 | 301 | 284 | 240 | 237 | 213 | 2,675 | |
| Beaver Creek at Mouth in Section 1, T55N, R64W | 459 | 457 | 449 | 433 | 382 | 431 | 451 | 658 | 621 | 524 | 518 | 467 | 5,850 | |
| East Creek at Mouth in Section 32, T55N, R63W | 48 | 48 | 47 | 45 | 40 | 45 | 47 | 68 | 65 | 55 | 54 | 49 | 611 | |
| Arnold Creek at Mouth in Section 28, T55N, R63W | 22 | 22 | 22 | 21 | 18 | 21 | 22 | 32 | 30 | 25 | 25 | 23 | 283 | |
| Horse Creek at Mouth in Section 19, T56N, R61W | 76 | 75 | 74 | 71 | 63 | 71 | 74 | 108 | 102 | 86 | 85 | 77 | 962 | |
| Pine Creek at Mouth in Section 33, T56N, R61W | 172 | 171 | 168 | 162 | 143 | 161 | 169 | 247 | 233 | 197 | 194 | 175 | 2,192 | |
| Kilpatrick Creek at Mouth in Section 3, T55N, R61W | 69 | 69 | 68 | 65 | 58 | 65 | 68 | 99 | 94 | 79 | 78 | 70 | 882 | |
| Kruger Creek at Mouth in Section 11, T55N, R61W | 34 | 34 | 33 | 32 | 28 | 32 | 33 | 48 | 46 | 39 | 38 | 34 | 431 | |
| Oak Creek at Mouth in Section 20, T55N, R60W | 216 | 215 | 211 | 203 | 179 | 202 | 212 | 309 | 292 | 247 | 243 | 219 | 2,748 | |
| South Redwater Creek Just Above Sand Creek in Section 31, T53N, R60W | 565 | 563 | 553 | 533 | 470 | 530 | 555 | 810 | 765 | 646 | 637 | 575 | 7,202 | |
| Redwater Creek Just Above South Redwater Creek in Section 31, T53N, R60W | 287 | 286 | 281 | 271 | 239 | 269 | 282 | 411 | 388 | 328 | 324 | 292 | 3,658 | |
Streamflows During Wet, Dry, and Normal Years
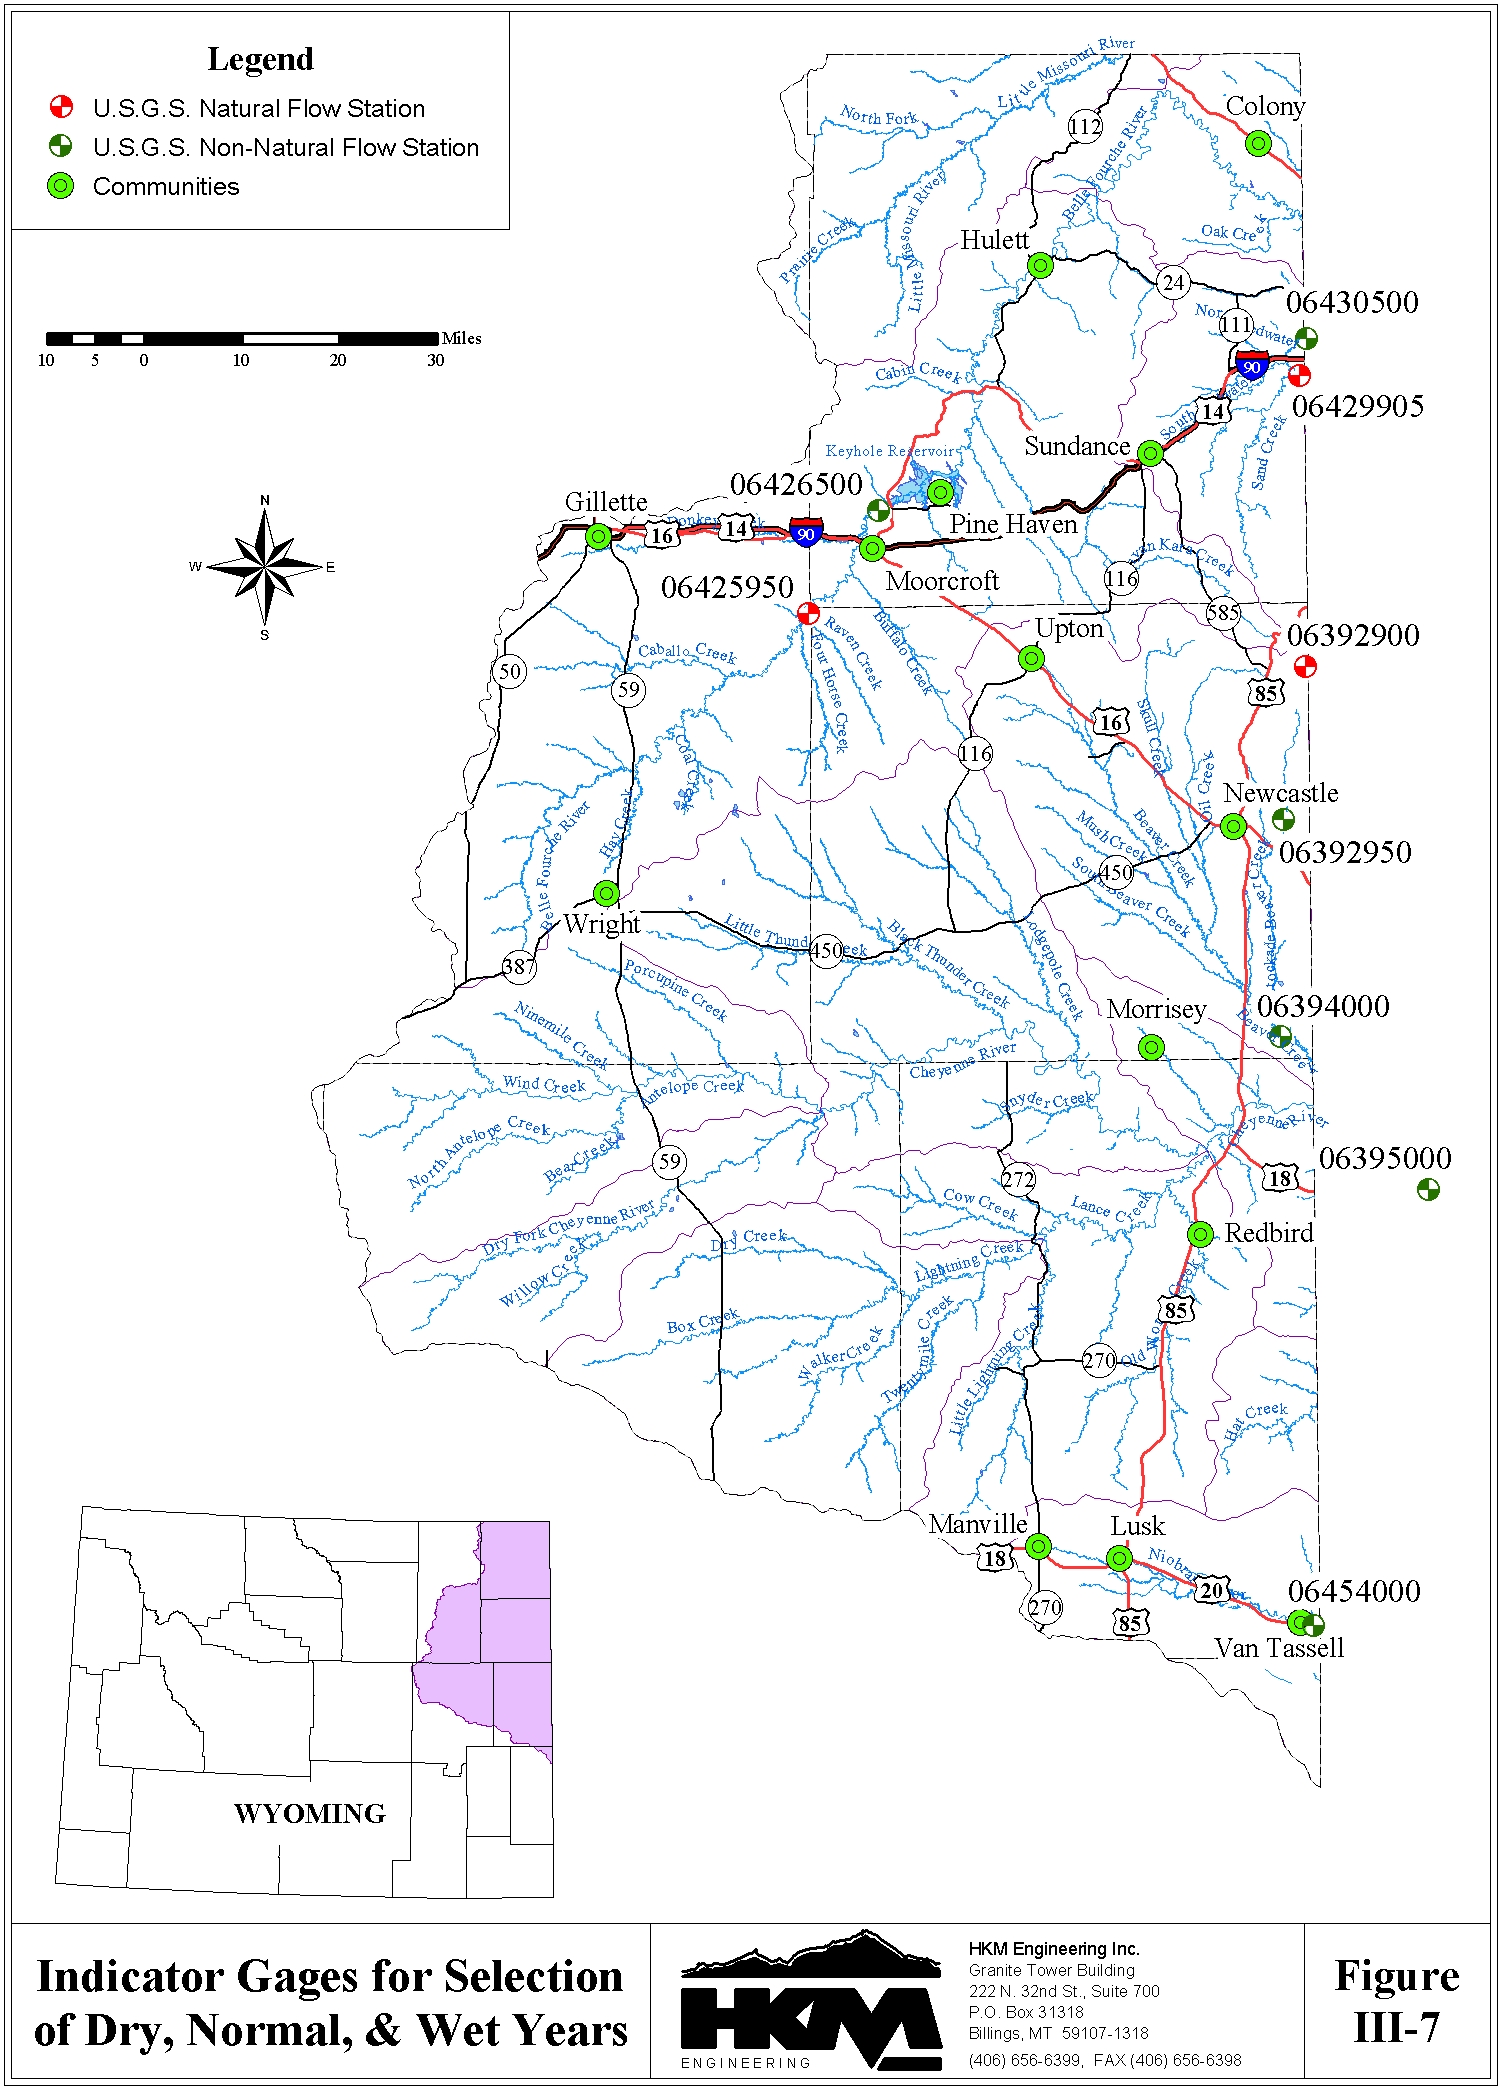
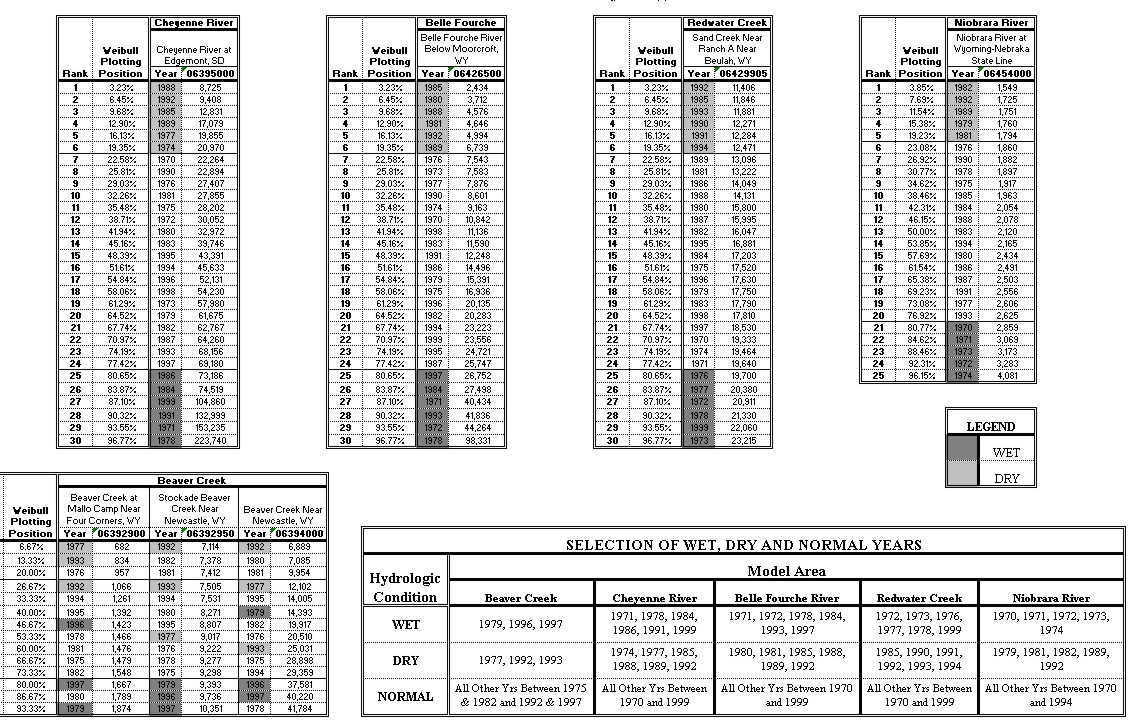
The water availability models developed for this Basin Plan represent dry year, normal year, and wet year hydrologic conditions throughout the Northeast Wyoming River Basins. To this end, the annual streamflows for the study period developed through the surface water hydrology work are ranked and divided into these three hydrologic categories. Indicator gages are selected for this purpose, to represent hydrologic conditions for the entire geographic area of the Northeast Wyoming River Basins. The seven indicator gages are shown on Figure III-7.
The years with non-exceedance probabilities of 20 percent or less (the driest 20 percent) were selected as dry years. Similarly, the years with exceedance probabilities of 20 percent or less (the wettest 20 percent) were selected as wet years. The remaining 60 percent of the years represent normal years. The hydrologic conditions from year to year vary from location to location (i.e. dry years, wet years, and normal years do not occur at all locations simultaneously). The dry, normal, and wet years selected to represent each drainage are, therefore unique to each geographic location. The years selected to represent dry, wet, and normal hydrologic conditions are summarized on Figure III-8. According to the streamflow records for the Beaver Creek drainage, the hydrologic conditions vary significantly from location to location within the drainage. The wet years, dry years, and normal years for the Beaver Creek drainage are therefore, selected to best represent all locations concurrently.
Figure III-8
Selection of Wet, Dry, and Normal Years for Modeling -
Indicator Stations for the Northeast Wyoming River Basins
click to enlarge
The average monthly and annual streamflow for dry years, normal years, and wet years at the gaged model nodes are provided in Tables III-4, III-5, and III-6 respectively. The average monthly and annual streamflow for dry years, normal years, and wet years at the ungaged model nodes are provided in Tables III-7, III-8, and III-9 respectively.
Table III-4
Summary of Dry Year Monthly and Annual Flows
(1970 to 1999 unless otherwise noted) at Gaged Model Nodes
| Basin | Station Number |
Station Name | Natural Flow |
Average Streamflow for 1970-1999 in Acre-Feet | Note | ||||||||||||
| Oct | Nov | Dec | Jan | Feb | Mar | Apr | May | Jun | Jul | Aug | Sep | Annual | |||||
| Cheyenne | 06364700 | Antelope Creek Near Teckla, WY | NO | 22 | 24 | 9 | 18 | 38 | 161 | 69 | 39 | 8 | 153 | 27 | 130 | 698 | |
| 06365300 | Dry Fork Cheyenne River Near Bill, WY | NO | 0 | 1 | 1 | 0 | 2 | 5 | 6 | 4 | 0 | 11 | 0 | 0 | 30 | ||
| 06365900 | Cheyenne River Near Dull Center, WY | NO | 33 | 13 | 14 | 30 | 73 | 324 | 128 | 114 | 82 | 447 | 217 | 103 | 1,577 | ||
| 06375600 | Little Thunder Chreek Near Hampshire, WY | NO | 0 | 0 | 0 | 0 | 0 | 3 | 0 | 3 | 1 | 10 | 1 | 0 | 19 | ||
| 06376300 | Black Thunder Creek Near Hampshire, WY | NO | 122 | 9 | 0 | 60 | 9 | 70 | 114 | 169 | 176 | 308 | 145 | 92 | 1,272 | ||
| 06378300 | Lodgepole Creek Near Hampshire, WY | NO | 0 | 0 | 0 | 0 | 0 | 5 | 4 | 26 | 11 | 4 | 4 | 0 | 54 | ||
| 06386000 | Lance Creek Near Riverview, WY | NO | 104 | 99 | 41 | 683 | 240 | 273 | 347 | 1,008 | 466 | 545 | 511 | 230 | 4,547 | ||
| 06386500 | Cheyenne River Near Spencer, WY | NO | 259 | 216 | 67 | 953 | 430 | 283 | 473 | 1,734 | 762 | 187 | 51 | 280 | 5,695 | ||
| 06392900 | Beaver Creek at Mallo Camp, Near Four Corners, WY | YES | 65 | 61 | 54 | 50 | 62 | 66 | 70 | 72 | 108 | 91 | 81 | 81 | 861 | Study Period: 1975-1982, 1992-1997 | |
| 06392950 | Stockade Beaver Creek Near Newcastle, WY | NO | 722 | 758 | 744 | 759 | 675 | 759 | 648 | 419 | 506 | 668 | 557 | 664 | 7,879 | Study Period: 1975-1982, 1992-1997 | |
| 06394000 | Beaver Creek Near Newcastle, WY | NO | 363 | 762 | 740 | 741 | 756 | 3,202 | 1,906 | 1,411 | 1,744 | 1,459 | 1,187 | 404 | 14,674 | Study Period: 1975-1982, 1992-1997 | |
| 06395000 | Cheyenne River at Edgemont, SD | NO | 743 | 893 | 430 | 632 | 1,264 | 4,005 | 1,571 | 1,081 | 664 | 1,148 | 511 | 1,871 | 14,811 | ||
| Belle Fourche | 06425720 | Belle Fourche River Below Rattlesnake Creek, Near Piney, WY | NO | 1 | 3 | 7 | 12 | 24 | 53 | 16 | 155 | 55 | 36 | 71 | 5 | 438 | |
| 06425780 | Belle Fourche River Above Dry Creek Near Piney, WY | NO | 5 | 2 | 6 | 13 | 51 | 128 | 29 | 284 | 56 | 146 | 69 | 13 | 802 | ||
| 06425900 | Caballo Creek at Mouth Near Piney, WY, WY | NO | 1 | 12 | 0 | 1 | 7 | 17 | 4 | 50 | 6 | 70 | 7 | 1 | 175 | ||
| 06425950 | Raven Creek Near Moorcroft, WY | YES | 0 | 0 | 0 | 0 | 7 | 3 | 0 | 1 | 0 | 0 | 8 | 0 | 20 | ||
| 06426400 | Donkey Creek Near Moorcroft, WY | NO | 4 | 12 | 23 | 17 | 31 | 156 | 29 | 186 | 15 | 3 | 3 | 3 | 481 | ||
| 06426500 | Belle Fourche River Below Moorcroft, WY | NO | 26 | 70 | 61 | 41 | 464 | 1,460 | 299 | 443 | 212 | 1,189 | 183 | 71 | 4,517 | ||
| USBR Gage | Belle Fourche River - Total Keyhole Reservoir Discharge | NO | 0 | 0 | 0 | 4 | 2 | 0 | 1,272 | 4,445 | 4,782 | 8,563 | 7,857 | 995 | 27,919 | ||
| 06427500 | Belle Fourche River Below Keyhole Reservoir, WY | NO | 106 | 99 | 101 | 105 | 96 | 100 | 1,362 | 4,476 | 4,872 | 8,172 | 7,803 | 1,102 | 28,394 | ||
| 06428200 | Belle Fourche River Near Alva, WY | NO | 763 | 990 | 748 | 372 | 565 | 3,225 | 2,160 | 4,088 | 3,941 | 5,745 | 6,394 | 2,123 | 31,114 | ||
| 06428500 | Belle Fourche River at Wyoming-South Dakota State Line | NO | 870 | 1,170 | 863 | 409 | 640 | 4,244 | 3,332 | 5,742 | 4,923 | 7,172 | 6,845 | 2,458 | 38,668 | ||
| 06429905 | Sand Creek Near Ranch A Near Beulah, WY | YES | 927 | 1,071 | 1,063 | 1,036 | 906 | 987 | 1,028 | 1,085 | 996 | 982 | 968 | 979 | 12,026 | ||
| 06430500 | Redwater Creek at Wyoming-South Dakota State Line, WY | NO | 1,465 | 1,615 | 1,582 | 1,543 | 1,398 | 1,642 | 1,665 | 1,700 | 1,671 | 1,441 | 1,538 | 1,577 | 18,836 | ||
| Niobrara | 06454000 | Niobrara River at Wyoming-Nebraska State Line, WY | NO | 118 | 130 | 134 | 131 | 138 | 210 | 180 | 185 | 142 | 115 | 115 | 117 | 1,716 | Study Period: 1970-1994 |
Table III-5
Summary of Normal Year Monthly and Annual Flows
(1970 to 1999 unless otherwise noted) at Gaged Model Nodes
| Basin | Station Number |
Station Name | Natural Flow |
Average Streamflow for 1970-1999 in Acre-Feet | Note | ||||||||||||
| Oct | Nov | Dec | Jan | Feb | Mar | Apr | May | Jun | Jul | Aug | Sep | Annual | |||||
| Cheyenne | 06364700 | Antelope Creek Near Teckla, WY | NO | 69 | 27 | 19 | 21 | 199 | 658 | 302 | 516 | 531 | 268 | 179 | 94 | 2,882 | |
| 06365300 | Dry Fork Cheyenne River Near Bill, WY | NO | 2 | 5 | 5 | 2 | 14 | 30 | 16 | 93 | 20 | 14 | 8 | 0 | 209 | ||
| 06365900 | Cheyenne River Near Dull Center, WY | NO | 203 | 20 | 23 | 35 | 516 | 816 | 582 | 908 | 1,120 | 730 | 491 | 50 | 5,494 | ||
| 06375600 | Little Thunder Chreek Near Hampshire, WY | NO | 3 | 5 | 6 | 5 | 55 | 61 | 12 | 395 | 120 | 124 | 100 | 2 | 890 | ||
| 06376300 | Black Thunder Creek Near Hampshire, WY | NO | 317 | 17 | 0 | 27 | 200 | 647 | 286 | 1,051 | 699 | 370 | 378 | 335 | 4,326 | ||
| 06378300 | Lodgepole Creek Near Hampshire, WY | NO | 1 | 2 | 1 | 1 | 2 | 40 | 26 | 150 | 79 | 21 | 34 | 1 | 358 | ||
| 06386000 | Lance Creek Near Riverview, WY | NO | 115 | 110 | 93 | 201 | 1,040 | 956 | 754 | 2,998 | 2,471 | 2,998 | 2,280 | 802 | 14,809 | ||
| 06386500 | Cheyenne River Near Spencer, WY | NO | 186 | 159 | 48 | 695 | 1,196 | 748 | 1,534 | 14,793 | 6,889 | 1,938 | 511 | 3,325 | 32,023 | ||
| 06392900 | Beaver Creek at Mallo Camp, Near Four Corners, WY | YES | 114 | 102 | 106 | 95 | 95 | 113 | 142 | 154 | 141 | 129 | 122 | 111 | 1,421 | Study Period: 1975-1982, 1992-1997 | |
| 06392950 | Stockade Beaver Creek Near Newcastle, WY | NO | 723 | 713 | 762 | 723 | 694 | 827 | 746 | 600 | 642 | 628 | 658 | 686 | 8,400 | Study Period: 1975-1982, 1992-1997 | |
| 06394000 | Beaver Creek Near Newcastle, WY | NO | 520 | 763 | 846 | 815 | 1,610 | 5,867 | 1,840 | 4,151 | 2,177 | 1,597 | 850 | 403 | 21,439 | Study Period: 1975-1982, 1992-1997 | |
| 06395000 | Cheyenne River at Edgemont, SD | NO | 1,744 | 1,023 | 741 | 836 | 3,785 | 9,936 | 4,071 | 5,678 | 7,006 | 4,720 | 3,922 | 1,584 | 45,044 | ||
| Belle Fourche | 06425720 | Belle Fourche River Below Rattlesnake Creek, Near Piney, WY | NO | 7 | 6 | 11 | 24 | 86 | 179 | 61 | 449 | 246 | 93 | 150 | 22 | 1,334 | |
| 06425780 | Belle Fourche River Above Dry Creek Near Piney, WY | NO | 21 | 6 | 14 | 48 | 203 | 484 | 130 | 690 | 292 | 174 | 179 | 68 | 2,310 | ||
| 06425900 | Caballo Creek at Mouth Near Piney, WY, WY | NO | 13 | 7 | 1 | 11 | 27 | 183 | 30 | 487 | 58 | 81 | 40 | 13 | 951 | ||
| 06425950 | Raven Creek Near Moorcroft, WY | YES | 6 | 0 | 0 | 2 | 55 | 96 | 2 | 44 | 1 | 4 | 11 | 0 | 223 | ||
| 06426400 | Donkey Creek Near Moorcroft, WY | NO | 24 | 13 | 24 | 15 | 27 | 1,302 | 128 | 1,616 | 74 | 14 | 4 | 3 | 3,245 | ||
| 06426500 | Belle Fourche River Below Moorcroft, WY | NO | 846 | 276 | 205 | 494 | 1,513 | 3,406 | 2,128 | 2,920 | 1,675 | 804 | 418 | 376 | 15,059 | ||
| USBR Gage | Belle Fourche River - Total Keyhole Reservoir Discharge | NO | 191 | 533 | 0 | 0 | 0 | 8 | 629 | 380 | 1,340 | 4,723 | 4,080 | 623 | 12,507 | ||
| 06427500 | Belle Fourche River Below Keyhole Reservoir, WY | NO | 359 | 371 | 108 | 107 | 98 | 186 | 557 | 374 | 1,233 | 4,867 | 4,192 | 695 | 13,147 | ||
| 06428200 | Belle Fourche River Near Alva, WY | NO | 2,083 | 1,922 | 1,197 | 1,347 | 2,606 | 6,675 | 7,476 | 9,812 | 6,582 | 4,667 | 4,803 | 1,918 | 51,086 | ||
| 06428500 | Belle Fourche River at Wyoming-South Dakota State Line | NO | 2,652 | 2,471 | 1,445 | 1,656 | 3,488 | 9,328 | 10,601 | 15,628 | 10,124 | 5,983 | 5,235 | 2,267 | 70,878 | ||
| 06429905 | Sand Creek Near Ranch A Near Beulah, WY | YES | 1,343 | 1,290 | 1,274 | 1,227 | 1,096 | 1,236 | 1,266 | 1,998 | 1,772 | 1,494 | 1,445 | 1,329 | 16,772 | ||
| 06430500 | Redwater Creek at Wyoming-South Dakota State Line, WY | NO | 2,143 | 2,068 | 2,038 | 1,996 | 1,976 | 2,280 | 2,386 | 4,025 | 3,077 | 2,135 | 2,167 | 2,096 | 28,387 | ||
| Niobrara | 06454000 | Niobrara River at Wyoming-Nebraska State Line, WY | NO | 149 | 144 | 148 | 142 | 157 | 299 | 275 | 257 | 214 | 147 | 172 | 105 | 2,210 | Study Period: 1970-1994 |
Table III-6
Summary of Wet Year Monthly and Annual Flows
(1970 to 1999 unless otherwise noted) at Gaged Model Nodes
| Basin | Station Number |
Station Name | Natural Flow |
Average Streamflow for 1970-1999 in Acre-Feet | Note | ||||||||||||
| Oct | Nov | Dec | Jan | Feb | Mar | Apr | May | Jun | Jul | Aug | Sep | Annual | |||||
| Cheyenne | 06364700 | Antelope Creek Near Teckla, WY | NO | 258 | 217 | 28 | 28 | 162 | 588 | 482 | 6,013 | 3,421 | 848 | 176 | 52 | 12,273 | |
| 06365300 | Dry Fork Cheyenne River Near Bill, WY | NO | 7 | 13 | 11 | 7 | 43 | 126 | 44 | 687 | 124 | 97 | 14 | 1 | 1,174 | ||
| 06365900 | Cheyenne River Near Dull Center, WY | NO | 237 | 434 | 46 | 46 | 414 | 1,221 | 1,289 | 14,535 | 7,795 | 1,635 | 436 | 77 | 28,165 | ||
| 06375600 | Little Thunder Chreek Near Hampshire, WY | NO | 8 | 7 | 8 | 7 | 74 | 245 | 17 | 2,930 | 295 | 291 | 200 | 3 | 4,084 | ||
| 06376300 | Black Thunder Creek Near Hampshire, WY | NO | 464 | 20 | 0 | 115 | 752 | 2,218 | 569 | 5,615 | 1,081 | 1,324 | 748 | 1,391 | 14,298 | ||
| 06378300 | Lodgepole Creek Near Hampshire, WY | NO | 1 | 3 | 2 | 1 | 4 | 100 | 81 | 638 | 206 | 93 | 61 | 4 | 1,193 | ||
| 06386000 | Lance Creek Near Riverview, WY | NO | 215 | 128 | 97 | 379 | 990 | 2,883 | 1,898 | 17,967 | 5,708 | 5,456 | 3,037 | 835 | 39,593 | ||
| 06386500 | Cheyenne River Near Spencer, WY | NO | 559 | 474 | 144 | 2,078 | 3,418 | 1,800 | 5,123 | 54,135 | 25,000 | 4,514 | 1,091 | 7,012 | 105,348 | ||
| 06392900 | Beaver Creek at Mallo Camp, Near Four Corners, WY | YES | 126 | 122 | 114 | 120 | 123 | 147 | 166 | 148 | 167 | 166 | 138 | 117 | 1,655 | Study Period: 1975-1982, 1992-1997 | |
| 06392950 | Stockade Beaver Creek Near Newcastle, WY | NO | 789 | 770 | 771 | 780 | 739 | 1,075 | 918 | 787 | 689 | 760 | 884 | 865 | 9,827 | Study Period: 1975-1982, 1992-1997 | |
| 06394000 | Beaver Creek Near Newcastle, WY | NO | 715 | 924 | 829 | 972 | 5,219 | 8,927 | 3,837 | 4,062 | 2,113 | 1,339 | 1,321 | 474 | 30,731 | Study Period: 1975-1982, 1992-1997 | |
| 06395000 | Cheyenne River at Edgemont, SD | NO | 3,573 | 3,117 | 768 | 859 | 2,914 | 10,422 | 7,592 | 52,665 | 30,940 | 8,293 | 4,069 | 1,879 | 127,090 | ||
| Belle Fourche | 06425720 | Belle Fourche River Below Rattlesnake Creek, Near Piney, WY | NO | 9 | 9 | 17 | 34 | 115 | 470 | 130 | 1,926 | 386 | 189 | 224 | 30 | 3,540 | |
| 06425780 | Belle Fourche River Above Dry Creek Near Piney, WY | NO | 39 | 10 | 22 | 70 | 290 | 1,476 | 237 | 3,132 | 477 | 531 | 290 | 130 | 6,705 | ||
| 06425900 | Caballo Creek at Mouth Near Piney, WY, WY | NO | 26 | 18 | 1 | 17 | 47 | 538 | 55 | 2,429 | 204 | 182 | 100 | 51 | 3,667 | ||
| 06425950 | Raven Creek Near Moorcroft, WY | YES | 12 | 0 | 0 | 4 | 99 | 552 | 5 | 254 | 7 | 24 | 23 | 0 | 979 | ||
| 06426400 | Donkey Creek Near Moorcroft, WY | NO | 93 | 38 | 70 | 40 | 74 | 4,474 | 310 | 6,512 | 282 | 40 | 11 | 8 | 11,952 | ||
| 06426500 | Belle Fourche River Below Moorcroft, WY | NO | 850 | 118 | 70 | 577 | 3,802 | 11,643 | 4,656 | 16,641 | 5,432 | 1,384 | 1,138 | 208 | 46,519 | ||
| USBR Gage | Belle Fourche River - Total Keyhole Reservoir Discharge | NO | 0 | 0 | 0 | 0 | 0 | 4,378 | 759 | 5,162 | 3,206 | 1,374 | 2,531 | 943 | 18,353 | ||
| 06427500 | Belle Fourche River Below Keyhole Reservoir, WY | NO | 105 | 90 | 91 | 93 | 87 | 4,416 | 766 | 5,372 | 3,239 | 1,391 | 2,620 | 979 | 19,248 | ||
| 06428200 | Belle Fourche River Near Alva, WY | NO | 2,121 | 1,487 | 977 | 2,462 | 3,715 | 15,275 | 12,966 | 17,333 | 13,942 | 4,878 | 4,102 | 2,114 | 81,370 | ||
| 06428500 | Belle Fourche River at Wyoming-South Dakota State Line | NO | 2,709 | 1,827 | 1,162 | 3,329 | 5,058 | 22,710 | 17,625 | 25,247 | 25,372 | 7,413 | 4,458 | 2,423 | 119,333 | ||
| 06429905 | Sand Creek Near Ranch A Near Beulah, WY | YES | 1,602 | 1,597 | 1,539 | 1,468 | 1,263 | 1,460 | 1,617 | 2,326 | 2,566 | 2,031 | 2,094 | 1,704 | 21,266 | ||
| 06430500 | Redwater Creek at Wyoming-South Dakota State Line, WY | NO | 2,646 | 2,567 | 2,517 | 2,498 | 2,317 | 2,718 | 3,012 | 4,712 | 4,772 | 3,104 | 3,185 | 2,730 | 36,778 | ||
| Niobrara | 06454000 | Niobrara River at Wyoming-Nebraska State Line, WY | NO | 189 | 191 | 218 | 337 | 427 | 471 | 478 | 286 | 254 | 158 | 125 | 159 | 3,293 | Study Period: 1970-1994 |
Table III-7
Summary of Dry Year Monthly and Annual Flows
at Ungaged Natural Flow Nodes
| Basin | Station Name | Estimated Average Streamflow for 1970-1999 in Acre-Feet | ||||||||||||
| Oct | Nov | Dec | Jan | Feb | Mar | Apr | May | Jun | Jul | Aug | Sep | Annual | ||
| Cheyenne | Willow Creek at Mouth in Section 28, T38N, R72W | 1 | 0 | 0 | 0 | 7 | 22 | 0 | 10 | 0 | 1 | 28 | 0 | 43 |
| Woody Creek at Mouth in Section 5, T39N, R69W | 0 | 0 | 0 | 0 | 1 | 3 | 0 | 1 | 0 | 0 | 0 | 0 | 5 | |
| Lake Creek at Mouth in Section 30, T40N, R68W | 0 | 0 | 0 | 0 | 2 | 7 | 0 | 3 | 0 | 0 | 1 | 0 | 13 | |
| Sheep Creek at Mouth in Section 7, T40N, R67W | 0 | 0 | 0 | 0 | 1 | 2 | 0 | 1 | 0 | 0 | 0 | 0 | 4 | |
| Wagonhound Creek at Mouth in Section 31, T41N, R67W | 0 | 0 | 0 | 0 | 1 | 4 | 0 | 2 | 0 | 0 | 0 | 0 | 7 | |
| Snyder Creek at Mouth in Section 23, T40N, R64W | 1 | 0 | 0 | 0 | 7 | 21 | 0 | 9 | 0 | 1 | 2 | 0 | 41 | |
| Boggy Creek at Mouth in Section 32, T40N, R63W | 0 | 0 | 0 | 0 | 2 | 6 | 0 | 3 | 0 | 0 | 0 | 0 | 11 | |
| Sevenmile Creek at Mouth in Section 34, T40N, R63W | 0 | 0 | 0 | 0 | 1 | 3 | 0 | 1 | 0 | 0 | 0 | 0 | 5 | |
| Mule Creek at Mouth in Section 6, T39N, R61W | 0 | 0 | 0 | 0 | 3 | 9 | 0 | 4 | 0 | 0 | 1 | 0 | 17 | |
| Robbers' Roost Creek at Mouth in Section 23, T40N, R61W | 0 | 0 | 0 | 0 | 4 | 13 | 0 | 6 | 0 | 1 | 1 | 0 | 25 | |
| Beaver Creek Just Below Mush Creek in Section 32, T44N, R62W | 1 | 0 | 0 | 0 | 39 | 16 | 0 | 7 | 0 | 1 | 44 | 0 | 108 | |
| Oil Creek at Mouth in Section 26, T43N, R62W | 201 | 0 | 0 | 63 | 1,739 | 5,441 | 84 | 2,507 | 73 | 235 | 414 | 0 | 10,757 | |
| Blacktail Creek at Mouth in Section 2, T41N, R61W | 182 | 177 | 181 | 181 | 162 | 174 | 183 | 218 | 207 | 198 | 186 | 181 | 2,230 | |
| Dry Beaver Creek Just Above Beaver Creek in Section 4, T47N, R60W | 65 | 62 | 54 | 51 | 62 | 67 | 71 | 73 | 109 | 92 | 81 | 82 | 869 | |
| Belle Fourche | Dry Creek at Mouth in Section 29, T47N, R70W | 0 | 0 | 0 | 0 | 2 | 1 | 0 | 0 | 0 | 0 | 2 | 0 | 5 |
| Yellow Hammer Creek at Mouth in Section 10, T47N, R70W | 0 | 0 | 0 | 0 | 1 | 0 | 0 | 0 | 0 | 0 | 1 | 0 | 2 | |
| Whitetail Creek at Mouth in Section 32, T48N, R69W | 0 | 0 | 0 | 0 | 1 | 0 | 0 | 0 | 0 | 0 | 1 | 0 | 2 | |
| Four Horse Creek at Mouth in Section 11, T48N, R69W | 0 | 0 | 0 | 0 | 10 | 4 | 0 | 2 | 0 | 0 | 11 | 0 | 27 | |
| Timber Creek at Mouth in Section 2, T48N, R69W | 0 | 0 | 0 | 0 | 3 | 1 | 0 | 0 | 0 | 0 | 3 | 0 | 7 | |
| Buffalo Creek at Mouth in Section 14, T49N, R68W | 0 | 0 | 0 | 0 | 12 | 5 | 0 | 2 | 0 | 0 | 14 | 0 | 33 | |
| Donkey Creek Just Upsteam of Gage in Sec. 30, T50N, R68W | 0 | 0 | 0 | 902 | 1,400 | 1,658 | 1,367 | 1,176 | 676 | 0 | 0 | 0 | 7,179 | |
| Trail Creek at Mouth in Section 24, T50N, R68W | 0 | 0 | 0 | 0 | 1 | 1 | 0 | 0 | 0 | 0 | 2 | 0 | 4 | |
| Dry Creek at Mouth in Section 24, T50N, R68W | 0 | 0 | 0 | 0 | 2 | 1 | 0 | 0 | 0 | 0 | 2 | 0 | 5 | |
| Robinson Creek at Mouth in Section 18, T50N, R67W | 0 | 0 | 0 | 0 | 1 | 0 | 0 | 0 | 0 | 0 | 1 | 0 | 2 | |
| Duck Creek at Mouth in Section 8, T50N, R67W | 1 | 0 | 0 | 0 | 47 | 18 | 0 | 8 | 0 | 1 | 36 | 0 | 111 | |
| Miller Creek at Mouth in Section 9, T50N, R67W | 7 | 0 | 0 | 2 | 532 | 200 | 3 | 91 | 3 | 9 | 409 | 0 | 1,256 | |
| Smoke Creek at Mouth in Section 9, T50N, R67W | 0 | 0 | 0 | 0 | 14 | 5 | 0 | 2 | 0 | 0 | 11 | 0 | 32 | |
| Berger Creek at Mouth in Section 12, T50N, R67W | 0 | 0 | 0 | 0 | 22 | 8 | 0 | 4 | 0 | 0 | 17 | 0 | 51 | |
| Lone Tree Creek at Mouth in Section 26, T51N, R67W | 1 | 0 | 0 | 0 | 49 | 18 | 0 | 8 | 0 | 1 | 38 | 0 | 115 | |
| Wind Creek at Mouth in Section 13, T50N, R67W | 17 | 0 | 0 | 5 | 1,218 | 458 | 7 | 208 | 6 | 21 | 935 | 0 | 2,875 | |
| Deer Creek at Mouth in Section 23, T51N, R67W | 4 | 0 | 0 | 1 | 257 | 97 | 1 | 44 | 1 | 5 | 198 | 0 | 608 | |
| Eggie Creek at Mouth in Section 21, T51N, R66W | 0 | 0 | 0 | 0 | 36 | 13 | 0 | 6 | 0 | 1 | 27 | 0 | 83 | |
| Mule Creek at Mouth in Section 15, T50N, R66W | 2 | 0 | 0 | 1 | 156 | 59 | 1 | 27 | 1 | 3 | 120 | 0 | 370 | |
| Cottonwood Creek at Mouth in Section 35, T51N, R66W | 1 | 0 | 0 | 0 | 41 | 16 | 0 | 7 | 0 | 1 | 32 | 0 | 98 | |
| Arch Creek at Mouth in Section 11, T51N, R66W | 0 | 0 | 0 | 0 | 8 | 3 | 0 | 2 | 0 | 0 | 9 | 0 | 22 | |
| Inyan Kara Creek at Mouth in Section 25, T52N, R66W | 919 | 1,051 | 1,068 | 1,017 | 884 | 960 | 963 | 1,061 | 939 | 894 | 896 | 943 | 11,595 | |
| Cabin Creek at Mouth in Section 14, T52N, R66W | 0 | 0 | 0 | 0 | 6 | 2 | 0 | 1 | 0 | 0 | 7 | 0 | 16 | |
| Miller Creek at Mouth in Section 12, T52N, R66W | 0 | 0 | 0 | 0 | 5 | 2 | 0 | 1 | 0 | 0 | 6 | 0 | 14 | |
| Lytle Creek at Mouth in Section 8, T53N, R65W | 0 | 0 | 0 | 0 | 4 | 1 | 0 | 1 | 0 | 0 | 4 | 0 | 10 | |
| Whitetail Creek at Mouth in Section 14, T54N, R65W | 66 | 76 | 77 | 73 | 63 | 69 | 69 | 76 | 68 | 64 | 64 | 68 | 833 | |
| Blacktail Creek at Mouth in Section 12, T54N, R65W | 168 | 193 | 196 | 186 | 160 | 175 | 176 | 194 | 172 | 164 | 162 | 173 | 2,119 | |
| Beaver Creek at Mouth in Section 1, T55N, R64W | 368 | 421 | 428 | 407 | 350 | 383 | 386 | 424 | 376 | 358 | 354 | 378 | 4,633 | |
| East Creek at Mouth in Section 32, T55N, R63W | 38 | 44 | 45 | 42 | 36 | 40 | 40 | 44 | 39 | 37 | 37 | 39 | 481 | |
| Arnold Creek at Mouth in Section 28, T55N, R63W | 18 | 20 | 21 | 20 | 17 | 19 | 19 | 21 | 18 | 17 | 17 | 18 | 225 | |
| Horse Creek at Mouth in Section 19, T56N, R61W | 61 | 69 | 71 | 67 | 58 | 63 | 64 | 70 | 62 | 59 | 58 | 62 | 764 | |
| Pine Creek at Mouth in Section 33, T56N, R61W | 138 | 158 | 160 | 153 | 131 | 143 | 145 | 159 | 141 | 134 | 133 | 142 | 1,737 | |
| Kilpatrick Creek at Mouth in Section 3, T55N, R61W | 56 | 64 | 65 | 61 | 53 | 58 | 58 | 64 | 57 | 54 | 54 | 57 | 701 | |
| Kruger Creek at Mouth in Section 11, T55N, R61W | 27 | 31 | 31 | 30 | 26 | 28 | 28 | 31 | 28 | 26 | 26 | 28 | 340 | |
| Oak Creek at Mouth in Section 20, T55N, R60W | 173 | 198 | 201 | 191 | 165 | 180 | 181 | 199 | 177 | 168 | 167 | 178 | 2,178 | |
| South Redwater Creek Just Above Sand Creek in Section 31, T53N, R60W | 399 | 461 | 458 | 446 | 390 | 425 | 443 | 467 | 429 | 423 | 417 | 422 | 5,180 | |
| Redwater Creek Just Above South Redwater Creek in Section 31, T53N, R60W | 203 | 234 | 232 | 227 | 198 | 216 | 225 | 237 | 218 | 215 | 212 | 214 | 2,631 | |
Table III-8
Summary of Normal Year Monthly and Annual Flows
at Ungaged Natural Flow Nodes
| Basin | Station Name | Estimated Average Streamflow for 1970-1999 in Acre-Feet | ||||||||||||
| Oct | Nov | Dec | Jan | Feb | Mar | Apr | May | Jun | Jul | Aug | Sep | Annual | ||
| Cheyenne | Willow Creek at Mouth in Section 28, T38N, R72W | 11 | 0 | 0 | 4 | 97 | 188 | 4 | 87 | 3 | 8 | 23 | 0 | 425 |
| Woody Creek at Mouth in Section 5, T39N, R69W | 1 | 0 | 0 | 0 | 13 | 25 | 1 | 11 | 0 | 1 | 3 | 0 | 55 | |
| Lake Creek at Mouth in Section 30, T40N, R68W | 3 | 0 | 0 | 1 | 29 | 57 | 1 | 26 | 1 | 2 | 7 | 0 | 127 | |
| Sheep Creek at Mouth in Section 7, T40N, R67W | 1 | 0 | 0 | 0 | 9 | 18 | 0 | 8 | 0 | 1 | 2 | 0 | 39 | |
| Wagonhound Creek at Mouth in Section 31, T41N, R67W | 2 | 0 | 0 | 1 | 20 | 38 | 1 | 18 | 1 | 2 | 5 | 0 | 88 | |
| Snyder Creek at Mouth in Section 23, T40N, R64W | 10 | 0 | 0 | 3 | 91 | 177 | 4 | 82 | 2 | 8 | 22 | 0 | 399 | |
| Boggy Creek at Mouth in Section 32, T40N, R63W | 3 | 0 | 0 | 1 | 25 | 48 | 1 | 22 | 1 | 2 | 6 | 0 | 109 | |
| Sevenmile Creek at Mouth in Section 34, T40N, R63W | 1 | 0 | 0 | 0 | 12 | 24 | 1 | 11 | 0 | 1 | 3 | 0 | 53 | |
| Mule Creek at Mouth in Section 30, T39N, R61W | 4 | 0 | 0 | 1 | 39 | 76 | 2 | 35 | 1 | 3 | 9 | 0 | 170 | |
| Robbers' Roost Creek at Mouth in Section 23, T40N, R61W | 6 | 0 | 0 | 2 | 55 | 108 | 2 | 50 | 1 | 5 | 13 | 0 | 242 | |
| Beaver Creek Just Below Mush Creek in Section 32, T44N, R62W | 35 | 0 | 0 | 11 | 299 | 526 | 14 | 243 | 7 | 23 | 60 | 0 | 1,218 | |
| Oil Creek at Mouth in Section 26, T43N, R62W | 402 | 0 | 0 | 49 | 5,048 | 5,977 | 70 | 2,767 | 83 | 261 | 1,971 | 0 | 16,628 | |
| Blacktail Creek at Mouth in Section 2, T41N, R61W | 199 | 196 | 190 | 180 | 156 | 179 | 187 | 324 | 274 | 244 | 218 | 200 | 2,547 | |
| Dry Beaver Creek at Mouth in Section 4, T47N, R60W | 115 | 103 | 107 | 96 | 96 | 114 | 143 | 155 | 142 | 130 | 124 | 112 | 1,437 | |
| Belle Fourche | Dry Creek at Mouth in Section 29, T47N, R70W | 2 | 0 | 0 | 1 | 14 | 25 | 1 | 11 | 0 | 1 | 3 | 0 | 58 |
| Yellow Hammer Creek at Mouth in Section 10, T47N, R70W | 1 | 0 | 0 | 0 | 5 | 9 | 0 | 4 | 0 | 0 | 1 | 0 | 20 | |
| Whitetail Creek at Mouth in Section 32, T48N, R69W | 1 | 0 | 0 | 0 | 8 | 14 | 0 | 6 | 0 | 1 | 2 | 0 | 32 | |
| Four Horse Creek at Mouth in Section 11, T48N, R69W | 9 | 0 | 0 | 3 | 74 | 130 | 3 | 60 | 2 | 6 | 15 | 0 | 302 | |
| Timber Creek at Mouth in Section 2, T48N, R69W | 2 | 0 | 0 | 1 | 19 | 34 | 1 | 16 | 0 | 1 | 4 | 0 | 78 | |
| Buffalo Creek at Mouth in Section 14, T49N, R68W | 11 | 0 | 0 | 4 | 94 | 165 | 4 | 76 | 2 | 7 | 19 | 0 | 382 | |
| Donkey Creek Just Upsteam of Gage in Sec. 30, T50N, R68W | 0 | 0 | 0 | 235 | 1,126 | 2,518 | 1,451 | 2,883 | 886 | 0 | 0 | 0 | 9,100 | |
| Trail Creek at Mouth in Section 24, T50N, R68W | 1 | 0 | 0 | 0 | 10 | 18 | 0 | 9 | 0 | 1 | 2 | 0 | 41 | |
| Dry Creek at Mouth in Section 24, T50N, R68W | 2 | 0 | 0 | 1 | 15 | 26 | 1 | 12 | 0 | 1 | 3 | 0 | 61 | |
| Robinson Creek at Mouth in Section 18, T50N, R67W | 1 | 0 | 0 | 0 | 4 | 8 | 0 | 4 | 0 | 0 | 1 | 0 | 18 | |
| Duck Creek at Mouth in Section 8, T50N, R67W | 6 | 0 | 0 | 5 | 60 | 116 | 5 | 53 | 2 | 5 | 21 | 0 | 273 | |
| Miller Creek at Mouth in Section 9, T50N, R67W | 68 | 0 | 0 | 55 | 689 | 1,322 | 58 | 607 | 18 | 57 | 236 | 0 | 3,110 | |
| Smoke Creek at Mouth in Section 9, T50N, R67W | 2 | 0 | 0 | 1 | 18 | 34 | 1 | 16 | 0 | 1 | 6 | 0 | 79 | |
| Berger Creek at Mouth in Section 12, T50N, R67W | 3 | 0 | 0 | 2 | 29 | 56 | 2 | 26 | 1 | 2 | 10 | 0 | 131 | |
| Lone Tree Creek at Mouth in Section 26, T51N, R67W | 6 | 0 | 0 | 5 | 63 | 121 | 5 | 56 | 2 | 5 | 22 | 0 | 285 | |
| Wind Creek at Mouth in Section 13, T50N, R67W | 156 | 0 | 0 | 126 | 1,578 | 3,025 | 133 | 1,389 | 41 | 130 | 540 | 0 | 7,118 | |
| Deer Creek at Mouth in Section 23, T51N, R67W | 33 | 0 | 0 | 27 | 333 | 639 | 28 | 293 | 9 | 27 | 114 | 0 | 1,503 | |
| Eggie Creek at Mouth in Section 21, T51N, R66W | 5 | 0 | 0 | 4 | 46 | 88 | 4 | 41 | 1 | 4 | 16 | 0 | 209 | |
| Mule Creek at Mouth in Section 15, T50N, R66W | 20 | 0 | 0 | 16 | 202 | 387 | 17 | 178 | 5 | 17 | 69 | 0 | 911 | |
| Cottonwood Creek at Mouth in Section 35, T51N, R66W | 5 | 0 | 0 | 4 | 54 | 103 | 5 | 47 | 1 | 4 | 18 | 0 | 241 | |
| Arch Creek at Mouth in Section 11, T51N, R66W | 8 | 0 | 0 | 2 | 63 | 111 | 3 | 51 | 2 | 5 | 13 | 0 | 258 | |
| Inyan Kara Creek at Mouth in Section 25, T52N, R66W | 1,199 | 1,143 | 1,138 | 1,116 | 1,037 | 1,231 | 1,146 | 1,820 | 1,641 | 1,397 | 1,401 | 1,207 | 15,476 | |
| Cabin Creek at Mouth in Section 14, T52N, R66W | 6 | 0 | 0 | 2 | 48 | 84 | 2 | 39 | 1 | 4 | 10 | 0 | 196 | |
| Miller Creek at Mouth in Section 12, T52N, R66W | 5 | 0 | 0 | 1 | 40 | 70 | 2 | 32 | 1 | 3 | 8 | 0 | 162 | |
| Lytle Creek at Mouth in Section 8, T53N, R65W | 3 | 0 | 0 | 1 | 27 | 48 | 1 | 22 | 1 | 2 | 5 | 0 | 110 | |
| Whitetail Creek at Mouth in Section 14, T54N, R65W | 86 | 82 | 82 | 80 | 69 | 79 | 82 | 127 | 118 | 100 | 100 | 87 | 1,092 | |
| Blacktail Creek at Mouth in Section 12, T54N, R65W | 218 | 209 | 208 | 204 | 176 | 201 | 209 | 322 | 300 | 255 | 254 | 221 | 2,777 | |
| Beaver Creek at Mouth in Section 1, T55N, R64W | 477 | 458 | 456 | 446 | 385 | 439 | 458 | 704 | 657 | 557 | 555 | 483 | 6,075 | |
| East Creek at Mouth in Section 32, T55N, R63W | 50 | 48 | 47 | 46 | 40 | 46 | 48 | 73 | 68 | 58 | 58 | 50 | 632 | |
| Arnold Creek at Mouth in Section 28, T55N, R63W | 23 | 22 | 22 | 22 | 19 | 21 | 22 | 34 | 32 | 27 | 27 | 23 | 294 | |
| Horse Creek at Mouth in Section 19, T56N, R61W | 79 | 76 | 75 | 74 | 63 | 72 | 75 | 116 | 108 | 92 | 92 | 80 | 1,002 | |
| Pine Creek at Mouth in Section 33, T56N, R61W | 179 | 172 | 171 | 167 | 144 | 165 | 172 | 264 | 246 | 209 | 208 | 181 | 2,278 | |
| Kilpatrick Creek at Mouth in Section 3, T55N, R61W | 72 | 69 | 69 | 67 | 58 | 66 | 69 | 106 | 99 | 84 | 84 | 73 | 916 | |
| Kruger Creek at Mouth in Section 11, T55N, R61W | 35 | 34 | 33 | 33 | 28 | 32 | 34 | 52 | 48 | 41 | 41 | 36 | 447 | |
| Oak Creek at Mouth in Section 20, T55N, R60W | 224 | 215 | 214 | 210 | 181 | 207 | 215 | 331 | 309 | 262 | 261 | 227 | 2,856 | |
| South Redwater Creek Just Above Sand Creek in Section 31, T53N, R60W | 579 | 556 | 549 | 529 | 472 | 533 | 545 | 860 | 763 | 644 | 623 | 572 | 7,225 | |
| Redwater Creek Just Below South Redwater Creek in Section 31, T53N, R60W | 294 | 282 | 279 | 268 | 240 | 270 | 277 | 437 | 388 | 327 | 316 | 291 | 3,669 | |
Table III-9
Summary of Wet Year Monthly and Annual Flows
at Ungaged Natural Flow Nodes
| Basin | Station Name | Estimated Average Streamflow for 1970-1999 in Acre-Feet | ||||||||||||
| Oct | Nov | Dec | Jan | Feb | Mar | Apr | May | Jun | Jul | Aug | Sep | Annual | ||
| Cheyenne | Willow Creek at Mouth in Section 28, T38N, R72W | 10 | 0 | 0 | 3 | 83 | 601 | 5 | 276 | 8 | 26 | 20 | 0 | 1,032 |
| Woody Creek at Mouth in Section 5, T39N, R69W | 1 | 0 | 0 | 0 | 11 | 79 | 1 | 36 | 1 | 3 | 3 | 0 | 135 | |
| Lake Creek at Mouth in Section 30, T40N, R68W | 3 | 0 | 0 | 1 | 25 | 182 | 2 | 84 | 2 | 8 | 6 | 0 | 313 | |
| Sheep Creek at Mouth in Section 7, T40N, R67W | 1 | 0 | 0 | 0 | 8 | 58 | 0 | 27 | 1 | 2 | 2 | 0 | 99 | |
| Wagonhound Creek at Mouth in Section 31, T41N, R67W | 2 | 0 | 0 | 1 | 17 | 121 | 1 | 56 | 2 | 5 | 4 | 0 | 209 | |
| Snyder Creek at Mouth in Section 23, T40N, R64W | 9 | 0 | 0 | 3 | 77 | 563 | 5 | 259 | 7 | 24 | 18 | 0 | 965 | |
| Boggy Creek at Mouth in Section 32, T40N, R63W | 3 | 0 | 0 | 1 | 21 | 154 | 1 | 71 | 2 | 7 | 5 | 0 | 265 | |
| Sevenmile Creek at Mouth in Section 34, T40N, R63W | 1 | 0 | 0 | 0 | 10 | 75 | 1 | 35 | 1 | 3 | 2 | 0 | 128 | |
| Mule Creek at Mouth in Section 6, T39N, R61W | 4 | 0 | 0 | 1 | 33 | 242 | 2 | 111 | 3 | 10 | 8 | 0 | 414 | |
| Robbers' Roost Creek at Mouth in Section 23, T40N, R61W | 6 | 0 | 0 | 2 | 47 | 343 | 3 | 158 | 5 | 15 | 11 | 0 | 590 | |
| Beaver Creek Just Below Mush Creek in Section 32, T44N, R62W | 63 | 0 | 0 | 20 | 539 | 3,018 | 30 | 1,388 | 40 | 130 | 128 | 0 | 5,356 | |
| Oil Creek at Mouth in Section 26, T43N, R62W | 225 | 0 | 0 | 71 | 1,950 | 6,374 | 1,364 | 2,810 | 82 | 263 | 4,838 | 0 | 17,977 | |
| Blacktail Creek at Mouth in Section 2, T41N, R61W | 220 | 211 | 211 | 204 | 182 | 226 | 210 | 283 | 282 | 272 | 239 | 211 | 2,751 | |
| Dry Beaver Creek Just Above Beaver Creek in Section 4, T47N, R60W | 127 | 124 | 115 | 122 | 125 | 148 | 168 | 149 | 169 | 168 | 139 | 118 | 1,672 | |
| Belle Fourche | Dry Creek at Mouth in Section 29, T47N, R70W | 3 | 0 | 0 | 1 | 25 | 142 | 1 | 65 | 2 | 6 | 6 | 0 | 251 |
| Yellow Hammer Creek at Mouth in Section 10, T47N, R70W | 1 | 0 | 0 | 0 | 9 | 53 | 1 | 24 | 1 | 2 | 2 | 0 | 93 | |
| Whitetail Creek at Mouth in Section 32, T48N, R69W | 2 | 0 | 0 | 1 | 14 | 78 | 1 | 36 | 1 | 3 | 3 | 0 | 139 | |
| Four Horse Creek at Mouth in Section 11, T48N, R69W | 16 | 0 | 0 | 5 | 133 | 746 | 7 | 343 | 10 | 32 | 32 | 0 | 1,324 | |
| Timber Creek at Mouth in Section 2, T48N, R69W | 4 | 0 | 0 | 1 | 35 | 195 | 2 | 90 | 3 | 8 | 8 | 0 | 346 | |
| Buffalo Creek at Mouth in Section 14, T49N, R68W | 20 | 0 | 0 | 6 | 169 | 947 | 9 | 436 | 13 | 41 | 40 | 0 | 1,681 | |
| Donkey Creek Just Upsteam of Gage in Sec. 30, T50N, R68W | 0 | 0 | 0 | 102 | 879 | 5,657 | 1,848 | 7,956 | 1,275 | 0 | 0 | 0 | 17,717 | |
| Trail Creek at Mouth in Section 24, T50N, R68W | 2 | 0 | 0 | 1 | 19 | 106 | 1 | 49 | 1 | 5 | 5 | 0 | 189 | |
| Dry Creek at Mouth in Section 24, T50N, R68W | 3 | 0 | 0 | 1 | 26 | 148 | 1 | 68 | 2 | 6 | 6 | 0 | 261 | |
| Robinson Creek at Mouth in Section 18, T50N, R67W | 1 | 0 | 0 | 0 | 8 | 45 | 0 | 21 | 1 | 2 | 2 | 0 | 80 | |
| Duck Creek at Mouth in Section 8, T50N, R67W | 4 | 0 | 0 | 1 | 37 | 153 | 2 | 71 | 2 | 7 | 9 | 0 | 286 | |
| Miller Creek at Mouth in Section 9, T50N, R67W | 49 | 0 | 0 | 15 | 425 | 1,750 | 22 | 805 | 23 | 75 | 101 | 0 | 3,265 | |
| Smoke Creek at Mouth in Section 9, T50N, R67W | 1 | 0 | 0 | 0 | 11 | 45 | 1 | 21 | 1 | 2 | 3 | 0 | 85 | |
| Berger Creek at Mouth in Section 12, T50N, R67W | 2 | 0 | 0 | 1 | 18 | 74 | 1 | 34 | 1 | 3 | 4 | 0 | 138 | |
| Lone Tree Creek at Mouth in Section 26, T51N, R67W | 5 | 0 | 0 | 1 | 39 | 161 | 2 | 74 | 2 | 7 | 9 | 0 | 300 | |
| Wind Creek at Mouth in Section 13, T50N, R67W | 113 | 0 | 0 | 35 | 973 | 4,004 | 50 | 1,843 | 53 | 173 | 232 | 0 | 7,476 | |
| Deer Creek at Mouth in Section 23, T51N, R67W | 24 | 0 | 0 | 7 | 206 | 846 | 11 | 389 | 11 | 36 | 49 | 0 | 1,579 | |
| Eggie Creek at Mouth in Section 21, T51N, R66W | 3 | 0 | 0 | 1 | 28 | 117 | 1 | 54 | 2 | 5 | 7 | 0 | 218 | |
| Mule Creek at Mouth in Section 15, T50N, R66W | 14 | 0 | 0 | 5 | 125 | 512 | 6 | 236 | 7 | 22 | 30 | 0 | 957 | |
| Cottonwood Creek at Mouth in Section 35, T51N, R66W | 4 | 0 | 0 | 1 | 33 | 136 | 2 | 63 | 2 | 6 | 8 | 0 | 255 | |
| Arch Creek at Mouth in Section 11, T51N, R66W | 13 | 0 | 0 | 4 | 114 | 639 | 6 | 294 | 8 | 28 | 27 | 0 | 1,133 | |
| Inyan Kara Creek at Mouth in Section 25, T52N, R66W | 1,255 | 1,227 | 1,126 | 1,049 | 1,145 | 1,900 | 1,242 | 2,233 | 1,905 | 1,511 | 1,448 | 1,259 | 17,300 | |
| Cabin Creek at Mouth in Section 14, T52N, R66W | 10 | 0 | 0 | 3 | 86 | 483 | 5 | 222 | 6 | 21 | 21 | 0 | 857 | |
| Miller Creek at Mouth in Section 12, T52N, R66W | 8 | 0 | 0 | 3 | 71 | 399 | 4 | 184 | 5 | 17 | 17 | 0 | 708 | |
| Lytle Creek at Mouth in Section 8, T53N, R65W | 6 | 0 | 0 | 2 | 49 | 276 | 3 | 127 | 4 | 12 | 12 | 0 | 491 | |
| Whitetail Creek at Mouth in Section 14, T54N, R65W | 89 | 88 | 81 | 75 | 73 | 81 | 89 | 135 | 137 | 107 | 102 | 91 | 1,148 | |
| Blacktail Creek at Mouth in Section 12, T54N, R65W | 227 | 225 | 206 | 191 | 185 | 207 | 226 | 344 | 347 | 271 | 259 | 231 | 2,919 | |
| Beaver Creek at Mouth in Section 1, T55N, R64W | 496 | 491 | 451 | 418 | 404 | 452 | 495 | 753 | 759 | 592 | 567 | 505 | 6,383 | |
| East Creek at Mouth in Section 32, T55N, R63W | 52 | 51 | 47 | 44 | 42 | 47 | 51 | 78 | 79 | 62 | 59 | 53 | 665 | |
| Arnold Creek at Mouth in Section 28, T55N, R63W | 24 | 24 | 22 | 20 | 20 | 22 | 24 | 36 | 37 | 29 | 27 | 24 | 309 | |
| Horse Creek at Mouth in Section 19, T56N, R61W | 82 | 81 | 74 | 69 | 67 | 75 | 82 | 124 | 125 | 98 | 94 | 83 | 1,054 | |
| Pine Creek at Mouth in Section 33, T56N, R61W | 186 | 184 | 169 | 157 | 151 | 169 | 185 | 282 | 285 | 222 | 213 | 189 | 2,392 | |
| Kilpatrick Creek at Mouth in Section 3, T55N, R61W | 75 | 74 | 68 | 63 | 61 | 68 | 75 | 114 | 115 | 89 | 86 | 76 | 964 | |
| Kruger Creek at Mouth in Section 11, T55N, R61W | 36 | 36 | 33 | 31 | 30 | 33 | 36 | 55 | 56 | 43 | 42 | 37 | 468 | |
| Oak Creek at Mouth in Section 20, T55N, R60W | 233 | 231 | 212 | 197 | 190 | 213 | 232 | 354 | 357 | 278 | 267 | 237 | 3,001 | |
| South Redwater Creek Just Above Sand Creek in Section 31, T53N, R60W | 690 | 688 | 663 | 632 | 544 | 629 | 697 | 1,002 | 1,105 | 875 | 902 | 734 | 9,161 | |
| Redwater Creek Just Below South Redwater Creek in Section 31, T53N, R60W | 350 | 349 | 337 | 321 | 276 | 319 | 354 | 509 | 561 | 444 | 458 | 373 | 4,651 | |
Spreadsheet Model Development and Calibration
Water availability spreadsheet models were developed for the following four sub-basins within the Northeast Wyoming River Basins planning area:
The models developed for this plan are intended to simulate water use and availability under existing conditions. For each sub-basin, three models were developed, reflecting each of the three hydrologic conditions (dry, normal, and wet years). The models each represent one calendar year of flows, on a monthly time step. Streamflow, estimated actual diversions, full supply diversions, irrigation returns, and reservoir conditions are the basic input data to the models. For all of these data, average values drawn from the dry, normal, or wet years of the study period were computed for use in the spreadsheets.
Theoretical Maximum Diversion Requirements were calculated using the acreage of irrigated lands mapped through this study and the consumptive irrigation requirements (CIR) provided by Dr. Larry Pochop. Lacking historical diversion data specific to the planning area, relationships between historical diversion records and Theoretical Maximum Diversions developed for the neighboring Powder/Tongue River Basin were used to calculate the Estimated Actual Diversions and the Full Supply Diversion Requirements for all modeled irrigated lands. A more detailed discussion of this process is offered in the "Agricultural Use" technical memorandum.
Development of the model and the model inputs (primarily streamflows, estimated actual diversions and the interrelated irrigation efficiencies and irrigation return flows) progressed somewhat concurrently in order to achieve calibration. The model representation of the physical system and the various model inputs were adjusted as necessary through a trial and error process until the models were reasonably well calibrated.
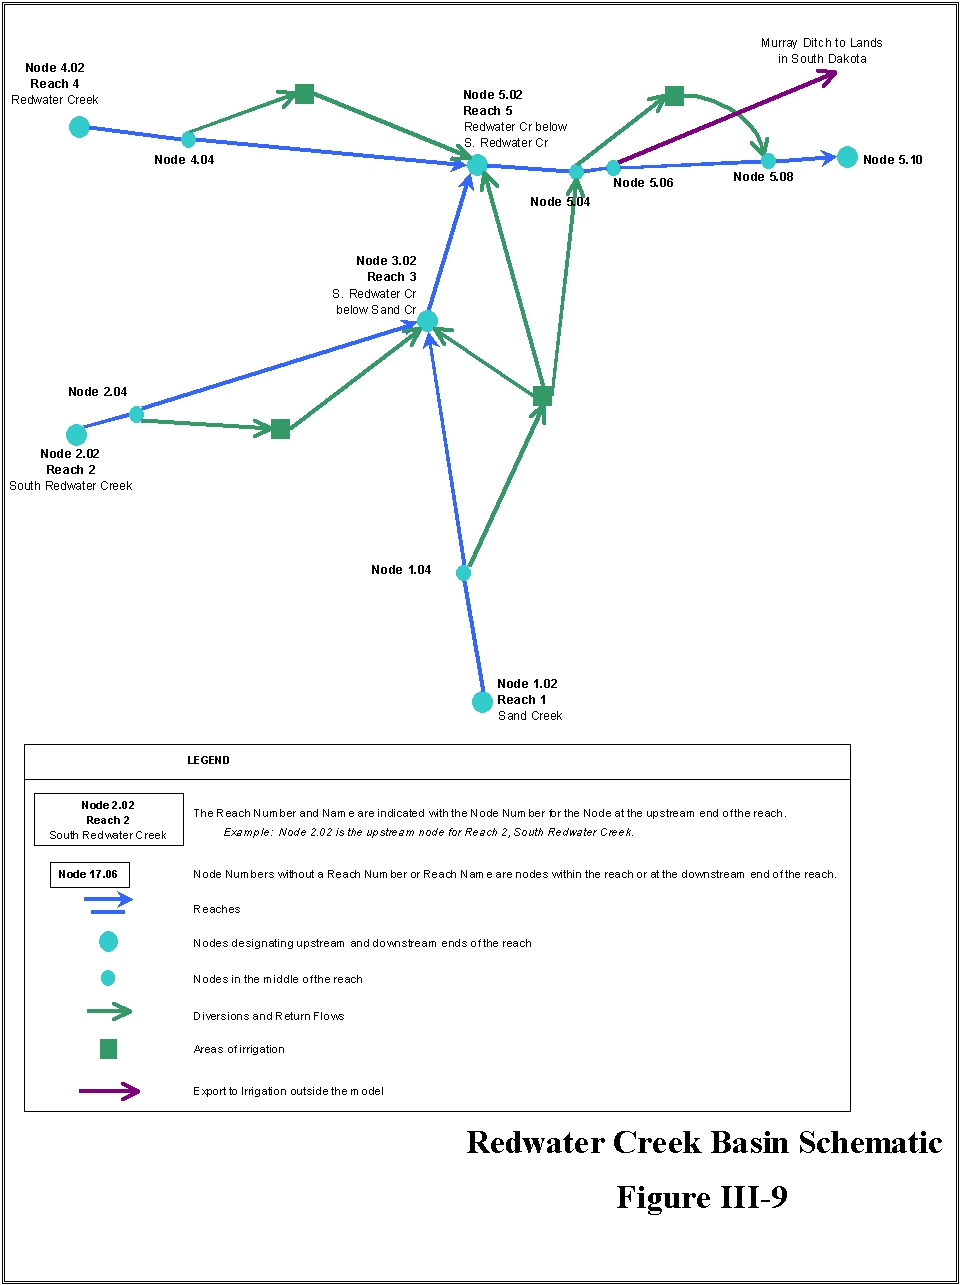
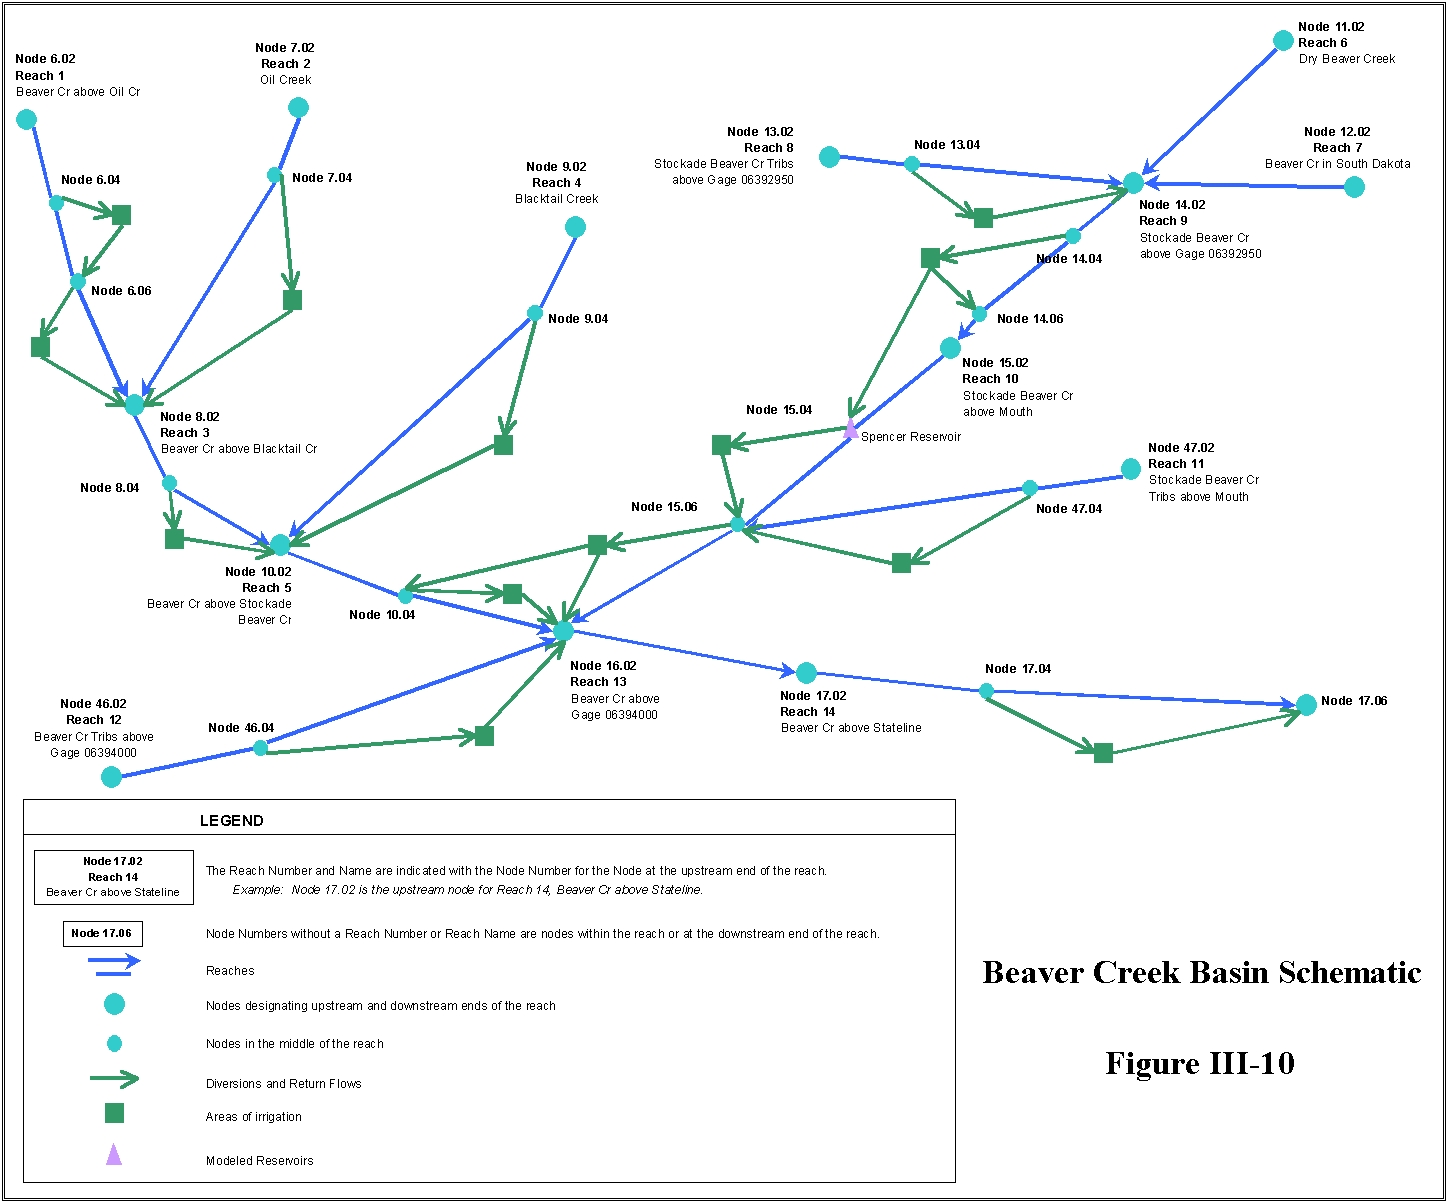
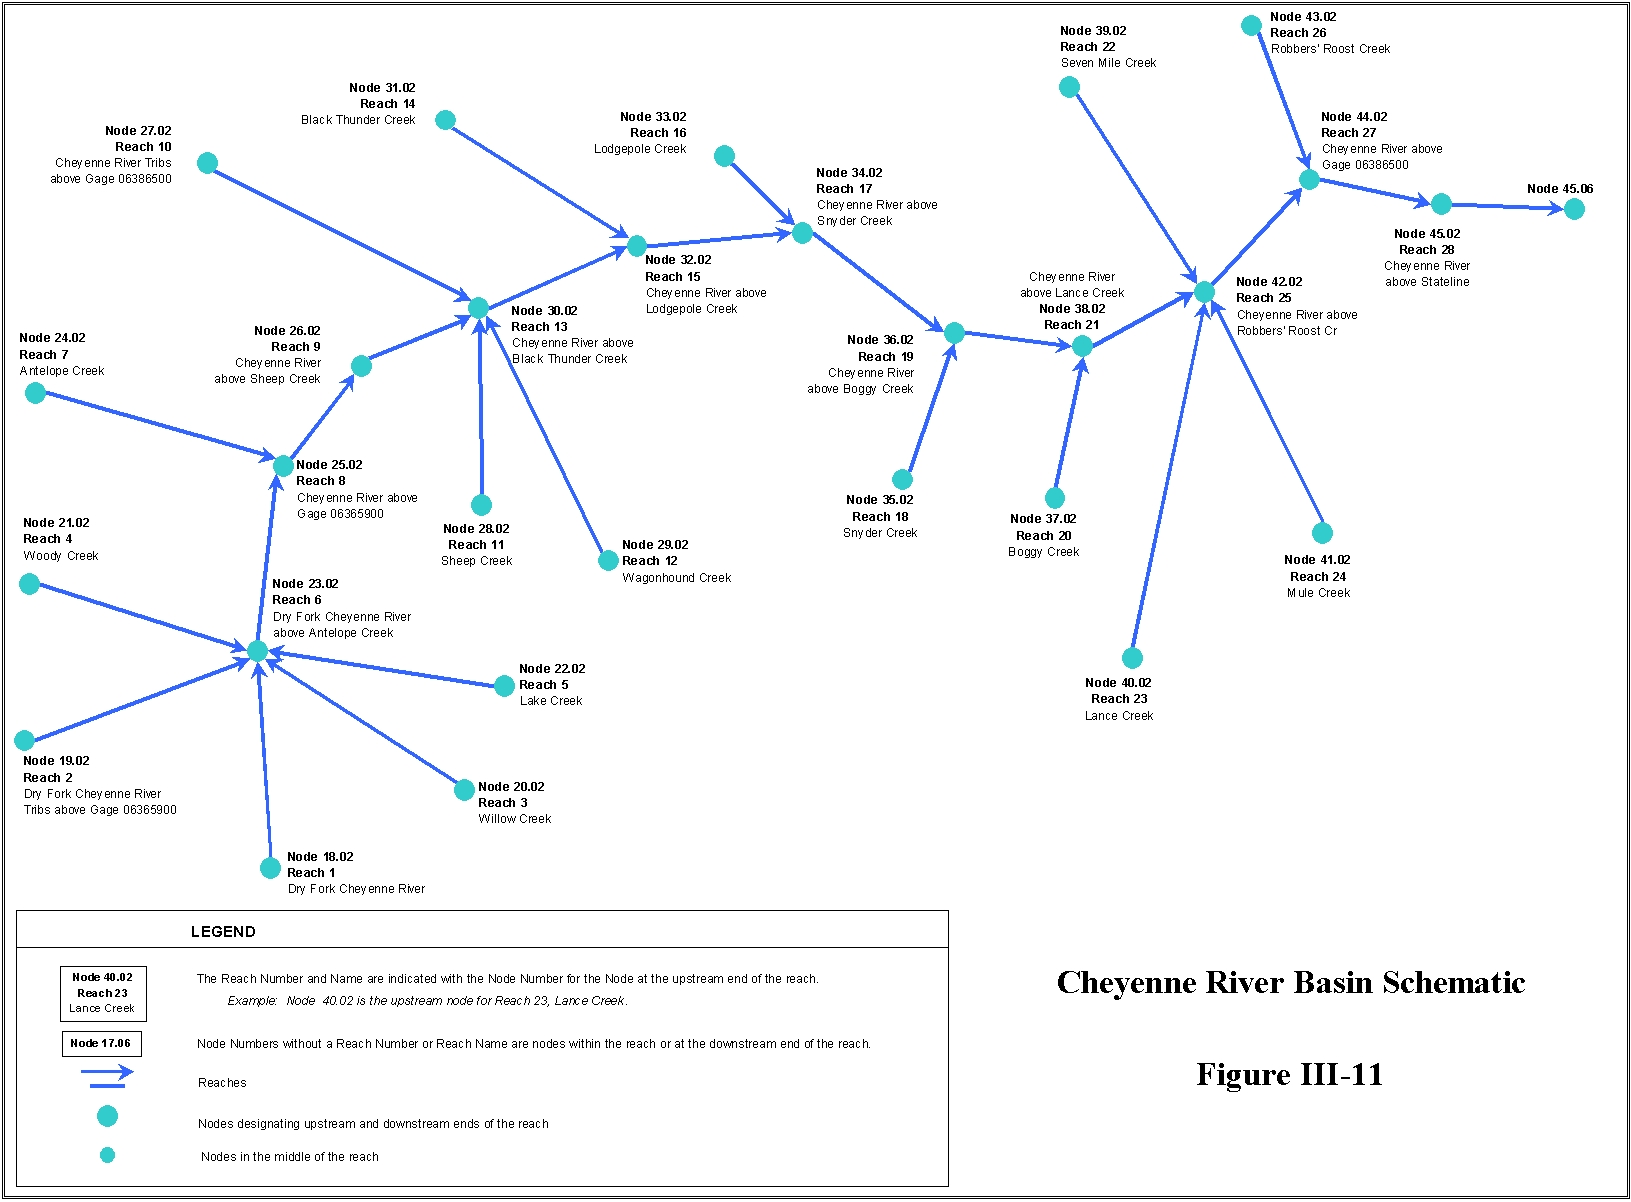
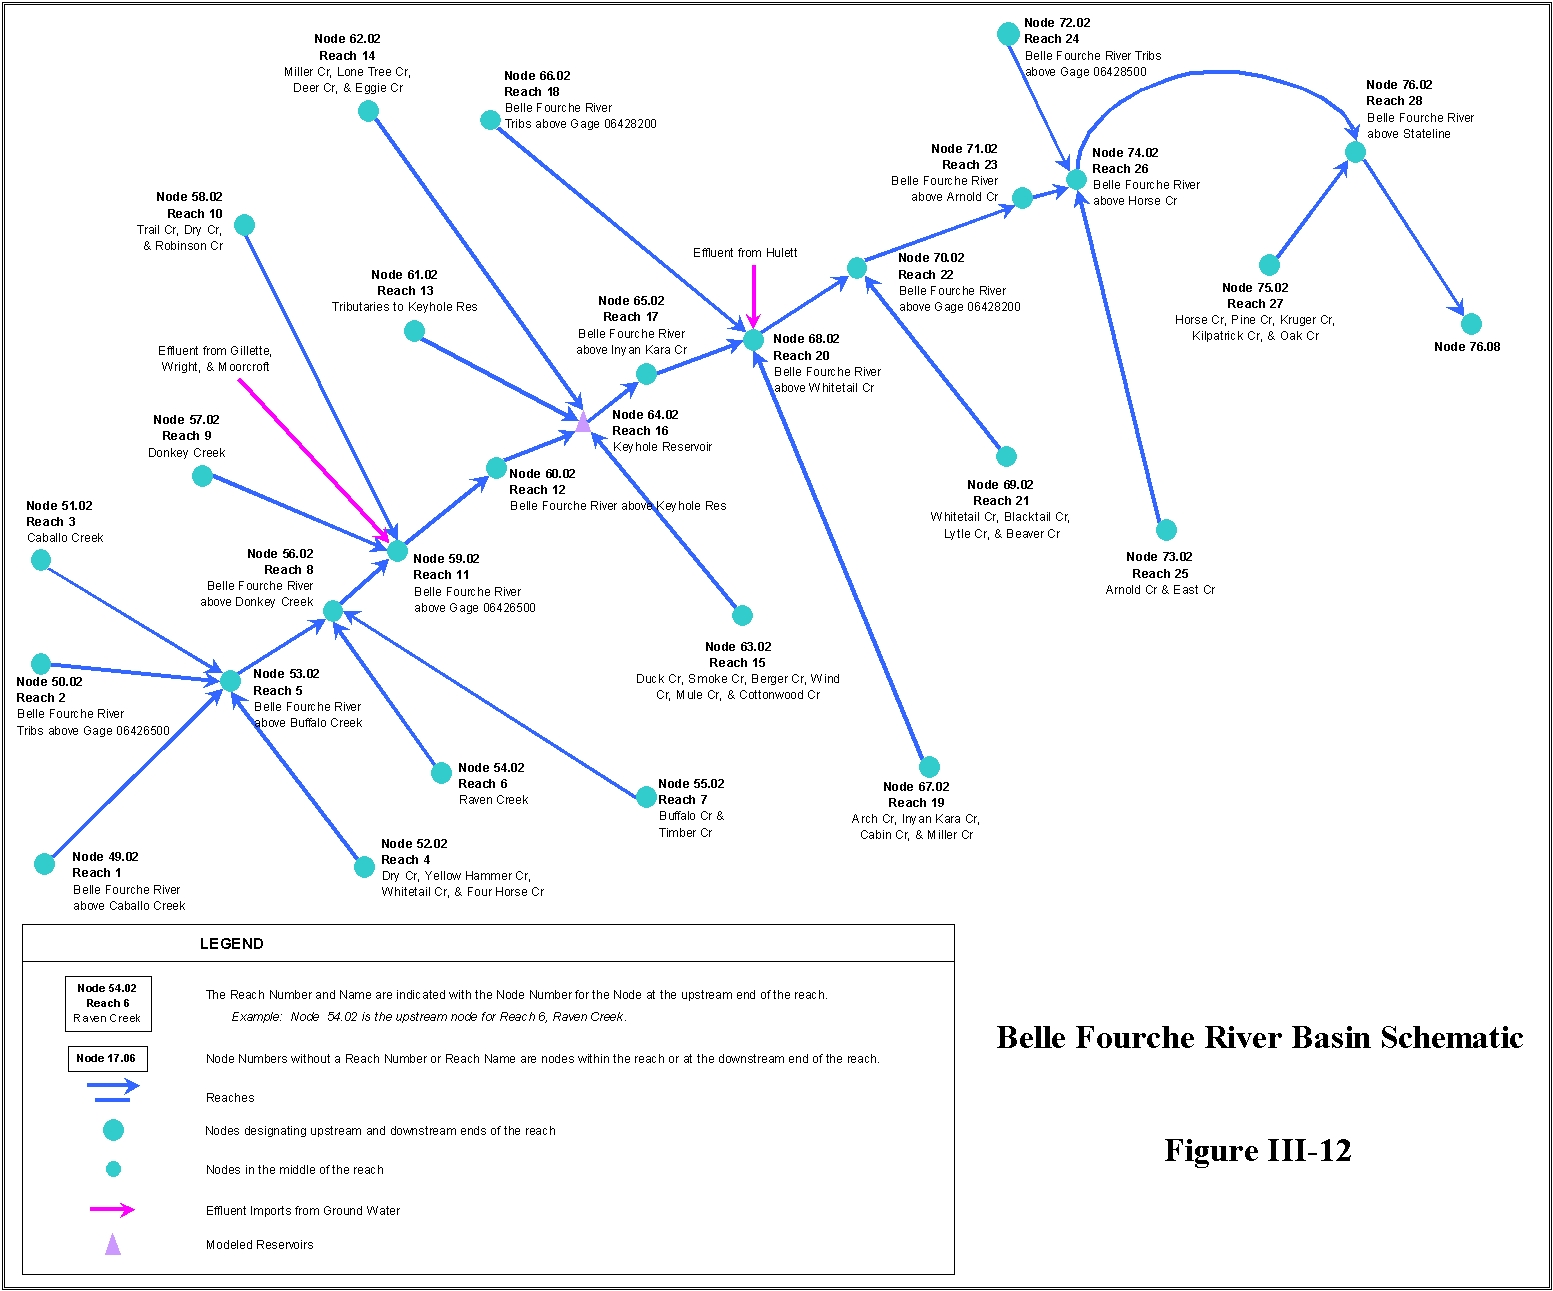
To mathematically represent each sub-basin, the river system was divided into reaches based primarily upon the location of major tributary confluences. Each reach was then sub-divided by identifying a series of individual nodes representing diversions, reservoirs, tributary confluences, gages, or other significant water resources features. The resulting network is a simplified representation of actual conditions. For example, the Belle Fourche River model consists of reaches with tributaries grouped together. Figures III-9 through III-12 present node diagrams of the sub-basin models developed for the planning area.
Historical or virgin flow for each month is supplied to the model at the uppermost node. Where available, upper basin gages were selected as the uppermost model nodes; in their absence, flow at the ungaged headwater point was estimated as discussed in a preceding section. For each reach, incremental stream gains (e.g., ungaged tributaries, ground water inflow, and inflow resulting from man-induced but unmodeled processes) and losses (e.g. seepage, evaporation, and unspecified diversions) are computed by the spreadsheet. These are calculated by adding the net modeled effects (diversions and increases in storage less return flows and decreases in storage) within the basin back into the difference between the upstream and downstream historical gage flows.
At each node, a water budget computation is completed to determine the amount of water that bypasses the node. At non-storage nodes, the difference between inflow, including upstream inflows, return flows, imports and basin gains, and outflows, including diversions, basin losses and exports, is the amount of flow available to the next node downstream. For storage nodes, an additional loss calculation for evaporation and the change in storage is evaluated. Also at storage nodes, any uncontrolled spill that occurs is added to the scheduled release to determine total outflow. Diverted amounts at diversion nodes are the minimum of demand (the full supply diversion at the structure) and physically available streamflow. The mass balance, or water budget calculations, is performed for all nodes in a reach.
Model output includes the full-supply diversion demand and model simulated diversions at each of the diversion points, and streamflow at each of the Powder/Tongue River sub- basin model nodes. Estimates of impacts associated with various water projects can be analyzed by changing input data, as decreases in available streamflow or as changes to diversions occur. New storage projects that alter the timing of streamflows or shortages may also be evaluated.
Model Development and Structure
The model was developed using Microsoft® Excel 97. The workbooks contain macros written in the Microsoft® Visual Basic for Applications programming language. The primary function of the macros is to facilitate navigation within the workbook.
Each of the Powder/Tongue River sub-basin models is a workbook consisting of numerous individual pages (worksheets). Each worksheet is a component of the model and completes a specific task required for execution of the model. There are five basic types of worksheets:
Determination of Available Surface Water
The estimated amount of water flowing through each of the various model reaches, as previously described, provides the primary basis for determining how much water is physically available for future development. Reaches are typically defined by gages or confluences, and represent tributary basins or subsections of the mainstem. A Reach Outflow worksheet is provided in each model, summarizing the monthly flow at the downstream end of each reach. The information provided in these summaries is used for this analysis.
While simulated flow at the reach terminus indicates the estimated amount of water physically present, it does not fully reflect availability. Downstream demands relying on the water physically available at any given location must first be accounted for. These downstream demands fall into three general categories:
To determine how much of the physical supply is actually available in excess of existing demands, "available flow" at each reach terminus is defined as the minimum of the physically available flow at that point, and the "available flow" at all downstream reaches. Thus available flow must be defined first at the most downstream point, with upstream availability calculated in stream order. These calculations are made on a monthly basis, and annual water availability is computed as the sum of monthly values.
Instream Flow Constraints
Instream flow rights exert a demand on the river but do not affect physical supply, because the water is not removed from the stream. Sufficient flow must be bypassed through upstream reaches to satisfy downstream instream flow requirements. The available flow for reaches located upstream from permitted instream flows are determined as the minimum of physical flow at that point, and available flow in excess of existing diversion demands less the instream flow requirement at the downstream reach.
There is only one permitted instream flow right in the planning area for a 2.5-mile reach of Sand Creek in the Redwater Creek drainage. The available flow in Reach 1 of the Redwater Creek sub-basin was calculated taking this instream flow demand into consideration.
The reach by reach results of the monthly available flow determination, accounting for the instream flow constraints, are provided in Tables III-10 through III-21 for each of the four sub-basins and for each of the three hydrologic conditions (wet, normal, and dry years). The total annual available flow is summarized in Table III-22 for each sub-basin and hydrologic condition. The locations of these available flows are also shown graphically on Figures III-13 through III-16 for the limiting dry year conditions.
Table III-10
Available Flow for Redwater Creek Basin (Acre-Feet) -
Wet Year Hydrologic Conditions
| Reach | Reach Name | Jan | Feb | Mar | Apr | May | Jun | Jul | Aug | Sep | Oct | Nov | Dec | Annual |
| 1 | Sand Creek 1 | 484 | 478 | 643 | 865 | 1,808 | 2,087 | 1,381 | 1,382 | 946 | 495 | 347 | 247 | 10,680 |
| 2 | South Redwater Creek | 632 | 588 | 701 | 762 | 1,158 | 1,192 | 833 | 862 | 672 | 689 | 688 | 663 | 8,808 |
| 3 | S Redwater Cr below Sand Cr | 2,137 | 1,980 | 2,341 | 2,586 | 4,108 | 4,374 | 2,946 | 2,981 | 2,558 | 2,308 | 2,236 | 2,190 | 30,607 |
| 4 | Redwater Creek | 321 | 299 | 356 | 365 | 504 | 398 | 159 | 204 | 172 | 338 | 331 | 327 | 3,453 |
| 5 | Redwater Cr beow S Redwater Cr | 2,498 | 2,317 | 2,718 | 3,012 | 4,712 | 4,772 | 3,104 | 3,185 | 2,730 | 2,646 | 2,567 | 2,517 | 34,279 |
Note: 1Coinstrained by Instream Flow Rights of 16 cfs (January 1 - April 30), 18 cfs (May 1 - October 31), and 21 cfs (November 1 - December 31).
Table III-11
Available Flow for Redwater Creek Basin (Acre-Feet) -
Normal Year Hydrologic Conditions
| Reach | Reach Name | Jan | Feb | Mar | Apr | May | Jun | Jul | Aug | Sep | Oct | Nov | Dec | Annual |
| 1 | Sand Creek 1 | 244 | 270 | 379 | 494 | 1,462 | 1,126 | 836 | 839 | 565 | 238 | 40 | 0 | 6,249 |
| 2 | South Redwater Creek | 529 | 499 | 587 | 592 | 992 | 717 | 568 | 602 | 500 | 577 | 556 | 549 | 6,738 |
| 3 | S Redwater Cr below Sand Cr | 1,737 | 1,685 | 1,964 | 2,048 | 3,603 | 2,956 | 2,128 | 2,117 | 2,022 | 1,874 | 1,804 | 1,776 | 23,977 |
| 4 | Redwater Creek | 259 | 253 | 298 | 274 | 401 | 121 | 8 | 50 | 74 | 269 | 264 | 263 | 2,274 |
| 5 | Redwater Cr beow S Redwater Cr | 1,996 | 1,976 | 2,280 | 2,386 | 4,025 | 3,077 | 2,135 | 2,167 | 2,096 | 2,143 | 2,063 | 2,038 | 26,391 |
Note: 1Coinstrained by Instream Flow Rights of 16 cfs (January 1 - April 30), 18 cfs (May 1 - October 31), and 21 cfs (November 1 - December 31).
Table III-12
Available Flow for Redwater Creek Basin (Acre-Feet) -
Dry Year Hydrologic Conditions
| Reach | Reach Name | Jan | Feb | Mar | Apr | May | Jun | Jul | Aug | Sep | Oct | Nov | Dec | Annual |
| 1 | Sand Creek 1 | 52 | 18 | 3 | 59 | 287 | 335 | 248 | 202 | 152 | 0 | 0 | 0 | 1,303 |
| 2 | South Redwater Creek | 446 | 390 | 425 | 391 | 420 | 362 | 315 | 355 | 306 | 445 | 461 | 458 | 4,329 |
| 3 | S Redwater Cr below Sand Cr | 1,343 | 1,216 | 1,426 | 1,417 | 1,673 | 1,671 | 1,441 | 1,538 | 1,577 | 1,285 | 1,411 | 1,379 | 16,034 |
| 4 | Redwater Creek | 200 | 182 | 216 | 153 | 27 | 0 | 0 | 0 | 0 | 180 | 204 | 203 | 1,164 |
| 5 | Redwater Cr beow S Redwater Cr | 1,543 | 1,398 | 1,642 | 1,665 | 1,700 | 1,671 | 1,441 | 1,538 | 1,577 | 1,465 | 1,615 | 1,582 | 17,293 |
Note: 1Coinstrained by Instream Flow Rights of 16 cfs (January 1 - April 30), 18 cfs (May 1 - October 31), and 21 cfs (November 1 - December 31).
Table III-13
Available Flow for Beaver Creek Basin (Acre-Feet) -
Wet Year Hydrologic Conditions
| Reach | Reach Name | Jan | Feb | Mar | Apr | May | Jun | Jul | Aug | Sep | Oct | Nov | Dec | Annual |
| 1 | Beaver Cr above Oil Cr | 33 | 635 | 1,752 | 0 | 1,011 | 0 | 50 | 5 | 0 | 73 | 36 | 22 | 3,585 |
| 2 | Oil Creek | 71 | 2,281 | 3,700 | 1,887 | 1,348 | 0 | 0 | 1,245 | 0 | 118 | 0 | 0 | 10,578 |
| 3 | Beaver Cr above Blacktail Cr | 149 | 2,916 | 5,452 | 1,971 | 2,359 | 176 | 184 | 1,250 | 53 | 204 | 172 | 99 | 14,836 |
| 4 | Blacktail Cr | 159 | 209 | 131 | 340 | 166 | 727 | 351 | 31 | 130 | 95 | 148 | 152 | 2,480 |
| 5 | Beaver Cr above Stockdale Beaver Cr | 308 | 3,125 | 5,583 | 2,311 | 2,525 | 903 | 535 | 1,281 | 183 | 299 | 320 | 251 | 17,317 |
| 6 | Dry Beaver Creek | 117 | 139 | 203 | 194 | 79 | 137 | 143 | 3 | 49 | 72 | 108 | 99 | 1,226 |
| 7 | Beaver Cr in South Dakota | 116 | 138 | 201 | 192 | 79 | 136 | 141 | 3 | 49 | 72 | 107 | 98 | 1,214 |
| 8 | Stockdale Beaver Cr Tribs above Gage 06392950 | 415 | 429 | 649 | 495 | 292 | 416 | 423 | 9 | 161 | 262 | 389 | 382 | 3,907 |
| 9 | Stockdale Beaver Cr above Gage 06392950 | 648 | 739 | 1,075 | 880 | 451 | 689 | 707 | 15 | 259 | 407 | 604 | 578 | 6,403 |
| 10 | Stockdale Beaver Cr above Mouth | 648 | 1,373 | 1,288 | 880 | 451 | 1,175 | 707 | 15 | 259 | 407 | 604 | 587 | 7,737 |
| 11 | Stockdale Beaver Cr Tribs above Mouth | 10 | 438 | 1,251 | 0 | 667 | 0 | 49 | 0 | 0 | 9 | 0 | 0 | 2,414 |
| 12 | Beaver Cr Tribs above Gage 06394000 | 6 | 282 | 804 | 0 | 396 | 0 | 16 | 0 | 0 | 1 | 0 | 0 | 1,499 |
| 13 | Beaver Cr above Gage 06394000 | 972 | 5,219 | 8,927 | 3,822 | 4,038 | 2,079 | 1,308 | 1,296 | 422 | 715 | 924 | 829 | 29,599 |
| 14 | Beaver Cr above Stateline | 977 | 5,221 | 8,929 | 3,822 | 4,038 | 2,079 | 1,308 | 1,296 | 422 | 727 | 936 | 836 | 29,635 |
Table III-14
Available Flow for Beaver Creek Basin (Acre-Feet) -
Normal Year Hydrologic Conditions
| Reach | Reach Name | Jan | Feb | Mar | Apr | May | Jun | Jul | Aug | Sep | Oct | Nov | Dec | Annual |
| 1 | Beaver Cr above Oil Cr | 16 | 79 | 399 | 0 | 132 | 0 | 0 | 0 | 0 | 12 | 17 | 8 | 647 |
| 2 | Oil Creek | 49 | 1,320 | 4,532 | 0 | 2,591 | 0 | 0 | 437 | 0 | 178 | 0 | 0 | 9,057 |
| 3 | Beaver Cr above Blacktail Cr | 118 | 1,399 | 4,931 | 25 | 2,963 | 135 | 182 | 696 | 55 | 189 | 145 | 104 | 10,822 |
| 4 | Blacktail Cr | 135 | 40 | 136 | 475 | 311 | 865 | 482 | 115 | 157 | 64 | 127 | 149 | 2,921 |
| 5 | Beaver Cr above Stockdale Beaver Cr | 253 | 1,439 | 5,067 | 502 | 3,333 | 999 | 664 | 811 | 212 | 253 | 271 | 253 | 13,805 |
| 6 | Dry Beaver Creek | 93 | 15 | 63 | 159 | 48 | 116 | 117 | 0 | 29 | 48 | 82 | 103 | 779 |
| 7 | Beaver Cr in South Dakota | 92 | 15 | 62 | 157 | 48 | 115 | 115 | 0 | 29 | 47 | 81 | 102 | 772 |
| 8 | Stockdale Beaver Cr Tribs above Gage 06392950 | 369 | 51 | 208 | 424 | 199 | 411 | 396 | 0 | 90 | 172 | 328 | 387 | 2,667 |
| 9 | Stockdale Beaver Cr above Gage 06392950 | 554 | 81 | 333 | 746 | 295 | 642 | 628 | 0 | 148 | 267 | 492 | 592 | 4,224 |
| 10 | Stockdale Beaver Cr above Mouth | 554 | 81 | 333 | 977 | 295 | 1,135 | 893 | 0 | 148 | 267 | 492 | 592 | 5,213 |
| 11 | Stockdale Beaver Cr Tribs above Mouth | 5 | 55 | 284 | 0 | 113 | 0 | 0 | 0 | 0 | 0 | 0 | 0 | 452 |
| 12 | Beaver Cr Tribs above Gage 06394000 | 3 | 35 | 183 | 0 | 39 | 0 | 0 | 0 | 0 | 0 | 0 | 0 | 257 |
| 13 | Beaver Cr above Gage 06394000 | 815 | 1,610 | 5,867 | 1,824 | 4,129 | 2,134 | 1,557 | 811 | 360 | 520 | 763 | 846 | 20,421 |
| 14 | Beaver Cr above Stateline | 821 | 1,614 | 5,870 | 1,824 | 4,129 | 2,134 | 1,557 | 811 | 360 | 536 | 779 | 855 | 20,468 |
Table III-15
Available Flow for Beaver Creek Basin (Acre-Feet) -
Dry Year Hydrologic Conditions
| Reach | Reach Name | Jan | Feb | Mar | Apr | May | Jun | Jul | Aug | Sep | Oct | Nov | Dec | Annual |
| 1 | Beaver Cr above Oil Cr | 2 | 14 | 9 | 0 | 0 | 0 | 0 | 0 | 0 | 0 | 3 | 2 | 28 |
| 2 | Oil Creek | 63 | 625 | 3,045 | 0 | 953 | 0 | 0 | 0 | 0 | 95 | 0 | 0 | 4,718 |
| 3 | Beaver Cr above Blacktail Cr | 78 | 639 | 3,054 | 38 | 953 | 298 | 337 | 310 | 144 | 95 | 127 | 55 | 6,050 |
| 4 | Blacktail Cr | 127 | 57 | 97 | 572 | 113 | 915 | 717 | 139 | 225 | 46 | 115 | 137 | 3,134 |
| 5 | Beaver Cr above Stockdale Beaver Cr | 205 | 697 | 3,152 | 626 | 1,066 | 1,212 | 1,106 | 590 | 368 | 142 | 242 | 192 | 9,393 |
| 6 | Dry Beaver Creek | 56 | 6 | 5 | 91 | 41 | 94 | 55 | 63 | 0 | 28 | 65 | 61 | 509 |
| 7 | Beaver Cr in South Dakota | 56 | 6 | 5 | 90 | 41 | 94 | 54 | 62 | 0 | 28 | 64 | 60 | 504 |
| 8 | Stockdale Beaver Cr Tribs above Gage 06392950 | 424 | 32 | 30 | 467 | 221 | 300 | 209 | 254 | 0 | 165 | 391 | 427 | 2,496 |
| 9 | Stockdale Beaver Cr above Gage 06392950 | 536 | 43 | 41 | 648 | 304 | 488 | 317 | 379 | 0 | 221 | 520 | 548 | 3,509 |
| 10 | Stockdale Beaver Cr above Mouth | 536 | 43 | 41 | 933 | 304 | 488 | 317 | 379 | 0 | 221 | 520 | 548 | 3,794 |
| 11 | Stockdale Beaver Cr Tribs above Mouth | 0 | 10 | 6 | 0 | 0 | 0 | 0 | 0 | 0 | 0 | 0 | 0 | 16 |
| 12 | Beaver Cr Tribs above Gage 06394000 | 0 | 6 | 4 | 0 | 0 | 0 | 0 | 0 | 0 | 0 | 0 | 0 | 10 |
| 13 | Beaver Cr above Gage 06394000 | 741 | 756 | 3,202 | 1,887 | 1,370 | 1,701 | 1,424 | 1,162 | 368 | 363 | 762 | 740 | 13,734 |
| 14 | Beaver Cr above Stateline | 746 | 759 | 3,205 | 1,887 | 1,370 | 1,701 | 1,424 | 1,162 | 368 | 377 | 777 | 749 | 13,778 |
Table III-16
Available Flow for Cheyenne River Basin (Acre-Feet) -
Wet Year Hydrologic Conditions
| Reach | Reach Name | Jan | Feb | Mar | Apr | May | Jun | Jul | Aug | Sep | Oct | Nov | Dec | Annual |
| 1 | Dry Fork Cheyenne River | 8 | 35 | 9 | 118 | 1,354 | 287 | 113 | 9 | 0 | 7 | 22 | 13 | 1,967 |
| 2 | Dry Fork Cheyenne River Tribs above Gage 06365900 | 8 | 167 | 102 | 0 | 1,062 | 0 | 0 | 0 | 0 | 9 | 0 | 0 | 1,341 |
| 3 | Willow Creek | 3 | 62 | 38 | 13 | 518 | 18 | 30 | 15 | 0 | 10 | 0 | 0 | 704 |
| 4 | Woody Creek | 0 | 8 | 5 | 0 | 0 | 0 | 0 | 0 | 0 | 0 | 0 | 0 | 13 |
| 5 | Lake Creek | 1 | 19 | 12 | 4 | 157 | 5 | 9 | 5 | 0 | 3 | 0 | 0 | 213 |
| 6 | Dry Fork Cheyenne River above Antelope Cr | 20 | 292 | 166 | 141 | 3,237 | 384 | 152 | 29 | 9 | 37 | 35 | 18 | 4,501 |
| 7 | Antelope Creek | 25 | 122 | 37 | 1,148 | 11,263 | 7,410 | 756 | 81 | 69 | 174 | 338 | 28 | 21,427 |
| 8 | Cheyenne River above Gage 06365900 | 46 | 414 | 203 | 1,289 | 14,535 | 7,795 | 908 | 110 | 77 | 211 | 378 | 46 | 25,968 |
| 9 | Cheyenne River above Sheep Cr | 148 | 489 | 203 | 1,756 | 19,607 | 13,390 | 908 | 110 | 222 | 211 | 378 | 46 | 37,321 |
| 10 | Cheyenne River Tribs above Gage 06386500 | 46 | 461 | 473 | 0 | 1,046 | 0 | 0 | 0 | 0 | 0 | 0 | 0 | 1,980 |
| 11 | Sheep Creek | 1 | 9 | 10 | 0 | 0 | 0 | 0 | 0 | 0 | 0 | 0 | 0 | 19 |
| 12 | Wagonhound Creek | 2 | 20 | 20 | 0 | 20 | 0 | 0 | 0 | 0 | 0 | 0 | 0 | 60 |
| 13 | Cheyenne River above Black Thunder Cr | 224 | 996 | 707 | 1,756 | 20,862 | 13,390 | 908 | 110 | 222 | 211 | 378 | 84 | 39,624 |
| 14 | Black Thunder Creek | 375 | 888 | 369 | 680 | 7,434 | 1,540 | 595 | 134 | 4,195 | 228 | 15 | 0 | 16,078 |
| 15 | Cheyenne River above Lodgepole Cr | 612 | 1,891 | 1,075 | 2,436 | 28,332 | 14,929 | 1,504 | 244 | 4,417 | 439 | 393 | 85 | 55,745 |
| 16 | Lodgepole Creek | 3 | 4 | 17 | 91 | 834 | 294 | 24 | 1 | 0 | 0 | 2 | 1 | 1,268 |
| 17 | Cheyenne River above Snyder Cr | 616 | 1,896 | 1,092 | 2,527 | 29,165 | 15,223 | 1,528 | 245 | 4,417 | 439 | 395 | 86 | 57,013 |
| 18 | Snyder Cr | 9 | 91 | 94 | 0 | 289 | 0 | 0 | 0 | 0 | 0 | 0 | 0 | 474 |
| 19 | Cheyenne River above Boggy Cr | 635 | 1,993 | 1,185 | 2,527 | 29,461 | 15,223 | 1,528 | 245 | 4,417 | 439 | 395 | 86 | 57,500 |
| 20 | Boggy Creek | 3 | 25 | 26 | 0 | 71 | 0 | 0 | 0 | 0 | 0 | 0 | 0 | 122 |
| 21 | Cheyenne River above Lance Cr | 638 | 2,018 | 1,211 | 2,527 | 29,532 | 15,223 | 1,528 | 245 | 4,417 | 439 | 395 | 86 | 57,621 |
| 22 | Seven Mile Creek | 1 | 12 | 12 | 0 | 41 | 0 | 0 | 0 | 0 | 0 | 0 | 0 | 65 |
| 23 | Lance Creek | 1,233 | 1,170 | 479 | 2,596 | 24,203 | 9,777 | 2,987 | 845 | 2,594 | 119 | 79 | 59 | 44,909 |
| 24 | Mule Creek | 4 | 39 | 40 | 0 | 0 | 0 | 0 | 0 | 0 | 0 | 0 | 0 | 80 |
| 25 | Cheyenne River above Robbers' Roost Cr | 1,876 | 3,240 | 1,742 | 5,123 | 53,775 | 25,000 | 4,514 | 1,091 | 7,012 | 559 | 474 | 144 | 102,675 |
| 26 | Robbers' Roost Creek | 6 | 56 | 57 | 0 | 26 | 0 | 0 | 0 | 0 | 0 | 0 | 0 | 138 |
| 27 | Cheyenne River above Gage 06386500 | 2,078 | 3,418 | 1,800 | 5,123 | 54,135 | 25,000 | 4,514 | 1,091 | 7,012 | 559 | 474 | 144 | 103,270 |
| 28 | Cheyenne River above above Stateline | 2,084 | 3,422 | 1,801 | 5,125 | 54,140 | 25,002 | 4,517 | 1,094 | 7,030 | 586 | 490 | 154 | 103,362 |
Table III-17
Available Flow for Cheyenne River Basin (Acre-Feet) -
Normal Year Hydrologic Conditions
| Reach | Reach Name | Jan | Feb | Mar | Apr | May | Jun | Jul | Aug | Sep | Oct | Nov | Dec | Annual |
| 1 | Dry Fork Cheyenne River | 2 | 6 | 3 | 30 | 106 | 42 | 26 | 3 | 0 | 2 | 5 | 5 | 244 |
| 2 | Dry Fork Cheyenne River Tribs above Gage 06365900 | 9 | 108 | 55 | 0 | 0 | 0 | 0 | 0 | 0 | 20 | 0 | 0 | 183 |
| 3 | Willow Creek | 3 | 40 | 21 | 10 | 97 | 6 | 18 | 15 | 0 | 11 | 0 | 0 | 225 |
| 4 | Woody Creek | 0 | 5 | 3 | 0 | 0 | 0 | 0 | 0 | 0 | 0 | 0 | 0 | 8 |
| 5 | Lake Creek | 1 | 12 | 6 | 3 | 29 | 2 | 5 | 4 | 0 | 3 | 0 | 0 | 68 |
| 6 | Dry Fork Cheyenne River above Antelope Cr | 16 | 171 | 88 | 44 | 335 | 88 | 50 | 22 | 5 | 41 | 7 | 8 | 860 |
| 7 | Antelope Creek | 18 | 83 | 72 | 530 | 573 | 1,032 | 355 | 69 | 45 | 50 | 13 | 16 | 2,837 |
| 8 | Cheyenne River above Gage 06365900 | 35 | 254 | 160 | 573 | 908 | 1,120 | 405 | 90 | 50 | 91 | 20 | 23 | 3,696 |
| 9 | Cheyenne River above Sheep Cr | 57 | 254 | 160 | 573 | 2,589 | 1,922 | 405 | 90 | 128 | 91 | 20 | 23 | 6,341 |
| 10 | Cheyenne River Tribs above Gage 06386500 | 27 | 225 | 174 | 0 | 0 | 0 | 0 | 0 | 0 | 0 | 0 | 0 | 399 |
| 11 | Sheep Creek | 1 | 5 | 4 | 0 | 0 | 0 | 0 | 0 | 0 | 0 | 0 | 0 | 8 |
| 12 | Wagonhound Creek | 1 | 10 | 7 | 0 | 0 | 0 | 0 | 0 | 0 | 0 | 0 | 0 | 17 |
| 13 | Cheyenne River above Black Thunder Cr | 113 | 493 | 345 | 573 | 2,821 | 1,922 | 405 | 90 | 128 | 91 | 95 | 26 | 7,074 |
| 14 | Black Thunder Creek | 44 | 97 | 126 | 196 | 2,696 | 903 | 53 | 16 | 834 | 69 | 12 | 0 | 5,120 |
| 15 | Cheyenne River above Lodgepole Cr | 169 | 590 | 471 | 769 | 5,568 | 2,825 | 458 | 106 | 962 | 160 | 107 | 26 | 12,193 |
| 16 | Lodgepole Creek | 1 | 1 | 8 | 8 | 368 | 80 | 0 | 0 | 0 | 0 | 1 | 0 | 480 |
| 17 | Cheyenne River above Snyder Cr | 170 | 591 | 479 | 777 | 5,936 | 2,905 | 458 | 106 | 962 | 160 | 108 | 27 | 12,674 |
| 18 | Snyder Cr | 5 | 44 | 34 | 0 | 101 | 0 | 0 | 0 | 0 | 0 | 0 | 0 | 187 |
| 19 | Cheyenne River above Boggy Cr | 186 | 635 | 513 | 777 | 6,074 | 2,905 | 458 | 106 | 962 | 160 | 108 | 27 | 12,861 |
| 20 | Boggy Creek | 1 | 12 | 9 | 0 | 11 | 0 | 0 | 0 | 0 | 0 | 0 | 0 | 34 |
| 21 | Cheyenne River above Lance Cr | 188 | 646 | 522 | 777 | 6,085 | 2,905 | 458 | 106 | 962 | 160 | 108 | 27 | 12,895 |
| 22 | Seven Mile Creek | 1 | 6 | 5 | 0 | 18 | 0 | 0 | 0 | 0 | 0 | 0 | 0 | 29 |
| 23 | Lance Creek | 332 | 498 | 186 | 756 | 8,465 | 3,984 | 1,480 | 405 | 2,363 | 26 | 51 | 22 | 18,323 |
| 24 | Mule Creek | 2 | 19 | 15 | 0 | 0 | 0 | 0 | 0 | 0 | 0 | 0 | 0 | 33 |
| 25 | Cheyenne River above Robbers' Roost Cr | 523 | 1,169 | 727 | 1,534 | 14,567 | 6,889 | 1,938 | 511 | 3,325 | 186 | 159 | 48 | 31,280 |
| 26 | Robbers' Roost Creek | 3 | 26 | 21 | 0 | 0 | 0 | 0 | 0 | 0 | 0 | 0 | 0 | 47 |
| 27 | Cheyenne River above Gage 06386500 | 695 | 1,196 | 748 | 1,534 | 14,793 | 6,889 | 1,938 | 511 | 3,325 | 186 | 159 | 48 | 31,328 |
| 28 | Cheyenne River above above Stateline | 702 | 1,200 | 750 | 1,538 | 14,800 | 6,894 | 1,944 | 518 | 3,344 | 216 | 177 | 59 | 31,434 |
Table III-18
Available Flow for Cheyenne River Basin (Acre-Feet) -
Dry Year Hydrologic Conditions
| Reach | Reach Name | Jan | Feb | Mar | Apr | May | Jun | Jul | Aug | Sep | Oct | Nov | Dec | Annual |
| 1 | Dry Fork Cheyenne River | 0 | 2 | 2 | 6 | 1 | 0 | 6 | 0 | 0 | 0 | 1 | 1 | 24 |
| 2 | Dry Fork Cheyenne River Tribs above Gage 06365900 | 1 | 19 | 26 | 0 | 0 | 0 | 0 | 0 | 0 | 0 | 0 | 0 | 44 |
| 3 | Willow Creek | 0 | 7 | 10 | 1 | 33 | 7 | 1 | 2 | 0 | 1 | 0 | 0 | 60 |
| 4 | Woody Creek | 0 | 1 | 1 | 0 | 0 | 0 | 0 | 0 | 0 | 0 | 0 | 0 | 2 |
| 5 | Lake Creek | 0 | 2 | 3 | 0 | 10 | 2 | 0 | 0 | 0 | 0 | 0 | 0 | 18 |
| 6 | Dry Fork Cheyenne River above Antelope Cr | 2 | 31 | 42 | 7 | 44 | 9 | 7 | 2 | 4 | 8 | 2 | 2 | 164 |
| 7 | Antelope Creek | 18 | 38 | 70 | 94 | 70 | 52 | 74 | 13 | 72 | 22 | 11 | 9 | 534 |
| 8 | Cheyenne River above Gage 06365900 | 30 | 73 | 112 | 102 | 114 | 61 | 81 | 16 | 75 | 33 | 13 | 14 | 705 |
| 9 | Cheyenne River above Sheep Cr | 30 | 73 | 112 | 102 | 138 | 61 | 81 | 16 | 75 | 33 | 13 | 14 | 707 |
| 10 | Cheyenne River Tribs above Gage 06386500 | 1 | 33 | 36 | 0 | 0 | 0 | 0 | 0 | 0 | 0 | 0 | 0 | 69 |
| 11 | Sheep Creek | 0 | 1 | 1 | 0 | 0 | 0 | 0 | 0 | 0 | 0 | 0 | 0 | 1 |
| 12 | Wagonhound Creek | 0 | 1 | 2 | 0 | 0 | 0 | 0 | 0 | 0 | 0 | 0 | 0 | 3 |
| 13 | Cheyenne River above Black Thunder Cr | 57 | 123 | 150 | 102 | 138 | 61 | 81 | 16 | 75 | 116 | 100 | 49 | 1,007 |
| 14 | Black Thunder Creek | 60 | 9 | 24 | 19 | 58 | 97 | 6 | 0 | 0 | 1 | 9 | 0 | 358 |
| 15 | Cheyenne River above Lodgepole Cr | 130 | 140 | 174 | 121 | 196 | 158 | 87 | 16 | 75 | 188 | 146 | 49 | 1,482 |
| 16 | Lodgepole Creek | 0 | 0 | 2 | 0 | 0 | 0 | 0 | 0 | 0 | 0 | 0 | 0 | 9 |
| 17 | Cheyenne River above Snyder Cr | 130 | 140 | 176 | 121 | 196 | 158 | 87 | 16 | 75 | 188 | 147 | 49 | 1,491 |
| 18 | Snyder Cr | 0 | 7 | 7 | 0 | 0 | 0 | 0 | 0 | 0 | 0 | 0 | 0 | 14 |
| 19 | Cheyenne River above Boggy Cr | 143 | 154 | 183 | 121 | 196 | 158 | 87 | 16 | 75 | 188 | 147 | 49 | 1,511 |
| 20 | Boggy Creek | 0 | 2 | 2 | 0 | 0 | 0 | 0 | 0 | 0 | 0 | 0 | 0 | 4 |
| 21 | Cheyenne River above Lance Cr | 143 | 155 | 185 | 121 | 196 | 158 | 87 | 16 | 75 | 188 | 147 | 49 | 1,515 |
| 22 | Seven Mile Creek | 0 | 1 | 1 | 0 | 0 | 0 | 0 | 0 | 0 | 0 | 0 | 0 | 2 |
| 23 | Lance Creek | 683 | 240 | 91 | 353 | 1,538 | 604 | 100 | 35 | 204 | 71 | 69 | 18 | 3,184 |
| 24 | Mule Creek | 0 | 3 | 3 | 0 | 0 | 0 | 0 | 0 | 0 | 0 | 0 | 0 | 6 |
| 25 | Cheyenne River above Robbers' Roost Cr | 826 | 399 | 279 | 473 | 1,734 | 762 | 187 | 51 | 280 | 259 | 216 | 67 | 4,706 |
| 26 | Robbers' Roost Creek | 0 | 4 | 4 | 0 | 0 | 0 | 0 | 0 | 0 | 0 | 0 | 0 | 8 |
| 27 | Cheyenne River above Gage 06386500 | 953 | 430 | 283 | 473 | 1,734 | 762 | 187 | 51 | 280 | 259 | 216 | 67 | 4,742 |
| 28 | Cheyenne River above above Stateline | 959 | 435 | 286 | 478 | 1,743 | 776 | 204 | 68 | 304 | 295 | 237 | 79 | 4,911 |
Table III-19
Available Flow for Belle Fourche River Basin (Acre-Feet) -
Wet Year Hydrologic Conditions
| Reach | Reach Name | Jan | Feb | Mar | Apr | May | Jun | Jul | Aug | Sep | Oct | Nov | Dec | Annual |
| 1 | Belle Fourche River above Caballo Cr | 43 | 44 | 212 | 253 | 732 | 1,380 | 0 | 0 | 0 | 24 | 0 | 13 | 2,658 |
| 2 | Belle Fourche River Tribs above Gage 06426500 | 5 | 34 | 182 | 0 | 101 | 0 | 0 | 0 | 0 | 10 | 0 | 0 | 328 |
| 3 | Caballo Creek | 11 | 7 | 77 | 58 | 568 | 589 | 0 | 0 | 0 | 16 | 0 | 1 | 1,316 |
| 4 | Dry Cr, Yellow Hammer CR, Whitetail CR, & Four Horse Cr | 4 | 27 | 146 | 11 | 110 | 39 | 0 | 0 | 0 | 13 | 0 | 0 | 346 |
| 5 | Belle Fourche River above Buffalo Cr | 63 | 112 | 618 | 323 | 1,511 | 2,008 | 0 | 0 | 0 | 63 | 0 | 13 | 4,648 |
| 6 | Raven Creek | 2 | 15 | 79 | 6 | 60 | 22 | 0 | 0 | 0 | 6 | 0 | 0 | 187 |
| 7 | Buffalo Cr & Timber Cr | 4 | 31 | 164 | 0 | 17 | 0 | 0 | 0 | 0 | 2 | 0 | 0 | 214 |
| 8 | Belle Fourche River above Donkey Cr | 69 | 157 | 862 | 329 | 1,588 | 2,030 | 0 | 0 | 0 | 71 | 0 | 13 | 5,049 |
| 9 | Donkey Creek | 161 | 148 | 845 | 2,063 | 1,801 | 3,402 | 0 | 0 | 0 | 68 | 0 | 44 | 8,371 |
| 10 | Trail Cr, Dry Cr, & Robinson Cr | 1 | 8 | 43 | 0 | 8 | 0 | 0 | 0 | 0 | 0 | 0 | 0 | 59 |
| 11 | Belle Fourche River above Gage 06426500 | 231 | 314 | 1,750 | 2,391 | 3,397 | 5,432 | 0 | 0 | 0 | 139 | 0 | 57 | 13,479 |
| 12 | Belle Fourche River above Keyhole Reservoir | 231 | 314 | 1,750 | 2,391 | 3,397 | 6,133 | 0 | 0 | 0 | 139 | 0 | 57 | 14,181 |
| 13 | Tribs to Keyhole Reservoir | 7 | 37 | 281 | 0 | 148 | 0 | 0 | 0 | 0 | 8 | 0 | 0 | 474 |
| 14 | Miller Cr, Lone Tree Cr, Deer Cr, & Eggie Cr | 10 | 58 | 432 | 8 | 247 | 0 | 0 | 0 | 0 | 13 | 0 | 0 | 757 |
| 15 | Duck Cr, Smoke Cr, Berger Cr, Wind Cr, Mule Cr, & Cottonwood Cr | 17 | 99 | 740 | 20 | 438 | 0 | 0 | 0 | 0 | 22 | 0 | 0 | 1,319 |
| 16 | Keyhole Reservoir | 265 | 508 | 3,202 | 2,420 | 4,230 | 6,133 | 0 | 0 | 0 | 181 | 0 | 57 | 16,731 |
| 17 | Belle Fourche River above Inyan Kara Cr | 265 | 508 | 3,202 | 2,420 | 4,230 | 6,499 | 0 | 0 | 0 | 181 | 0 | 57 | 17,096 |
| 18 | Belle Fourche River Tribs above Gage 06428200 | 247 | 531 | 2,674 | 1,552 | 2,690 | 1,771 | 0 | 0 | 0 | 158 | 0 | 45 | 9,422 |
| 19 | Arch Cr, Inyan Kara Cr, Cabin Cr, & Miller Cr | 491 | 637 | 2,997 | 2,930 | 3,249 | 3,822 | 0 | 0 | 0 | 580 | 668 | 199 | 15,082 |
| 20 | Belle Fourche River above Whitetail Cr | 1,003 | 1,676 | 8,872 | 6,902 | 10,169 | 12,091 | 1,364 | 0 | 0 | 919 | 668 | 301 | 42,964 |
| 21 | Whitetail Cr, Blacktail Cr, Lytle Cr, & Beaver Cr | 726 | 1,384 | 5,165 | 4,440 | 5,427 | 4,778 | 0 | 0 | 0 | 481 | 164 | 175 | 22,013 |
| 22 | Belle Fourche River above Gage 06428200 | 1,729 | 3,060 | 14,037 | 11,342 | 15,597 | 16,869 | 2,223 | 0 | 0 | 1,400 | 832 | 476 | 65,836 |
| 23 | Belle Fourche River above Arnold Cr | 1,729 | 3,060 | 14,037 | 11,342 | 15,597 | 18,643 | 3,408 | 0 | 0 | 1,400 | 832 | 476 | 68,795 |
| 24 | Belle Fourche River Tribs above Gage 06428500 | 970 | 2,233 | 6,574 | 3,777 | 6,391 | 3,896 | 0 | 0 | 0 | 780 | 428 | 458 | 24,537 |
| 25 | Arnold Cr & East Cr | 592 | 2,012 | 6,126 | 3,244 | 5,645 | 2,330 | 0 | 0 | 0 | 274 | 0 | 145 | 19,776 |
| 26 | Belle Fourche River above Horse Cr | 3,291 | 7,305 | 26,738 | 18,364 | 27,633 | 24,869 | 4,691 | 256 | 0 | 2,453 | 1,260 | 1,080 | 114,649 |
| 27 | Horse Cr, Pine Cr, Kruger Cr, Kilpatrick Cr, & Oak Cr | 1,222 | 4,706 | 11,718 | 5,395 | 9,981 | 3,430 | 0 | 0 | 0 | 677 | 60 | 412 | 36,379 |
| 28 | Belle Fourche River above Stateline | 4,513 | 12,011 | 38,456 | 23,759 | 37,615 | 28,299 | 4,758 | 256 | 0 | 3,130 | 1,320 | 1,491 | 151,096 |
Table III-20
Available Flow for Belle Fourche River Basin (Acre-Feet) -
Normal Year Hydrologic Conditions
| Reach | Reach Name | Jan | Feb | Mar | Apr | May | Jun | Jul | Aug | Sep | Oct | Nov | Dec | Annual |
| 1 | Belle Fourche River above Caballo Cr | 8 | 9 | 33 | 87 | 141 | 318 | 0 | 0 | 0 | 29 | 0 | 10 | 618 |
| 2 | Belle Fourche River Tribs above Gage 06426500 | 1 | 6 | 15 | 0 | 0 | 0 | 0 | 0 | 0 | 9 | 0 | 0 | 24 |
| 3 | Caballo Creek | 2 | 1 | 13 | 20 | 100 | 63 | 0 | 0 | 0 | 18 | 0 | 0 | 209 |
| 4 | Dry Cr, Yellow Hammer CR, Whitetail CR, & Four Horse Cr | 1 | 5 | 12 | 3 | 17 | 3 | 0 | 0 | 0 | 17 | 0 | 0 | 51 |
| 5 | Belle Fourche River above Buffalo Cr | 11 | 21 | 73 | 110 | 258 | 383 | 0 | 0 | 0 | 72 | 0 | 11 | 915 |
| 6 | Raven Creek | 0 | 2 | 7 | 2 | 10 | 2 | 0 | 0 | 0 | 8 | 0 | 0 | 29 |
| 7 | Buffalo Cr & Timber Cr | 1 | 5 | 14 | 0 | 0 | 0 | 0 | 0 | 0 | 0 | 0 | 0 | 19 |
| 8 | Belle Fourche River above Donkey Cr | 12 | 29 | 93 | 112 | 267 | 385 | 0 | 0 | 0 | 80 | 0 | 11 | 963 |
| 9 | Donkey Creek | 56 | 59 | 187 | 1,166 | 565 | 917 | 0 | 0 | 0 | 103 | 0 | 49 | 3,031 |
| 10 | Trail Cr, Dry Cr, & Robinson Cr | 0 | 1 | 4 | 0 | 0 | 0 | 0 | 0 | 0 | 0 | 0 | 0 | 5 |
| 11 | Belle Fourche River above Gage 06426500 | 68 | 89 | 283 | 1,278 | 832 | 1,302 | 0 | 0 | 0 | 183 | 0 | 60 | 3,999 |
| 12 | Belle Fourche River above Keyhole Reservoir | 68 | 89 | 283 | 1,278 | 832 | 1,302 | 0 | 0 | 0 | 183 | 0 | 60 | 3,999 |
| 13 | Tribs to Keyhole Reservoir | 8 | 43 | 117 | 17 | 144 | 0 | 0 | 0 | 0 | 14 | 0 | 0 | 334 |
| 14 | Miller Cr, Lone Tree Cr, Deer Cr, & Eggie Cr | 13 | 67 | 180 | 44 | 248 | 0 | 0 | 0 | 0 | 23 | 0 | 0 | 563 |
| 15 | Duck Cr, Smoke Cr, Berger Cr, Wind Cr, Mule Cr, & Cottonwood Cr | 21 | 115 | 309 | 84 | 448 | 0 | 0 | 0 | 0 | 40 | 0 | 0 | 995 |
| 16 | Keyhole Reservoir | 110 | 314 | 890 | 1,423 | 1,672 | 1,302 | 0 | 0 | 0 | 260 | 0 | 60 | 5,892 |
| 17 | Belle Fourche River above Inyan Kara Cr | 110 | 314 | 890 | 1,423 | 1,672 | 2,643 | 0 | 0 | 0 | 260 | 0 | 60 | 7,262 |
| 18 | Belle Fourche River Tribs above Gage 06428200 | 97 | 324 | 930 | 832 | 1,354 | 0 | 0 | 0 | 0 | 116 | 0 | 35 | 3,569 |
| 19 | Arch Cr, Inyan Kara Cr, Cabin Cr, & Miller Cr | 253 | 431 | 1,275 | 1,975 | 3,169 | 1,952 | 0 | 0 | 0 | 607 | 535 | 311 | 10,281 |
| 20 | Belle Fourche River above Whitetail Cr | 460 | 1,069 | 3,094 | 4,230 | 6,194 | 4,665 | 0 | 0 | 0 | 984 | 1,184 | 406 | 21,804 |
| 21 | Whitetail Cr, Blacktail Cr, Lytle Cr, & Beaver Cr | 309 | 844 | 2,289 | 2,651 | 4,154 | 1,878 | 0 | 0 | 0 | 438 | 130 | 216 | 12,562 |
| 22 | Belle Fourche River above Gage 06428200 | 769 | 1,913 | 5,384 | 6,881 | 10,349 | 6,544 | 0 | 0 | 0 | 1,421 | 1,314 | 622 | 34,366 |
| 23 | Belle Fourche River above Arnold Cr | 769 | 1,913 | 5,384 | 6,881 | 10,349 | 8,199 | 0 | 0 | 0 | 1,421 | 1,314 | 622 | 36,051 |
| 24 | Belle Fourche River Tribs above Gage 06428500 | 606 | 1,312 | 2,919 | 2,083 | 3,057 | 1,409 | 0 | 0 | 0 | 728 | 335 | 502 | 12,327 |
| 25 | Arnold Cr & East Cr | 283 | 1,068 | 2,561 | 1,526 | 2,055 | 87 | 0 | 0 | 0 | 201 | 0 | 97 | 7,578 |
| 26 | Belle Fourche River above Horse Cr | 1,658 | 4,293 | 10,864 | 10,489 | 15,461 | 9,731 | 0 | 0 | 0 | 2,350 | 1,863 | 1,221 | 56,200 |
| 27 | Horse Cr, Pine Cr, Kruger Cr, Kilpatrick Cr, & Oak Cr | 674 | 2,357 | 5,179 | 2,517 | 3,199 | 111 | 0 | 0 | 0 | 560 | 0 | 362 | 14,358 |
| 28 | Belle Fourche River above Stateline | 2,332 | 6,650 | 16,043 | 13,007 | 18,660 | 10,086 | 0 | 0 | 0 | 2,910 | 1,863 | 1,584 | 70,803 |
Table III-21
Available Flow for Belle Fourche River Basin (Acre-Feet) -
Dry Year Hydrologic Conditions
| Reach | Reach Name | Jan | Feb | Mar | Apr | May | Jun | Jul | Aug | Sep | Oct | Nov | Dec | Annual |
| 1 | Belle Fourche River above Caballo Cr | 0 | 0 | 13 | 0 | 0 | 0 | 0 | 0 | 0 | 0 | 0 | 1 | 14 |
| 2 | Belle Fourche River Tribs above Gage 06426500 | 0 | 0 | 1 | 0 | 0 | 0 | 0 | 0 | 0 | 0 | 0 | 0 | 1 |
| 3 | Caballo Creek | 0 | 0 | 2 | 0 | 0 | 0 | 0 | 0 | 0 | 0 | 0 | 0 | 2 |
| 4 | Dry Cr, Yellow Hammer CR, Whitetail CR, & Four Horse Cr | 0 | 0 | 1 | 0 | 0 | 0 | 0 | 0 | 0 | 0 | 0 | 0 | 1 |
| 5 | Belle Fourche River above Buffalo Cr | 0 | 1 | 16 | 0 | 0 | 0 | 0 | 0 | 0 | 0 | 0 | 1 | 17 |
| 6 | Raven Creek | 0 | 0 | 0 | 0 | 0 | 0 | 0 | 0 | 0 | 0 | 0 | 0 | 0 |
| 7 | Buffalo Cr & Timber Cr | 0 | 0 | 1 | 0 | 0 | 0 | 0 | 0 | 0 | 0 | 0 | 0 | 1 |
| 8 | Belle Fourche River above Donkey Cr | 0 | 1 | 17 | 0 | 0 | 0 | 0 | 0 | 0 | 0 | 0 | 1 | 18 |
| 9 | Donkey Creek | 0 | 8 | 188 | 0 | 0 | 0 | 0 | 0 | 0 | 0 | 0 | 4 | 200 |
| 10 | Trail Cr, Dry Cr, & Robinson Cr | 0 | 0 | 0 | 0 | 0 | 0 | 0 | 0 | 0 | 0 | 0 | 0 | 0 |
| 11 | Belle Fourche River above Gage 06426500 | 0 | 9 | 205 | 0 | 0 | 0 | 0 | 0 | 0 | 0 | 0 | 5 | 219 |
| 12 | Belle Fourche River above Keyhole Reservoir | 0 | 9 | 205 | 0 | 0 | 0 | 0 | 0 | 0 | 0 | 0 | 5 | 219 |
| 13 | Tribs to Keyhole Reservoir | 0 | 11 | 30 | 0 | 0 | 0 | 0 | 0 | 0 | 0 | 0 | 0 | 41 |
| 14 | Miller Cr, Lone Tree Cr, Deer Cr, & Eggie Cr | 0 | 17 | 46 | 0 | 0 | 0 | 0 | 0 | 0 | 0 | 0 | 0 | 63 |
| 15 | Duck Cr, Smoke Cr, Berger Cr, Wind Cr, Mule Cr, & Cottonwood Cr | 0 | 29 | 79 | 0 | 0 | 0 | 0 | 0 | 0 | 0 | 0 | 0 | 108 |
| 16 | Keyhole Reservoir | 0 | 65 | 361 | 0 | 0 | 0 | 0 | 0 | 0 | 0 | 0 | 5 | 431 |
| 17 | Belle Fourche River above Inyan Kara Cr | 4 | 65 | 361 | 0 | 0 | 0 | 0 | 0 | 0 | 0 | 0 | 17 | 443 |
| 18 | Belle Fourche River Tribs above Gage 06428200 | 0 | 61 | 339 | 0 | 0 | 0 | 0 | 0 | 0 | 0 | 0 | 1 | 402 |
| 19 | Arch Cr, Inyan Kara Cr, Cabin Cr, & Miller Cr | 49 | 104 | 571 | 0 | 0 | 0 | 0 | 0 | 0 | 0 | 309 | 173 | 1,158 |
| 20 | Belle Fourche River above Whitetail Cr | 53 | 230 | 1,271 | 472 | 0 | 0 | 0 | 0 | 0 | 0 | 309 | 192 | 2,474 |
| 21 | Whitetail Cr, Blacktail Cr, Lytle Cr, & Beaver Cr | 28 | 178 | 1,027 | 0 | 0 | 0 | 0 | 0 | 0 | 0 | 46 | 100 | 1,351 |
| 22 | Belle Fourche River above Gage 06428200 | 81 | 408 | 2,298 | 774 | 0 | 0 | 0 | 0 | 266 | 0 | 355 | 292 | 4,394 |
| 23 | Belle Fourche River above Arnold Cr | 81 | 408 | 2,298 | 801 | 0 | 0 | 0 | 0 | 266 | 0 | 355 | 292 | 4,420 |
| 24 | Belle Fourche River Tribs above Gage 06428500 | 189 | 443 | 1,328 | 0 | 0 | 0 | 0 | 0 | 0 | 0 | 253 | 343 | 2,368 |
| 25 | Arnold Cr & East Cr | 9 | 293 | 1,038 | 0 | 0 | 0 | 0 | 0 | 0 | 0 | 0 | 27 | 1,358 |
| 26 | Belle Fourche River above Horse Cr | 279 | 1,144 | 4,664 | 1,459 | 143 | 0 | 0 | 0 | 601 | 0 | 608 | 663 | 9,282 |
| 27 | Horse Cr, Pine Cr, Kruger Cr, Kilpatrick Cr, & Oak Cr | 106 | 741 | 2,128 | 0 | 0 | 0 | 0 | 0 | 0 | 0 | 0 | 205 | 3,073 |
| 28 | Belle Fourche River above Stateline | 385 | 1,885 | 6,792 | 1,946 | 143 | 0 | 0 | 0 | 601 | 0 | 608 | 868 | 12,843 |
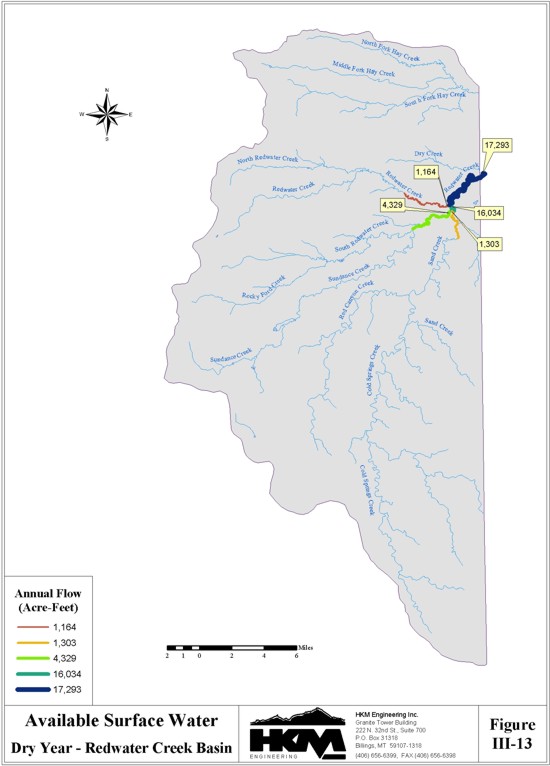
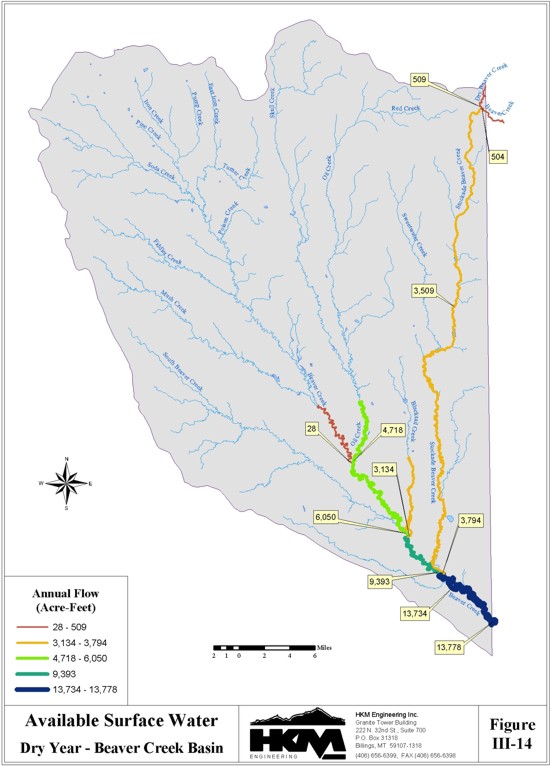
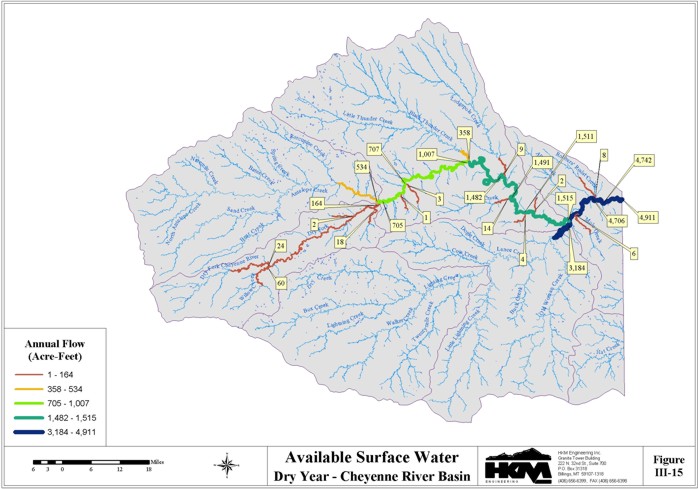
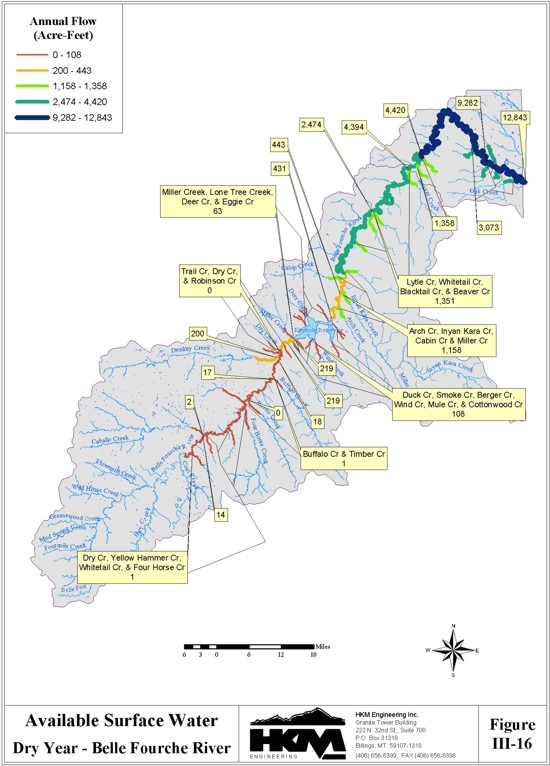
Table III-22
Total Annual Available Flow
| Subbasin | Hydrologic Condition | ||
| Wet Years | Normal Years | Dry Years | |
| Redwater Creek | 34,000 | 26,000 | 17,000 |
| Beaver Creek | 30,000 | 20,000 | 14,000 |
| Cheyenne River | 103,000 | 31,000 | 5,000 |
| Belle Fourche River | 151,000 | 71,000 | 13,000 |
The yield potential of each of these basins is limited by the dry year conditions. Further, the timing of these available flows does not necessarily match the timing of the demand for this water. For example of the 14,000 acre-feet of available flow from Beaver Creek during a typical dry year, roughly 60 percent of this occurs during the months of March through June. Reservoir storage would be required to store this excess flow to satisfy demands throughout the year. The available flow presented in Table III-22 does not include the constraints of the Belle Fourche River Compact. This will be discussed in the next section.
Compact Constraints
A determination of the amount of water available to Wyoming for future development is not complete without an evaluation of the constraints imposed by interstate compacts. Three interstate compacts have been negotiated between the States of Wyoming, Montana, North Dakota, and South Dakota for divisions of the waters of the Little Missouri River, the Belle Fourche River, and the Cheyenne River. Of these three compacts, only the Belle Fourche River Compact has been formally accepted by all interests.
The Belle Fourche Compact of 1943 is briefly summarized by the following rules for dividing the waters between the States of Wyoming and South Dakota (SEO, 1982):
90 percent to South Dakota
10 percent to Wyoming
Annual measured streamflow at the USGS Gages 06428500 (Belle Fourche River at Wyoming- South Dakota State Line and 06430500 (Redwater Creek at Wyoming-South Dakota State Line) are used as the basic data for this evaluation. The surface water hydrology work for this study was performed on a water year basis (October 1 through September 30). Determination of the compact apportionment was therefore also performed on a water year basis for consistency. The compact, however, specifies that apportionment shall be determined based on the accumulated flow and storage from the beginning of the calendar year. Average annual wet year, normal year, and dry year streamflow for the water years selected through the surface water hydrology work were compared to the corresponding calendar year streamflows. This analysis, performed for the Belle Fourche River, indicated a difference for all three conditions of less than 0.3 percent. Very little error is introduced into the analysis through the use of water-year total annual flows.
Table III-23
Wyoming's Apportionment of Available Flow Per
Belle Fourche River Compact
| Hydrologic Condition | Average Annual Apportionment (AF) | ||
| Belle Fourche River |
Redwater Creek |
Total | |
| Wet Years | 15,600 | 3,300 | 18,900 |
| Normal Years | 7,400 | 2,400 | 9,800 |
| Dry Years | 1,100 | 1,400 | 2,500 |
Additional detail of the determination of available flows is provided in the "Available Surface Water Determination" technical memorandum. The Wyoming Water Planning Program previously estimated Wyoming's average annual apportionment of the Belle Fourche River to be 7,300 acre-feet for the 1948 through 1968 study period.
B. Ground WaterA qualitative summary of the ground water resources of the Little Missouri, Belle Fourche, Cheyenne and Niobrara basins of northeastern Wyoming is presented herein. Collectively, these basins are referred to as the Northeast Wyoming River Basins (planning area).
Study Objectives
The first objective of this task was to inventory and catalog the Wyoming State Engineer's Office (SEO) ground water permit database for various categories of ground water uses in the planning area, and incorporate the extracted information into six GIS data layers. This was accomplished through a cooperative effort with personnel of the SEO and Wyoming Water Development Commission (WWDC). GIS data layers prepared from information on file with the SEO as of December 31, 2000 included:
Other objectives are as follows:
Study Methods
There were no original investigations performed as part of this task. The work consisted of performing an inventory, compilation and review of published literature on the geology and ground water resources of the planning area.
There is a wealth of published and unpublished reports of investigations on the geology and ground water resources of the Basin Plan area. The Powder River Structural Basin (PRSB), part of which is within the planning area, has been the subject of investigation and exploration as a result of interest in the development of energy and natural resources for at least the last 40 to 50 years. Resources of interest have included oil and gas, coal, uranium, coalbed methane and water.
A bibliography of published ground water studies and ground water planning documents for the Basin Plan is included in the "Available Ground Water Determination" technical memorandum. The references included in the bibliography, provide sources for an overview of ground water resources, and of some of the interests and concerns that have arisen as a result of the various stages of development of energy and natural resources in the planning area.
Additional information in specific geographic areas within the planning area is available through the U.S. Geological Survey (USGS) and other federal agencies. Two additional federal agencies active in ground water related issues in the PRSB include the U. S. Bureau of Land Management (BLM) and the U. S. Environmental Protection Agency (USEPA).
Several Wyoming State agencies have site specific information available in the planning area. These agencies include the Department of Environmental Quality (Land Quality and Water Quality Divisions), the State Engineer's Office, the United States Geological Survey, the Oil and Gas Conservation Commission and the Water Development Commission.
Overview
The planning area lies in the northeastern and east-central part of the state and includes all or part of seven Wyoming counties (Figure I-1). The planning area includes all of Weston, most of Crook and about forty percent of Campbell (central/east, south and southeast and northeast) Counties. The northeast and northwest parts of Converse and Niobrara Counties, respectively, as well as small parts of Natrona and Goshen Counties are also within the planning area. Figure III- 17 shows the general location of the planning area with respect to regional structural elements in northeastern Wyoming.
Major communities in Campbell and Crook Counties include: Gillette, Wright, Hulett, Moorcroft, and Sundance. Newcastle and Upton are the primary towns in Weston County. Principal towns in Niobrara County include Lusk, Manville and Redbird.
Regionally, the planning area lies within the Missouri River drainage system and covers an area of approximately 11,943 square miles in northeastern Wyoming. The principal surface water systems within the planning area include the Little Missouri, Belle Fourche, Cheyenne and Niobrara Rivers and their respective tributaries. These drainage systems form the boundary of the planning area.
Altitudes are variable, generally ranging from 4200 feet (southwestern Crook County) to 5,500 feet (northwest of Lusk in Niobrara County) in the western part of the planning area. Altitudes in the eastern part of the planning area generally vary from 4,700 feet (Niobrara County at the Wyoming . Nebraska State line) to 6,600 feet (northeastern Converse County) to 4,750 feet at the crest of Bear Mountain in Crook County. The lowest altitude in the planning area is about 3,125 feet where the Belle Fourche River crosses the state line in Crook County.
Climate is typical of the northern High Plains with low precipitation, high evaporation and wide ranges of temperatures. Annual precipitation varies from 13 to 15 inches in the lowlands to well over 20 inches per year in the Black Hills (Figure I-2). Generally, about fifty percent of the precipitation in the planning area occurs between April and July.
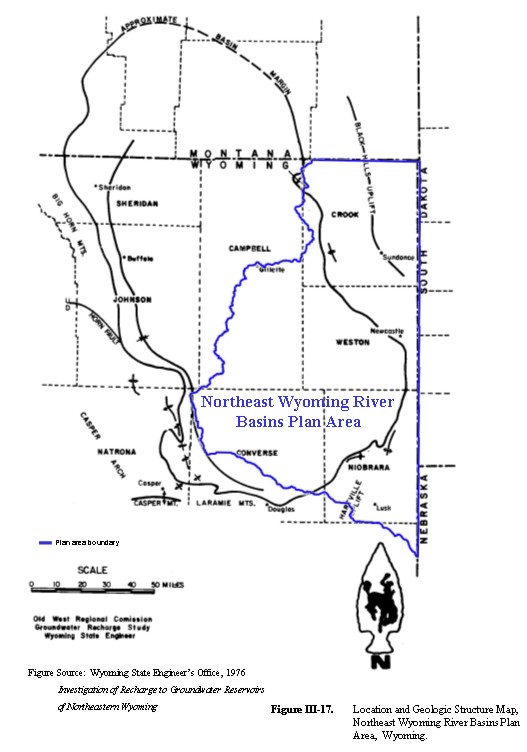
Geologic Setting
Geologic formations in the planning area range in geologic time from Precambrian crystalline rocks to recent alluvial and eolian deposits generally consisting of clays, silts, sands and gravels. The PRSB, part of which is within the planning area, has over 17,000 feet of sedimentary strata. These sedimentary rocks have been divided into about 11,000 feet of Cambrian to Cretaceous pretectonic deposits and up to 7,000 feet of Tertiary deposits associated with the deformation of the PRSB. (Feathers, Libra, Stephenson and Eisen, 1981, Occurrence and Characteristics of Groundwater in the Powder River Basin, Wyoming)
The older strata, which are exposed only in the northeastern part of the Basin Plan Area, are economically important for oil production. The Tertiary deposits generally present in the west- central portion of the planning area contain significant coal reserves and are subject to mining and coalbed methane development. Both the Early Cretaceous Fall River Formation and the Early Tertiary Wasatch Formation have been important as uranium deposit sources in the Black Hills and the central to southcentral part of the planning area. Figure III-18 presents a generalized geologic section of the PRSB including part of the planning area.
The planning area encompasses several tectonic elements that influence the geology and the occurrence and availability of ground water in the planning area. These structural features include the PRSB, mountain uplifts (Black Hills, Laramie Range and Bighorn Mountains) and broad uplifts of lesser magnitude (Hartville Hills and the Casper Arch).
Figures III-19 and III-20 present the generalized surficial and bedrock geology of the planning area.
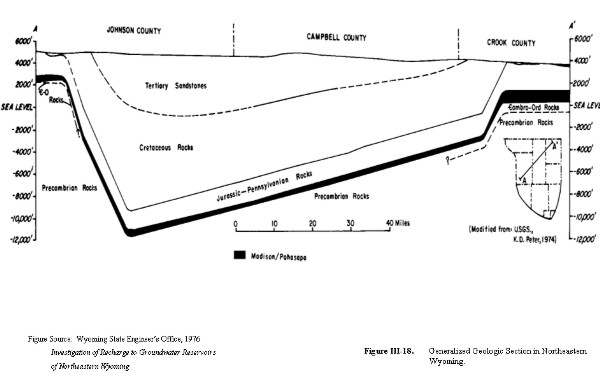
Geologic Units and Ground Water
A geologic formation is a body or group of rock strata that consist dominantly of a certain lithologic type or combination of types. A general definition of an aquifer is a geologic formation or group of formations that are capable of yielding a significant quantity of water to wells or springs.
There are more than 30 geologic formations exposed on the margins of the PRSB. For this report, the formations were grouped into six principal aquifer systems that have historically been the major ground water sources of interest in the planning area. The grouping was based on those presented in the 1981 report "Occurrence and Characteristics of Ground Water in the Powder River Basin, Wyoming" by the Wyoming Water Resources Research Institute (WWRI) of Wyoming. Figure III-21 graphically summarizes the geologic formations and their hydrogeologic role in the PRSB within the planning area.
The WWRI aquifer system division and the grouping used herein were based on aquifer hydrogeologic similarity and aquitard identification. The grouping allows for a simplified presentation of the principal sources of ground water in the planning area. The six major aquifer systems within the planning area are (oldest to youngest):
More detailed information on the hydrologic characteristics of the major aquifer systems are provided in the "Available Ground Water Determination" technical memorandum.
Figure III-21. Diagramatic Hydrostratigraphy of the Powder River Structural Basin
within the Northeast Wyoming River Basins Plan Area.
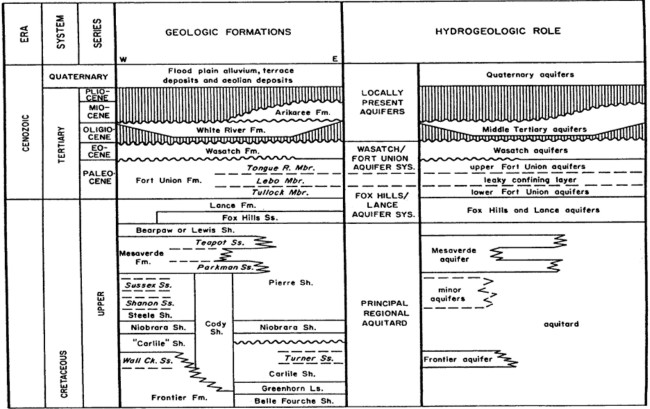
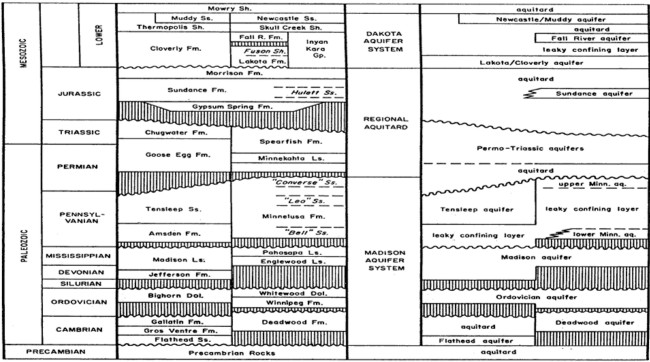
Figure Source: Feathers, Libra, Stephenson & Eisen, 1981
Occurrence and Characteristics
of Groundwater in the Powder River Basin, Wyoming
Ground Water Quality
Ground water quality data contained in USGS ground water reports for the planning area were reviewed and provide an overview of the general quality of water from the aquifer systems within the planning area.
The review included selected USGS analyses available from USGS data files as of March 26, 1982 (Larson and Daddow, 1984, Ground-Water-Quality Data from the Powder River Structural Basin and Adjacent Areas, Northeastern Wyoming). The 2000 USGS publication on water co-produced with coalbed methane in the PRSB was also reviewed (Rice, Ellis and Miller, 2000, Water Co-produced with Coalbed Methane in the Powder River Basin, Wyoming: Preliminary Data).
1984 USGS Report
Information used in the 1984 report did not include all of the information available in USGS files at the time. Constituents were selected by USGS on the basis of their relative abundance and their inclusion in water quality criteria at the time. Water quality data available from the 1984 USGS report included: specific conductance, pH, temperature, dissolved-solids (TDS) concentration and concentrations of the major ions (calcium, magnesium, sodium, potassium, alkalinity (as bicarbonate), sulfate, chloride, fluoride, and nitrate, plus silica, boron, and iron). This data was from 748 ground water sites in the PRSB and adjacent areas.
Information on selected dissolved trace metals were reported for 220 ground water sites in the PRSB and adjacent areas in the 1984 USGS report. Data were reported for nine trace metals (arsenic, barium, cadmium chromium copper, lead, mercury, selenium, zinc) in the 1982 selection.
Radiochemical data was listed for 65 ground water sites in the PRSB and adjacent areas in the 1984 USGS report. The data included eight radiochemical analyses for each site (gross alpha- dissolved, gross alpha-suspended, gross beta-dissolved, gross beta-suspended, radium 226 dissolved radon method, radium 226 dissolved precipitation method, uranium-dissolved extraction method, uranium-dissolved direct fluorometric method).
2000 USGS Report
The 2000 USGS publication on water co-produced with coalbed methane in the PRSB contained data from 47 ground water sites in the PRSB. Approximately 32 of the sites were located within the planning area. The remaining 15 were located in the Powder/Tongue River Basin Plan Area.
Water quality data available from the 2000 USGS report included: pH, temperature, dissolved- solids (TDS) concentration and concentrations of the major ions and minor ions (fluoride, chloride, sulfate, bromine, alkalinity, ammonia, calcium, potassium, magnesium, sodium, barium, iron plus silica, strontium, and sodium-adsorption-ratio (SAR)). Data was also reported for seventeen trace elements (silver, aluminum, arsenic, boron, beryllium, bismuth, cadmium, cerium, cobalt, chromium, caesium, copper, mercury, lanthanum, lithium, manganese, nickel).
Water Quality Standards and Suitability for Use
The State of Wyoming has identified the following as standards for different classes of ground water:
The fact that ground water is and has been successfully used for the above uses is a general, practical indicator of ground water quality in the planning area. A general, qualitative evaluation and comparison of ground water produced from the six aquifer systems was performed. The results of the evaluation, including a general characterization of water co-produced with coalbed methane are summarized in Table III-24. The general availability and development potential for each aquifer system in the planning area are also summarized in Table III-24.
Aquifer Sensitivity/Vulnerability
The University of Wyoming's Spatial Data and Visualization Center (SDVC . now known as the Wyoming Geographic Information Science Center or WyGISC) developed a system to assess the sensitivity and vulnerability of ground water to surface water contamination in Wyoming. The SDVC developed aquifer vulnerability maps to define the potential for surface contamination to impact ground water in the uppermost aquifer throughout Wyoming. The highest rated lands generally are located on alluvial deposits adjacent to rivers, streams, and lakes, and are associated with slope wash, colluvium, residuum and eolian deposits or are on fractured bedrock areas.
Maps of aquifer vulnerability to contamination for the uppermost or shallowest aquifers were also developed by SDVC. Ground water is vulnerable in areas with high water tables, sandy soils, and areas of presumed pesticide application. The areas with the highest vulnerability are also generally located in the floodplains of the major streams and/or associated with slope wash, colluvium, residuum and eolian deposits within the planning area.
The ground water sensitivity and vulnerability maps are provided in the "Available Ground Water Determination" technical memorandum.
Ground Water Development
Ground water is the major and in many cases, the only source of water within the Basin Plan Area. All six aquifer systems are important water sources in the planning area for all uses. As an example, ground water from each of the aquifer systems has historically been used at one time or another as a source for municipal/public water systems in the planning area. Ground water associated/co-produced with coalbed methane development although not a use, is very important due to withdrawal impacts on water levels and existing wells completed in the Fort Union/Wasatch Aquifer System.
Existing Development
Selected existing and historical uses of ground water from the six aquifer systems within the planning area are summarized in Table III-24. The significance of ground water in the planning area is demonstrated by the 15,793 active ground water permits (as of December 31, 2000) within the planning area. The number of permits for each use category are summarized below:
Table III-24
Summary of Ground Water Availability/Development Potential of Major Aquifer
Systems, Central and Eastern Flanks of the Powder River Structural Basin
| Major Aquifer System | Geologic Unit | Thickness (Feet) |
Lithologic Character | Hydrological CharacterA,B | General Water Quality |
Availability/Development PotentialC |
Remarks |
| Quaternary Alluvial Aquifer System | Alluvium and Terrace Deposits |
0-100+ | Clay rich sandy silt, silt, sand and gravel; unconsolidated and interbedded; present along most streams. Thickness generally less than 50 feet but may be thicker. Coarser deposits in valleys of the Belle Fourche and the Cheyenne Rivers. Alluvium overlying formations of Tertiary age is generally fine to medium grained in central part of basin. (Hodson, Pearl and Druse, 1971) | Yield of 1000 gpm possible, often through induced recharge. Terraces topographically high and often drained. Specific capacity, 0.3-18 gpm/ft; porosity, 28-45%; permeability, 0.1-1100 gpd/ft2; transmissivity, 15-64000 gpd/ft; specific yield, 2-39%. Coarser deposits have better aquifer properties. | TDS content generally range from about 100 to >4000 mg/l, and chemical characteristics of water differ geographically. Chemical type and mineralization of the water can be expected to vary depending on underlying rock types and the nature and degree of interconnection with underlying bedrock aquifers as well as surface water. Moderate to high mineralization tolerable for stock and domestic use. Suitability for irrigation generally limited to salt tolerant crops. Water in the alluvium in Black Hills generally is better quality than central part of basin (Hodson, Pearl and Druse, 1971). | Historical source for domestic and stock use. Production has ranged from 1 to 900 gpm. Ground water development potential generally better in coarse-grained deposits and poorer in fine-grained materials. Yields in the high end of the above range might be possible to optimally located and properly designed wells if induced infiltration from surface water can be tolerated (Belle Fourche, Cheyenne and Niobrara River Basins). Potential source for irrigation, municipal / public and industrial sources where more than 40 feet of saturated well sorted sand and gravel are present. | Quaternary alluvial aquifers generally in hydraulic connection with all bedrock aquifers in outcrop areas and also with surface waters. Alluvial aquifers in larger valleys provide hydraulic interconnection between otherwise hydraulically isolated bedrock aquifers (Whitcomb, 1965). Alluvial aquifers also serve as interchange point and storage for ground water in the hydrologic cycle (Davis and Rechard, 1977), (Davis, 1976). Induced recharge from surface waters is probable in areas of extensive development. |
| Middle Tertiary Aquifer | Arikaree Formation | 0-500 (southeast only) |
Tuffaceous sandstone, fine-grained with silty zones, coarse sand lenses and concretionary zones. | Yields up to 1000 gpm; specific capacity up to 232 gpm/ft; porosity, 5-24%; permeability <1-300 gpd/ft2; transmissivity up to 77,000 gpd/ft. | TDS content of water ranges from 261 to 535 mg/l. Composition mainly Calcium Bicarbonate (Whitcomb, 1965). Median TDS content in samples from 12 wells in Niobrara County 321 mg/l (Larson, 1984). | Historical source for municipal / public, industrial, domestic, stock and irrigation supply with tested production ranging as high as 195 to 730 gpm (Whitcomb, 1965). Yields of 1000 gpm might be possible to optimally located and properly designed wells. | Water level data available from two observation wells located east and south east of Lusk in Niobrara County (32-62-05-baa01), (32-62-32-bbb01). Water levels have shown approximately 6 to 13 feet decline in water levels in the aquifer since the 1970s with possibly some stabilization and slight recovery since early to mid 1990s (USGS, 2001). |
| Fort Union / Wasatch Aquifer System | Wasatch Formation | up to 1600 | Fine- to coarse-grained lenticular sandstones interbedded with shale and coal, coarser in south. | Yields generally <15 gpm, locally flowing wells exist. Yields historically could be expected to range from 10 to 50 gpm in the north part of the basin with the possibility of higher yields up to 500 gpm in the south part of the basin (Hodson, Pearl and Druse, 1973). Specific capacity, 0.10-14 gpm/ft (Hodson, Pearl and Druse, 1973); porosity, 28-30%; permeability, 0.01-65 gpd/ft2; transmissivity, average 500 gpd/ft range 1-4000 gpd/ft. | TDS content of waters is variable and ranges from <200 to > 8000 mg/l (Hodson, Pearl and Druse, 1973). Sodium Sulfate and Sodium Bicarbonate are general dominate water types. Major ion composition varies with depth and shows more Sodium and Bicarbonate content with depth. Radium 226 + 228 may be of concern near uranium deposits. | Historical source for municipal / public, domestic and stock supply. Yields ranging from 10 to 50 gpm in the north part of the basin can be expected with the possibility of higher yields up to 500 gpm in the south part of the basin (Hodson, Pearl and Druse, 1973). | Water level data available from two observation wells located in Campbell County (50-72-21-aba01), (42-71-35-aaa01) and one observation well in Converse County (37-70-10-cbb01). Water levels in the aquifer have shown about a 40 feet rise between 1983 and 2000 in Gillette and about a 40 to 50 feet decline south east of Wright in Campbell County. Water levels in the aquifer in northwest Converse County have shown a rise of about 7 feet between 1988 and 1999 after a decline of about 6 feet between 1986 and 1988. (USGS, 2001) |
| Fort Union Formation | 1100-2270 | Sandstone, fine- to medium-grained, lenticular, interbedded with siltstone, coal and shale. Middle part may be shalier in north, upper part siltier in south. "Clinker" associated with coal outcrops. | Flowing yields of 1-60 gpm where confined. Pumped yields up to 250 gpm with several hundred feet of drawdown. Specific capacity, 0.1-2 gpm/ft; permeability, 0.01-100 gpd/ft2; transmissivity, 1-5000 gpd/ft. Coal and clinker generally have better aquifer properties than sandstones. Locally clinker transmissivity up to 3,000,000 gpd/ft; Anisotropy and leaky confining layers are common. | TDS content and major ion composition of Fort Union Formation Waters as above. Water co-produced with coal bed methane is predominantly Sodium Bicarbonate type with TDS content and SAR (32 samples), 270 - 1170 mg/l (mean of 653 mg/l) and 5.7 - 12 (mean of 7.85) respectively (Rice, Ellis & Bullock, 2000). BLM Wyodak EIS assumed average TDS concentration of 764 mg/l (USDI,BLM, 1999). High radionuclide content of concern in areas near uranium ore zones. | Historical source for municipal / public, domestic and stock supply. Maximum expected yields of about 130 to 150 gpm (Hodson, Pearl and Druse, 1973), (Wester -Wetstein and Associates, Inc., 1994). Exploration and development of new Fort Union well field including conjunctive use / recharge of Coal Bed Methane production water under consideration \for the City of Gillette. | Source for approximately 14 municipal and public water supply systems including the City of Gillette and adjacent Districts, Joint Powers Boards and Privately Owned Water Systems and Water Users Associations in Campbell County. City of Gillette mixes Fort Union Formation water with that from the Madison and Fox Hills/Lance system for municipal / public water supply. Total of 5285 Coal Bed Methane wells permitted with WSEO in planning area as of 12/31/00. Maximum, minimum and mean depths and range of actual yields listed on permits were 138 -5507 (mean 772) feet below ground surface (bgs), and 1 - 120 (mean 27) gpm respectively. Range of depths to main water bearing zone listed on WSEO Permits were 124 - 1558 (mean 124) feet bgs. BLM Wyodak EIS assumed average expected water production to be 12 gpm over the estimated 12 year life of each CBM well (USDI,BLM, 1999). BLM Wyodak Drainage EA assumed average water production for each CBM well to be 11.1 gpm (USDI,BLM, 2000). | |
| Fox Hills/Lance Aquifer System | Lance Formation | 500-1000 (North) 1600-3000 |
Sandstone, fine- to medium-grained, lenticular, interbedded with sandy siltstone and claystone. | Yields up to 350 gpm but with large drawdowns and long well completion intervals. Locally flowing wells exist. Specific capacity, 0.05-2 gpm/ft; permeability, 6-35 gpd/ft2; transmissivity, 170-2100 gpd/ft. | TDS content in waters at Foxhills/Lance System outcrops north of Niobrara County range from 600 - 1,500 mg/l, and in Niobrara County range from 1,000 - 3,300 mg/l. Composition mainly Sodium - Bicarbonate - Sulfate. Fluoride enrichment is characteristic of Fox Hills/Lance Formation waters. Possible high Sodium, and radionuclide content could be of concern in some areas. | Lance Formation historical source for municipal / public, domestic and stock supply. Generally yields less than 20 gpm, but yields of several hundred gallons per minute may be possible from complete section of the formation. (Hodson, Pearl and Druse, 1973) | High Fluoride content is of concern for development as source for municipal / public water systems. |
| Fox Hills Sandstone | 150-200 (North) 400-700 |
Sandstone, fine-to medium-grained, interbedded with shale and siltstone. | Yields up to 705 gpm but with large drawdowns and long well completion intervals. Locally flowing wells exist. Specific capacity, 0.05-2 gpm/ft; permeability, 34 gpd/ft2; transmissivity, 76-1600 gpd/ft for wells also completed in Lance. | Similar to Lance Formation | Historical source for municipal / public, industrial, domestic and stock supply. Tested yields of Gillette municipal / public supply wells have ranged from 85 to 705 gpm (Wester-Wetstein and Associates, Inc., 1994). | High Fluoride content is of concern for development as source for municipal / public water systems. Has been used for oil well water flooding operations. Water level data available from one observation well completed in the aquifer south east of Gillette in Campbell County (49-70-31bbb01) has shown approximately 50 feet decline since 1983 (USGS, 2001). | |
| Dakota Aquifer System | Newcastle Sandstone | 0-60 (Northeastern Basin) 0-100 |
Sandstone, fine-to medium-grained, locally conglomeratic, lenticular, with interbedded siltstone, shale and claystone. | Minor unit of Dakota Aquifer System exploited near outcrop only; often excessive pumping lift. Oil field data: porosity, 5-27%; permeability, <11 gpd/ft2; transmissivity, 0-140 gpd/ft. | Waters at Dakota System outcrop generally contain over 1,000 mg/l TDS. TDS content 180 - 3200 mg/l in 17 samples in Weston County (Larson, 1984). Composition changes basinward from Calcium - Magnesium - Sulfate at outcrop to Sodium - Sulfate, to Sodium - Bicarbonate. Deep Basin waters > 10,00 mg/l TDS & are enriched to Sodium - Chloride. Possible high Fluoride, Selenium and radionuclide content could be of concern in some areas. | Dakota Aquifer System historical source for domestic and stock use. | Few reported wells in northern Black Hills (1958) due to excessive drilling depths except in outcrop areas. Yields typically adequate for stock and domestic purposes. Historically, wells typically have been completed in both the Lakota and Fall River Formations to obtain maximum production. (Whitcomb, Morris, Gordon & Robinove, 1958) Water level data available from one observation well completed in the aquifer (Lakota Formation) northeast of Lusk in Niobrara County (36-62-28ab02) has shown approximately 23 feet decline between 1974 and 2000 (USGS, 2001). |
| Fall River Formation | 95-150 (Northeastern Basin) 35-85 |
Sandstone, fine-to coarse-grained with interbedded shale and siltstone. | Flowing yield 1-10 gpm; wells often also completed in Lakota Formation. Specific capacity, <0.5 gpm/ft. Oil field data: porosity, 11-23%; permeability, 0-36 gpd/ft2 ; transmissivity, 1-900 gpd/ft. | ||||
| Lakota Formation | 45-300 (Northeastern Basin) 115-200 |
Sandstone, fine-to coarse-grained, in places conglomeratic, very lenticular, irregularly interbedded with shale which becomes dominant at top (Fuson Shale). | Flowing yield 1-10 gpm, up to 150 gpm. Water well data: specific capacity, 0.01-1.4 gpm/ft; permeability, 2-14 gpd/ft2 transmissivity, 220-810 gpd/ft for 2 wells also in Fall River. | ||||
| Madison Aquifer System | Minnelusa Formation (Hartville Formation)D |
600-800 (Northeastern Basin) 1000± |
Sandstone, fine-to coarse-grained, interbedded with limestone, dolomite, and shale, locally gypsiferous, especially at top. | Upper part has historically been considered part of Madison Aquifer System, middle is aquitard, lower is minor aquifer in hydraulic connection with Madison. Flowing yields of over 200 gpm possible; specific capacity, 1-5 gpm/ft. Oil field data: porosity, 6-25%; permeability, <0.1-18 gpd/ft2; transmissivity, 2-900 gpd/ft. | Similar to Madison Formation Waters at Outcrop (TDS < 600mg/l, predominantly Calcium - Magnesium - Bicarbonate type water). TDS content 230 - 2450 mg/l from 26 samples in Crook County with median and mean of 520 and 773 mg/l respectively (Larson, 1984). Some east basin waters near outcrops show TDS up to 3,000 mg/l (Calcium & Sulfate enrichment). Deep basin waters TDS > 10,000 mg/l (mainly Sodium - Chloride type water). Fluoride enrichment characteristic of Madison System waters throughout the basin. Concentrations of radionuclides could be of concern in some areas. | Historical source for municipal / public water supply, domestic and stock use. | Large quantities of water produced from flowing wells at Huelett (1958). Generally deeply buried (> 600 - 700 feet minimum) in area (northern Black Hills - 1958), (Whitcomb, Morris, Gordon & Robinove, 1958). Subject of USGS investigation with Pahasapa / Madison Limestone (Ogle, 2001). Water level data available from one observation well located in Crook (44-62-36-cbb02) and one in Niobrara (36-62-28-bbd01) Counties. Water levels have risen about 2 feet (since 1998) and 15 feet (since 1995) respectively in the two observation wells (USGS, 2001). |
| Pahasapa Limestone (Madison Limestone)D |
550-990 (Northeastern Basin) 250± |
Massive fine-grained limestone and dolomitic limestone, locally cherty or cavernous. | Principal unit of Madison Aquifer System. Flowing or pumped yields up to 1000 gpm; specific capacity, 0.5-50+ gpm/ft, flow-dependent; transmissivity, 1000-60,000 gpd/ft locally to 300,000 gpd/ft+. | Waters at Outcrop (TDS < 600mg/l, predominantly Calcium - Magnesium - Bicarbonate type water). TDS increase basinward to > 3,000 mg/l, Sodium - Sulfate - Chloride predominating. Fluoride enrichment characteristic of Madison System waters throughout the basin. Concentrations of radionuclides could be of concern in some areas. | Probably most important high yield aquifer in Wyoming. Historical source for municipal / public water supply, industrial, irrigation and stock use. Several fish hatcheries use Pahasapa / Madison aquifer as water source. Base flow and spring discharge from the Pahasapa / Madison aquifer form part of the surface run-off in the Black Hills area. (Ogle, 2001) Tested pumping rate of seven City of Gillette Pahasapa / Madison aquifer wells ranged from 535 to 900 gpm (Wester-Wetstein and Associates, Inc., 1994). | Subject of USGS investigation with the Minnelusa Formation (Ogle, 2001). Water level data available from nine observation wells located in Crook (56-67-28-aab01), (56-67-28-aab02), (53-65-18bbd02), (52-63-25-dcd01), (49-62-36-cbb01), Weston (48-65-35ccb01), (46-66-25dbb01), (44-63-26cac01), and Niobrara (36-62-28-ab01) Counties. Water levels have generally risen from 13 to 40 feet in some of the observation wells since 1995 (USGS, 2001). Total estimated recharge to the Madison Limestone in the Powder River Basin in 1973 was about 75,000 acre feet/year (WSEO, 1976). | |
| Englewood Limestone (Gurnsey Formation, part)D |
30-60 (Northeastern Basin) 0-50± |
Thin-bedded limestone, locally shaley. | Minor unit of Madison Aquifer System; USGS test: porosity, 15-18%; permeability, <0.1 gpd/ft2. | Generally no ground water development in area (Northern Black Hills - 1958). Formations may contain some water in permeable zones, but are generally considered to be too deeply bured to be considered important aquifers. (Whitcomb, Morris, Gordon & Robinove, 1958) | |||
| Whitewood Dolomite | 50-60 (Northeastern Basin) absent |
Massive bedded dolomite, locally cherty. | Minor unit of Madison Aquifer System; the few existing wells also produce from the Madison aquifer. USGS test: porosity, 10-25%; specific capacity, 15 gpm/ft; permeability, <0.1-11 gpd/ft2; transmissivity, 6400 gpd/ft. |
AReported yields may reflect development needs rather than aquifer capability; higher yields can sometimes be expected, with corresponding drawdown increases.
Reported water well transmissivities or permeabilities may be for wells completed in two aquifer
BOilfield (and USGS test) data are variously derived resulting in internal inconsistencies in this compilation. Permeabilities are measured on cores or derived from other
data and transmissivities are from drill stem tests or calculated from permeability.
CActual development potential will require site specific office and field investigations to define aquifer capability and constraints unique to each project and site.
DNomenclature for equivalent strata exposed in the Hartville uplift on the southeastern basin flank (Feathers, Libra, Stephenson and Eisen, 1981).
Taken from: Feathers, Libra, Stephenson and Eisen, 1981, Occurrence and Characteristics of Groundwater in the Powder River Basin, Wyoming
Ground Water Monitoring Programs
Existing ground water monitoring programs will continue to be important in monitoring the status of ground water in the PRSB and the planning area for all activities. One such program is the Wyoming statewide USGS cooperative program operated in conjunction with the SEO and other state, county, municipal and federal agencies.
The Gillette Area Groundwater Monitoring Organization (GAGMO) and the recently formed (April 1999) Powder River Basin Area Groundwater Monitoring Organization (PRAGMO) are for coal mining and coalbed methane development. GAGMO is operated by the coal mining industry and PRAGMO by the coalbed methane development operators. These programs provide a common database that satisfy federal and state agency requirements for the respective industries to track and evaluate impacts of their operations on ground water in the PRSB.
Other state and federal agencies have their own monitoring programs associated with their management and regulatory responsibilities. State agencies include SEO, Oil and Gas Conservation Commission and the Department of Environmental Quality. Federal agencies include the Bureau of Land Management and the Forest Service.
Agricultural, Municipal, Industrial and Misc., Domestic and Stock Uses and Ground Water
Out of total of 15,793 active ground water permits inventoried in December 31, 2000 for the Basin Plan, 10,508 of the permits were for WWDC categories other than coalbed methane development.
Reported well depths for the 111 permitted active agricultural wells with production rates greater than 49 gpm ranged from 12 to 4,361 feet and averaged 511 feet. Depths to the top of the "main water bearing zones" in the permit data ranged from 5 to 3,346 feet and averaged 374 feet. The reported "actual yields" of these wells according to the permit data files ranged from 50 to 1,600 gpm and averaged 523 gpm.
There were a total of 76 permitted active municipal wells reported, with production rates greater than 49 gpm. Well depths ranged from 33 to 8,509 feet and averaged 2,056 feet. Depths to the top of the "main water bearing zones" ranged from 21 to 3,220 feet and averaged 1,320 feet. Reported "actual yields" of these wells ranged from 55 to 1,400 gpm and averaged about 324 gpm.
Permitted active industrial and miscellaneous wells with production rates greater than 49 gpm totaled 608. Well depths ranged from 5 to 10,778 feet and averaged 1,748 feet. Depths to the top of the "main water bearing zones" ranged from 5 to 8,430 feet and averaged 1,484 feet. Reported "actual yields" of these wells ranged from 50 to 3,500 gpm and averaged about 240 gpm.
A total of 2,760 permitted domestic wells were reported in the data for the planning area. Domestic well depths ranged from 1 to 10,480 feet and averaged 307 feet. Depths to the top of the "main water bearing zones" ranged from 1 to 6,170 feet and averaged 302 feet. "Actual yields" of these wells ranged from 1 to 1,325 gpm and averaged about 18 gpm.
A total of 6,756 permitted stock wells were reported in the data for the planning area. Stock well depths ranged from 1 to 1,600 feet and averaged 31 feet. Depths to the top of the "main water bearing zones" ranged from 1 to 4,194 feet and averaged 270 feet. "Actual yields" of these wells ranged from 1 to 1,600 gpm and averaged about 14 gpm.
As previously noted, the relative importance of each of the aquifer systems to the various categories of use is summarized in Table III-24. This information together with the maps provided in the "Available Ground Water Determination" technical memorandum, can be used to make further inferences at an initial level, of the relative importance of each of the aquifer systems with respect to the five non-coalbed methane uses.
Impacts on Ground Water and Surface Water Supplies
Impacts to ground water will depend on local geologic and hydrologic conditions in the areas of development. Possible impacts to ground water could include:
Ground water development in any of these areas, irrespective of proposed use, will require detailed investigations that also address the possibility and degree of surface and ground water interconnection. Depending on proposed ground water use, the existing SEO permitting process should be able to address the issue. The Wyoming Department of Environmental Quality, Water Quality Division (WDEQ/WQD) might also be involved in the permitting process with respect to surface / ground water interconnection under provisions of the USEPA Safe Drinking Water Act (Ground Water Under the Direct Influence of Surface Water).
New legislation would be required to establish ground water control zones for any ground water use other than agricultural use experiencing declining water levels or aquifer depletion problems (such as use of aquifers of the Fort Union Formation in the Gillette area for public and domestic water sources). The potential problem in conjunction with coalbed methane development has also been recognized (depletion of aquifers and wells), and responsible state and federal agencies are attempting to address related ground water impacts.
For ease of reference, the main coal seam that is the target of coalbed methane development in the PRSB and within the planning area is referred to as the Wyodak-Anderson coal zone. Methane gas is trapped in micropores and cleat fracture systems within the coal, and is maintained in that state by the natural pressure of ground water. The gas is extracted using wells that are drilled and completed in the coal to remove water and lower the water pressure responsible for holding the gas. The gas moves out of the coal as the water pressure is lowered, and is recovered from the well along with the water.
As previously noted, a total of 6,657 coalbed methane wells were identified in the SEO data query for the Basin Plan. Reported well depths ranged from 29 to 5507 feet and averaged 789 feet. Reported depths to the top of the "main water bearing zones" in the permit data ranged from 78 to 1604 feet and averaged 709 feet. Reported "actual yields" of coalbed methane wells in the permit data files ranged from 0.1 to 200 gpm and averaged 31 gpm.
The BLM has recently used 12 gpm (USDI, 1999, Wyodak Coalbed Methane Project Final Environmental Impact Statement) and 11.1 gpm (USDI, 2000, Wyodak Drainage Coalbed Methane Environmental Assessment) for average production rates of coalbed methane wells in the preparation of environmental impact statements for coalbed methane development within the planning area. The actual ground water production rate will probably be variable throughout the life of each well. As an example, the BLM projected the initial ground water production rates of the wells for the Lighthouse Coalbed Methane Project to be 11 gpm, with an interim average of 7 gpm, and a final rate of less than 3 gpm per well (USDI, 1995, Lighthouse Coalbed Methane Project Environmental Assessment).
The USGS, in cooperation with the BLM and coalbed methane production companies, is conducting multidisciplinary studies in the PRSB in an effort to provide a better understanding of coalbed methane resources and associated water. A USGS report for one of the studies in progress provides preliminary compositional data on water from 47 coalbed methane wells sampled between June, 1999 and May, 2000. Water co-produced with coalbed methane is generally a sodium bicarbonate type. Of the 47 wells sampled by USGS, 32 were located within the planning area and 15 were within the Powder/Tongue River Basin Plan Area. Total dissolved solids content (TDS) of all 47 samples ranged from 270 to 2010 and averaged 850 mg/l. Values of the sodium adsorption ratio ((SAR), which is a relative measure of the suitability of water for irrigation due to sodium content) for the 47 samples ranged from 5.7 to 32 and averaged 12. For comparison, an SAR of roughly 13 would generally be considered the upper limit for field crops in clayey soils.
TDS and SAR of the 32 samples from coalbed methane wells in the planning area ranged from 270 to 1170 (mean 653 mg/l) and 5.7 to 12 (mean 7.85), respectively. TDS and SAR of the 15 samples from coalbed methane wells in the Powder/Tongue River Basin Plan Area ranged from 540 to 2010 (mean 1309 mg/l) and 7.7 to 32 (mean 19.82) respectively. The results of the USGS samples indicated that TDS and SAR of waters in the Wyodak-Anderson coal zone generally increase in the PRSB from south to north and from east to west.
Concentrations of most of the 17 trace elements analyzed by USGS in samples of water from the 47 coalbed methane wells were below detection limits. All of the concentrations for the 17 trace elements were below the maximum contaminant levels of the Primary Drinking Water Standards of the USEPA. The USGS reported that there were no noticeable trends in trace element concentrations in the samples from the 47 wells.
Impacts on Ground Water and Surface Water Supplies
Potential impacts to ground and surface water have been identified by BLM in the preparation of environmental assessments (EA) and environmental impact statements (EIS) for numerous coalbed methane projects in the PRSB within the planning area. Impacts to ground water will depend on local geologic and hydrologic conditions in the areas of coalbed methane development. Possible impacts to ground water that have been identified include:
Future Development
The geology, drilling depths, hydrogeologic characteristics and ground water quality of aquifer systems differ throughout the planning area. All of the aquifer systems in the planning area previously discussed probably have some potential for development. Site specific investigations in conjunction with experience and common sense will be required to determine the opportunities available to develop ground water with wells of sufficient capacity for a specific use within the planning area.
Although there have been considerable investigations in the PRSB within the planning area, there have been few regional assessments of the annual recharge, storage and sustained yield capability of the major aquifer systems both in the PRSB and the planning area. General conclusions regarding ground water development potential of four of the six major aquifer systems in the planning area discussed in this report are summarized below: