Wyoming State Water Plan
Wyoming State Water Plan
Wyoming Water Development Office
6920 Yellowtail Rd
Cheyenne, WY 82002
Phone: 307-777-7626

Wyoming Water Development Office
6920 Yellowtail Rd
Cheyenne, WY 82002
Phone: 307-777-7626


This chapter describes and quantifies the various current uses made of water in the Green River Basin. The estimation of consumptive use of water is valuable for evaluating the overall use of water in the Basin relative to Compact allotments, the location of use relative to water supplies, and the relative amounts of the varying uses when growth is considered. In the following discussions, the terms consumptive use and depletion are often used interchangeably. Both refer to the degree to which a use actually reduces the water available at that point or downstream.
As with all chapters in this final plan report, explicit lists of references are not provided. Instead, all references to reports, documents, maps, and personal communications are maintained in the Technical Memoranda that were prepared during the current planning process. Should the reader desire to review a complete list of references for the information presented in this chapter, the following memoranda should be consulted:
History of Agricultural Practices in the Basin
The Green River Basin of Wyoming has seen the use of water for beneficial agricultural purposes since Territorial days. Irrigated agriculture was the first large user of surface water in the Basin, and it remains the largest water consumer in the Basin and the State. In the 1970 Framework Water Plan (Wyoming Water Planning Program, 1970), the depletion attributable to agricultural uses totaled 267,900 acre-feet, or 90 percent of the total depletion of 296,100 acre-feet in the Basin. In the 1998 Bureau of Reclamation Consumptive Uses and Losses Report (CULR) irrigation depletions in Wyoming's Green River Basin were calculated to average 399,000 acre-feet for the 1986-1990 period, or about 79 percent of Wyoming's estimated average total depletions in the Basin of 502,000 acre-feet per year for the same period. The reason irrigation depletion estimates by the U.S. Bureau of Reclamation (USBR) exceed 1970 Framework Plan estimates, given that irrigated acres have not equally increased, is uncertain but probably is due to revised consumptive requirement values and the construction of reservoirs (e.g. Meeks Cabin and Stateline Reservoirs and Fremont Lake enlargement) which provide late season water. The reason irrigation depletions have reduced as a percentage of total basin use is largely attributable to increases in industrial use.
Historically, irrigation diversions occurred where lands "susceptible of irrigation" lay near a reliable watercourse from which water could be diverted with the least work. Bottomlands were developed first because of the relative ease with which they could be put under irrigation from a ditch. Reservoirs for irrigation water storage (and other uses) were constructed as direct flow rights eventually exceeded the reliable supply of streams. In the words of Elwood Mead in his first report as Territorial Engineer, storage was needed ".to hold the waste water of winter and the surplus from the summer floods..On many of our streams is already felt the pressing need for an auxiliary summer supply which the reservoir would furnish." Oftentimes, reservoir storage was developed in mountainous terrain where water levels in existing alpine lakes could easily be raised by the simple addition of a dike or small dam at the natural outlet. Fremont Lake near Pinedale is such an example.
Because of the relative aridity of the central Green River Basin, irrigation first began along the tributaries leading from the various mountain ranges that fringe the Basin. These included, as examples, the Little Snake, New Fork and Blacks Fork Rivers as well as other tributaries such as the Piney Creeks west of Big Piney, Smiths Fork Creek near Lyman and the Hams Fork. These and smaller streams and creeks not only provided water nearer the source, but headgates located thereon were less susceptible to washout and therefore more easily maintained than those constructed on the mainstem of the Green River. As happened early on in much of Wyoming, tributaries were more quickly developed than the larger watercourses they fed.
Today, the development of irrigation works in the Basin still is defined by these early efforts. The bulk of irrigation in the Basin occurs along tributaries, with the primary agricultural areas located in the Little Snake, Blacks Fork, Big Sandy and New Fork River valleys as well as along the numerous streams emanating from the northwest (Piney Creeks and others).
Storage Water
The majority of water in storage reservoirs within the Green River Basin is permitted for irrigation use. Other users, such as industry, municipal and recreation, are small in comparison. In sub-basins where storage is available, irrigation seasons are often lengthened and summer supplies more reliable than in other areas. For this reason, consumptive use of water for irrigation is typically higher in sub-basins with storage than without. The largest reservoir in the interior of the Basin, Fontenelle Reservoir, is downstream of virtually all of the upper Green River irrigated areas, unavailable to other sub-basins, and therefore is virtually unused for irrigation.
Since the Framework Plan was published, several reservoirs have been constructed in the Basin to assist with irrigation supplies. These include Viva Naughton, Meeks Cabin and Stateline Reservoirs. Meeks Cabin and Stateline provide supplemental irrigation water and are permitted as such. Viva Naughton is permitted for industrial use, but through informal arrangements, releases are made to assist Hams Fork irrigators when supplies are available. Also since 1970, enlargements to Boulder Lake, Fremont Lake and Fontenelle Reservoir have been constructed. In the case of Fontenelle Reservoir, the enlargement only activated previously inactive capacity and was not a physical enlargement. More recently, in 1997, ownership of Middle Piney Lake was transferred to the U.S. Forest Service. Since that time Middle Piney has not been used, or available, for supplemental irrigation supply.
The technical memorandum entitled Major Reservoir Information describes the larger (>1,000 ACRE-FEET) reservoirs in the Basin as well as some smaller ones. Aside from Fontenelle (very little irrigation use), Flaming Gorge (out of state), Viva Naughton (industrial), Kemmerer No. 1 (municipal) and High Savery (yet to be constructed) Reservoirs, the Basin contains approximately 212,000 acre-feet of storage primarily devoted to supplemental irrigation supply. The distribution of this storage within the Basin is uneven, meaning that some irrigated areas are well served by one or several reservoirs above them while others are devoid of storage of any size. The following lists storage available by sub-basin:
| Storage Availability for Agricultural Uses, Green River Basin | |||
| Sub-Basin | Total Storage*, AF | Irrigated Acres | Available Storage, AF/Acre |
| Little Snake | 17,430 | 15,483 | 1.1 |
| Henrys Fork | 6,180 | 15,086 | 0.4 |
| Blacks Fork | 48,808 | 58,007 | 0.8 |
| Hams Fork | 1,198 | 9,942 | 0.1 |
| Big Sandy | 55,943 | 21,318 | 2.6 |
| New Fork | 94,315 | 50,447 | 1.9 |
| Upper Green & Tribs | 6,495 | 119,302 | 0.05 |
| * Where irrigation is included with other uses, total storage is used in this comparison | |||
Irrigated Lands Mapping
Geographic Information System (GIS) mapping of irrigated lands, water rights, diversion points, and irrigation wells allowed for accurate, computerized spatial representation and analysis of current irrigation and acreage for use in modeling, estimation of potential shortages, and future storage development strategies, among other possible uses. The process of developing GIS mapping of all recently irrigated lands and associated water rights within Wyoming's Green River Basin included four phases:
The current mapping project was performed much as it was for the first comprehensive irrigated lands mapping of the Basin, conducted for the Green River Basin Water Plan by the Wyoming Water Planning Program (WWPP) in 1970. Ortho-rectified, infra-red satellite imagery supplemented the aerial photography interpretation completed during the 1970 project. The process involved shifting some irrigated polygons to portray positional accuracy according to the rectified images, and adding or deleting represented lands according to 1997-1999 vintage images.
The water rights attached to each individual irrigated polygon were abstracted from the original records on file in the office of the Wyoming State Engineer and State Board of Control located in Cheyenne, Wyoming. These rights were attached as attributed point features within each associated irrigated polygon. The points of diversion for the irrigation ditches were plotted and attributed, as were all water wells permitted for over 50 gallons per minute.
Final coverages produced include irrigated lands, water rights, points of diversion, and water well permits. Information contained in the irrigated lands coverage includes acreage, irrigation type (irrigated or sub-irrigated), drainage designation, and the U.S. Geological Survey (USGS) 7.5-minute quadrangle in which the lands are located.
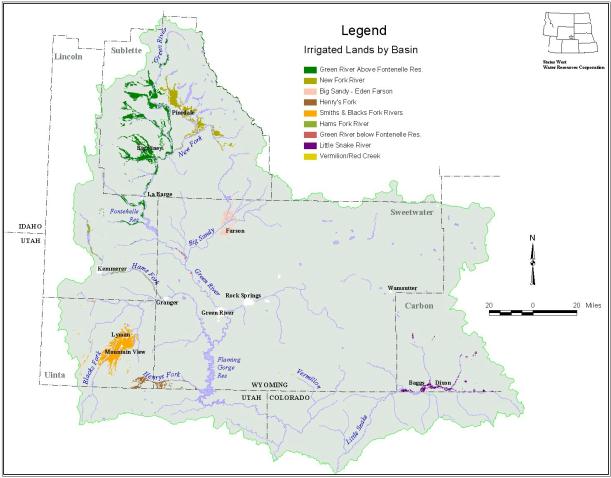
Table II-1 provides a summary of the irrigated acreage calculated from the GIS mapping for each sub-basin, the vast majority of which is irrigated from surface water sources. Figure II-1 illustrates the irrigated lands, by sub-basin.
Table II-1 Irrigated Land Totals by Sub-Basin
| BASIN | 1999 Irrigated Lands | 1999 Sub-Irrigated Lands | 1999 TOTAL |
| (acres) | |||
| Green River Above Fontenelle | 119,302 | 14,068 | 133,370 |
| New Fork River | 50,447 | 2,259 | 52,707 |
| Big Sandy - Eden Farson | 21,318 | 1,188 | 22,506 |
| Henrys Fork | 15,806 | 1,604 | 16,690 |
| Blacks Fork River | 61,337 | 13,836 | 75,173 |
| Hams Fork River | 9.942 | 345 | 10,287 |
| Green River Below Fontenelle Res. | 2,042 | - | 2,042 |
| Little Snake River | 15,483 | 1,477 | 16,959 |
| Vermilion, Red, Salt Wells Creeks | 674 | - | 674 |
| BASIN TOTALS | 295,631 | 34,777 | 330,408 |
Figure II-1 Irrigated Lands by Sub-Basin
click to enlarge
The points of diversion coverage represents actual locations where permits divert from their source. The water well permits coverage represents the approximate location to the nearest quarter-quarter section. Table II-2 provides a summary of permitted irrigated acreage from ground water supplies.
Table II-2 Ground Water Irrigated Lands by Sub-Basin
| BASIN | 1999 Original Supply Active Permitted Acres | 1999 Additional Supply Active Permitted Acres |
| (acres) | ||
| Green River Above Fontenelle | - | 23 (2 wells) |
| Big Sandy - Eden Farson | 122(1 well) | 237 (5 wells) |
| Henrys Fork | - | 198 (9 wells) |
| Blacks Fork River | - | 110 (2 wells) |
| TOTALS | 122 (1 well) | 568 (18 wells) |
Agricultural Uses . Typical Crops
The Green River Basin of Wyoming is primarily a producer of forage for livestock. By far the most common use of irrigation is in the growth of grass hay for harvest and pasture. Alfalfa is grown in areas where the growing season and water supplies allow. Small grains and cash crops are very limited in extent and in no sub-basin do they comprise more than three percent of the irrigated acres.
Water supply and growing season are the factors most often given for the predominance of grasses under irrigation. In this sense, irrigated agriculture is tied very closely to the livestock industry because the only viable use for the hay is as forage. Typically the forage is used by the producers' herds although some is disposed through local sale or export from the Basin.
Consumptive Use
The depletion of water by irrigation is estimated, in general terms, using available water supply, the consumptive demand of the crops irrigated and the number of irrigated acres in the Basin.
To determine the amount of water consumed via irrigation, the concepts of consumptive use (CU) and consumptive irrigation demand (CIR) must be described. In essence, CU describes the total water uptake of a crop, and varies due to several climatologic factors as well as plant stage. CIR is that amount of the total CU needed to be applied by irrigation for a full harvest.
CIR data have been published by month for various crops at seven sites within the Green River Basin proper and at several other sites that lie adjacent to the Basin. Mean values were used for "normal" year CIR values. For those years identified as "dry" or "wet" in the "Study Period Selection" memorandum, the corresponding yearly CIR values were ascribed as applicable for calculating "wet" or "dry" year CIR totals. The resulting CIR values were then applied to the number of irrigation days for each scenario to compute the agricultural depletion associated with that scenario.
In the Green River Basin most irrigators get one cutting of grass hay. As seasonal water supplies and growing conditions allow, irrigators will get a second cutting of grass. Where alfalfa is grown, two cuttings are desirable. Even if a second cutting is not obtained, diversion will usually continue (if water is available) in late summer and fall to fill soil profiles and provide stock water. Late season water is also applied to pasture and fields that livestock will be turned into in the fall, in effect allowing for a "second cutting" achieved not by mechanical harvest but by actual animal feeding. Because of the variation in precipitation, temperature and frost-free days even in normal years, whether or not more than one cutting is obtained is a matter of speculation.
Irrigation Days
To estimate the effects of "supply limited" conditions, diversion and streamflow records in the various sub-basins within Wyoming's Green River Basin were reviewed. The goal of this work was to estimate the number of days water is diverted. For the normal year case, irrigation days describe the number of days water typically is diverted based on diversion records and interviews. These values are not intended to apply to individual headgates, but rather to a sub-basin or tributary as a whole.
In some cases, diversion records indicate sufficient water for irrigation throughout a normal year. However, State Engineer field personnel are almost unanimous in their opinions that many ditches are turned off at traditional times not only for harvest but for consistent operational scheduling. Actual irrigation days were generally reduced to account for this operational reduction, even if occasional diversion records indicate water use.
Agricultural Depletion Estimate
Irrigation depletions are defined herein as the consumption of water applied by man to irrigated crops and include consumption by incidentally irrigated areas. Incidentally irrigated areas may be subirrigated or irrigated by surface return flows from managed fields. While some incidentally irrigated areas may contain willows, small trees or other vegetation, all are treated as crops (grass, in most cases) for consumptive estimates.
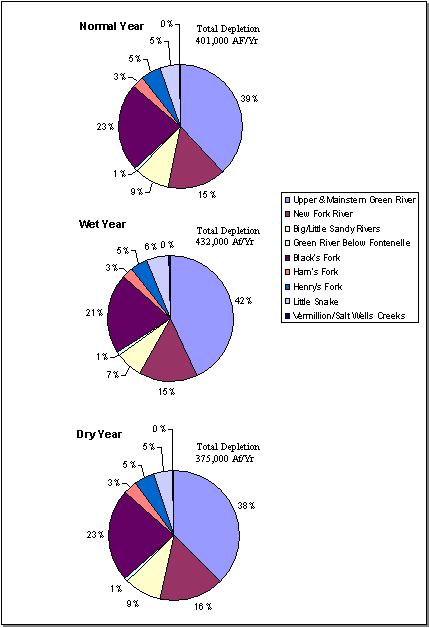
Current normal-year irrigation depletion estimates are 401,000 acre-feet per year, with dry-year and wet-year depletions estimated at 375,000 and 432,000 acre-feet, respectively. Table II-3 shows the agricultural depletion estimate by sub-basin and water supply scenario. These estimates are shown graphically in Figure II-2.
Table II-3 Agrigultural Depletion Estimate by Sub-Basin and Water Supply Scenario
| River Basin/Sub-basin | Irrigated Acres | Normal Year Total, AF | Wet Year Total, AF | Dry Year Total, AF |
| Upper & Mainstem Green River includes Beaver Creek Dry Piney Creek Piney Creeks Green River above Fontenelle Horse Creek Cottonwood Creek Beaver Creek |
121,938 | 139,419 | 170,620 | 129,157 |
| Muddy Creek LaBarge Creek Slate Creek Fontenelle Creek |
11,432 | 12,963 | 15,859 | 12,019 |
| New Fork River includes Boulder Creeks East Fork Muddy Creek, trib. East Fork New Fork and Willow Creek Pine and Pole Creeks Silver Creek |
52,707 | 60,910 | 64,364 | 58,996 |
| Big/Little Sandy Rivers includes Farson/Eden Upper Basin |
22,506 | 36,164 | 30,543 | 34,472 |
| Green River Below Fontenelle |
2,042 | 3,281 | 2,771 | 3,128 |
| Blacks Fork includes Blacks Fork Smiths Fork and Muddy Creek |
75,173 | 93,608 | 90,007 | 87,866 |
| Hams Fork | 10,287 | 12,772 | 12,276 | 11,990 |
| Henrys Fork | 16,690 | 20,659 | 19,851 | 19,397 |
| Little Snake above Baggs |
11,941 | 13,969 | 18,405 | 12,269 |
| below Baggs | 5,018 | 6,547 | 6,759 | 5,471 |
| Vermilion/Salt Wells Creeks | 674 | 741 | 810 | 612 |
| Total | 330,408 | 401,034 | 432,266 | 375,377 |
Figure II-2 Agricultural Depletion by Sub-Basin and Water Supply Scenario
click to enlarge
Municipal and domestic uses are a relatively small but important part of the overall water use in Wyoming's Green River Basin. Municipal and domestic needs are served by both surface and ground water.
Municipal Use
The purpose of this section is to provide water use information for the following 15 cities, towns, and joint power boards (JPB) that supply water to their citizens or customers:
Entities that obtain their primary water supply from surface water, and the sources, are:
Entities with primary water supplies from ground water (and the source aquifer) are:
Methodology
Primarily, information was obtained from the various municipalities through direct communication or from the municipalities' responses to the Wyoming Water Development Commission's (WWDC) 2000 Water Supply Survey. If neither of these sources were available, data from the WWDC's "1998 Water System Survey Report" were used.
Typically, municipalities provide water to customers outside their corporate limits. Therefore, the populations of the service areas are more pertinent than the census information. Further, some of the municipalities or joint powers boards sell water to surrounding water districts. For purposes of this analysis, water sales outside the corporate limits for domestic use are considered municipal water use and are included in the statistics for the various entities.
In addition, municipalities may sell water to industrial water users. For example, the Kemmerer-Diamondville Joint Powers Water Board and the Rock Springs/Green River/ Sweetwater County Joint Powers Water Board sell water to industries outside the corporate limits of their member municipalities. These water sales are not considered municipal water use in this analysis and are addressed as industrial water use.
Conclusions
Table II-4 provides a comparison of reported existing peak day demand with the reported system capacity and the capacity of the direct flow and storage water rights for the 14 suppliers in the Green River Basin (Cheyenne is not considered in this analysis):
Table II-4 Comparison of Existing Use and System Capacity
| (AFD = acre-feet per day) | ||||
| Supplier | Peak Day Demand (AFD) | System Capacity (AFD) | Water Right Capacity (AFD) (Direct Flow or GW) | Storage Rights (AF) |
| Baggs | 0.61 | 0.88 | 1.24 | None |
| Bairoil | 0.77 | 0.92 | 0.92 | None |
| Big Piney | 0.41 | 2.30 | 3.30 | None |
| Bridger Valley JPB | 6.60 | 12.10 | 15.10 | 800 |
| Dixon | 0.08 | 0.97 | 0.97 | None |
| Granger | 0.31 | 3.09 | 13.01 | None |
| KD JPB | 6.14 | 12.82 | 17.07 | 1,770 |
| LaBarge | 1.54 | 1.77 | 2.64 | None |
| Marbleton | 2.15 | 2.20 | 3.60 | None |
| Opal | 0.07 | 0.24 | 0.46 | None |
| Pinedale | 7.67 | 44.20 | 11.48 | 17,4439 |
| RS/GR/SC JPB | 47.20 | 65.00 | 79.30 | None |
| Superior | 0.28 | 1.60 | 5.57 | None |
| Wamsutter | 0.61 | 3.09 | 1.51 | None |
Table II-4 is offered as an indication that the water suppliers have sufficient system and water right capacity to meet their existing demands, as well as the opportunity to meet the demands of some future growth.
Table II-5 describes the monthly and annual depletions by municipal use in the Basin.
Table II-5 Current Level Municipal Surface Water Depletions
(Using 1997-1999 Data, AF/Year)
| City/Town | Pop. | GPCPD | River | Jan. | Feb. | Mar. | Apr. | May | June | July | Aug. | Sept. | Oct. | Nov. | Dec. | Total (AF) |
| Baggs | 300 | 157 | Little Snake | 5.07 | 4.76 | 4.41 | 0.62 | -0.65 | 2.25 | 9.51 | 7.60 | 5.84 | 4.22 | 3.98 | 5.14 | 53 |
| BV JPB | 4,500 | 86 | Smiths/Blacks Fk | 19.12 | 16.41 | 18.83 | 21.30 | 28.73 | 38.82 | 104.49 | 65.16 | 51.71 | 25.51 | 25.19 | 15.89 | 431 |
| Cheyenne | N.A | N.A. | Little Snake trib. | 21.67 | 7.67 | 6.33 | 145.00 | 4132.33 | 9683.00 | 372.00 | 12.33 | 3.67 | 2.33 | 1.00 | 1.00 | 14,388 |
| Dixon | 75 | 274 | Little Snake | 1.40 | 1.38 | 1.38 | 1.29 | 1.72 | 2.69 | 3.74 | 2.72 | 2.30 | 1.55 | 1.55 | 1.31 | 23 |
| Granger | 170 | 294 | Green | 0.62 | 0.47 | 0.58 | 0.94 | 12.67 | 28.24 | 4.68 | 3.12 | 1.94 | 1.01 | 0.78 | 0.93 | 56 |
| KD JPB | 3,950 | 80 | Hams Fork | 14.35 | 12.89 | 13.68 | 10.84 | 23.55 | 43.02 | 87.91 | 68.13 | 32.96 | 14.71 | 14.73 | 17.64 | 354 |
| LaBarge | 490 | 251 | Green | 6.73 | 6.07 | 6.12 | 6.09 | 11.04 | 17.20 | 27.75 | 21.26 | 12.22 | 7.37 | 5.97 | 9.92 | 138 |
| Pinedale | 1,480 | 474 | Fremont Lake | 30.69 | 6.14 | 15.34 | 42.96 | 61.38 | 30.69 | 153.45 | 162.65 | 110.48 | 95.14 | 27.62 | 49.10 | 786 |
| RS/GR/SC JPB | 36,500 | 115 | Green | 133.63 | 121.24 | 149.03 | 122.85 | 464.89 | 707.93 | 984.99 | 823.48 | 505.56 | 225.27 | 212.48 | 246.71 | 4,698 |
| Total | 47,465 | 113 | 233 | 177 | 216 | 352 | 4,736 | 10,554 | 1,749 | 1,166 | 727 | 377 | 293 | 348 | 20,927 |
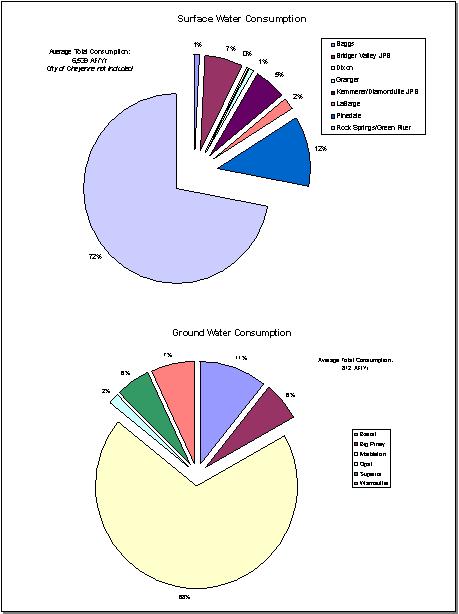
Figure II-3 shows graphically the apportionment of use by municipality. In most cases, water use is based on 1997-1999 data to present the current-day situation. However, water users may have a situation that cannot be described with present information. The Rock Springs/Green River/Sweetwater County Joint Powers Water Board depletes more water than the other thirteen in-basin water suppliers combined. Recently, the Joint Powers Water Board completed a comprehensive expansion of its water treatment and supply facilities, which removed "bottlenecks" in the previous water supply system. Area water officials believe that water use, particularly in the Rock Springs area, may increase 15 percent or more as the water supply system can now meet the true demands of the water users.
Figure II-3 Consumption by Municipality
click to enlarge
It is interesting to note that the largest municipal water user in the Green River Basin is not located in the Basin. The City of Cheyenne presently diverts an average of approximately 14,400 acre-feet of water per year from the Little Snake River Basin to North Platte River Basin, where the water is ultimately exchanged to meet Cheyenne's needs in the South Platte River Basin. The 14 water suppliers located in the Green River Basin deplete approximately 7,350 acre-feet of water per year (including ground water) on an annual basis.
Domestic Use
Domestic water is defined as the water supply for rural homes, subdivisions, commercial establishments, parks, campgrounds, and other smaller water uses, and is typically provided by ground water. Subdivisions or public water supplies that obtain water from municipalities or joint powers boards are not included in this category, as their water use is considered municipal water use. Most of the remote industries in the Basin use a portion of their supplies for domestic use. However, as this water use was included in the estimated industrial water use for the Basin, it is not considered domestic water use.
Existing county populations within the Green River Basin are used as the basis for estimating domestic water use. Because county populations, as provided by the Wyoming Department of Administration and Information, include the service areas of the municipal water suppliers, it is necessary to subtract the populations of the municipal service areas to obtain the rural populations or domestic water users.
The total estimated current population of the Green River Basin in Wyoming is approximately 61,100, of which about 49,600 reside in municipal service areas. The estimated existing population of the areas outside of the service areas of municipal water suppliers is therefore approximately 11,500. For purposes of this estimate, it is assumed that this is the population that is served by domestic groundwater wells or independent public water supply systems. If it is assumed that this population consumes between 150 and 300 gallons per capita per day, the resulting estimated total domestic water use would range between 1,940 and 3,880 acre-feet per year in the Green River Basin.
The purpose of this section is to describe water uses by the major industries in the Green River Basin. Industries that obtain their primary water supply from surface water are electric power generation, soda ash production, and other miscellaneous smaller users. The industries that obtain their primary water supply from ground water are coal mining, uranium mining, and the oil and gas industries.
Methodology
Existing Industrial Surface Water Use
Information was obtained from the various industries through direct communication. However, many of the soda ash industries did not have records of their water use. Therefore, some estimates had to be gleaned from anecdotal information. For example, apparently there is a "rule of thumb" that it takes 200 gallons of water to produce one ton of soda ash. All of the soda ash facilities in the Green River area, with the exception of Solvay Minerals, Inc., have on-site power plants. It was estimated that the on-site power plants used an additional 250 gallons of water to generate the power necessary to produce one ton of soda ash.
All of the industries, with the exception of the Naughton Power Plant, have zero discharge facilities. Therefore, the depletions or impacts to surface water are equal to the amount of water diverted. Depletions for the Naughton Power Plant were calculated by deducting the estimated return flow from the estimated diversions. Soda ash producers typically reported water demands to be relatively constant throughout the year.
Existing Industrial Groundwater Use
There is very limited available information regarding industrial groundwater use. Industrial use of ground water is typically short-term and intermittent in nature. The best available information relating to industrial groundwater use is water rights issued by the Wyoming State Engineer's Office. Therefore, tabulations of water rights in each of the water districts in the Green River Basin were used as the basis for estimates of existing industrial groundwater use.
Conclusions
Existing Industrial Surface Water Use
Power plants are the largest industrial water users in the Green River Basin. The Jim Bridger and Naughton Power Plants, both owned and operated by Pacificorp, use or deplete approximately 47,800 acre-feet of water per year. Both power plants enjoy the security of storage water. Pacificorp maintains a contract for storage water from Fontenelle Reservoir for use at the Jim Bridger Power Plant during times of severe drought. Pacificorp owns and operates Viva Naughton Reservoir, which serves as the primary supply for the Naughton Power Plant. In both plants, water is used to produce steam for power production and is used in the cooling processes. The majority of the water is discharged through the cooling towers or lost through evaporation ponds. Some water is used for dust abatement and domestic use.
There are five (5) major producers of soda ash in the Green River Basin. FMC Granger, FMC Westvaco, General Chemical, OCI Wyoming, and Solvay Minerals, Inc. produced approximately 11.7 million tons of soda ash in 1999, which represents approximately 37 per cent of the world's demand. At current levels of production, these five producers deplete approximately 17,900 acre-feet of water from the Green River and, collectively, are the second highest industrial water users in the Green River Basin. Water is used in processing trona, and is also used for dust abatement and domestic supplies as well as power cogeneration discussed previously. All of the water at the facilities is discharged through cooling towers and evaporated from holding ponds.
Other industrial facilities in the Basin, including Church & Dwight, Exxon's Shute Creek plant, and FS Industries (which produce baking soda, natural gas, and chemical fertilizer, respectively) combine to deplete an additional 800 acre-feet per year.
Table II-6 lists the estimated monthly and annual water use (depletions) for the ten largest users. The existing estimated industrial surface use for the ten major users is approximately 66,500 acre-feet per year.
Flows of the Green River are stored in and regulated through Fontenelle and Flaming Gorge Reservoirs. Both of these dams have hydroelectric generating facilities. The production of hydropower is basically considered a non-consumptive use of water other than the associated evaporation losses which are considered in other sections of this report.
Fontenelle Reservoir as an Industrial Water Supply
The water right for Fontenelle Reservoir indicates its primary purposes are irrigation, domestic, industrial, municipal, stockwatering, fish and wildlife and recreation; and when not required for the primary purposes, storage water can be used for power generation, the secondary purpose. However, the major existing benefits of Fontenelle Reservoir relate to industry.
The construction of Fontenelle Dam was completed in December, 1967, under water right Permit No. 6629 Res. In 1962, the State of Wyoming contracted with the Bureau of Reclamation for 60,000 acre-feet of the active capacity. In 1974, the State of Wyoming again contracted with the Bureau of Reclamation for 60,000 additional acre-feet of active capacity, thereby increasing its total interest in Fontenelle Reservoir to 120,000 acre-feet.
In the 1974 contract, 5,000 acre-feet was designated for the Seedskadee Wildlife Refuge. The United States reserved 65,000 acre-feet of capacity for its uses, subject to provisions that the Bureau of Reclamation would not compete with the State of Wyoming in the water market. This contract also required the United States and State of Wyoming to ensure operations that would provide for the maintenance of 50 cubic feet per second (cfs) downstream in the Green River at the USGS streamgage near Green River, Wyoming.
Table II-6 Average Monthly Industrial Water Use
| Acre-feet | |||||||||||||
| Facility | Jan. | Feb. | Mar. | Apr. | May | June | July | Aug. | Sept. | Oct. | Nov. | Dec. | Total |
| Jim Bridger Power Plant | 1,900 | 1,900 | 2,850 | 2,850 | 3,600 | 3,750 | 3,860 | 3,860 | 3,100 | 2,850 | 1,900 | 1,900 | 34,320 |
| Naughton Power Plant | 1,100 | 1,000 | 1,100 | 1,100 | 1,200 | 1,200 | 1,200 | 1,200 | 1,100 | 1,100 | 1,100 | 1,100 | 13,500 |
| FMC Granger | 250 | 250 | 250 | 250 | 250 | 250 | 250 | 250 | 250 | 250 | 250 | 250 | 3,000 |
| FMC Westvaco | 500 | 500 | 500 | 500 | 500 | 500 | 500 | 500 | 500 | 500 | 500 | 500 | 6,000 |
| General Chemical | 300 | 300 | 300 | 300 | 300 | 300 | 300 | 300 | 300 | 300 | 300 | 300 | 3,600 |
| OCI Wyoming | 250 | 250 | 250 | 250 | 250 | 250 | 250 | 250 | 250 | 250 | 250 | 250 | 3,000 |
| Solvay | 190 | 190 | 190 | 190 | 190 | 190 | 190 | 190 | 190 | 190 | 190 | 190 | 2,280 |
| Church & Dwight | 15 | 15 | 15 | 15 | 20 | 20 | 25 | 20 | 20 | 20 | 15 | 15 | 215 |
| Exxon Shute Creek | 1 | 1 | 1 | 1 | 2 | 2 | 2 | 2 | 1 | 1 | 1 | 1 | 16 |
| FS Industries | 110 | 70 | 60 | 100 | 50 | 10 | 10 | 10 | 20 | 40 | 50 | 30 | 560 |
| Total Average Monthly Use | 4,616 | 4,476 | 5,516 | 5,556 | 6,362 | 6,472 | 6,587 | 6,582 | 5,731 | 5,501 | 4,556 | 4,536 | 66,491 |
Presently, the State of Wyoming, through the Wyoming Water Development Commission, has allocated 46,550 acre-feet of its entitlements to Fontenelle water through the following water supply or readiness to serve contracts: Jim Bridger Power Plant (35,000 acre-feet per year), FS Industries (10,000 acre-feet per year), Church and Dwight (1,250 acre-feet per year), and Exxon, USA (300 acre-feet per year).
Existing Industrial Groundwater Use
Overall groundwater use by industry in the Basin is estimated at 1,575 acre-feet annually. Coal mines primarily use water for dust abatement. Black Butte Coal Company and Bridger Coal Company provide coal to the Jim Bridger Power Plant. Kemmerer Coal Company provides coal to the Naughton Power Plant. These companies have several permits for groundwater use. The water generally comes from wells or as a by-product of the mining operations. The Bridger Coal Company obtains water from the Jim Bridger Power Plant for domestic and fire protection use. The Kemmerer Coal Company obtains domestic and fire protection water from the Kemmerer/Diamondville Joint Powers Board.
The uranium industry is presently idle in the Green River Basin. Kennecott Uranium Company holds water rights for several groundwater wells at its inactive mine and processing facility in the Great Divide Basin. The water was used in the process that extracted the uranium from the ore.
Oil and gas companies often secure water rights to use water for on-site purposes, such as producing drilling mud and dust abatement. The actual water use at the wells during the drilling process is typically short term.
Recreational uses of water are important and generally non-consumptive. Uses include boating, fishing, swimming and waterfowl hunting, among others. While consumption of water is usually not involved, the existence of a sufficient water supply for a quality experience is important. This section describes current water-based recreational opportunities in the Basin, whether current use rates exceed capacities for use, and provides quantitative information wherever possible.
Boating
Many of the Basin's rivers and lakes are destinations for recreationists desiring to boat, water-ski or float (either whitewater, scenic or fishing) using watercraft. Areas heavily used by watercraft include the large lakes and reservoirs with boat ramps, and the larger rivers (e.g. the Green River Proper and the New Fork River). Smaller craft such as rafts and canoes do not require boat ramps and have access to more bodies of water and reaches of river. Boating is considered a non-consumptive use of water in that it occurs at lake levels and river flows determined by other uses.
Little quantitative data exist on the numbers of watercraft using these facilities and whether numbers approach or exceed the carrying capacity of the water body used. The Bureau of Reclamation has indicated that, while not the rule on Wyoming waters, a ceiling capacity of one boat per ten surface acres of water is used elsewhere to measure use versus capacity. Unfortunately, current actual boating numbers on Green River Basin waters are generally not available from any of the land management agencies contacted.
One area where boating capacity is of concern relates to current use of the Green and New Fork Rivers. Recently receiving heavy pressure, these rivers are currently under study in areas where the managing agency maintains developed recreation sites and/or boating access. The Green River at Warren Bridge and also below Fontenelle Dam are examples of locations where heavy use is being evaluated.
A quality boating experience requires a water level (in lakes) or flow rate (in rivers) sufficient to support the reason for boating, whether it be fishing, water-skiing or some other sport. In this context, future water development projects must be evaluated for their effect on such levels, and due to state and federal regulations will to some extent be designed and operated based upon recreational considerations.
Fishing
Fishing is a major water-based recreational activity pursued in the Basin. From brook trout in tiny creeks in the Wind River and Wyoming Ranges to lake trout in Flaming Gorge Reservoir, fishing brings many visitors and residents to the region. As in boating, fishing is a non-consumptive use of water.
The State of Wyoming classifies trout streams under five designations:
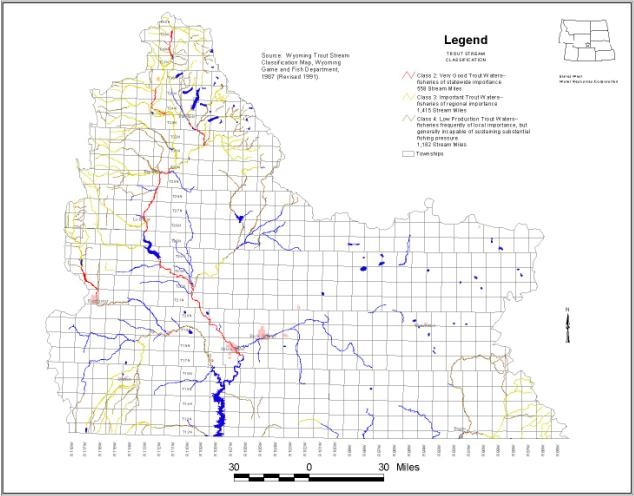
Figure II-4 shows classifications of streams under this system within the Green River Basin. Interestingly, there exist no waters currently classified as Class 1 in the Basin. The only Class 2 streams in the Basin are certain segments of the main stem of the Green River above Flaming Gorge, and a segment of the New Fork River in the vicinity of Boulder. Nonetheless, the Green River Basin is considered by many to provide excellent fishing opportunities in its lakes, streams, rivers and backcountry areas.
Figure II-4 Trout Stream Classification
click to enlarge
The Wyoming Game and Fish Department (WGF) maintains the most complete database on fisheries and fisherman use in the State. In response to a request for fishing activity in the Green River Basin, the WGF provided the most recent estimate of annual standing water angling pressure. The breakdown by type of standing water is given below.
| Recent Fishing Activity, Green River Basin: Angler Days by Standing Water Type | |||
| Pinedale Region | Green River Region | Total | |
| Unsuitable | 27 | 0 | 27 |
| Natural Alpine Lake | 59,286 | 2,974 | 62,260 |
| Alpine Reservoir | 7,875 | 1,029 | 8,904 |
| Natural Lowland Lake | 16,875 | 0 | 16,875 |
| Lowland Reservoir | 547 | 392,626 | 393,173 |
| Trout Farm Pond | 487 | 3,164 | 3,651 |
| Mixed Farm Pond | 0 | 680 | 680 |
| Non-Trout Farm Pond | 0 | 1 | 1 |
| Source: Mark Fowden, WGF, April 2000 | |||
From angler surveys in 1979, 1985 and 1991, stream angling data were provided for Region 4, which included the Bear River Basin. Upon review of the responses for 1985, it was determined that approximately 91 percent of the total is attributable to stream fishing in the Green River and its tributaries, leaving about nine percent occurring in the Bear River Basin. Absent other data, this factor was applied to subsequent totals which also included Bear River data as a correction factor to more properly represent the Green River Basin only. Stream angler days are described as follows:
| Fishing Activity, Green River Basin: Stream Angler Days | ||
| Region 4 | As Corrected for Green River Basin Only | |
| 1979 | 359,145 | 326,800* |
| 1985 | 238,153 | 217,142 (actual) |
| 1991 | 281,691 | 256,300* |
| * Stream Angler numbers have been reduced by 9% to remove Bear River Basin effects. | ||
The WGF also has published a document entitled: A Strategic Plan for the Comprehensive Management of Wildlife in Wyoming, 1984-1989. This document gives total stream and lake sport fishing data in fisherman-days for the entire state as divided into five regions. Region 4 includes the Green, Bear and Little Snake River drainages. While the Bear River Basin numbers are included, this basin is relatively quite small in comparison to the Green and Little Snake basins, both in geographic extent and in availability of fishable waters. Therefore, numbers provided for Region 4 have been reduced by nine percent as described above.
Not only are utilization (demand) data given, but this Strategic Plan document also estimates "supply" or "biological supply" of fishing opportunity available to the angler. As defined in the Strategic Plan, "Supply is based on present regulations, present stocking practices and the standards for success and size of fish which are present under 'Management Framework.'" For 1988, the most recent year for which data are given in the report, supply and demand numbers are as follows:
| Fishing Activity, Supply vs Demand, 1988 | |||
| Fisherman-Days or % | Supply on Public Lands or with Public Access | % on Public Lands or with Public Access | Total Supply |
| Streams | 212,700* | 51.75% | 411,000* |
| Lakes and Reservoirs | 1,122,817 | 94.73% | 1,185,235 |
| Total | 1,335,517 | 82.87% | 1,596,235 |
| Fisherman-Days | Resident Demand | Nonresident Demand | Total Demand |
| Streams | 302,000* | 73,100* | 375,100* |
| Lakes and Reservoirs | 274,509 | 146,968 | 421,477 |
| Total | 576,509 | 220,068 | 796,577 |
| Source: A Strategic
Plan for the Comprehensive Management of Wildlife in Wyoming,
1984-1989. *Stream Angler numbers have been reduced by 9% to remove Bear River Basin effects; Lake Angler numbers were not. | |||
The primary limiting factor for stream fishing is the availability of public access. Other areas of potential use limitations are currently under evaluation by the Bureau of Land Management (BLM) and Seedskadee National Wildlife Refuge. Both of these agencies have experienced significant increases in commercial use by outfitters. The BLM, in concert with other agencies, has been involved in a study entitled "Green River Corridor Interagency Management Plan," which is intended to address use of the Green River in Wyoming from its headwaters to Flaming Gorge. In the Green River Basin above Fontenelle Reservoir, public access points are few and provide virtually the only access to the rivers which otherwise are bordered largely by private lands.
The resulting analysis of fishing use data indicates that overall utilization remains below the capacity of the resource, although stream fishing experiences some limitations due to access. Recent WGF planning documents have moved away from publishing "supply versus demand" analyses, so current utilization numbers are unavailable. Indications are, however, that the Green River Basin maintains a sufficient fishery resource for current and near future high-quality fishing experiences.
Waterfowl Hunting
The harvest of migratory waterfowl is a recreational pursuit affected by the presence or absence of water. Wetlands and open water are needed for breeding, nesting, rearing, feeding and isolation from land-based predators. In the Green River Basin of Wyoming, waterfowl hunting is pursued where sufficient local or migratory populations are available. The two most heavily hunted areas are the Seedskadee National Wildlife Refuge and the Farson-Eden-Big Sandy area. The Green and Little Snake River Basins are located in the Pacific Flyway.
Harvest objectives are not currently used (post-1993), because harvest is taken into account in the setting of season length and bag limits by the U.S. Fish and Wildlife Service (USFWS). In effect, the desired harvest is a prospective number using past hunter success, population effects, and regulations in concert with current-year populations. With current duck populations and hunting pressure, it appears there is a sufficient resource to provide a quality duck hunting experience now and in the near future, with the existing water resources of the Basin.
In like fashion, goose hunting seasons and bag limits are set under guidelines from the USFWS, although states have more flexibility in setting bag and possession limits. And like duck populations, goose populations are strong and increasing. Again, because of the recent upward trends in populations, it appears there is a sufficient resource to provide a quality goose hunting experience now and in the near future, with the existing water resources of the Basin. However, because the Rocky Mountain Population nests and breeds locally, it is possible for local water development projects to adversely affect local goose populations (and hunter success) if breeding and nesting sites suffer net loss, even as continental populations continue to rise.
Wild and Scenic River Candidates
The 1996 Green River Resource Area Resource Management Plan, administered by the BLM, studied a number of river segments in the Green River Basin for possible designation under the Wild and Scenic Rivers Act. Initially, 183 waterways or waterway segments were reviewed for eligibility. Of these, 175 were found ".not to have any outstandingly remarkable values and were dropped from further consideration."
The remaining eight waterways under consideration included the Red Creek Unit, Currant Creek Unit, Pacific Creek, North Fork of Bear Creek, Canyon Creek, and the Green and Big Sandy Rivers. These were reviewed for suitability for classification under the system. However, no segments in the Green River Basin were ultimately determined suitable for inclusion. The primary reasons given for the "Not Suitable" determination included landowner conflicts, inability to manage the segment, lack of interest for designation, and potential use conflicts.
The 1999 Upper Green Landscape Assessment (published by the Bridger-Teton National Forest) lists the entire segment of the Upper Green River, from its source to the Forest Boundary, as a Study River for Wild and Scenic designation. The river is considered as eligible for designation as a Wild River above Green River Lakes, and as a Scenic River from Lower Green River Lake to the Forest Boundary. Two tributaries are also eligible as Wild Rivers: Tosi Creek and Roaring Fork Creek. Suitability determination information was unavailable, and formal designation has not yet been made.
No rivers on the Medicine Bow . Routt National Forest (Hayden District, east of Baggs/Dixon in the Little Snake River drainage) were determined eligible in the 1985 Forest Plan. However, segments of local importance are still under study and may be identified for eligibility in the near future. If any stream segments are determined eligible for designation, the Forest does not plan to immediately pursue suitability evaluation.
Wyoming State Parks and Historic Sites
There are no State Parks in the Green River Basin or the Great Divide Basin. The only State Historic Site (SHS) in either basin is at Fort Bridger, just west of the Town of Lyman. Data collected by the former Division of State Parks & Historic Sites (under the former Department of Commerce), however, does provide insight into travel habits and desires of recreationists visiting state sites, which is of value if extrapolated to tourist destinations in general.
The Visitor Use Program for 1993-1997 contains useful information concerning site visitation. Interestingly, for the 1993-1997 period, Fort Bridger SHS averaged 87,708 visitors per year, more than any other SHS. This value is also more than the attendance at 9 of 14 (64 percent) of the State Parks. The bulk of the visits occur in the June through September period.
The 1997 Wyoming State Parks and Historic Sites Visitor Survey, compiled by the University of Wyoming, Survey Research Center, provides additional information. About 86 percent of all visitation (to all parks and historic sites) occurs in the months of June, July and August, with attendance in each of those months almost equal. Slightly over half the visitors are first-time visitors. Approximately one in four visitors is traveling with a boat or canoe, indicating some water-based recreation is intended, either at that location or elsewhere on that particular trip. Approximately 58 percent of the visitors are from out of state.
Previous studies have estimated the amount of water designated for or consumed by various environmental uses. These include but are not necessarily limited to instream flow water rights permitted by the Wyoming State Engineer, minimum reservoir pools, instream bypasses designated to enhance fisheries and wildlife habitat, wetlands, direct wildlife consumption, evaporation from conservation pools and maintenance of riparian areas. Environmental uses downstream on the Green and Colorado Rivers must also be considered.
Instream Flows
In 1986, the State of Wyoming enacted legislation defining "instream flow" as a beneficial use of water, and stipulated how instream flow water rights would be filed, evaluated, granted or denied, and ultimately regulated. The legislation is codified within Wyoming Statutes at Section 41-3-1001 to 1014. Instream flow rights are filed with the Wyoming State Engineer's Office, held by the Wyoming Water Development Commission, and managed by Wyoming Game and Fish.
The law allows for instream flow water rights to be filed and granted on unappropriated water originating as natural flow or from storage in existing or new reservoirs. For natural flow sources, the flow amount is defined as the minimum needed to "maintain or improve existing fisheries." The language relating to stored water is slightly different, defining the minimum needed to "establish or maintain new or existing fisheries." Generally speaking, instream flow is considered a non-consumptive beneficial use.
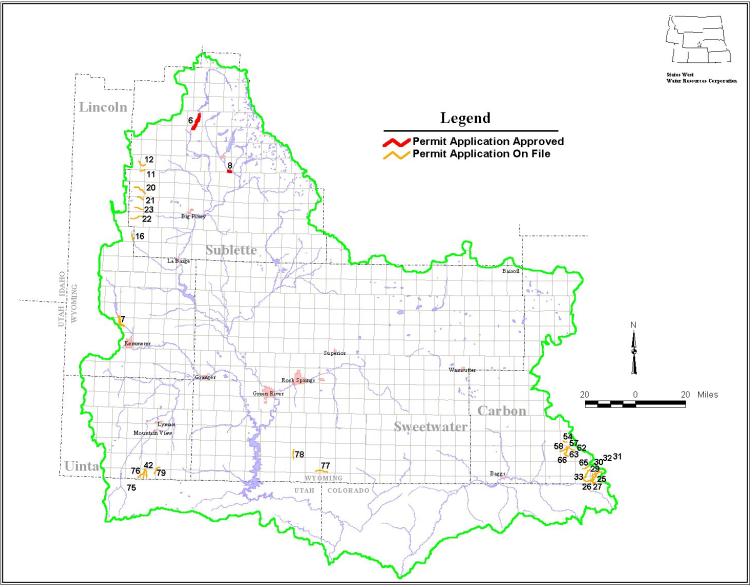
In the Green River Basin (including the Little Snake River Basin), there are currently 34 instream flow applications on file. Two of these filings have been granted permits as of the date of publication of this report. All 34 of these filings are tied to natural flow, although two are influenced by reservoirs above the segments. Instream flow segments are shown on Figure II-5.
Figure II-5 Instream Flow Segments
click to enlarge
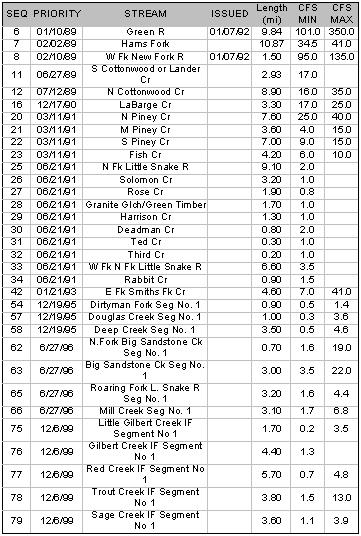
The two pending applications influenced by reservoirs include one on the Hams Fork (TF No. 26 3/332), where water is delivered from Viva Naughton Reservoir, and one on the East Fork Smith Fork (TF No. 28 2/84) below Stateline Dam (which is in Utah). Both of these applications are filed for water that enters the stream by virtue of the reservoir above them, and not on storage water in the reservoir.
The two permits that have been issued are No. 6IF on the Green River near Warren Bridge and No. 7IF on the West Fork of the New Fork River. Many of the remaining yet-to-be-granted filings are on streams containing Colorado River cutthroat trout, and are intended to help protect that species, which is being considered for listing as an endangered species under the federal Endangered Species Act.
Cutthroat Trout Management
The Wyoming Game and Fish Department has instituted a management program designed to protect and enhance the natural populations of Wyoming's native cutthroat trout. In the Green River Basin of Wyoming, this includes the native Colorado River cutthroat trout. Management of the trout is intended to prevent the species from becoming listed as threatened or endangered. An early strategic plan included the following:
To achieve these strategic goals, a management plan with seven activities are being implemented:
These activities have been undertaken and show promise for protecting the native trout. According to Game and Fish personnel, Colorado River cutthroat trout occupy 23 percent of the streams in the Green River Basin in reaches totaling 19 percent of the stream miles in the Basin. Work involved in protecting these native fish is considered non-consumptive (of water), although the use of instream flow water rights and habitat improvement will affect future water development activities in the immediate vicinity of such work. Protection of important native fish populations is an example of water-related work that can be accomplished without depletion, and shows that water resources can exhibit strong economic value (e.g. recreation) without consumptive use.
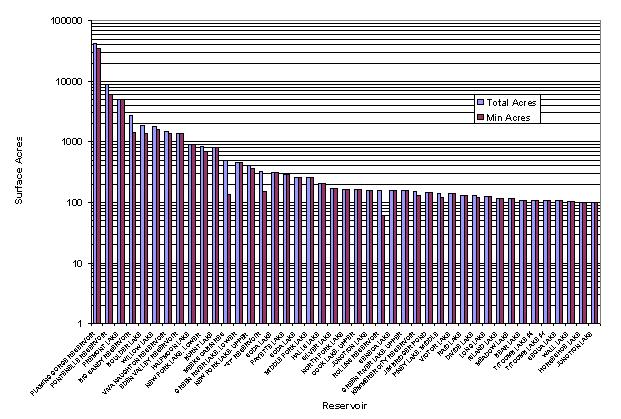
Reservoir Minimum Pools
Several reservoirs in the Basin have storage permitted for a variety of environmental uses. These uses, as they appear on the water rights, include fish, and fish and wildlife. Recreational uses defined on permits can be considered environmental to the extent that water in storage for recreational purposes, and not released for other consumptive or nonconsumptive uses, can be beneficial, in an environmental sense, for fish habitat and wildlife consumption. Reservoirs with permitted capacity for stock water similarly serve a dual environmental function. The reservoirs with fish or fish and wildlife uses or pools listed in their permitting documents include Boulder (1,621 acre-feet), High Savery (4,955 acre-feet), as well as three other reservoirs with an unsegregated portion of their total storage devoted to fish and wildlife (or similar use): Big Sandy, Flaming Gorge, and Fontenelle.
The Wyoming Game and Fish Department has provided data describing recommended lake or reservoir levels (given as surface acreage) for fish population purposes. These data are presented in Figure II-6 for water bodies of 100 surface acres and larger.
Figure II-6 WGF Recommended Water Levels
click to enlarge
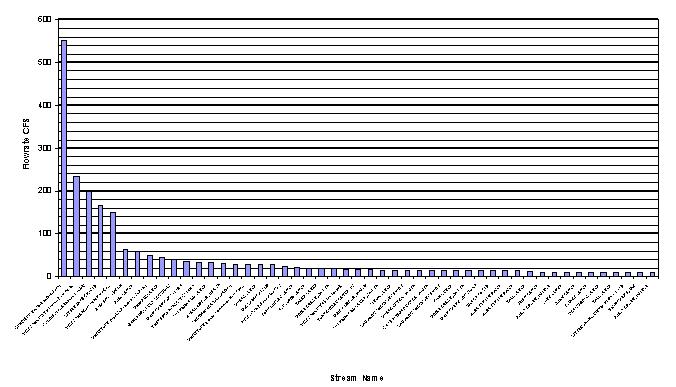
Maintenance Flows
The Wyoming Game and Fish Department has also provided data on recommended maintenance flows for moving water. These flows are what the Department views as necessary to support game fish populations in the late season, low flow months. Figure II-7 shows these flows for streams and rivers in the Basin where such flows are 10 cfs or greater.
Figure II-7 WGF Recommended Maintenance Flows
click to enlarge
Instream Bypasses
Only three reservoirs in the Green River Basin have minimum flow bypasses included in their permitting documents. These include Fontenelle (50 cfs at the town of Green River), Meeks Cabin (10 cfs) and Stateline (7 cfs) Reservoirs.
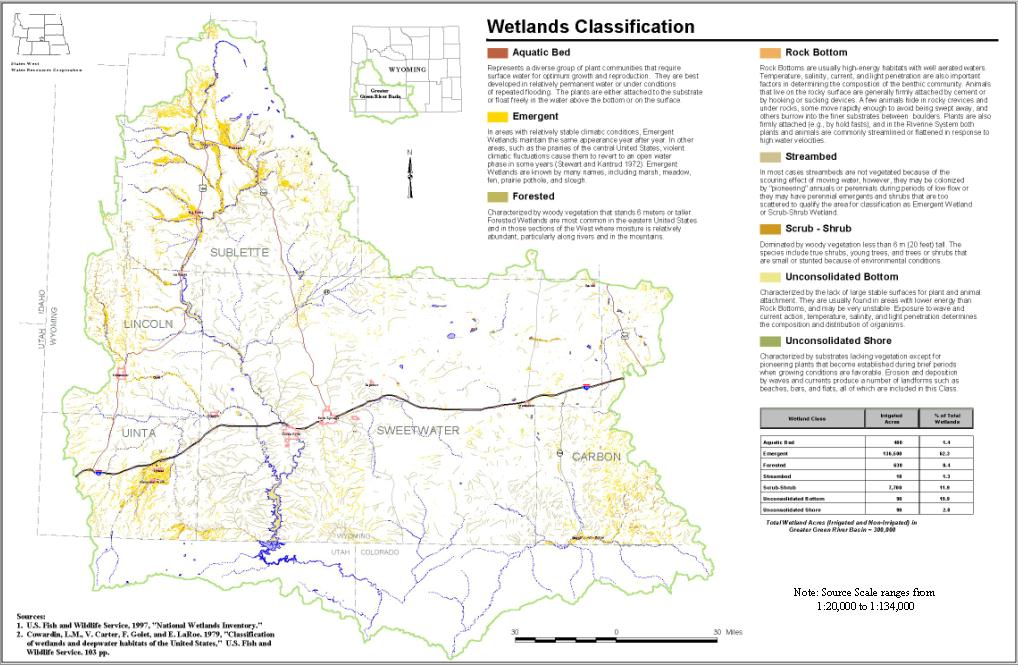
Wetlands Mapping
Wetlands are lands transitional between terrestrial and aquatic systems where the water table is usually at or near the surface or the land is covered by shallow water. For purposes of classification, wetlands must have one or more of the following three attributes:
The National Wetlands Inventory (NWI) coverage for the Green River Basin is used to describe wetlands for this report. The wetlands mapping was overlaid on the GIS Irrigated Acreage coverage used in the Green River Basin plan. More than half of the defined irrigated acreage is classified in the wetlands mapping as "Emergent." This may be due to the scale of the wetlands mapping, which varied between 1:20,000 and 1:132,000. It may be due also to the fact that the Emergent wetlands classification includes meadows, among others, and that almost all of the irrigated acreage in the Green River Basin is meadow composed of emergent plant types. Figure II-8 shows NWI mapping for the Basin.
Figure II-8 National Wetlands Inventory Mapping
click to enlarge
Wetlands in the Green River Basin provide significant nesting and breeding habitat for local populations of ducks and geese. In fact, the Green River Basin is an important contributor to Wyoming's status as one of the largest waterfowl resident states in the western U.S., with total duck breeding pairs more than double the totals in Nebraska and Colorado combined for 1999. These local birds are the primary target of waterfowl hunters, and as such their reproductive success is important to future environmental and recreational pursuits. An area of future environmental concern, or cause for mitigation, is therefore the potential of destruction of breeding and nesting habitat for waterfowl. In the Green River Basin, areas near Farson and Eden and the Seedskadee National Wildlife Refuge are the most heavily hunted for waterfowl.
Seedskadee National Wildlife Refuge
Created initially as environmental mitigation following construction of Flaming Gorge and Fontenelle Reservoirs by the Bureau of Reclamation, Seedskadee National Wildlife Refuge (NWR) has become a popular destination for fishermen, hunters, sightseers, and birdwatchers. The Refuge contains 26,037 acres of land and covers over 36 miles of the main stem of the Green River from the upper boundary (approximately 2.5 miles below the CCC Bridge) to just below the "Big Island," approximately 20 miles northwest of Green River. While originally planned for protection and production of waterfowl, the Refuge has seen more intensive management of big game, fisheries, and other fauna and flora in recent years.
Seedskadee NWR provides significant water-related environmental benefits in an otherwise arid region. Habitats available on the refuge include riverine and backwater aquatic areas, wetland and riparian areas, and drier grassland/shrubland communities. The source of water for these uses is the Green River proper with contributions from the Big Sandy River. In a 1974 contract between the State of Wyoming and the Bureau of Reclamation, 5,000 acre-feet of reservoir water was designated for the Refuge. In addition, Seedskadee uses older pre-refuge irrigation works to distribute water for wetland development and maintenance, and benefits from 115 cfs of direct flow rights held by the U.S. Bureau of Reclamation.
With little use between Fontenelle Reservoir and the Refuge, the Green River provides a relatively reliable water supply to Seedskadee. Although minimum flows are to remain above 50 cfs (at the town of Green River) below Fontenelle, actual flows are historically much larger. According to the Bureau of Reclamation, August to April releases are typically 1,200 to 1,400 cfs with higher flows passed in the spring flooding season.
Consumption of water on the Refuge is limited to evapotranspiration from the wetland and riparian areas. Currently, the Refuge has no plans to create significant new wetlands, although maintenance of existing wetlands and reestablishment of pre-existing wetlands will continue. Currently there are approximately 335 acres of wetland habitat and 1,394 acres of riverine habitat on the Refuge.
Direct Wildlife Consumption
It was previously estimated that 100 acre-feet per year of water originating as ground water is consumed by wildlife. This estimate was revisited during the current study and it was concluded that this amount is not unreasonable. An earlier estimate of wildlife use of surface water of 400 acre-feet per year was revisited with WGF personnel for the current plan. No change to this value resulted.
Evaporation
Under the Bureau of Reclamation's "Consumptive Uses and Losses Report," a document prepared every five years as required by the Colorado River Basin Project Act of 1968, man-made losses such as evaporation from constructed or enlarged reservoirs are charged against the State's Compact allocation. Some authorities consider that part of calculated evaporation losses are "charged" to environmental uses, especially if a water body exists for the primary purpose of serving environmental needs. However, administratively, these amounts are calculated without regard to type of use. A more detailed discussion of evaporation losses is provided in Section G of this chapter.
Maintenance of Riparian Areas
In recent years the value and maintenance of riparian zones along stream corridors has been the subject of considerable study. Several interrelated topics emerge from this work, including the value of riparian zones for both aquatic and terrestrial wildlife, the ability of riparian zones to assist in maintaining base flows in streams, and the value of riparian areas in controlling erosion.
The United States Department of the Interior, Bureau of Land Management (BLM) has published several documents relating to riparian area management. These guides, however, are qualitative and do not provide quantitative estimates of, for example, potential storage capacity increase due to improved riparian condition. Case study histories exist of several projects where riparian improvement has resulted in improved base flow conditions in the subject streams.
Other recent studies provide a more quantitative assessment of the hydrogeologic response of an alluvial stream system to riparian improvements. Studies of Muddy Creek, which is tributary to the Little Snake River, reported phreatic surfaces 15 to 20 feet below ground in degraded riparian areas while the water surface was only a few feet below the surface in improved riparian zones. Instream structures reportedly added approximately 0.4 acre-feet of bank storage per thousand feet of channel in the improving riparian areas.
Another report used a groundwater model to assess the storage capacity of degraded, improving and improved riparian zones. This study also noted that while ground water levels are within a few feet of the ground surface in improved riparian areas, they may be tens of feet deeper in degraded reaches.
Other work did not look at riparian areasper se, but rather at the water budget associated with flood irrigation along the New Fork River in Sublette County, Wyoming. These findings reflect less the intentional management of water for riparian improvement, and more the actual result of flood irrigation in a typical setting. The study stated: "A large percentage of the diverted water returns to the stream system so there is no loss of beneficial surface flow to the downstream users and the release of stored water during the low flow winter months will help maintain a constant supply of water to the channel system. The saturated aquifer acts as a 24,000 acre-feet underground reservoir that releases most of this volume to the downstream users during the same irrigation season, without excessive evaporation losses."
Recovery Implementation Program for Endangered Fish Species
Section 2(c) (2) of the Endangered Species Act states: "the policy of Congress is that Federal agencies shall cooperate with State and local agencies to resolve water resource issues in concert with conservation of endangered species." In 1988, the States of Wyoming, Colorado and Utah, the Secretary of the Interior and the Administrator of the Western Area Power Administration entered into a cooperative agreement to recover four endangered fish species in the Upper Colorado River Basin while allowing for continued and future water development. The species are the Colorado pikeminnow, razorback sucker, humpback chub and bonytail chub.
Parties to the agreement agreed to participate in and implement a recovery program with the following five principal elements:
The program applies to the upper basin above Glen Canyon Dam, exclusive of the San Juan River Basin. Since adoption of the original agreement, a separate Recovery Implementation Program for the San Juan River Basin was instituted in 1992.
The intent of the Recovery Implementation Program (RIP) is to provide for the recovery and management of the identified species while continuing to allow for needed water development. It streamlines compliance with ESA requirements by making such compliance a function and responsibility of all the signatory parties. In Wyoming, the practical effect of the RIP is that it institutes a one-time charge for new depletions which is paid by the project proponent and is used, along with other funding sources, to implement the Program's projects. Originally established at ten dollars ($10) per acre-foot of new depletion, this charge is tied to consumer price indices, such that the fiscal year 2000 fee totals $14.36 per acre-foot.
Conservation Programs
Requests were made of the local USDA Natural Resources Conservation Service (NRCS) offices for a listing of lands currently enrolled in the various conservation programs under their direction. From these requests (not all counties responded) the current enrollments are provided.
Conservation Reserve Program
The Conservation Reserve Program (CRP) is administered by the USDA Farm Service Agency (FSA). This program offers rental payments, incentive payments, and cost-share assistance for certain conservation practices. This is a voluntary program for private land owners. The objective of the program is to improve wildlife habitat, water quality, and reduce wind and water erosion.
Wetlands Reserve Program
The Wetlands Reserve Program (WRP) is administered by the NRCS. This program offers technical and financial assistance for restoring wetlands. This is a voluntary program for private land owners. The objective of the program in the Green River Basin is to diversify the types of wetlands and wildlife habitat in an area. Responding counties indicate that there exist 44 acres of land currently enrolled in this program in the Green River Basin.
Wildlife Habitat Incentives Program
The Wildlife Habitat Incentives Program (WHIP) is administered by the NRCS. This program offers technical and financial assistance for projects which improve wildlife habitat. This is a voluntary program. Responding counties indicate there exist 240 acres of land currently enrolled in this program in the Green River Basin.
Among the various quantifiable uses, water consumed for environmental purposes in the Basin is estimated at about 2,000 acre-feet annually.
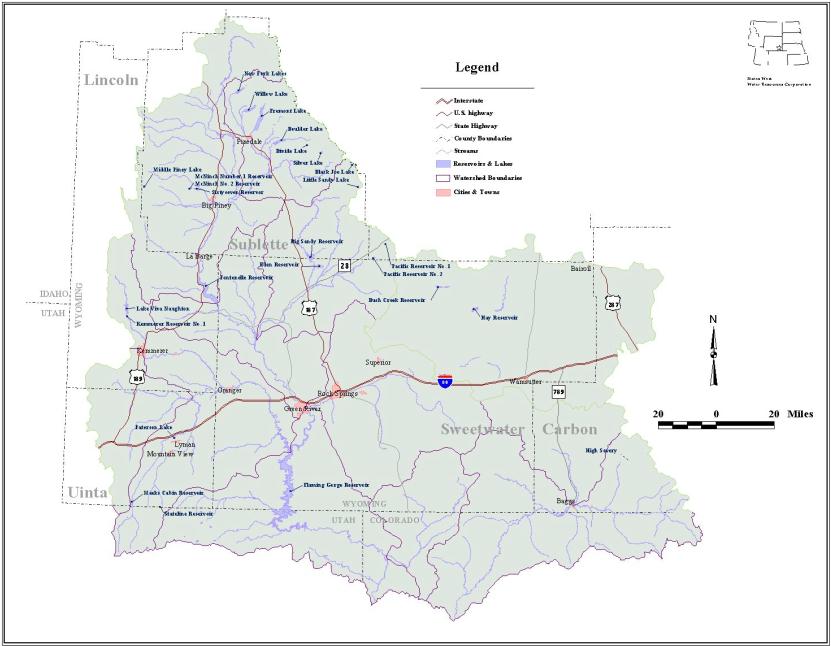
The Green River Basin contains many large reservoirs used for various purposes including storage for irrigation, municipal, industrial, recreation, fish propagation and flood control uses, among others. These reservoirs help sustain what is otherwise arid to semi-arid land. The reservoirs are owned by various state, federal, industrial and private interests. For purposes of this plan, reservoirs larger than 1,000 acre-feet are focused upon although some that are smaller are also discussed. Figure II-9 shows the locations of the major reservoirs in the Basin (not including all natural alpine or lowland lakes). The following lists reservoirs discussed in the Framework Water Plan (Wyoming Water Planning Program, 1970) and others that have been constructed, funded, or elevated in importance since.
Figure II-9 Major Reservoirs in the Greater Green River Basin
click to enlarge
| Reservoir Name | Water Course | Maximum Storage, AF |
| Big Sandy | Big Sandy River | 39,700 |
| Black Joe Lake | Black Joe Creek | 1,102 |
| Boulder Lake | Boulder Creek | 22,280 |
| Bush Creek | Bush Creek | 17,267 |
| Bush Lake | Bush Creek | 1,686 |
| Divide Lake | Divide Creek | 1,027 |
| Eden | Big & Little Sandy Rivers | 18,490* |
| Elkhorn | Little Sandy River | 1,450 |
| Flaming Gorge | Green River | 3,789,000 |
| Fontenelle | Green River | 345,397 |
| Fremont Lake | Pine Creek | 30,899 |
| Hay Reservoir | Red Creek | 8,327 |
| High Savery** | Savery Creek | 22,400 |
| Kemmerer No. 1 | Hams Fork | 1,058 |
| McNinch No. 1 | North Piney Creek | 1,086 |
| McNinch No. 2 | North Piney Creek | 198 |
| Meeks Cabin | Blacks Fork | 33,571 |
| Middle Piney | Middle Piney Creek | 4,201 |
| New Fork Lake | West Fork New Fork River | 20,340 |
| Patterson Lake | Blacks Fork | 1,237 |
| Pacific No. 1 | Pacific Creek | 107 |
| Pacific No. 2 | Pacific Creek | 1,394 |
| Silver Lake | Silver Creek | 933 |
| Sixty-Seven | North Piney Creek | 5,211 |
| Stateline | East Fork Smiths Fork | 14,000 |
| Viva Naughton | Hams Fork | 42,393 |
| Willow Lake | Lake Creek | 18,816 |
Evaporation
Evaporation from reservoirs constructed by man is a consumptive use associated with the beneficial use of water for other purposes and is counted as part of Wyoming's allocation under the Upper Colorado River Basin Compact. Traditionally, evaporation estimates are calculated by the Bureau of Reclamation and published in the "Consumptive Uses and Losses Report," (CULR) which is prepared every five years. In this report, the larger Bureau reservoirs in the Green and Colorado River Basins are classified as "main stem" reservoirs, the evaporation from which is tabulated separately from evaporation calculated for in-state reservoirs. Upper Colorado River Basin main stem reservoirs include Flaming Gorge, Blue Mesa, Morrow Point, Navajo, and Lake Powell.
For these main stem reservoirs, the aggregate evaporation counts against the various states' apportionments in the percentage allowed for each state by the Upper Colorado River Basin Compact, under full development (full use of allowed depletions). By this Compact Wyoming is allowed 14 percent of the total depletions allowed the States of the Upper Division (the Upper Basin States minus Arizona) by the Colorado River Compact; therefore at full development 14 percent of the Upper Basin mainstem evaporation is charged to Wyoming. Until then, Article V of the Upper Colorado River Basin Compact states that Wyoming's share will be calculated as the same fraction of main stem evaporation as Wyoming's consumptive use bears to the total consumptive use by states of the Upper Division.
For the years 1986-1990, Wyoming's fraction of the total consumptive use of the Upper Division states was 13.55 percent. In these same years, the average main stem evaporation was 653,000 acre-feet. Therefore, Wyoming's charge for main stem evaporation would be calculated as 88,500 acre-feet. This value, however, overstates the amount of Wyoming's main stem evaporation portion when the Basin sees full development. Under full development of all states' full Compact allotments, reservoir levels will average lower than they do now, due to increased drawdowns. Under this scenario the Bureau estimates a full development main stem evaporation of 520,000 acre-feet annually, from which Wyoming's 14 percent charge can be estimated to be 72,800 acre-feet annually.
Reservoirs not included in the main stem calculations are handled separately and the evaporation therefrom is charged totally to the state within which they reside. In Wyoming, the Bureau has identified 76 individual reservoirs in the Green River Basin for which evaporation is explicitly estimated. The net annual evaporation at each for the years 1986-1990, which is the last full five year period for which a final CULR is available, totals 26,500 acre-feet. The Bureau charges evaporation without regard to the uses for which a reservoir is permitted. That is, no separate accounting is kept for evaporation from irrigation, recreation, fish and wildlife or other pools. When evaporation losses for Muddy Creek wetlands and the future High Savery Reservoir are included, the total in-state evaporation estimate will total 27,700 acre-feet.
In the above numbers, Bureau evaporation values have been altered for New Fork, Boulder, Willow and Fremont Lakes. In the CULR supporting documentation for these lakes, all of which originally were natural lakes raised by dams added at their outlets, the evaporation calculated uses the full high water line areas in the computation. Because only that depletion caused by the actions of man should be counted against the Compact allocation, these estimates have been revised to reflect only the incremental evaporation loss due to the incremental surface area increase caused by raising the lakes. These changes result in a net reduction in evaporation loss of approximately 4,082 acre-feet, as described below:
| HWL = High Water Level | |||||||
| Reservoir | Natural HWL Surface Area, acres | Enlarged HWL Surface Area, acres | Differences, acres | Net Evaporation, from CULR, in. | Actual Evaporation due to Man, AF | CULR Evap, as reported, AF | Difference, AF (savings) |
| Boulder | 1540 | 1676 | 136 | 22.3 | 253 | 1872 | 1619 |
| Fremont | 4888 | 5122 | 234 | 20 | 390 | 0 | -390 |
| New Fork | 1296 | 1416 | 120 | 19 | 190 | 1345 | 1155 |
| Willow | 1800 | 1958 | 158 | 20 | 263 | 1961 | 1698 |
| Total | 1096 | 5178 | 4082 | ||||
Two sources of data exist for estimating evaporative losses from reservoirs in Wyoming. These include the NOAA Technical Report NWS 33 and "Development of An Evaporation Map for The State Of Wyoming for Purposes of Estimating Evaporation And Evapotranspiration" by Larry E. Lewis (University of Wyoming M.S. Thesis, 1978). Because it is newer, of national scope, and used by the Bureau of Reclamation in its Consumptive Uses and Losses Report calculations, the NWS document is used for annual gross (free water surface) evaporation values herein. However, the NWS document does not give a monthly distribution of evaporation rates. For this, the distribution pattern for Pathfinder Dam in Lewis is used.
The CULR also estimates that approximately 5,100 acre-feet of evaporation may be apportioned to stock pond and livestock use. With this, the sum total of estimated current evaporation losses in the Basin total 121,300 acre-feet.
The quality of water refers to its physical, chemical, radiological, biological and bacteriological properties. The concentration levels of various constituents within the water dictates the uses and potential uses of a water body. Quality of a water body can be impacted from the natural processes on the environment or from manmade actions. The success of a water development project is dependent upon the ability of the source to meet the water quality needs of the proposed use(s), as well as the propensity of the water development project to maintain the water quality.
Water Quality Standards
Surface Water
Pursuant to the Environmental Quality Act, the Water Quality Division (WQD) of the Wyoming Department of Environmental Quality developed and implemented surface water quality standards contained in Chapter 1, Wyoming Water Quality Rules and Regulations in 1974. Chapter 1 contains numerical and narrative standards to establish effluent limitations for those discharges requiring control via permits to discharge in the case of point sources and best management practices in the case of nonpoint sources.
Interstate Water Quality Standards
The Green River Basin and Little Snake River Basin are part of the Colorado River Basin. The Colorado River Basin Salinity Forum is an organization composed of water quality and water resource representatives of the states of Arizona, California, Colorado, Nevada, New Mexico, Utah and Wyoming with the responsibility for developing salinity standards and criteria for the waters of the Colorado River Basin. The basin-wide water quality standards for salinity consists of numeric water quality criteria at three lower Colorado River stations and a Plan of Implementation that describes the overall program. Under the federal Clean Water Act, the water quality standards for salinity are reviewed every three years and the Plan of Implementation is jointly revised and adjusted by the states and involved federal agencies.
Groundwater
In 1980, the WQD developed and implemented groundwater quality standards, contained in Chapter 8 of the Wyoming Water Quality Rules and Regulations, to protect existing and future groundwater uses. These regulations contain narrative and numerical standards used to classify ground waters of the State and provide criteria to determine acceptable concentration of discharges to ground water. These standards are also used to determine the degree of groundwater cleanup necessary to restore polluted ground water to pre-contamination use.
The WQD uses a two-tiered classification system. The first tier requires protection of existing uses regardless of water quality considerations. The second tier requires protection of all potential uses based on ambient groundwater quality. The highest standard of groundwater quality maintenance, given existing or potential uses, determines the governing tier. Maps showing groundwater classification are not available because the availability of well data and the diverse geology of the State prohibit accurate regional delineation of groundwater classification. Unlike surface water standards, groundwater classification is invoked only when a discharge to ground water has occurred or is proposed.
Basin Surface Water Quality
The Department of Environmental Quality has completed a stream classification for all surface water bodies in the project study area. The classification indicates whether a stream is currently supporting or has the potential to support the uses of that classification.
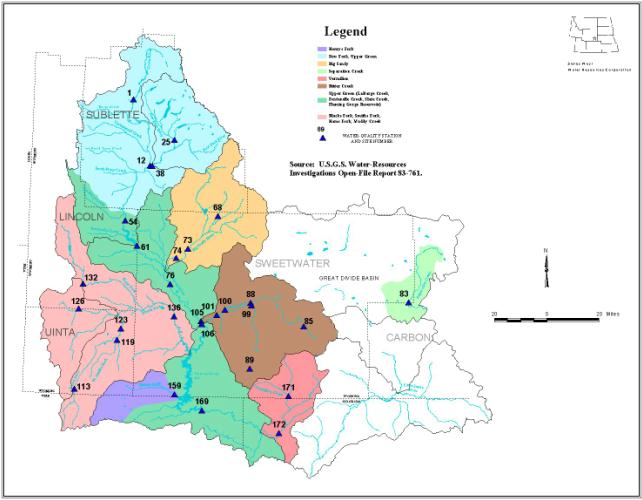
The streams in or near the mountains contain water quality rated as good. The water quality of these mountain streams deteriorates as it flows across the plains. The degradation of water quality is caused by both natural and manmade sources. The water quality of many streams originating in the plains is rated as fair to poor. The water quality of surface water bodies is obtained from U.S. Geological Survey reports of sampling accomplished from surface water stations. The systematic water quality sampling stations are shown in Figure II-10.
Figure II-10 Water Quality Sampling Stations
click to enlarge
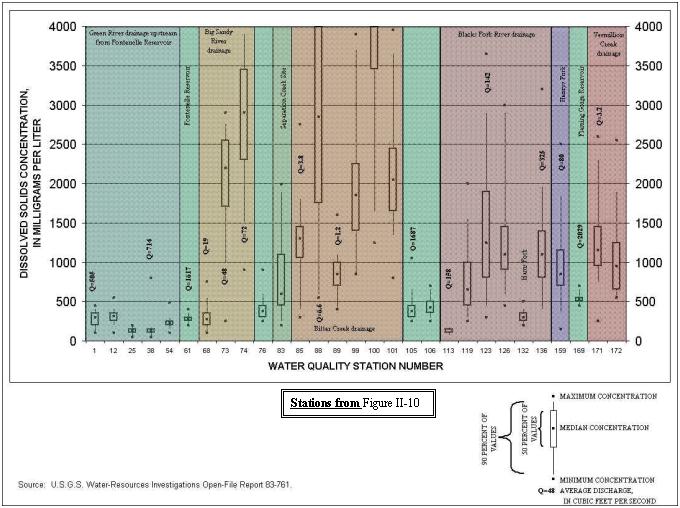
The total dissolved solids concentrations at surface water stations in the project area are shown in Figure II-11. All of the Green River Drainage above Fontenelle Reservoir and the Green River itself above Flaming Gorge Reservoir contain median dissolved solids concentrations of less than 500 mg/L. Flaming Gorge Reservoir has a median at or slightly above 500 mg/L. The Little Sandy River has a median less than 500 mg/L at the Sublette County line while monitoring stations downstream on the Big Sandy River show concentrations increasing up to about 3,000 mg/L before the confluence with the Green River. The Blacks Fork River Drainage and the Henrys Fork have median dissolved solids concentrations from 500 to 1,200 mg/L except for the Blacks Fork River near the Utah State line and the Hams Fork near Kemmerer which has medians below 500 mg/L. The Bitter Creek drainage has median dissolved solids concentrations ranging from approximately 750 to 2,900 mg/L with the exception of Killpecker Creek which has a median above 4,000mg/L. The Vermilion Creek Drainage has a median of approximately 1,000 mg/L.
Figure II-11 Dissolved Solids Concentrations
click to enlarge
All water bodies in the drainage system are within the acceptable water quality pH range of 6.5 to 9.0. However, pH readings for the Green River Basin indicate the water as being slightly alkaline. The temperature of water in the Green River Basin varies from 0 degrees Celsius in the winter to 25 degree Celsius in the summer.
The concentrations of total phosphorous in some streams frequently exceed the limits recommended to protect reservoirs and streams from nuisance growth of algae and other aquatic plants. Many of the reservoirs and lakes experience phytoplankton blooms in late summer and early fall.
The Department of Environmental Quality has recently increased surface water monitoring to address 1999 amendments to the Environmental Quality Act under W.S. 35-11-103 (c) & 302 (b) directed at "credible data." Part of this monitoring program will be directed at monitoring invertebrate communities in the Green River Basin. The invertebrate population surveys by USGS show water quality in the plains is not as good as water quality in mountain streams although overall basin invertebrate populations indicate good water quality. Invertebrates are important as a source of fish food for the high-quality fisheries in the Green River Basin.
Total Maximum Daily Loads/303 (D) List
All water bodies within the Green River Basin meet the existing classification uses with the exception of those water bodies contained in the 1998 303(d) list. Section 303(d) of the Clean Water Act (CWA) requires the State of Wyoming to identify water bodies that do not meet designated uses and are not expected to meet water quality standards after application of technology-based controls. It also requires the State to identify a priority ranking for each water quality limited segment and develop total maximum daily loads (TMDL) to restore each water body segment to pre-designated uses. The U.S. Environmental Protection Agency (EPA) requires each state to submit their lists of impaired or threatened water bodies every two years and is required to accomplish the work if a state fails to perform the required activities.
A simple explanation of TMDL is the ability of a water body to assimilate pollution and continue to meet its designated uses. A TMDL must be established for each pollutant which is a source of stream impairment. The TMDL process provides a way to document how water quality standards are being implemented. The process also provides the framework for thorough watershed planning for multiple sources or causes of impairment, provides states an opportunity to identify priorities based on risk and target TMDLs for completion, and promotes cost-effective solutions to pollution.
Salinity Control Projects in the Green River Basin
Water in the Colorado River and its tributaries has experienced an increase in levels of dissolved solids (or salts, hence the term salinity) almost since man's first use. The Basin largely lays on sediments derived from prehistoric seas, so that the soils naturally contain salts derived from that environment. Naturally occurring salinity comes from erosion of saline soils, saline springs and normal runoff.
The EPA promulgated a regulation in December 1974 which set forth a basinwide salinity control policy for the Colorado River Basin. The regulation specifically stated that salinity control was to be implemented while the Basin states continue to develop their Compact-apportioned water. This regulation also established a standards procedure, and required the Colorado River Basin states to adopt and submit for approval to the EPA water quality standards for salinity, including numeric criteria and a plan of implementation, consistent with the policy stated in the regulation.
The Basin states established the Colorado River Basin Salinity Control Forum in 1973. The Forum is composed of representatives from each of the seven Basin states appointed by the governors of the respective states. The Forum was created for interstate cooperation and to provide the states with the information necessary to comply with Section 303(a) and (b) of the Clean Water Act. The Salinity Control Act (Public Law 93-320), as amended by Public Laws 98-569, 104-20 and 104-127, authorizes the Secretaries of the U.S. Departments of Interior and Agriculture to enhance and protect the quality of water available in the Colorado River for use in the United States and the Republic of Mexico. Title II of the Act authorizes specific salinity control units and under this title was born the Colorado River Basin Salinity Control Program (CRBSCP) and the various components and successors thereof.
All salinity control projects have as their ultimate goal the maintenance of water quality so that numeric criteria (referred to as the 1972 levels) are not exceeded in the lower basin. These criteria are 723 mg/l below Hoover Dam, 747 mg/l below Parker Dam, and 879 mg/l at Imperial Dam. Title I of the Act authorizes construction of features to enable the United States to deliver water to Mexico having an average salinity no greater than 115 ppm (parts per million or mg/l) +/- 30 ppm over the annual average salinity of water at Imperial Dam. The Bureau of Reclamation, the U.S. Department of Agriculture and the Bureau of Land Management are undertaking ongoing salinity control programs.
The 1999 Review, Water Quality Standards for Salinity, Colorado River System outlines policies that affect existing and future development of water resources in Wyoming's Green River Basin.
Big Sandy Unit
In Wyoming, the only existing component of the Department of Agriculture's CRBSCP is the Big Sandy Unit. This unit, headquartered out of Farson, is reducing salinity derived from irrigation in the Farson and Eden areas. The USDA Big Sandy River Unit Plan was published in 1988 and implementation of the program at this unit began in 1989. The total salt load reduction for the Big Sandy Project, as outlined in the 1986 EIS and Definite Plan Report, is 52,900 tons of salt per year. Annual progress reports are prepared by the Farson Field Office of the USDA Natural Resources Conservation Service. A map of the Big Sandy Unit project area is given as Figure II-12. Currently there are 18,370 acres in the project with water rights.
Figure II-12 Big Sandy Unit, Colorado River Salinity Control Program
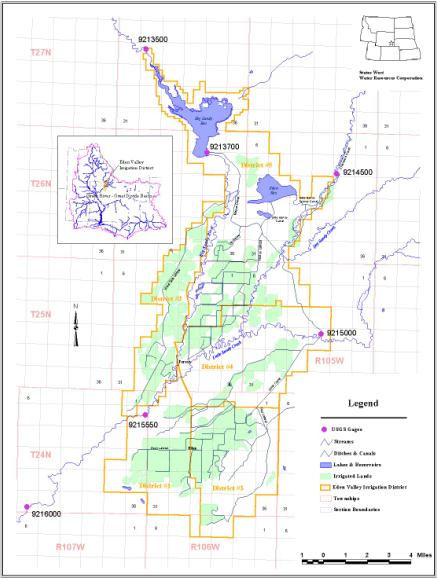
click to enlarge
Briefly, salinity increases at the Big Sandy Unit are due to the deep percolation of irrigation water historically applied via flood irrigation. The Eden Valley Irrigation and Drainage District provides irrigation water to members from the Big Sandy and Eden Reservoirs. Excess flood irrigation results in excess soil moisture, movement of water vertically downward to a shale layer, and horizontal movement of water downgradient to various discharge points. Seepage points are evident near the confluence of Bone Draw and the Big Sandy River some 8.5 miles southwest of Farson. The mechanism for reducing salt loading at this project therefore is to reduce deep percolation by the application of more efficient on-farm water application techniques.
Improvements in irrigation practices on the unit include primarily the replacement of traditional uncontrolled flood irrigation methods with other practices that reduce deep percolation. Such practices include the installation of center pivot sprinkler systems, replacement of open conveyance ditches with gated pipe, and application of surge valves which alter the infiltration rate. Participation in all aspects of salinity control is voluntary on the part of private irrigators. Those who participate receive a cost share from the program such that their contribution is typically limited to approximately 30 percent of the cost of construction of the improvements.
As of February 2000, the following data describe implementation of salinity control measures at the Big Sandy Unit:
| Project Goals and Achievements | ||
| Goal | Achieved To Date | |
| Total Land in Contracts or Treated (acres) | 15,700 | 10,293 (in contracts) 8,680 (treated) |
| Percent of Producers Benefiting (130 total producers in District) | 85% (110) | 58% (76) |
| Salt Reduction (tons/year) | 52,900 | 32,534 |
West Green River Basin Watershed and Salinity Study Area
The NRCS is in the planning stages for a potential salinity reduction project for the "West Green River Basin Watershed and Salinity Study Area." This project will evaluate salinity reduction measures along the Hams Fork, Blacks Fork, Smith Fork and Henrys Fork drainages in southwest Wyoming and northeast Utah.
Originally applied for in 1990, this project has been recognized as having high potential for salinity reductions through the use of on-farm irrigation improvements. The project also has local support, evidenced at public meetings held at the time of the original application and reiterated at meetings held in the summer of 1999. The project has not been initiated to date due to changes in funding mechanisms over time and to the presence of other salinity control projects of higher priority. A monograph describing the history of this project has been prepared by the Wyoming State Engineer's Office.
Renewed need for an additional salinity control unit, in part due to the maturation of the Big Sandy Unit, resulted in the Colorado River Basin Salinity Control Forum recommending to the USDA in 1999 that it initiate planning for the West Green River project. Public meetings were held and considerable interest in the project was still in evidence. The NRCS has initiated a study which may lead to the preparation of a planning report and preparation of NEPA compliance documents. The completion of the Green River Basin Water Planning Study will provide data and information necessary for initiating this proposed salinity control project.
Table II-7 lists a summary of the existing water uses (depletions) in the Basin, along with a comparison to the current estimate of water consumption allocated under Compacts.
Table II-7 Summary of Current Water Uses
| Normal | Wet | Dry | |
| (AF/Year) | |||
| Municipal Use (includes City of Cheyenne at 14,400 AF/Yr.) |
20,900 | 20,900 | 20,900 |
| Industrial Use | 66,500 | 66,500 | 66,500 |
| Agricultural Use | 401,000 | 432,300 | 375,400 |
| Evaporation - Main Stem | 88,500 | 88,500 | 88,500 |
| Evaporation - In State | 32,800 | 32,800 | 32,800 |
| Recreation Use | Non-consumptive | ||
| Environmental Use | 2,000 +/- | 2,000 +/- | 2,000 +/- |
| TOTAL | 611,700 | 643,000 | 586,100 |
| Compact Allocation | 833,000 | 833,000 | 833,000 |
| Remaining Unused Compact Water | 221,300 | 190,000 | 246,900 |